 Lamia Al Saikhan1*
 Muath Alobaida2,3
 Anish Bhuva2
 Nish Chaturvedi2John Heasman4
 Alun D. Hughes2
 Siana Jones2Sophie Eastwood2
 Charlotte Manisty2Katherine March2Arjun K. Ghosh2,5,6Jamil Mayet4Ayodipupo Oguntade2
 Therese Tillin2Suzanne Williams2Andrew Wright4
 Chloe Park2
- 1Department of Cardiac Technology, College of Applied Medical Sciences, Imam Abdulrahman Bin Faisal University, Dammam, Saudi Arabia
- 2MRC Unit for Lifelong Health and Ageing, Department of Population Science & Experimental Medicine, UCL Institute of Cardiovascular Science, University College London, London, United Kingdom
- 3Department of Basic Science, Prince Sultan Bin Abdulaziz College for Emergency Medical Services, King Saud University, Riyadh, Saudi Arabia
- 4National Heart & Lung Institute, Imperial College London and Imperial College Healthcare NHS Trust, Hammersmith Hospital, London, United Kingdom
- 5Cardio-Oncology Service, Department of Cardiology, Barts Heart Centre, Barts Health NHS Trust, St Bartholomew's Hospital, London, United Kingdom
- 6Cardio-Oncology Service, Department of Cardiology, University College London Hospital, London, United Kingdom
Background: People of South Asian and African Caribbean ethnicities living in UK have a high risk of cardiometabolic disease. Limited data exist regarding detailed cardiometabolic phenotyping in this population. Methods enabling this are widely available, but the practical aspects of undertaking such studies in large and diverse samples are seldom reported.
Methods: The Southall and Brent Revisited (SABRE) study is the UK's largest tri-ethnic longitudinal cohort. Over 1,400 surviving participants (58–85 years) attended the 2nd study visit (2008–2011); during which, comprehensive cardiovascular phenotyping, including 3D-echocardiography [3D-speckle-tracking (3D-STE)], computed tomography, coronary artery calcium scoring, pulse wave velocity, central blood pressure, carotid artery ultrasound, and retinal imaging, were performed. We describe the methods used with the aim of providing a guide to their feasibility and reproducibility in a large tri-ethnic population-based study of older people.
Results: Conventional echocardiography and all vascular measurements showed high feasibility (>90% analyzable of clinic attendees), but 3D-echocardiography (3DE) and 3D-STE were less feasible (71% 3DE acquisition feasibility and 38% 3D-STE feasibility of clinic attendees). 3D-STE feasibility differed by ethnicity, being lowest in South Asian participants and highest in African Caribbean participants (p < 0.0001). Similar trends were observed in men (P < 0.0001) and women (P = 0.005); however, in South Asians, there were more women with unreadable 3D-images compared to men (67 vs. 58%). Intra- and inter-observer variabilities were excellent for most of conventional and advanced echocardiographic measures. The test-retest reproducibility was good-excellent and fair-good for conventional and advanced echocardiographic measures, respectively, but lower than when re-reading the same images. All vascular measures demonstrated excellent or fair-good reproducibility.
Conclusions: We describe the feasibility and reproducibility of detailed cardiovascular phenotyping in an ethnically diverse population. The data collected will lead to a better understanding of why people of South Asian and African Caribbean ancestry are at elevated risk of cardiometabolic diseases.
Introduction
People of South Asian and African Caribbean descent are known to experience an increased burden of diabetes and cardiovascular disease (CVD) compared with people of European ancestry; although why remains unclear (1). The Southall and Brent Revisited (SABRE) study was designed to address this question by establishing the relationships between risk factors, subclinical disease, and adverse clinical outcomes and mortality in a longitudinal cohort (2).
Methods enabling detailed cardiometabolic phenotyping are widely available, but the practicalities undertaking phenotyping in large and diverse study populations are seldom reported (3). We describe the clinical cardiovascular imaging acquisition and analysis methods performed on over 1,400 participants in SABRE aged between 58 and 85 years in the second wave of follow-up with the aim of providing information on the feasibility and reproducibility of detailed measures of cardiovascular structure and function in a community-based study of older people.
Methods
SABRE Cohort
The design of SABRE has been described in detail previously (2). Briefly, all traceable surviving participants from the baseline studies conducted in 1988 to 1991 were invited to attend the second wave of follow-up at St Mary's Hospital, London. Of 3,410 survivors, 1,438 (42%) participants attended the clinic between 2008 and 2011 (69.6 ± 6 years). Participants attended for clinical investigations as listed in Supplementary Table 1. They also completed a health and lifestyle questionnaire and were asked for consent to primary care medical record review. All participants gave written informed consent and the study was approved by the local research ethics committee.
Echocardiographic Measurements
The SABRE study employed standard and advanced echo techniques that characterized (1) left ventricular (LV) structure and geometry, (2) LV systolic function, (3) LV dyssynchrony, (4) LV diastolic function, and (5) left atrial (LA) structure. The incremental value of LV mechanics by 3D-speckle-tracking echocardiography (3D-STE) in predicting adverse outcomes is of particular interest, considering that SABRE is the first multi-ethnic longitudinal study to capture 3D-STE measures.
Data Acquisition Protocol
All participants underwent a transthoracic echocardiographic examination using a Philips iE33 equipped with an S5-1 phased array ultrasound transducer for 2D and Doppler imaging and a matrix array (X3-1) transducer for 3D data acquisition. A brief outline of the SABRE echocardiography imaging protocol is listed in Table 1. The examination was performed by two experienced sonographers in accordance with the ASE guidelines (4). Echocardiographic measures were obtained from the parasternal long-axis (PLAX); parasternal short-axis; and apical four-, two-, and five-chamber views. Optimal images were attained prior to recording and harmonic imaging was used. An adequate quality of ECG signal was ensured throughout the examination. For 2D-images and spectral-Doppler imaging, 3–5 and 10 cardiac cycles were recorded, respectively.
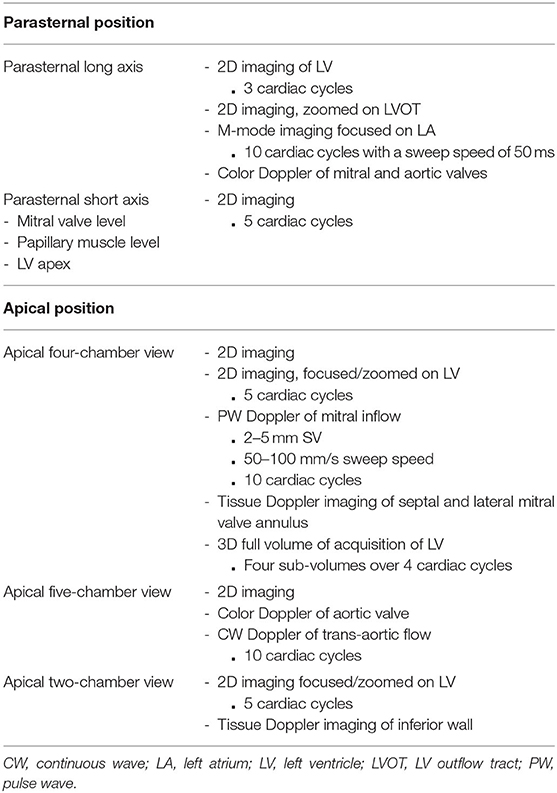
Table 1. SABRE echocardiographic imaging protocol.
Depth, sector width, and gain setting were included in 2D image optimization. Harmonic imaging was used to ensure clear visualization of endocardial borders for quantitative analysis including volumes and 2D-STE analysis. Parallel ultrasound beam orientation to the blood flow of interest was ensured for all Doppler acquisitions with a sample volume size 2–5 mm for PW Doppler and a sweep speed between 50 and 100 mm/s.
For 3D-imaging, a LV full-volume dataset was obtained from the apical position. Depth and sector width setting and gain were adjusted as needed (5). Four sub-volumes acquired over four cardiac cycles during held respiration were obtained in the wide-angled (93° × 80°) acquisition mode. The presence of an acceptable ECG signal was checked before accepting the loop. Scans were stored on a secure fileserver in DICOM or native format.
Data Analysis
All conventional echocardiographic analyses were performed on the ultrasound machine during the clinic visit using Philips QLAB software 7.0, averaging three measurements. A 2D-STE analysis was performed offline using Philips QLAB software 8.1 Tissue Motion Quantification Advanced (TMQA). A 3D-echocardiography (3DE) analysis was performed using Philips QLAB software 7.0 with 3DQ (Cardiac 3D Quantification) for LV mass and 3DQ Advanced for LV volumes. A 3D-STE LV myocardial deformation analysis was performed using TomTec 4D LV-Analysis (TomTec Imaging Systems, Munich, Germany). These were done shortly following the completion of the study except for 3D-STE, which was performed more recently.
Measured echocardiographic parameters are listed in Table 2. LV and LA dimensions, outflow tract diameter, and LV wall thickness from 2D-guided M-mode were measured from the PLAX from which LV mass was calculated, following the ASE recommendations (6). LV hypertrophy (LVH) based on conventional echocardiography-derived LV mass was defined as LV mass indexed to body surface area (BSA) (7) >115 g/m2 in men and 95 g/m2 in women (6). Relative wall thickness (RWT) was calculated (6). LV geometry was categorized as follows: normal if RWT ≤ 0.42 and no LVH; LV remodeling if RWT > 0.42 and no LVH; LV concentric hypertrophy if RWT > 0.42 and LVH; and LV eccentric hypertrophy if RWT ≤ 0.42 and LVH (6). LV volumes from conventional echocardiography were calculated by the Teichholz formula using the linear dimensions from which LV ejection fraction (LVEF) was derived to maintain the compatibility with previous sweeps and permit comparisons with other cohort studies while recognizing it is not the best method (6). Midwall fractional shortening was also calculated (8, 9). Tissue Doppler analysis of lateral and septal mitral annulus motion was performed, and peak longitudinal systolic velocity (s′) and peak early and late mitral annular relaxation velocities (e′ and a′) were calculated. Mitral inflow early(E wave) and late (A wave) diastolic velocities were measured by PW Doppler with a sample volume placed at the tip of mitral valve leaflets (10). E/e′ was calculated as an index of LV filling pressure (10).
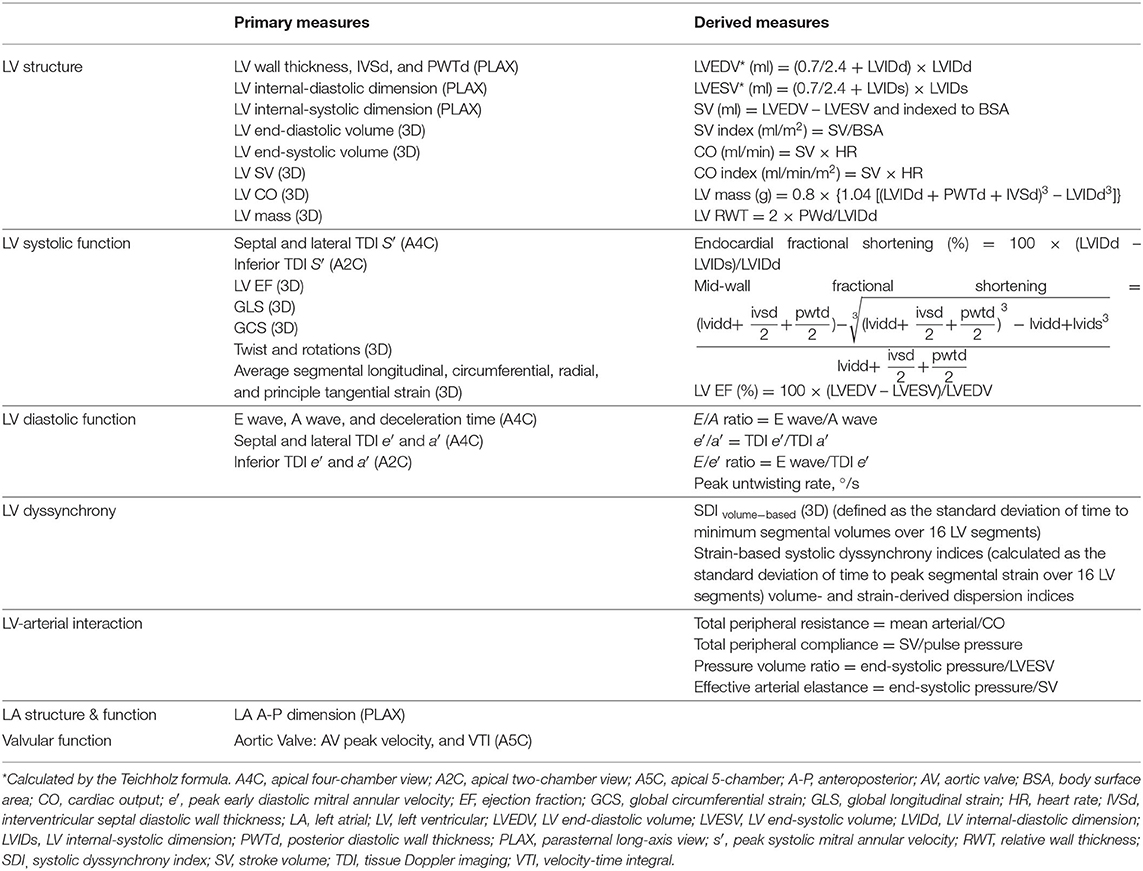
Table 2. SABRE echocardiographic measures.
3DE LV mass and volumetric analyses were performed offline in accordance with a pre-developed protocol. Only 3D datasets of the highest quality free of stitching artifacts were used. All views were optimized to ensure that the LV was not foreshortened. For LV mass, the endocardial and epicardial boundaries of the apical four- and two-chamber views were traced at end-diastole (ED), the first frame after mitral valve closure, and end-systole (ES), the first frame after aortic valve closure. Cardiac 3DQ calculated LV mass using the biplane method of discs. LVH based on 3DE-derived LV mass was determined using the 95th upper percentiles of indexed LV mass reported by the Multi-Ethnic Study of Atherosclerosis study (11). Cardiac 3DQ Advanced was used to measure 3D LV volumes without the geometrical assumptions of 2D methods. Five reference points were selected on the LV in two orthogonal views in each ED and ES frames. The software then automatically tracked the endocardium from frame to frame throughout the cardiac cycle to calculate the volumes and LVEF and constructed a 3D shell of the LV and global and regional volumetric waveforms. Manual adjustments were performed when needed.
LV advanced myocardial mechanics were assessed according to a pre-specified protocol. Acceptable image quality was defined as follows:
• Good(score-1)=clear visualization of endocardium in all 16 segments
• Fair(score-2)=unclear visualization of endocardium in ≤2 segments or presence of minor artefacts e.g. apical noise.
• Adequate(score-3)=unclear visualization of endocardium in ≤6 segments.
• Poor(score-4)=unclear visualization of endocardium in >6 segments, but reliable tracking throughout the cardiac-cycle using the adjacent segments as a reference.
Unacceptable image quality was defined as follows:
1. Major stitching artifacts preventing reliable tracking of the endocardium.
2. Unacceptable visualization of the endocardial boundaries.
3. Multiple segments (≥4 = ≥25%) of the LV wall being outside of the image sector.
The identity of non-visible segments were recorded in a spreadsheet during analysis as some regions are known to be less feasible, such as the apex and anterior and anterolateral segments (12). A 16-segment model was used and LV segments were scored as 0 if non-visible and 1 if visible (6).
LV endocardial borders at ED were automatically tracked and manual adjustments were performed when needed (12, 13). LV volumes, including LVEF and systolic dyssynchrony index (SDI), global longitudinal strain (GLS), and global circumferential strain (GCS); average peak segmental longitudinal, circumferential, radial, and principle tangential strains; and twist and rotational indices were calculated by the software. Additional measures were derived: (1) strain-based systolic dyssynchrony indices, calculated as the standard deviation of time to peak segmental strain over 16 LV segments normalized to cardiac cycle length, and (2) volume- and strain-derived dispersion indices (Di), defined as difference between the minimum and maximum time to peak of a measure over 16 LV segments normalized to cardiac cycle length (14).
Vascular Measurements
Pulse Wave Velocity
Pulse wave velocity (PWV) is a gold-standard measure of arterial stiffness (15). The assessment of PWV relies on the determination of pulse transit time (TT), defined as the time the pulse wave takes to travel from one point to another over an arterial segment of length (L).
The distance from the sternal notch to the common femoral artery (mm) at the inguinal ligament was measured using a measuring tape while the participants lay in a supine position.
A PT2000 (Micro Medical Ltd, Kent) was used to acquire 10 sequential blood velocity waveforms at the carotid and femoral arteries using a 4-MhZ CW directional Doppler probe with a zero crossing detector and the ECG R wave as a time reference. At least two windows of good quality flow traces were recorded.
Central Blood Pressure and Pulse Wave Analysis
Aortic (central) blood pressure (BP) differs from brachial (peripheral) BP and may be a superior predictor of cardiovascular events (16). Radial artery applanation tonometry was assessed using the SphygmoCor device (ATCOR, Sydney, Australia) to record at least six cardiac cycles of central BP waveforms, estimated after calibrating the device to resting brachial systolic and diastolic BP (17).
Coronary Artery Calcification
Computed tomography (CT) coronary artery calcium scores (CACS) were measured in those without stents using a Philips Mx8000 IDT 64 detector scanner (2.5-mm slice thickness and 25-mm increments). Images were transferred to a workstation for offline analysis (HeartBeat CS) by an experienced radiographer blinded to participant identity. Areas of calcification were assigned to the four main territories of the coronary arteries: left main, left anterior descending, circumflex, and right coronary artery.
Common Carotid Intimal Medial Thickness
Vascular ultrasound of the left carotid artery was performed using Philips iE33 equipped with a linear array transducer (L11-3). Defult settings (FR = 50, depth = 2.5 cm, gain = 62 dB, C = 51 dB, and P = low and pen) were used, but adjustments were allowed to optimize image quality. A cine loop of at least five cycles at three angles (lateral, posterior, and anterior) as well as one still image captured at the R wave for each angle were acquired. Data were analyzed offline using the AMS-II (v1.1364) (18). The region of interest was defined as 1 cm proximal to the carotid bulb with the analyzed image chosen to ensure optimal quality of the far wall. Modifications of the detected borders or length were performed when necessary. Carotid plaque was defined as the presence of focal wall thickening at least 50% greater than that of the surrounding vessel wall or as a focal region with carotid intimal medial thickness (cIMT) <1.5 mm protruding into the lumen distinct from the adjacent boundary (19). Plaque characteristics including area, gray-scale median, and percentage white were measured using the AMS-II software.
Retinal Imaging
Fundus imaging of both eyes was performed in people without glaucoma or any condition that prevented adequate retinal imaging using a Zeiss FF450+ fundus camera and an Oscar 510C-CCD after the administration of eye drops (1% tropicamide and 2.5% phenylephrine). Refraction was measured using a Nidek AR-310 auto-refractometer. Retinopathy was defined according to the NHS Diabetic Eye Screening Programme, and quantitative measures of the retinal microvasculature were performed as described (20). Feasibility and reproducibility have been reported previously (20).
Quality Control and Reproducibility Analyses
All clinic staff underwent training and accreditation, and data quality was monitored regularly throughout the study. To quantify the repeatability and reproducibility of echo measurements, two sonographers independently analyzed the same echocardiograms in subsets of randomly selected participants (n = 10 for conventional echocardiographic measures and n = 20 for 3DE measures) with an interval of at least 2 weeks to avoid recall bias and blinded to the first observer measurements. Test-retest reproducibility of conventional and 3D-STE analysis was performed in selected participants who agreed to re-attend the clinic 4–8 weeks after the first visit (adequate images for analysis were available in n = 36 for conventional echocardiographic measures and n = 10 for 3DE measures). The repeatability and reproducibility of vascular measurements was performed following the same approach in at least 10 randomly selected subjects.
Statistical Analysis
Repeated measurements were assessed by intraclass correlation coefficient (ICC) calculated by linear mixed modeling. Reliability was classified as follows: ICC < 0.4 = poor, 0.4 ≥ ICC < 0.75 = fair to good, and ICC ≥ 0.75 = excellent (21). Agreement was measured by Bland–Altman (BA) analysis and reported as the mean difference with 95% limits of agreement. All BA graphs of the intra-observer (repeatability) and inter-observer (reproducibility) reliability of the echocardiographic and vascular measures are shown in the online Supplementary Material. All analyses were performed in Stata 15.1 (StataCorp LLC, United States).
Results
Feasibility
Brief characteristics of the population are summarized in Table 3.
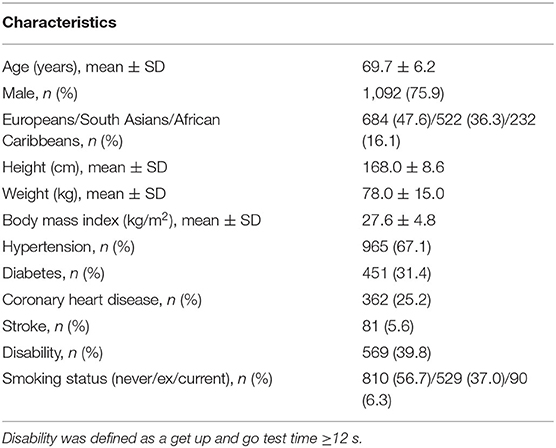
Table 3. Characteristics of SABRE participants (n = 1,438; visit 2).
Echocardiography
In up to 95% of clinic attendees, 2D, spectral- and tissue-Doppler echocardiography was analyzable (Table 4, Figure 1A). In participants with atrial fibrillation or poor image quality, 3DE was not acquired, and there was a small subset of participants who had attended the clinic before the 3D probe became available; these were excluded from the denominator when feasibility was estimated. 3DE was acquired in 71% of all clinic attendees and, using QLAB, 924 (92%) had successful volumetric analysis and 897 (89.6%) had LV mass calculated. The difference in these numbers reflects difficulties in tracking the epicardium compared to the endocardium. Fifty three percent of those who had 3DE datasets had 3D deformation measurements by TomTec. Reasons for non-analysis were unacceptable images for strain analysis (n = 253, 53.6%), out-of-sector images (n = 4, 0.85%), stitching artifacts (n = 57, 12.1%), low frame rate (n = 6, 1.3%), poor ECG signal (n = 3, 0.64%), missing (n = 3, 0.64%), or composite (n = 146, 30.9%). The feasibility of 3D-STE was 38% of all clinic attendees.
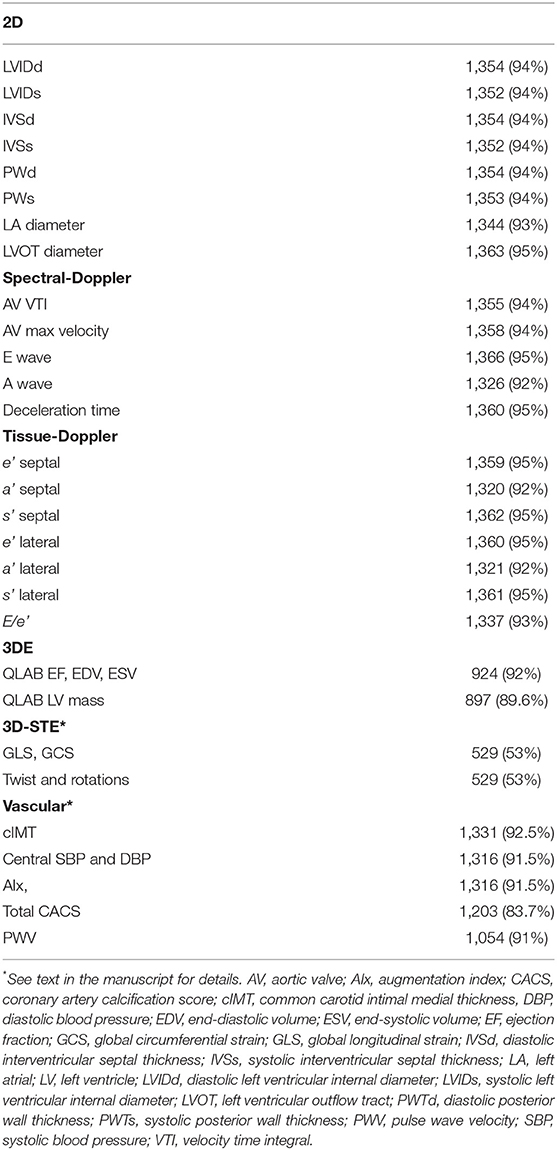
Table 4. Feasibility of the cardiovascular measures in 1,438 SABRE participants.
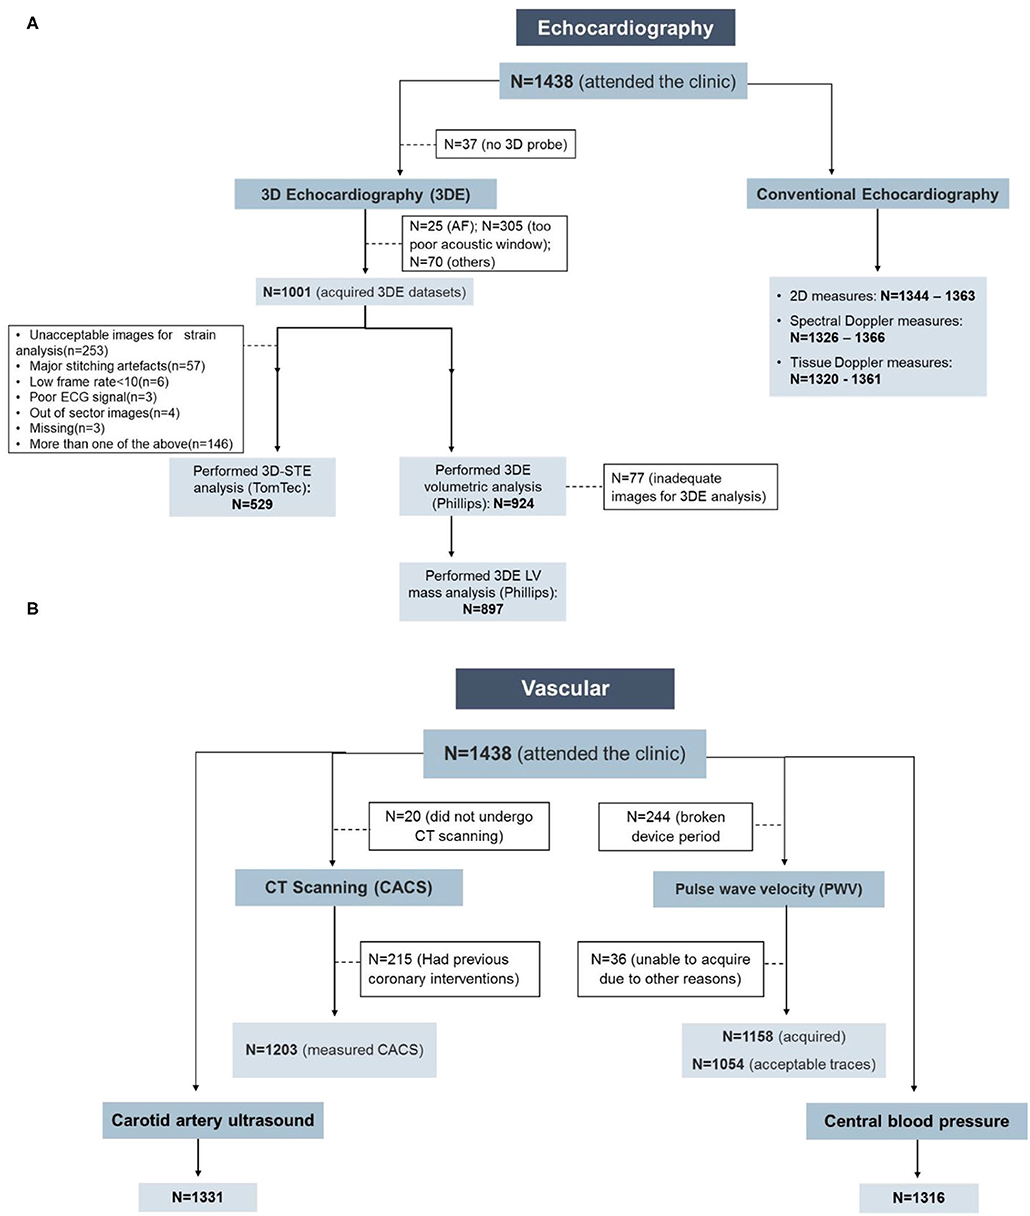
Figure 1. Feasibility of the cardiovascular measurements in the Southall and Brent Revisited (SABRE) study. (A) Echocardiography and (B) vascular measurements. AF, atrial fibrillation; CACS, coronary artery calcium score; CT, computed tomography.
The quality of the 3D datasets was scored as good, fair, adequate, poor, and unacceptable in 1.9, 23.5, 23.9, 3.6, and 47.2% of participants, respectively. When stratified by ethnicity (Europeans, South Asians, and African Caribbean), 59% (n = 216) of South Asian participants had unacceptable 3D images with fewer participants having good (1%, n = 3) and fair (15%, n = 54) quality 3D images. In contrast, only 35% (n = 57) African Caribbean participants had unacceptable 3D images with more participants having good (3%, n = 5) and fair (36%, n = 59) quality 3D images (P < 0.0001, n = 1,002, Figure 2). Broadly similar trends were observed in men (P < 0.0001, n = 768) and women (P = 0.005, n = 233); however, in South Asians, there were more women with unreadable 3D images compared to men (67 vs. 58%, Figure 2).
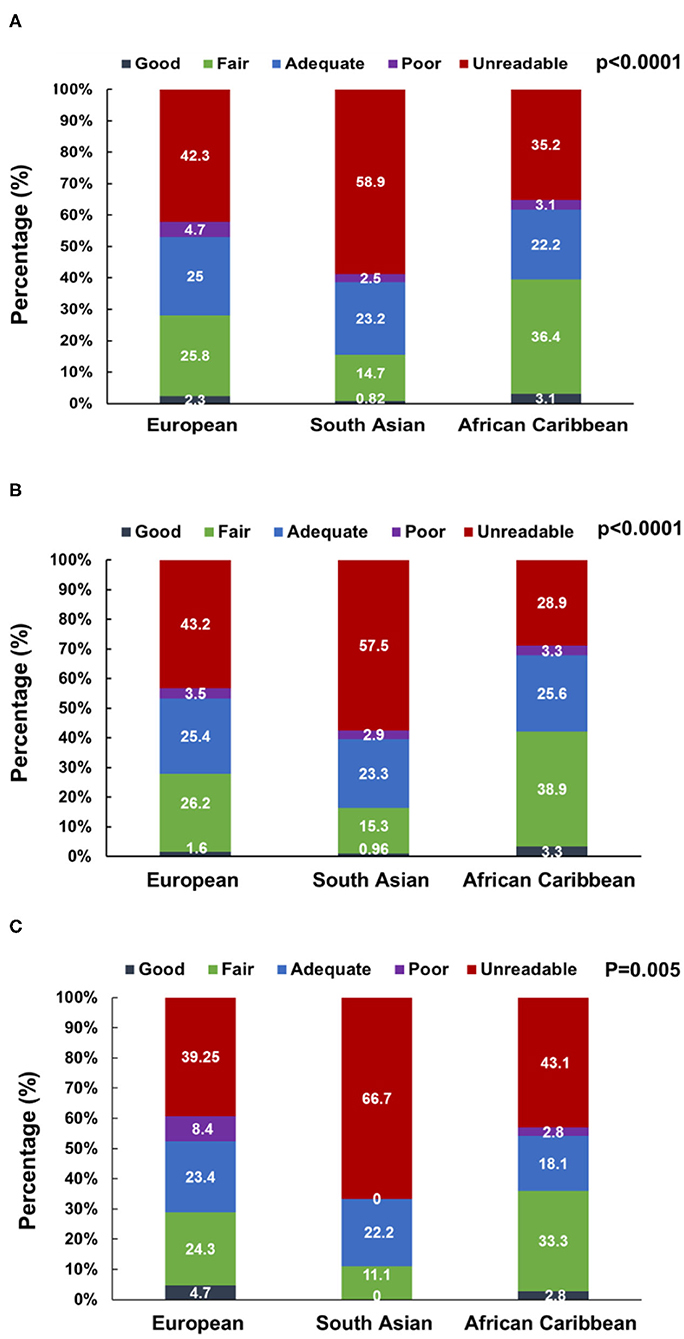
Figure 2. 3D dataset image quality score stratified by ethnicity in the overall SABRE population [N = 1,001, (A)] and among men [N = 768, (B)] and women [N = 233, (C)] participants. Numbers are percentages.
Vascular Measurements
Central BP, cIMT, and CACS showed high feasibility with good quality measurements achievable in 92, 93, and 84% of clinic attendees, respectively (Figure 1B; Table 4). PWV was not collected in 244 participants due to device failure, and excluding this reason for missing data gave a feasibility of 97%. CACS was measurable in all participants who underwent CT scanning; 15% were ineligible due to stent placement, and 1% of eligible individuals did not undergo CT scanning either due to refusal or unavailability of the scanner.
Repeatability and Reproducibility
Echocardiography
Intra-observer (repeatability) and inter-observer (reproducibility) reliability of conventional echocardiographic measures was good or excellent for both read-reread and test-retest studies (Table 5).
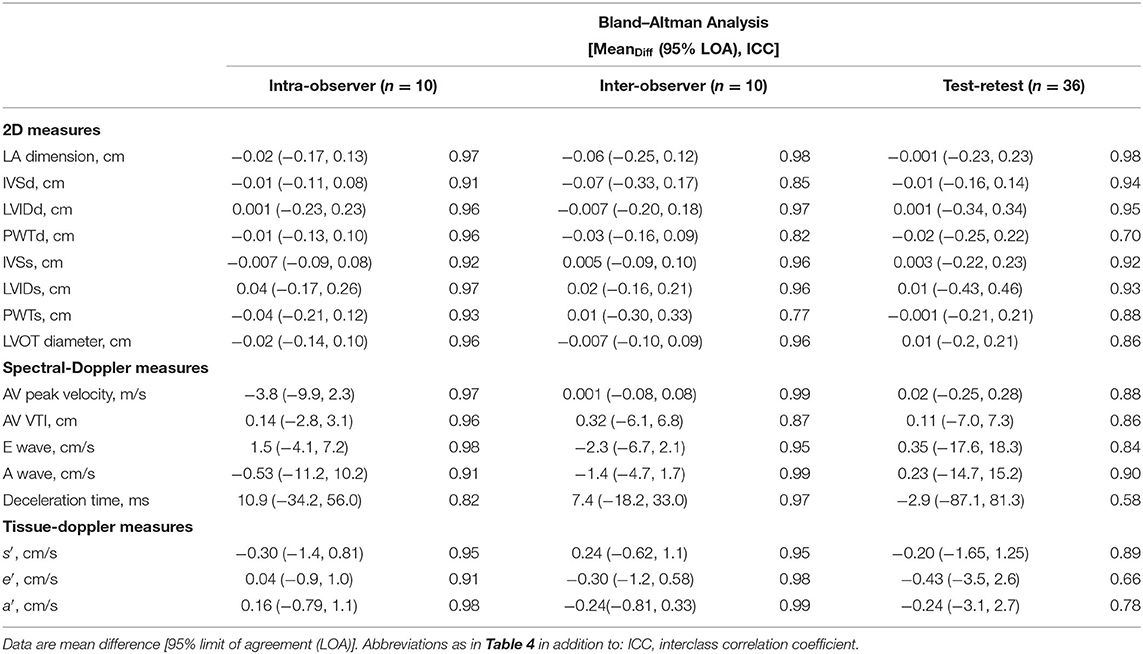
Table 5. Reproducibility of conventional echocardiographic measures.
The 3D volumetric analysis using QLAB software showed excellent reliability for all measures. Mean difference [95% limit of agreement (LOA)] and ICC of the inter-observer difference were −0.06 (−5.5, 5.4) and 0.82 ICC for LVEF (%); −0.1 (−8.2, 8.0) and 0.96 ICC for end-diastolic volume (ml); 0.0 (−4.6, 4.6) and 0.96 ICC for end-systolic volume (ml); and 1.3 (−7.5, 10.2) and 0.98 ICC for LV mass (g). The intra-observer difference for LV mass was −3.5 (−18.2, 11.1) and 0.96 ICC (g).
LV volumes, LVEF, and LV mass derived from 3D-STE analysis using TomTec showed excellent repeatability and reproducibility (Table 6). Global and averaged peak segmental LV strain measures also showed excellent repeatability and reproducibility, except for longitudinal strain measures, which showed fair to good inter-observer variability. Rotational measures showed fair to good repeatability and reproducibility. All SDIs showed good to excellent repeatability and reproducibility. Dispersion indices also were reproducible apart from circumferential strain-Di, which showed poor repeatability and reproducibility. Overall, reproducibility was better for SDIs than for dispersion indices (Table 6).
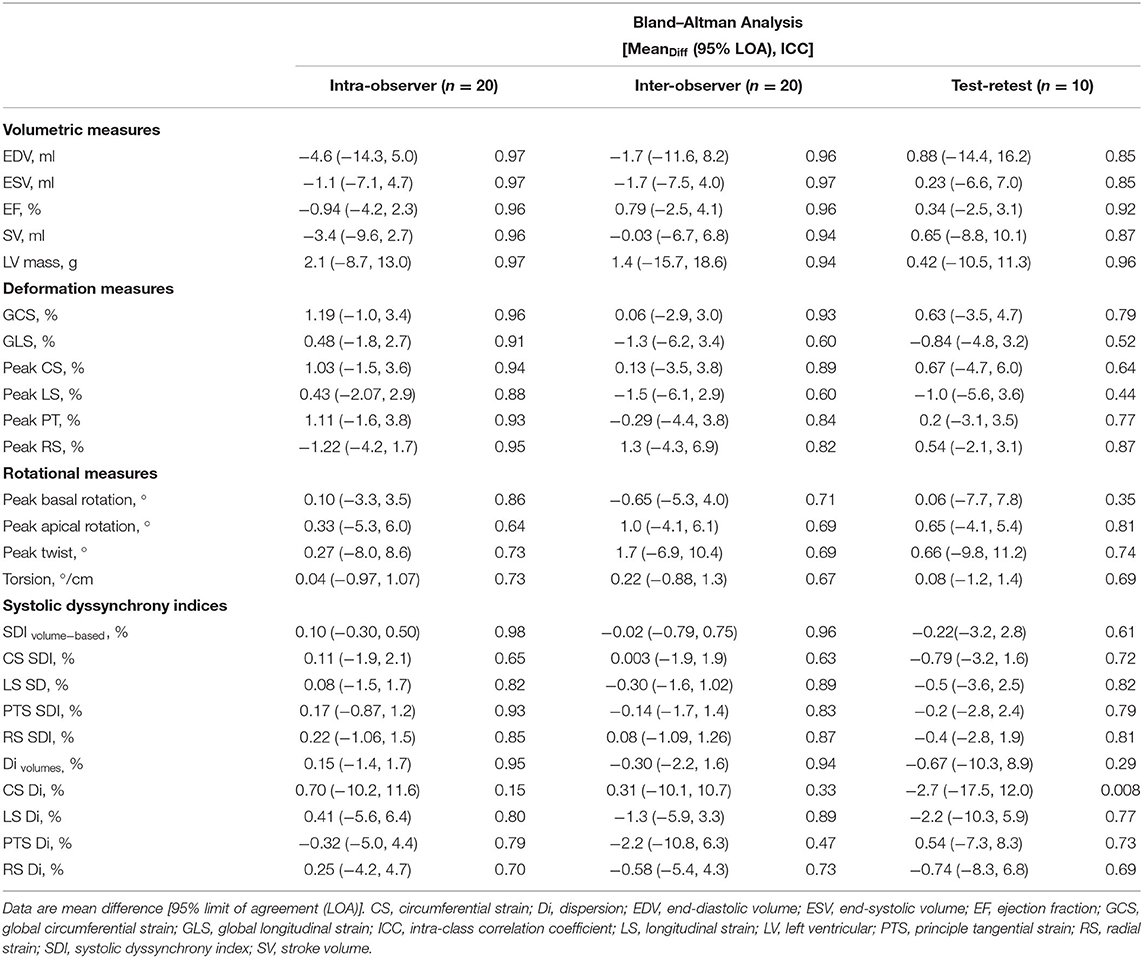
Table 6. Reproducibility of 3D-speckle-tracking echocardiographic analysis.
Test-retest reproducibility of 3D-STE-derived measures was overall fair to good, but lower than when re-reading images were used as a measure of reliability (Table 6). Nevertheless, volumetric measures showed excellent reproducibility. All strain and rotational measures showed fair to good or excellent test-retest reproducibility, except for longitudinal strain and basal rotational measures, which showed fair and poor test-retest reproducibility, respectively. SDIs showed good to excellent test-retest reproducibility, which was overall better than dispersion indices.
Vascular Measurements
PWV, CACS, and cIMT showed fair to good, excellent, and excellent reproducibility, respectively. Test-retest reproducibility of PWV was done in 21 individuals. Mean difference (95% LOA) and ICC were −0.27 (−3.9, 3.3) (m/s) and 0.71 for PWV and 0.83 (−88.2, 89.9) (mm) and 0.54 for the carotid-femoral length measure. Repeatability and reproducibility of CACS were done in 20 individuals and were excellent. The within-observer difference was −84.5 (−396.6, 565.7) and 0.99 ICC and the between-observer difference was −80.8 (−555.9, 394.3) and 0.99 ICC. Repeatability and reproducibility of cIMT and plaque characteristics (area and gray-scale median values) were done in 10 individuals (for cIMT) and n = 17 (for read-reread analysis of plaque characteristics) and were excellent, while percentage white had fair to good repeatability and reproducibility (Table 7).
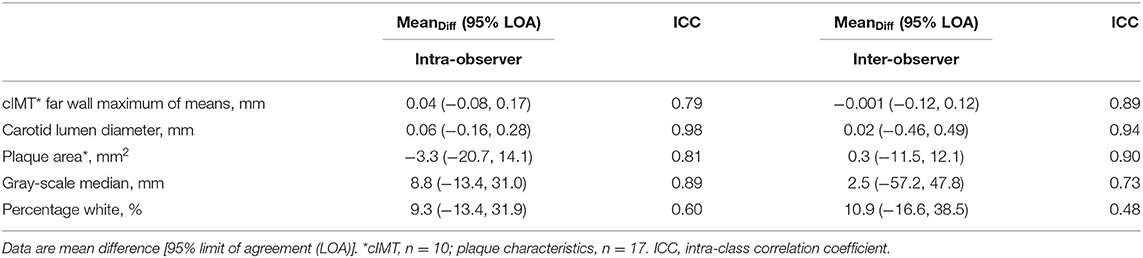
Table 7. Reproducibility of carotid intima medial thickness (cIMT) measures.
Discussion
Over 1,400 participants attended the SABRE 20-year follow-up and underwent a comprehensive health examination. The feasibility of image acquisition by most conventional echocardiographic measures was high, which is in line with previous reports in other cohort studies (3, 22, 23). By contrast, 3DE had ~71% acquisition feasibility, while 3D-STE feasibility was highly influenced by image quality and only half of the datasets could be analyzed. These proportions are slightly better than those reported by the Atherosclerosis Risk in Communities (ARIC) study (3, 24). The potential bias that may result from this missingness is an important consideration for future studies in older populations using 3D-STE (25–27). We believe this is the first study to show that the feasibility of 3D-STE seems to differ by ethnicity and gender, with the lowest level of feasibility being found in South Asian women and the highest in African Caribbean men. Further studies on this question are needed to establish definitively whether 3D-STE measures are biased by sex and ethnicity relationship to image quality.
Most conventional echocardiographic measurements and 3D-STE-derived LV indices demonstrated good to excellent repeatability/reproducibility, in keeping with other studies (3, 22, 28–32), although previous studies reporting the reproducibility of strain-based dyssynchrony measures by 3D-STE are scarce (14). Test-retest reproducibility, however, tended to be poorer for some measures, a factor that should be considered when performing longitudinal studies (28, 33).
We confirm that vascular measures including cIMT, CACS, and PWV are feasible in large cohort studies (34–38). The analyses of these measures are straightforward and reproducible and have been quite widely used. PWV, however, showed fair to good reliability, in keeping with previous studies (39).
SABRE includes first-generation migrant African Caribbeans and South Asians, who are known to have different risks of CVD compared to White British (40). Capturing advanced and sensitive cardiovascular measures will enable new insights into why this is the case (41–44).
Limitations and Strengths
SABRE is the largest tri-ethnic UK community-based cohort study and includes a lengthy follow-up period with detailed phenotyping using state-of-the-art methods A large percentage of participants could be traced 20 years later (~90%) and 42% returned for clinic follow-up. However, in common with most longitudinal studies, elderly and/or infirm participants were more likely to decline to attend which may bias our feasibility estimates (Supplementary Table 2). Further, differences in healthcare provision may limit the generalizability of our observations to other countries or settings.
In older participants or those who were obese and diabetic, 3DE was more frequently not feasible, which may also introduce bias (45). This maybe because sicker/frailer patients often have suboptimal echocardiographic image quality, but further studies on this question are needed (33). Improvements in 3D probe technology may improve image quality in future, although some scanning limitations related to morbidities such as atrial fibrillation, body habitus, or inability to lie on an echo couch are likely to remain problematic. While technology and hence quality has improved over time for many of the methods used, the second wave of SABRE employed state-of-the-art approaches for the time when it was conceived and performed. We did not assess any potential effect modification by ethnicity on reproducibility; to be able to assess this, a large sample size would be needed.
Conclusions
Capturing detailed cardiovascular phenotyping is feasible and reproducible in a large multi-ethnic study of older people. SABRE represents a uniquely rich resource of detailed information on cardiac and vascular structure and function in an ethnically diverse population and should lead to a better understanding of why people of South Asian and African Caribbean ancestry are at elevated risk of cardiometabolic diseases. The information reported in this study will be helpful to other research groups planning similar studies and can inform sample size calculations.
Data Availability Statement
The datasets presented in this article are not publicly available due to restrictions. Requests for data access should be directed to dC50aWxsaW5AdWNsLmFjLnVr.
Ethics Statement
The studies involving human participants were reviewed and approved by St Mary's Hospital Local Research Ethics Committee (07/H0712/109). The patients/participants provided their written informed consent to participate in this study.
Author Contributions
LA drafted the manuscript and all co-authors critically reviewed and amended the manuscript. All authors contributed to this study by conceiving and designing the study, performing the data collection and the statistical analysis, or assisting in data interpretation.
Funding
The Southall study was supported by the UK Medical Research Council (MRC), the British Diabetic Association (now Diabetes UK), the Wellcome Trust, and the British Heart Foundation (BHF). The Brent study was supported by the UK MRC. The main SABRE study is supported by the Wellcome Trust (082464) and BHF (SP/07/001/23603, CS/13/1/30327). The SABRE Cognitive function substudy was funded by the Wellcome Trust (089056), and the SABRE 3D Heart substudy was funded by the BHF (PG08 103). The SABRE metabolomics substudy was funded by Diabetes UK (13/0004774).
Conflict of Interest
The authors declare that the research was conducted in the absence of any commercial or financial relationships that could be construed as a potential conflict of interest.
Acknowledgments
LA is supported by a scholarship grant from Imam Abdulrahman Bin Faisal University for her postgraduate studies (PhD) at UCL. NC leads a unit that receives support from the UK MRC (Programme Code MC_UU_12019/1) and also receives support from BHF and the National Institute for Health Research UCL Hospitals Biomedical Research Centre. AH receives support from the BHF, the Economic and Social Research Council (ESRC), the Horizon 2020 Framework Programme of the European Union, the National Institute on Aging, the National Institute for Health Research University College London Hospitals Biomedical Research Centre, and the UK Medical Research Council and works in a unit that receives support from the UK Medical Research Council.
Supplementary Material
The Supplementary Material for this article can be found online at: https://www.frontiersin.org/articles/10.3389/fcvm.2020.591946/full#supplementary-material
References
1. Wild S, McKeigue P. Cross sectional analysis of mortality by country of birth in England and Wales, 1970-92. BMJ. (1997) 314:705–10. doi: 10.1136/bmj.314.7082.705
2. Tillin T, Forouhi NG, McKeigue PM, Chaturvedi N, Group SS. Southall And Brent REvisited: cohort profile of SABRE, a UK population-based comparison of cardiovascular disease and diabetes in people of European, Indian Asian and African Caribbean origins. Int J Epidemiol. (2012) 41:33–42. doi: 10.1093/ije/dyq175
3. Shah AM, Cheng S, Skali H, Wu J, Mangion JR, Kitzman D, et al. Rationale and design of a multicenter echocardiographic study to assess the relationship between cardiac structure and function and heart failure risk in a biracial cohort of community-dwelling elderly persons: the Atherosclerosis Risk in Communities study. Circ Cardiovasc Imaging. (2014) 7:173–81. doi: 10.1161/CIRCIMAGING.113.000736
4. Mitchell C, Rahko PS, Blauwet LA, Canaday B, Finstuen JA, Foster MC, et al. Guidelines for Performing a Comprehensive Transthoracic Echocardiographic Examination in Adults: recommendations from the American Society of Echocardiography. J Am Soc Echocardiogr. (2019) 32:1–64. doi: 10.1016/j.echo.2018.06.004
5. Lang RM, Badano LP, Tsang W, Adams DH, Agricola E, Buck T, et al. EAE/ASE recommendations for image acquisition and display using three-dimensional echocardiography. Eur Heart J Cardiovasc Imaging. (2012) 13:1–46. doi: 10.1093/ehjci/jer316
6. Lang RM, Badano LP, Mor-Avi V, Afilalo J, Armstrong A, Ernande L, et al. Recommendations for cardiac chamber quantification by echocardiography in adults: an update from the American Society of Echocardiography and the European Association of Cardiovascular Imaging. J Am Soc Echocardiogr. (2015) 28:1–39.e14. doi: 10.1016/j.echo.2014.10.003
7. Du Bois D, Du Bois EF. A formula to estimate the approximate surface area if height and weight be known. 1916. Nutrition. (1989) 5:303–11; discussion 12-3.
8. Dong SJ. Midwall fractional shortening in physiologic and pathologic left ventricular hypertrophy. Am J Hypertens. (2003) 16:792–3. doi: 10.1016/S0895-7061(03)00944-0
9. de Simone G, Devereux RB, Roman MJ, Ganau A, Saba PS, Alderman MH, et al. Assessment of left ventricular function by the midwall fractional shortening/end-systolic stress relation in human hypertension. J Am Coll Cardiol. (1994) 23:1444–51. doi: 10.1016/0735-1097(94)90390-5
10. Nagueh SF, Smiseth OA, Appleton CP, Byrd BF, Dokainish H, Edvardsen T, et al. Recommendations for the evaluation of left ventricular diastolic function by echocardiography: an update from the american society of echocardiography and the European Association of Cardiovascular Imaging. J Am Soc Echocardiogr. (2016) 29:277–314. doi: 10.1016/j.echo.2016.01.011
11. Brumback LC, Kronmal R, Heckbert SR, Ni H, Hundley WG, Lima JA, et al. Body size adjustments for left ventricular mass by cardiovascular magnetic resonance and their impact on left ventricular hypertrophy classification. Int J Cardiovasc Imaging. (2010) 26:459–68. doi: 10.1007/s10554-010-9584-5
12. Papachristidis A, Galli E, Geleijnse ML, Heyde B, Alessandrini M, Barbosa D, et al. Standardized delineation of endocardial boundaries in three-dimensional left ventricular echocardiograms. J Am Soc Echocardiogr. (2017) 30:1059–69. doi: 10.1016/j.echo.2017.06.027
13. Tsang W, Kenny C, Adhya S, Kapetanakis S, Weinert L, Lang RM, et al. Interinstitutional measurements of left ventricular volumes, speckle-tracking strain, and dyssynchrony using three-dimensional echocardiography. J Am Soc Echocardiogr. (2013) 26:1253–7. doi: 10.1016/j.echo.2013.07.023
14. Al Saikhan L, Park C, Hughes AD. Reproducibility of left ventricular dyssynchrony indices by three-dimensional speckle-tracking echocardiography: the impact of sub-optimal image quality. Front Cardiovasc Med. (2019) 6:149. doi: 10.3389/fcvm.2019.00149
15. Laurent S, Cockcroft J, Van Bortel L, Boutouyrie P, Giannattasio C, Hayoz D, et al. Expert consensus document on arterial stiffness: methodological issues and clinical applications. Eur Heart J. (2006) 27:2588–605. doi: 10.1093/eurheartj/ehl254
16. Vlachopoulos C, Aznaouridis K, O'Rourke MF, Safar ME, Baou K, Stefanadis C. Prediction of cardiovascular events and all-cause mortality with central haemodynamics: a systematic review and meta-analysis. Eur Heart J. (2010) 31:1865–71. doi: 10.1093/eurheartj/ehq024
17. Chen CH, Nevo E, Fetics B, Pak PH, Yin FC, Maughan WL, et al. Estimation of central aortic pressure waveform by mathematical transformation of radial tonometry pressure. Validation of generalized transfer function. Circulation. (1997) 95:1827–36. doi: 10.1161/01.CIR.95.7.1827
18. Wendelhag I, Liang Q, Gustavsson T, Wikstrand J. A new automated computerized analyzing system simplifies readings and reduces the variability in ultrasound measurement of intima-media thickness. Stroke. (1997) 28:2195–200. doi: 10.1161/01.STR.28.11.2195
19. Stein JH, Korcarz CE, Hurst RT, Lonn E, Kendall CB, Mohler ER, et al. Use of carotid ultrasound to identify subclinical vascular disease and evaluate cardiovascular disease risk: a consensus statement from the American Society of Echocardiography Carotid Intima-Media Thickness Task Force. Endorsed by the Society for Vascular Medicine. J Am Soc Echocardiogr. (2008) 21:93–111. doi: 10.1016/j.echo.2007.11.011
20. Hughes AD, Falaschetti E, Witt N, Wijetunge S, Thom SA, Tillin T, et al. Association of retinopathy and retinal microvascular abnormalities with stroke and cerebrovascular disease. Stroke. (2016) 47:2862–4. doi: 10.1161/STROKEAHA.116.014998
22. Dalen H, Thorstensen A, Vatten LJ, Aase SA, Stoylen A. Reference values and distribution of conventional echocardiographic doppler measures and longitudinal tissue doppler velocities in a population free from cardiovascular disease. Circ Cardiovasc Imaging. (2010) 3:614–22. doi: 10.1161/CIRCIMAGING.109.926022
23. Cheng S, Larson Martin G, McCabe Elizabeth L, Osypiuk E, Lehman Birgitta T, Stanchev P, et al. Age- and sex-based reference limits and clinical correlates of myocardial strain and synchrony. Circ Cardiovasc Imaging. (2013) 6:692–9. doi: 10.1161/CIRCIMAGING.112.000627
24. Hung CL, Gonçalves A, Shah AM, Cheng S, Kitzman D, Solomon SD. Age- and sex-related influences on left ventricular mechanics in elderly individuals free of prevalent heart failure: The ARIC Study (Atherosclerosis Risk in Communities). Circ Cardiovasc Imaging. (2017) 10:e004510. doi: 10.1161/CIRCIMAGING.116.004510
25. Al Saikhan L, Park C, Hardy R, Hughes A. Prognostic implications of left ventricular strain by speckle-tracking echocardiography in population-based studies: a systematic review protocol of the published literature. BMJ Open. (2018) 8:e023346. doi: 10.1136/bmjopen-2018-023346
26. Al Saikhan L, Park C, Hardy R, Hughes A. Prognostic implications of left ventricular strain by speckle-tracking echocardiography in the general population: a meta-analysis. Vasc Health Risk Manag. (2019) 15:229–51. doi: 10.2147/VHRM.S206747
27. Al Saikhan L, Park C, Hughes A. P644 The impact of intentional distortion of image quality on left ventricular deformation indices by three-dimensional speckle-tracking echocardiography. Eur Heart J Cardiovasc Imaging. (2019) 20(Suppl. 1):i363–81. doi: 10.1093/ehjci/jey265
28. Kaku K, Takeuchi M, Tsang W, Takigiku K, Yasukochi S, Patel AR, et al. Age-related normal range of left ventricular strain and torsion using three-dimensional speckle-tracking echocardiography. J Am Soc Echocardiog. (2014) 27:55–64. doi: 10.1016/j.echo.2013.10.002
29. Muraru D, Cucchini U, Mihăilă S, Miglioranza MH, Aruta P, Cavalli G, et al. Left ventricular myocardial strain by three-dimensional speckle-tracking echocardiography in healthy subjects: reference values and analysis of their physiologic and technical determinants. J Am Soc Echocardiog. (2014) 27:858–71.e1. doi: 10.1016/j.echo.2014.05.010
30. Martinez C, Ilardi F, Dulgheru R, Sugimoto T, Bernard A, Lancellotti P, et al. 3D echocardiographic reference ranges for normal left ventricular volumes and strain: results from the EACVI NORRE study. Eur Heart J Cardiovasc Imaging. (2016) 18:475–83. doi: 10.1093/ehjci/jew284
31. Kleijn SA, Aly MF, Knol DL, Terwee CB, Jansma EP, Abd El-Hady YA, et al. A meta-analysis of left ventricular dyssynchrony assessment and prediction of response to cardiac resynchronization therapy by three-dimensional echocardiography. Eur Heart J Cardiovasc Imaging. (2012) 13:763–75. doi: 10.1093/ehjci/jes041
32. Russo C, Jaubert MP, Jin Z, Homma S, Di Tullio MR. Intra- and interobserver reproducibility of left ventricular mechanical dyssynchrony assessment by real time three-dimensional echocardiography. Echocardiography. (2012) 29:598–607. doi: 10.1111/j.1540-8175.2011.01655.x
33. Al Saikhan L, Park C, Hughes A. Image quality causes substantial bias in three-dimensional speckle-tracking echocardiography measures. bioRxiv. (2018) 2018:500777. doi: 10.1101/500777
34. Liu S, Kim ED, Wu A, Meyer ML, Cheng S, Hoogeveen RC, et al. Central and peripheral pulse wave velocity and subclinical myocardial stress and damage in older adults. PLoS ONE. (2019) 14:e0212892. doi: 10.1371/journal.pone.0212892
35. Herder M, Johnsen Stein H, Arntzen Kjell A, Mathiesen Ellisiv B. Risk factors for progression of carotid intima-media thickness and total plaque area. Stroke. (2012) 43:1818–23. doi: 10.1161/STROKEAHA.111.646596
36. Polak JF, Pencina MJ, Pencina KM, O'Donnell CJ, Wolf PA, D'Agostino RB. Carotid-wall intima–media thickness and cardiovascular events. N Engl J Med. (2011) 365:213–21. doi: 10.1056/NEJMoa1012592
37. Tsao CW, Preis SR, Peloso GM, Hwang S-J, Kathiresan S, Fox CS, et al. Relations of long-term and contemporary lipid levels and lipid genetic risk scores with coronary artery calcium in the framingham heart study. J Am Coll Cardiol. (2012) 60:2364–71. doi: 10.1016/j.jacc.2012.09.007
38. Carr JJ, Nelson JC, Wong ND, McNitt-Gray M, Arad Y, Jacobs DR, et al. Calcified coronary artery plaque measurement with cardiac CT in population-based studies: standardized protocol of multi-ethnic study of atherosclerosis (MESA) and coronary artery risk development in young adults (CARDIA) study. Radiology. (2005) 234:35–43. doi: 10.1148/radiol.2341040439
39. Meyer ML, Tanaka H, Palta P, Patel MD, Camplain R, Couper D, et al. Repeatability of central and peripheral pulse wave velocity measures: the atherosclerosis risk in communities (ARIC) study. Am J Hypertens. (2015) 29:470–5. doi: 10.1093/ajh/hpv127
40. Tillin T, Hughes AD, Mayet J, Whincup P, Sattar N, Forouhi NG, et al. The relationship between metabolic risk factors and incident cardiovascular disease in Europeans, South Asians, and African Caribbeans: SABRE (Southall and Brent Revisited) – a prospective population-based study. J Am Coll Cardiol. (2013) 61:1777–86. doi: 10.1016/j.jacc.2012.12.046
41. Al Saikhan L, Park C, Tillin T, Mayet J, Chaturvedi N, Hughes A. 3 3D echocardiography-derived indices of left ventricular function and structure predict long-term mortality differently in men and women: the Southall And Brent Revisited (SABRE) study. Heart. (2019) 105:A3–5. doi: 10.1136/heartjnl-2019-BCS.3
42. Al Saikhan L, Park C, Tillin T, Williams S, Mayet J, Chaturvedi N, et al. P2444 Comparison of 3D and 2D echocardiography-derived indices of left ventricular function and structure to predict long-term mortality in the general population: Southall And Brent Revisited (SABRE) study. Eur Heart J. (2019) 40(Suppl_1):ehz748.0776. doi: 10.1093/eurheartj/ehz748.0776
43. Al Saikhan L, Park C, Tillin T, Mayet J, Chaturvedi N, Hughes A. 3.5 arterial stiffness partly explains sex differences in associations between left ventricular structure and mortality: the southall and brent revisited (Sabre) study. Artery Res. (2020) 25:S25–6. doi: 10.2991/artres.k.191224.018
44. Al Saikhan L, Park C, Tillin T, Mayet J, Chaturvedi N, Hughes A. The prevalence of subclinical left ventricular systolic dysfunction by 3D-global longitudinal strain in South Asians compared to whites Europeans and the role of central obesity: the southall and brent revisited (SABRE) study. J Am Coll Cardiol. (2020) 75(11 Suppl. 1):1656. doi: 10.1016/S0735-1097(20)32283-X
Keywords: population-based, cardiovascular, imaging, echocardiography, vascular, feasibility, reproducibility
Citation: Al Saikhan L, Alobaida M, Bhuva A, Chaturvedi N, Heasman J, Hughes AD, Jones S, Eastwood S, Manisty C, March K, Ghosh AK, Mayet J, Oguntade A, Tillin T, Williams S, Wright A and Park C (2020) Imaging Protocol, Feasibility, and Reproducibility of Cardiovascular Phenotyping in a Large Tri-Ethnic Population-Based Study of Older People: The Southall and Brent Revisited (SABRE) Study. Front. Cardiovasc. Med. 7:591946. doi: 10.3389/fcvm.2020.591946
Received: 05 August 2020; Accepted: 05 October 2020;
Published: 13 November 2020.
Edited by:
Fabrizio Ricci, University of Studies G. d'Annunzio Chieti and Pescara, ItalyReviewed by:
Viktor Hamrefors, Lund University, SwedenMaria Aurora Morales, National Research Council (CNR), Italy
Copyright © 2020 Al Saikhan, Alobaida, Bhuva, Chaturvedi, Heasman, Hughes, Jones, Eastwood, Manisty, March, Ghosh, Mayet, Oguntade, Tillin, Williams, Wright and Park. This is an open-access article distributed under the terms of the Creative Commons Attribution License (CC BY). The use, distribution or reproduction in other forums is permitted, provided the original author(s) and the copyright owner(s) are credited and that the original publication in this journal is cited, in accordance with accepted academic practice. No use, distribution or reproduction is permitted which does not comply with these terms.
*Correspondence: Lamia Al Saikhan, bGthbHNhaWtoYW5AaWF1LmVkdS5zYQ==