 Hu Ai1†
 Naixin Zheng1†
 Le Li1†Guojian Yang1Hui Li1Guodong Tang1
 Qi Zhou2Huiping Zhang1Xue Yu1Feng Xu1Ying Zhao1*Fucheng Sun1*
- 1Department of Cardiology, National Center of Gerontology, Institute of Geriatric Medicine, Beijing Hospital, Chinese Academy of Medical Sciences, Beijing, China
- 2The MOH Key Laboratory of Geriatrics, National Center of Gerontology, Beijing Hospital, Beijing, China
Background: Coronary angiography-derived fractional flow reserve (caFFR) measurements have shown good correlations and agreement with invasive wire-based fractional flow reserve (FFR) measurements. However, few studies have examined the diagnostic performance of caFFR measurements before and after percutaneous coronary intervention (PCI). This study sought to compare the diagnostic performance of caFFR measurements against wire-based FFR measurements in patients before and after PCI.
Methods: Patients who underwent FFR-guided PCI were eligible for the acquisition of caFFR measurements. Offline caFFR measurements were performed by blinded hospital operators in a core laboratory. The primary endpoint was the vessel-oriented composite endpoint (VOCE), defined as a composite of vessel-related cardiovascular death, vessel-related myocardial infarction, and target vessel revascularization.
Results: A total of 105 pre-PCI caFFR measurements and 65 post-PCI caFFR measurements were compared against available wire-based FFR measurements. A strong linear correlation was found between wire-based FFR and caFFR measurements (r = 0.77; p < 0.001) before PCI, and caFFR measurements also showed a high correlation (r = 0.82; p < 0.001) with wire-based FFR measurements after PCI. A total of 6 VOCEs were observed in 61 patients during follow-up. Post-PCI FFR values (≤0.82) in the target vessel was the strongest predictor of VOCE [hazard ratio (HR): 5.59; 95% confidence interval (CI): 1.12–27.96; p = 0.036). Similarly, patients with low post-PCI caFFR values (≤0.83) showed an 8-fold higher risk of VOCE than those with high post-PCI caFFR values (>0.83; HR: 8.83; 95% CI: 1.46–53.44; p = 0.017).
Conclusion: The study showed that the caFFR measurements were well-correlated and in agreement with invasive wire-based FFR measurements before and after PCI. Similar to wire-based FFR measurements, post-PCI caFFR measurements can be used to identify patients with a higher risk for adverse events associated with PCI.
Introduction
Angiography-derived fractional flow reserve (FFR) measurements represent a novel technique for evaluating physiological function in cardiovascular disease (1, 2). Over the past few years, four angiography-derived FFR measurement methods have shown good correlation and agreement with the conventional invasive wire-based FFR method in the FAVOR II China study (3), FAST-FFR study (4), FLASH FFR study (5), and FAST study (6). Among patients who are suspected of coronary heart disease, these clinical trials have shown that angiography-derived FFR measurement techniques have good diagnostic performance for guiding revascularization in percutaneous coronary intervention (PCI). However, few studies have examined the diagnostic performance of coronary angiography-derived FFR (caFFR) before and after PCI. The value of initial wire-derived FFR is typically below 0.8 among patients who have previously undergone PCI, which might challenge the diagnostic abilities of caFFR. Furthermore, whether computational fluid dynamics have diagnostic value in coronary arteries implanted with exogenous metal stents remains unknown.
The objective of the current retrospective study was to compare the diagnostic performance of caFFR measurement against wire-based FFR measurement among patients before and after PCI. The FlashAngio caFFR system includes the Flash pressure transducer, console, and software (Rainmed Ltd., Suzhou, China). In this study, pre-PCI and post-PCI caFFR measurements were compared with corresponding wire-based FFR measurements. We also investigated the post-PCI FFR and caFFR cutoff values for the prediction of long-term adverse cardiac outcomes.
Methods
Study Population
Patients (≥18 years of age) with stable ischemic heart disease (SIHD) who underwent elective invasive FFR-guided PCI for a de novo lesion from June 2012 to May 2020 at Beijing Hospital were included in this study. The angiographic inclusion criterion was at least one lesion with diameter stenosis of 50–90% by visual assessment. The angiographic exclusion criteria (5), as required by the FlashAngio caFFR system, included: (1) poor angiographic image quality, precluding contour detection; (2) severe vascular overlap or distortion of the interrogated vessel; (3) stenoses caused by myocardial bridge; and (4) ostial lesions. The clinical data were obtained from electronic medical records and analyzed retrospectively. The study was approved by the Institutional Ethics Committee (2020BJYYEC-038-01) at Beijing Hospital. All patients signed informed consent to undergo invasive FFR-guided PCI and agreed to the use of their data for research purposes.
Determination of Wire-Based FFR
Intracoronary nitroglycerine (200 mg) was routinely injected before FFR measurement. The coronary pressure wire-based FFR was measured using a commercially available pressure wire system (Certus, Abbott Vascular, Santa Clara, CA). The pressure wire was inserted such that the pressure transducer was ≥2 cm downstream from the most distal stenosis. The position of the pressure wire was captured on cine angiography for offline comparisons. Hyperemic blood flow was induced by the intravenous administration of adenosine-5'-triphosphate (ATP) at ≥140 μg/kg/min and recorded after at least 60 s in the presence of stable aortic pressure decrease relative to baseline pressure that was sustained for at least 10 beats. FFR pullback was performed at the operator's judgment. Pressure drift was measured after the withdrawal of the pressure wire to the guiding catheter tip and was defined as a resting distal-to-aortic coronary pressure ratio (Pd/Pa) from 0.97 to 1.03.
Coronary Revascularization and Image Transfer
Coronary angiography was performed based on 9 conventional projection views (7), which were recorded at 15 frames/s. A mechanical pump was used to inject the contrast agent at a rate of 3.5 mL/s. The PCI procedures were determined by an interventional cardiologist following the best local practices. At the end of the procedure, at least two angiographic projection views for the targeted vessel were recorded. During the operation, the aortic pressure value was routinely recorded in the Catheter Laboratory Database.
Offline caFFR Measurement
At least two angiographic projections, avoiding vessel overlap and separated by ≥30°, without table movement, were required to generate caFFR. Digital Imaging and Communications in Medicine (DICOM) images of coronary angiography and mean aortic pressure (MAP) were exported to the FlashAngio console. A simulated three-dimensional (3D) mesh reconstruction of the coronary artery was generated along the artery path from the inlet to the most distal location. The caFFR computation was performed by blinded hospital operators using the method described previously (5). The values of pre-PCI and post-PCI caFFR were reported separately, as shown in Figure 1.
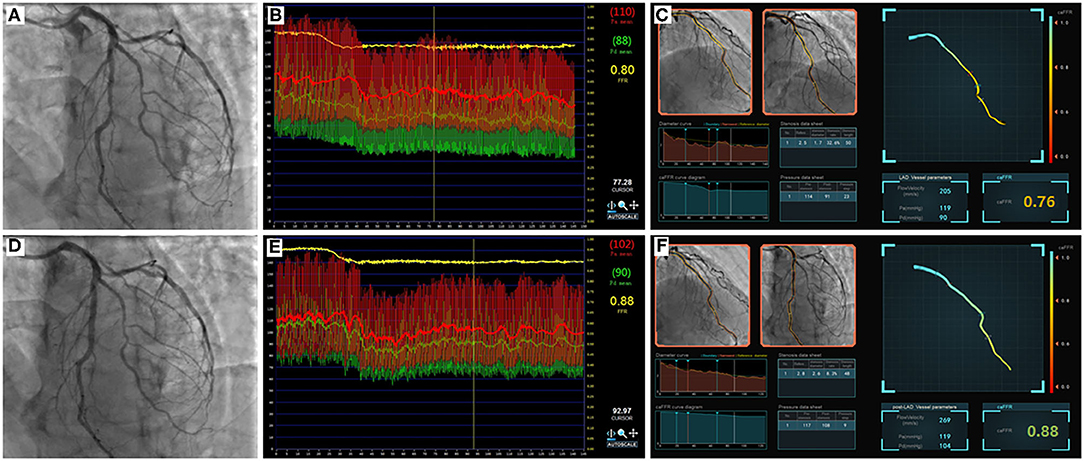
Figure 1. Example of comparisons between pre- and post-PCI FFR and caFFR values. Images were obtained from a 61-year-old patient in the study. (A) Coronary angiography shows moderate stenosis lesion located in the middle of the LAD. (B) The value of pre-PCI FFR, measured by invasive pressure wire, was 0.80. (C) The pre-PCI caFFR value was 0.76. (D) Post-PCI coronary angiography after 2.5 × 24 mm and 2.75 × 24 mm stent implantation. (E) The invasive post-PCI wire-based FFR value was 0.88. (F) The post-PCI caFFR value was 0.88. LAD, left descending artery; FFR, fractional flow reserve; PCI, percutaneous coronary intervention; caFFR, coronary angiography-derived FFR.
Follow-Up and End Points
Clinical follow-up data were recorded in a dedicated database, including admission records and outpatient notes, maintained at Beijing Hospital. All patients were followed individually by direct telephone contact or outpatient visits to confirm clinical data every 6 months. The primary endpoint was the vessel-oriented composite endpoint (VOCE), defined as the composite of vessel-related cardiovascular death, vessel-related myocardial infarction (MI), and target vessel revascularization (TVR) (8). Secondary endpoints were the individual components of the VOCE. Death of unknown etiology was considered cardiovascular death. MI was defined as new Q waves or one plasma level of creatine kinase-myocardial band (CK-MB) ≥ 5 × upper limit of normal (ULN; or troponin ≥ 35 × ULN if CK-MB was not available) in the context of acute coronary syndrome (ACS) (9). TVR was defined as the repeat revascularization or bypass grafting of the target vessel.
Statistical Analysis
Continuous variables are expressed as the mean and standard deviation. Categorical data are summarized as the number and percentage. The Student's t-test and the Chi-square test were used to compare group differences. The correlation between wire-based FFR and caFFR measurements was assessed by Spearman's correlation coefficient (r) with a 95% confidence interval (CI). Bland–Altman analysis was used to estimate the agreement between the two indices. Patients were separated into two groups (high-risk and low-risk groups) according to the post-PCI wire-based FFR and caFFR values. The cumulative survival probability of VOCE was estimated by Kaplan–Meier curves; the difference between high-risk and low-risk groups was compared by a log-rank test and plotted using the “survival” package of R language (Version 3.6.1). In parallel, Cox regression was fitted to estimate the risks of VOCE (hazard ratio [HR], 95% CI) for the two groups. The cutoff post-PCI FFR value for the prediction of long-term adverse cardiac outcomes varied from 0.81 to 0.95 (10). We tested the threshold starting at 0.81 to determine the optimal cutoff value for post-PCI FFR measurements to predict VOCE to determine whether caFFR measurements have similar prognostic power as traditional wire-based FFR measurements for VOCE prediction. All statistical analyses were performed with SPSS software (Version 24.0, IBM Corp., Armonk, NY) and R language. The significance level was set at p < 0.05, and all probability values were two-sided.
Results
Feasibility and Characteristics of Patients
From 2012 to 2020, 126 patients with SIHD who underwent FFR-guided PCI were enrolled in this study, and caFFR was analyzed in 104 patients (105 vessels). Post-PCI FFR measurement was performed in 70 patients (67.3%, 71 vessels), and post-PCI caFFR measurements could be performed in 65 patients (65 vessels). The primary causes of caFFR computation failure were poor image quality (n = 9 of 126, 7.14%), severe overlap or distortion (n = 5 of 126, 3.97%), and the lack of 2 cines with projection angles ≥ 30° (n = 3 of 126, 2.38%), as shown in Figure 2. Figure 3 shows the frequency distribution of FFR measurements, caFFR measurements, and increased relative values to baseline. Clinical and interventional characteristics are reported in Table 1.
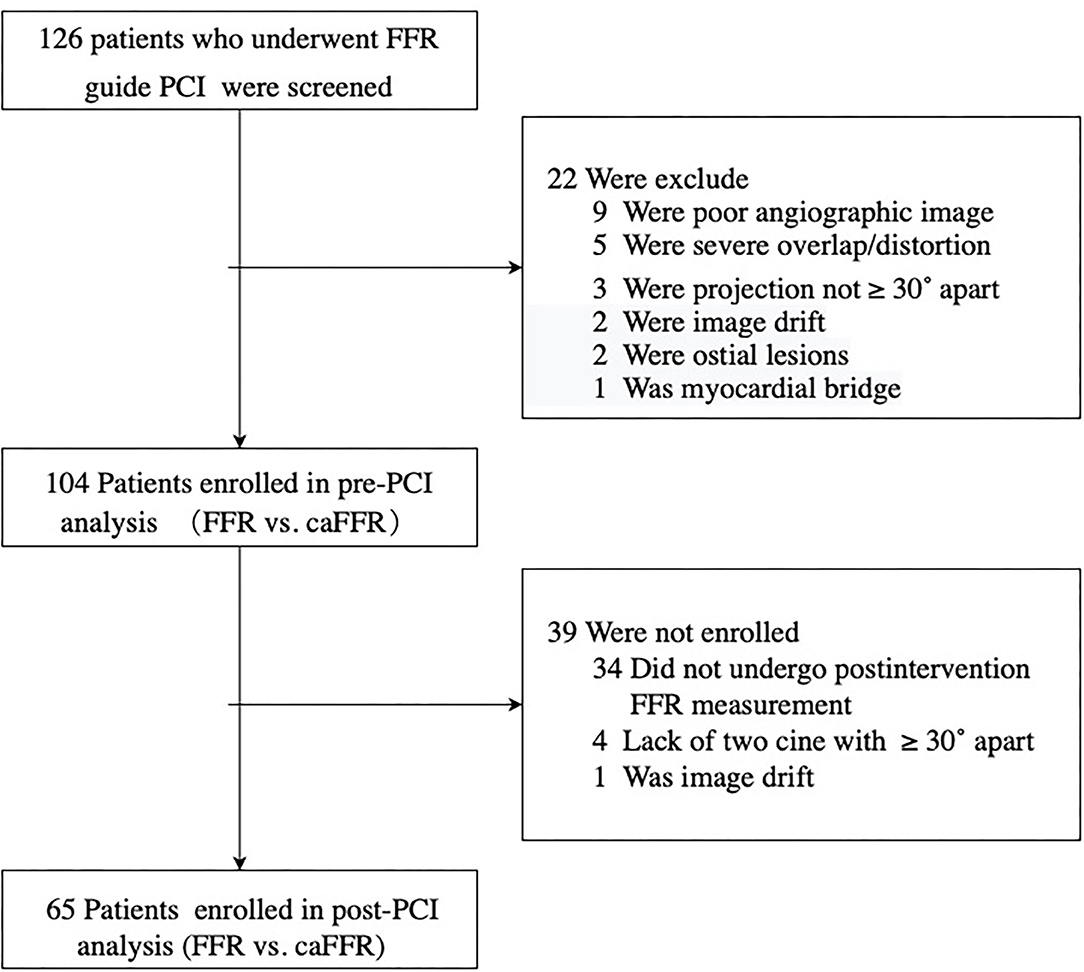
Figure 2. Study flow diagram. SIHD, stable ischemic heart disease; LAD, left descending artery; FFR, fractional flow reserve; PCI, percutaneous coronary intervention; caFFR, coronary angiography-derived FFR.
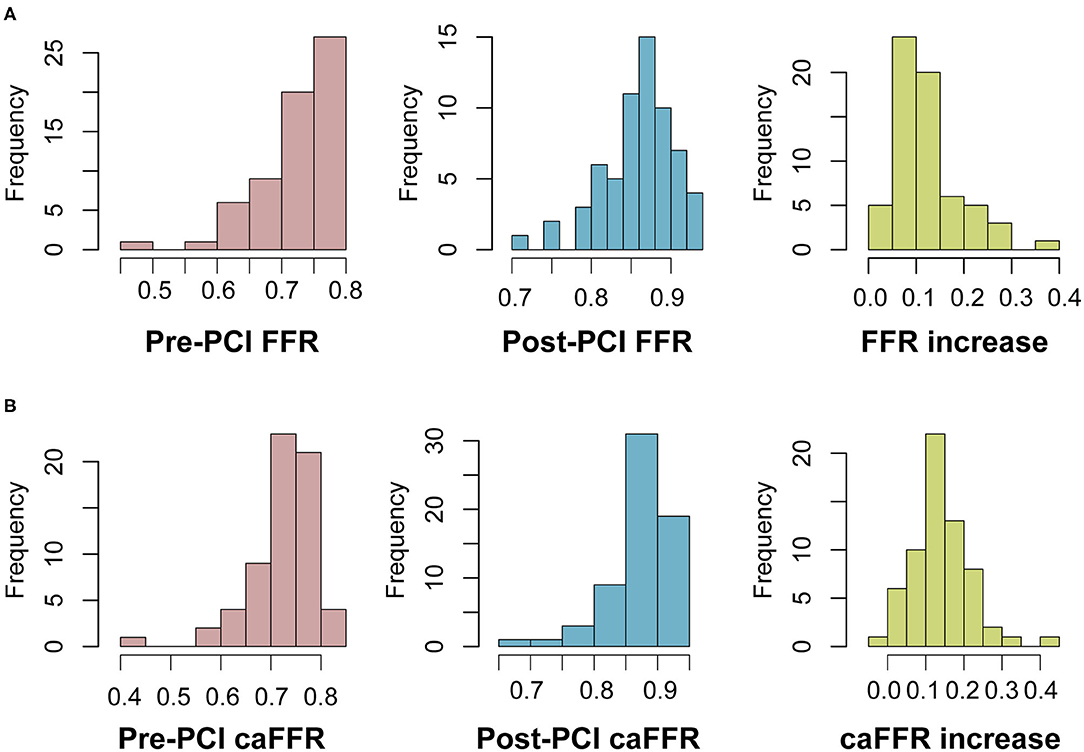
Figure 3. Frequency distribution of FFR and caFFR values and increased values. (A) Frequency distribution and increased values of FFR. (B) Frequency distribution and increased values of caFFR. LAD, left descending artery; FFR, fractional flow reserve; PCI, percutaneous coronary intervention; caFFR, coronary angiography-derived FFR.
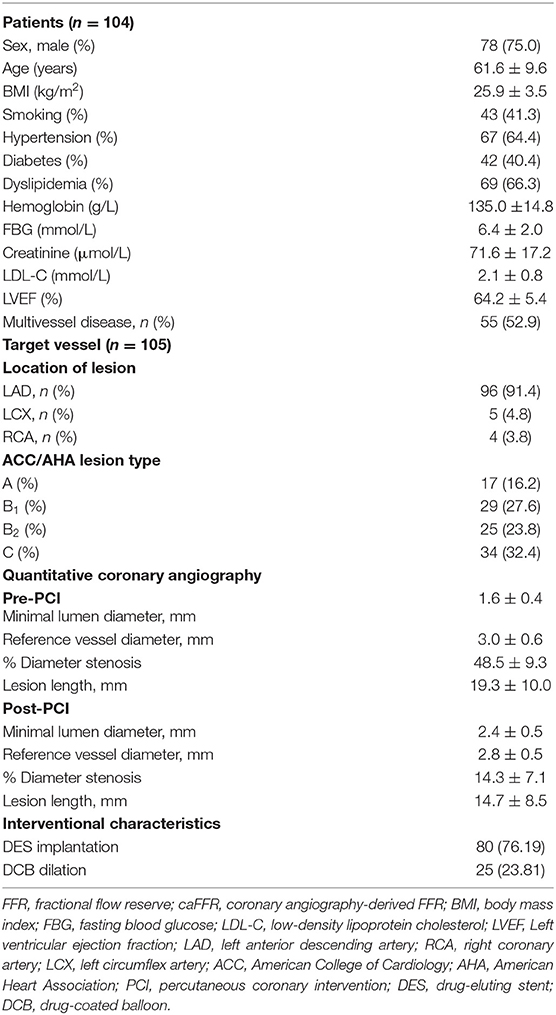
Table 1. Clinical and angiographic characteristics of patients.
Agreement Between FFR and caFFR
Pre-PCI caFFR values were well-correlated with wire-based FFR values (caFFR = 0.76 × FFR + 0.18, R = 0.77, Figure 4A). The Bland–Altman analysis of pre-PCI caFFR and wire-based FFR values showed no systematic differences, with a bias of −0.0003 ± 0.0420 (95% limit of agreement: −0.0826 to 0.0820, Figure 4B). The post-PCI caFFR values were also correlated with wire-based FFR values (caFFR = 0.93 × FFR + 0.88, R = 0.817, Figure 5A). Bland–Altman analysis of post-PCI caFFR and wire-based FFR values showed no systematic differences, with a bias of −0.0123 ± 0.0299 (95% limit of agreement: −0.0709 to 0.0463, Figure 5B). Figure 6 shows the increase in the wire-based FFR values after PCI, similar to those observed by caFFR measurement (0.13 ± 0.07 vs. 0.14 ± 0.08; p = 0.25).
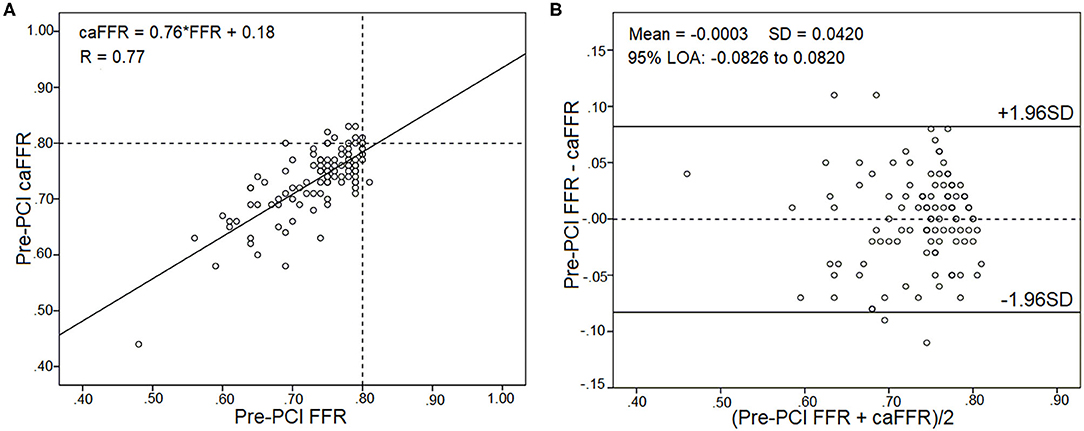
Figure 4. Correlation and agreement between pre-PCI wire-based FFR and caFFR values (n = 105). (A) Strong correlation between pre-PCI wire-based FFR and caFFR values (caFFR = 0.76 × FFR + 0.18, R = 0.77, 95% CI: 0.53–0.78). (B) Good agreement between pre-PCI wire-based FFR and caFFR values by the Bland–Altman analysis (bias: −0.0003 ± 0.0420; 95% LOA −0.0826 to 0.0820). CI, confidence interval; LOA, limits of agreement; LAD, left descending artery; FFR, fractional flow reserve; PCI, percutaneous coronary intervention; caFFR, coronary angiography-derived FFR.
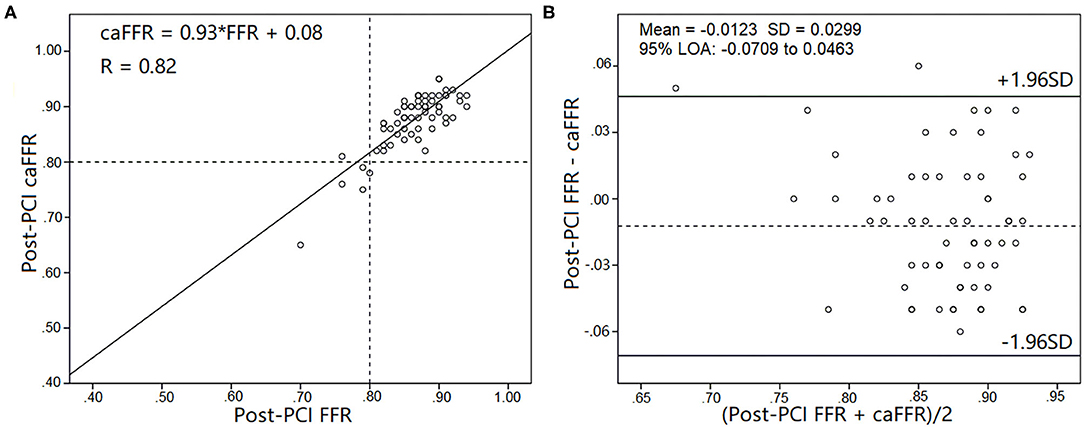
Figure 5. Correlation and agreement between post-PCI wire-based FFR and caFFR values (n = 65). (A) Strong correlation between post-PCI wire-based FFR and caFFR values (caFFR = 0.93 × FFR + 0.08, R = 0.82, 95% CI: 0.762–1.092). (B) Good agreement between post-PCI wire-based FFR and caFFR values by the Bland–Altman analysis (bias: −0.0123 ± 0.0299; 95% LOA −0.0709 to 0.0463). CI, confidence interval; LOA, limits of agreement; LAD, left descending artery; FFR, fractional flow reserve; PCI, percutaneous coronary intervention; caFFR, coronary angiography-derived FFR.
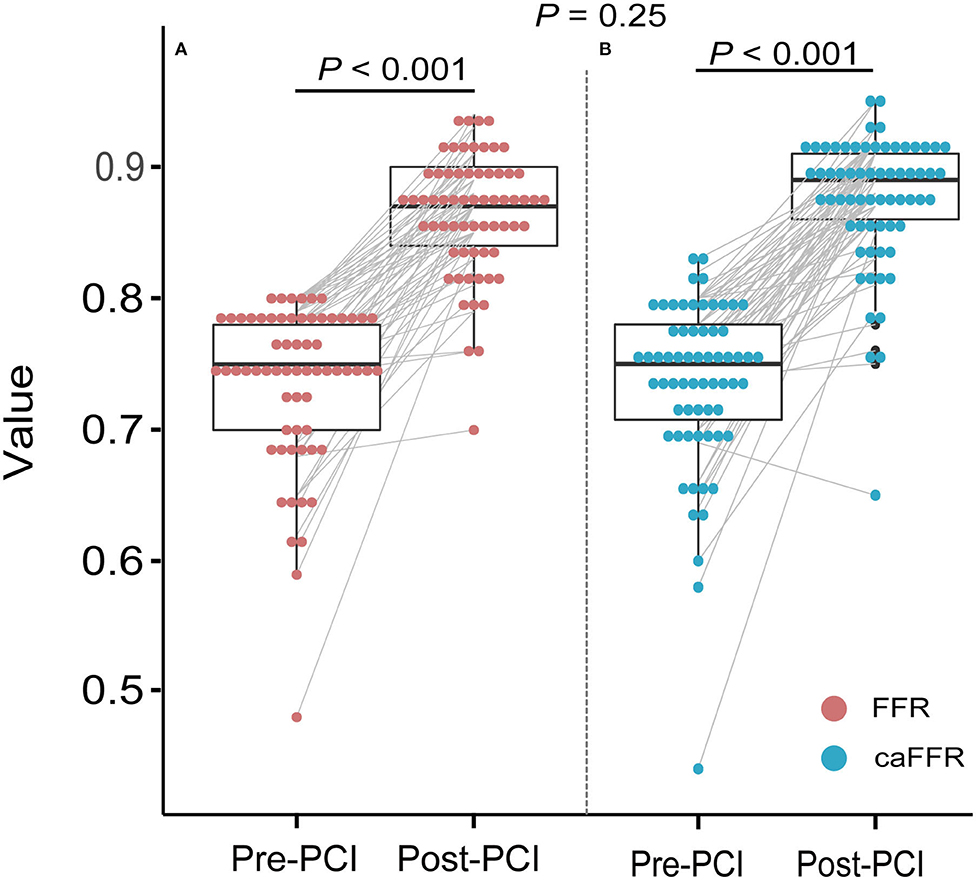
Figure 6. Improvements in wire-based FFR and caFFR values after PCI (n = 65). (A) The wire-based FFR values increased significantly after PCI (0.74 ± 0.07 vs. 0.86 ± 0.05, p < 0.001). (B) The caFFR values increased significantly after PCI (0.74 ± 0.07 vs. 0.88 ± 0.05, p < 0.001). The increase in wire-based FFR values after PCI were similar to that of caFFR values (0.13 ± 0.07 vs. 0.14 ± 0.08; p = 0.25). LAD, left descending artery; FFR, fractional flow reserve; PCI, percutaneous coronary intervention; caFFR, coronary angiography-derived FFR.
Prognostic Implications of Post-PCI caFFR
In 65 patients with post-PCI wire-based FFR and caFFR measurements, 61 (93.9%) patients had clinical follow-up data. During a follow-up period of 6–105 months (86.9% >12-month follow-up; 50.9% >36-month follow-up), 6 (9.8%) VOCEs were repo rted: 1 cardiovascular death (1.6%), 1 MI (1.6%), and 4 TVRs (6.6%). The post-PCI caFFR values showed consistent power with post-PCI wire-based FFR values for the prediction of VOCEs, although different cutoff values were identified for the two measurement methods (Supplementary Figure 1). Patients with low post-PCI wire-based FFR values (≤ 0.82) had a higher risk of VOCE than those with high post-PCI wire-based FFR values (> 0.82; HR: 5.59; 95% CI: 1.12–27.96; p = 0.036). Similarly, patients with low post-PCI caFFR values (≤ 0.83) showed an 8-fold higher risk of VOCE than those with high post-PCI caFFR values (> 0.83; HR: 8.83; 95% CI: 1.46–53.44; p = 0.017; Figure 7).
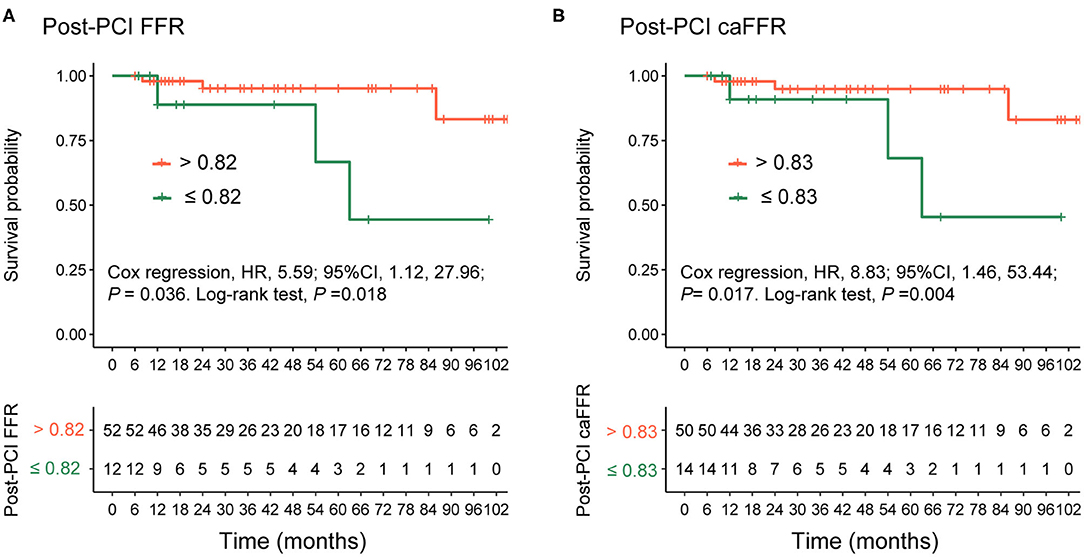
Figure 7. Comparison of VOCEs according to post-PCI FFR or caFFR values. Kaplan–Meier curves showing that (A) patients with post-PCI wire-based FFR values > 0.82 had a higher survival free of VOCE compared with patients with post-PCI wire-based FFR values ≤ 0.82. (B) Patients with post-PCI caFFR values > 0.83 had a higher survival free of VOCE compared with patients with post-PCI caFFR values ≤ 0.83 group. VOCE, vessel-oriented composite endpoint; LAD, left descending artery; FFR, fractional flow reserve; PCI, percutaneous coronary intervention; caFFR, coronary angiography-derived FFR.
When the patients were grouped according to their post-PCI wire-based FFR values (>0.82 vs. ≤ 0.82; Table 2), a significant difference was found in the numbers and total lengths of the stents used (1.50 ± 0.55 vs. 1.0 and 30.96 ± 10.45 vs. 19.75 ± 3.73, respectively; p < 0.01). Similarly, both the numbers and total lengths of stents in the high caFFR value group (>0.83 vs. ≤ 0.83) were significantly higher than those in the low caFFR value group (1.48 ± 0.55 vs. 1.0; 30.52 ± 10.51 vs. 19.50 ± 2.66; p < 0.01; Table 2).
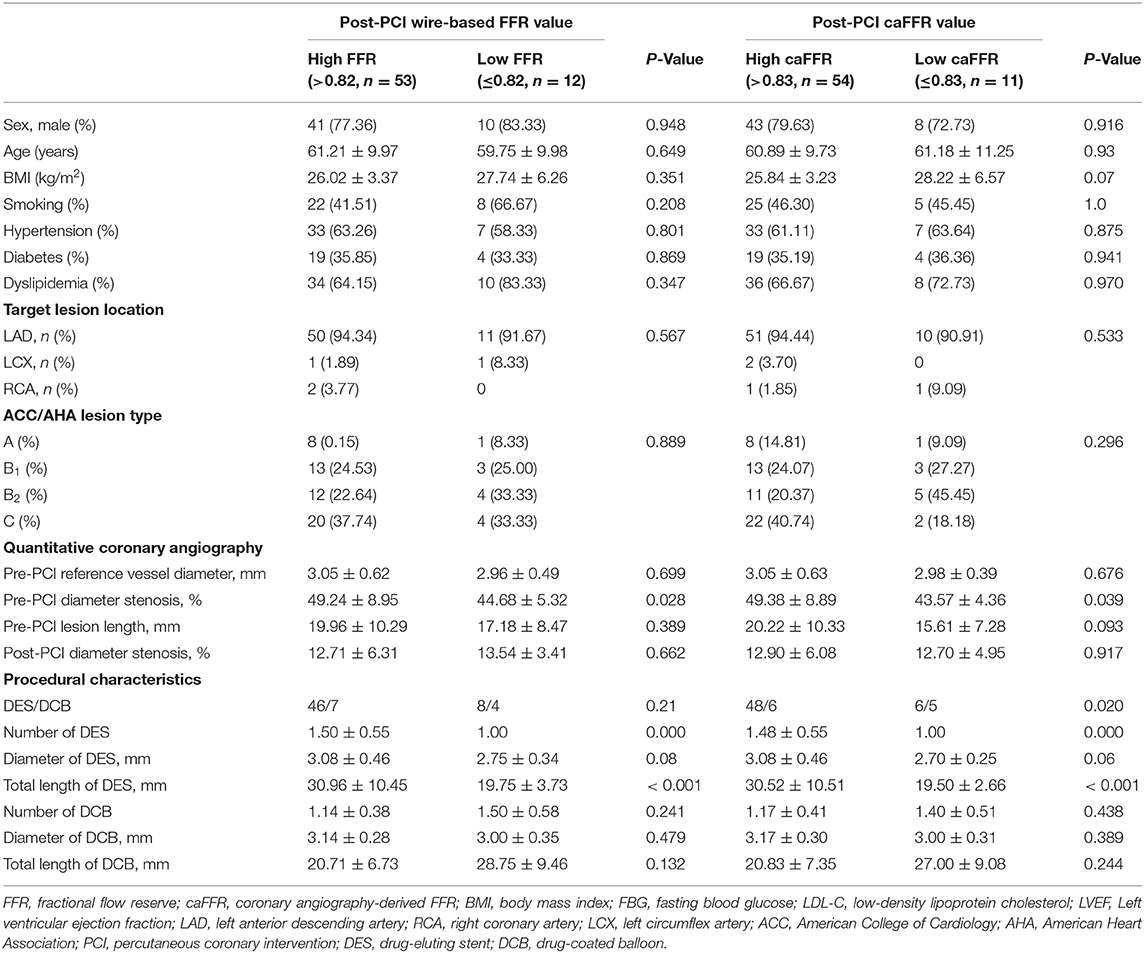
Table 2. Comparison of general and procedural characteristics according to post-PCI wire-based FFR and caFFR values.
Discussion
The present study validated caFFR measurement against those obtained using conventional wire-based FFR measurements before and after PCI. The major findings were as follows: (1) caFFR analysis could be applied to most conventional coronary angiography images; (2) caFFR and wire-based FFR measurements had good correlation and agreement both before and after PCI; and (3) post-PCI wire-based FFR and caFFR measurements had similar prognostic values.
FFR measurement has been used in the cardiac catheter laboratory to identify functionally significant coronary stenoses (11, 12). Random trials have demonstrated that FFR-guided PCI improves clinical outcomes and reduces the need for stenting, in addition to reducing costs (13–15). FFR measurement is recommended as a standard protocol in the revascularization guidelines for stable coronary heart disease (16, 17). Angiography-derived FFR and wire-based FFR measurements showed similar diagnostic accuracy. Using wire-based FFR as the reference standard, the area under the curve (AUC) for caFFR (5) was 0.979, and similar results were demonstrated in studies of the quantitative flow ratio (QFR) (3), FFRangio (4), and Vessel FFR (vFFR) (6) measurement methods, which reported AUC values of 0.96, 0.94, and 0.93, respectively. In this study, pre-PCI caFFR values showed good diagnostic accuracy in patients who underwent elective PCI for a de novo lesion compared with the diagnostic accuracy of wire-based FFR values.
FFR measurement after PCI can be used to discriminate suboptimal PCI procedures and predict clinical outcomes. Pijls et al. (18) investigated 750 patients following successful bare-metal stent implantation and found that lower post-PCI FFR values were associated with an increased major adverse cardiovascular event (MACE) rate (for groups based on FFR values > 0.95, 0.8–0.9, and < 0.80, MACE rates were 4.9% 20.3% and 29.5%, respectively; p < 0.05) at the 6-month follow-up time point. The DK CRUSH VII Registry Study (19) revealed that a post-PCI FFR value < 0.88 was the predominant predictor of target vessel failure (12.3 vs. 6.1%; p < 0.01) 3 years after drug-eluting stent implantation. An increase in the FFR value after PCI was directly associated with MI recovery (20), whereas a small increase in the FFR value (<15%) was a prognostic indicator of poor clinical outcomes, similar to low absolute post-PCI FFR values (<0.84) (21). The FFR-search study unexpectedly showed that post-PCI FFR values did not correlate with clinical events at the 30-day follow-up time point (22), which was thought to be due to the follow-up period being too short. The reasons for ineffective FFR changes after PCI include incomplete stent expansion, stent malapposition, geographical plaque miss, plaque protrusion, edge dissection, and plaque shift at the stent edge (23). To achieve functional optimization, unsatisfactory changes in FFR can safely and effectively be corrected by further interventions (post-dilation or additional stenting) (24).
Despite a Class 1a recommendation for use in the guidance of coronary revascularization in patients with stable angina, only 18.5%−21% of patients undergo FFR measurement (25, 26). Moreover, post-PCI FFR measurement was only performed in 69.2 and 64.2% of patients in the FAME 1 and FAME 2 studies (27). caFFR measurement represents a new technique that can be performed without the use of a pressure wire and hyperemic stimulus. The FLASH FFR study demonstrated that caFFR measurement has a good correlation with wire-based FFR measurement, and caFFR measurement requires a shorter operation time (< 5 min) than wire-based FFR measurement (5). The present study demonstrated that caFFR measurement had a good correlation with wire-based FFR measurement both before and after PCI. Similarly, post-PCI QFR and vFFR measurements correlated reasonably well-with post-PCI wire-based FFR measurements (28, 29). However, in a retrospective study of data collected by more than 50 centers, a weak correlation was reported between vFFR measurement and wire-based FFR measurement because of poor image quality and the difficulty tracking aortic pressure (30). The prognostic value of QFR measurements has been confirmed under various conditions (8, 9, 31), although the optimal cutoff values for post-PCI QFR measurements have been reported as 0.89, 0.91, and 0.80 in different studies. In the current single-center, retrospective study, patients with low post-PCI wire-based FFR (≤0.82) or caFFR (≤0.83) values were associated with a significantly higher risk of VOCE than those with high post-PCI FFR (>0.82) or caFFR (>0.83) values. The numbers and lengths of stents implanted in the high post-PCI FFR and caFFR value groups were significantly higher than those in the low post-PCI FFR and caFFR value groups. Insufficient stent implantation has been shown to result in incomplete coronary lesion coverage, which may explain the suboptimal FFR and caFFR values measured after the intervention in some patients. Currently, no consensus exists regarding the optimal post-PCI FFR value, although a higher FFR value is generally believed to be preferable. This study showed that a higher post-PCI caFFR value could predict a better clinical outcome.
Limitations
The present study has several limitations. First, this study was performed as a retrospective study in a single center with a relatively small study population. Second, only patients with stable coronary heart disease were enrolled in this study. High-risk patients, such as those with ACS, ostial lesions, or left main lesions, were excluded, which restrains the generalizability of the results. Third, aortic root pressure was obtained from an interventional database maintained by the cardiac catheterization laboratory rather than measuring real-time invasive pressure. The retrospective methodology of obtaining aortic root pressure might affect the results slightly. Fourth, the retrospective study lacked a sufficient sample size and preconditions. We cannot recommend a powerful post-PCI FFR or caFFR cutoff value for the prediction of long-term adverse cardiac outcomes, and we did not obtain sufficient adverse event data to analyze any other VOCE predictors. Finally, macrovascular and microvascular diseases can affect coronary physiology after PCI. Evidence suggests that microvascular dysfunctions may falsify the results of FFR and be associated with adverse events after PCI (32–34). We will perform experimental and computational analyses of post-PCI microvascular dysfunction in future studies to quantify this effect.
Conclusions
This study showed that caFFR measurements are feasible, reproducible, and well-correlated with invasive wire-based FFR measurements both before and after PCI. Similar to wire-based FFR measurements, post-PCI caFFR measurements might be a useful tool for performing coronary physiological functional assessments and identifying patients with a higher risk for adverse events related to PCI.
Data Availability Statement
The original contributions presented in the study are included in the article/Supplementary Material, further inquiries can be directed to the corresponding authors.
Ethics Statement
The studies involving human participants were reviewed and approved by The institutional Ethics Committee approved the study at Beijing Hospital (decision no. 2020BJYYEC-038-01). The patients/participants provided their written informed consent to participate in this study. Written informed consent was obtained from the individual(s) for the publication of any potentially identifiable images or data included in this article.
Author Contributions
HA, NZ, and LL: study conception and design. NZ, LL, GY, HL, GT, HZ, XY, and FX: acquisition of data. HA and QZ: analysis and interpretation of data. HA: writing, review, and/or revision of the manuscript. YZ and FS: study supervision. All authors contributed to the article and approved the submitted version.
Funding
This project was supported by the Beijing Hospital Clinical Research 121 Project (BJ-2019-193).
Conflict of Interest
The authors declare that the research was conducted in the absence of any commercial or financial relationships that could be construed as a potential conflict of interest.
Acknowledgments
Thanks to Suzhou Rainmed, LTD, for providing the FlashAngio FFR System free of charge for research purposes. We also thank all participants in the study.
Supplementary Material
The Supplementary Material for this article can be found online at: https://www.frontiersin.org/articles/10.3389/fcvm.2021.654392/full#supplementary-material
Supplementary Figure 1. Subjects whose post-PCI wire-based FFR or caFFR values were lower than the cutoff values were categorized as the high-risk groups. LAD, left descending artery; FFR, fractional flow reserve; PCI, percutaneous coronary intervention; caFFR, coronary angiography-derived FFR.
References
1. Randles A, Frakes DH, Leopold JA. Computational fluid dynamics and additive manufacturing to diagnose and treat cardiovascular disease. Trends Bio. (2017) 35:1049–61. doi: 10.1016/j.tibtech.2017.08.008
2. Morris PD, Narracott A, von Tengg-Kobligk H, Silva Soto DA, Hsiao S, Lungu A, et al. Computational fluid dynamics modelling in cardiovascular medicine. Heart. (2016) 102:18–28. doi: 10.1136/heartjnl-2015-308044
3. Xu B, Tu S, Qiao S, Qu X, Chen Y, Yang J, et al. Diagnostic accuracy of angiography-based quantitative flow ratio measurements for online assessment of coronary stenosis. J Am Coll Cardiol. (2017) 70:3077–87. doi: 10.1016/j.jacc.2017.10.035
4. Fearon WF, Achenbach S, Engstrom T, Assali A, Shlofmitz R, Jeremias A, et al. Accuracy of fractional flow reserve derived from coronary angiography. Circulation. (2019) 139:477–84. doi: 10.1161/CIRCULATIONAHA.118.037350
5. Li J, Gong Y, Wang W, Yang Q, Liu B, Lu Y, et al. Accuracy of computational pressure-fluid dynamics applied to coronary angiography to derive fractional flow reserve: FLASH FFR. Cardiovasc Res. (2020) 116:1349–56. doi: 10.1093/cvr/cvz289
6. Masdjedi K, van Zandvoort LJC, Balbi MM, Gijsen FJH, Ligthart JMR, Rutten MCM, et al. Validation of a three-dimensional quantitative coronary angiography-based software to calculate fractional flow reserve: the FAST study. EuroIntervention. (2020) 16:591–9. doi: 10.4244/EIJ-D-19-00466
7. Popma JJ. Coronary Angiography and Intravascular Ultrasound Imaging. In: Zipes DP, Libby P, Bonow RO, Braunwald E, editors. Braunwald's Heart Disease: A Textbook of Cardiovascular Medicine. 7th ed. St. Singapore: Elsevier Pre Ltd. (2006). p. 423–56.
8. Biscaglia S, Tebaldi M, Brugaletta S, Cerrato E, Erriquez A, Passarini G, et al. Prognostic value of QFR measured immediately after successful stent implantation: the international multicenter prospective HAWKEYE study. JACC Cardiovasc Interv. (2019) 12:2079–88. doi: 10.1016/j.jcin.2019.06.003
9. Kogame N, Takahashi K, Tomaniak M, Chichareon P, Modolo R, Chang CC, et al. Clinical implication of quantitative flow ratio after percutaneous coronary intervention for 3-vessel disease. JACC Cardiovasc Interv. (2019) 12:2064–75. doi: 10.1016/j.jcin.2019.08.009
10. Hakeem A, Uretsky BF. Role of postintervention fractional flow reserve to improve procedural and clinical outcomes. Circulation. (2019) 139:694–706. doi: 10.1161/CIRCULATIONAHA.118.035837
11. Pijls NH, De Bruyne B, Peels K, Van Der Voort PH, Bonnier HJ, Bartunek J Koolen JJ, et al. Measurement of fractional flow reserve to assess the functional severity of coronary-artery stenoses. N Engl J Med. (1996) 334:1703–8. doi: 10.1056/NEJM199606273342604
12. Ragosta M, Bishop AH, Lipson LC, Watson DD, Gimple LW, Sarembock IJ, et al. Comparison between angiography and fractional flow reserve versus single-photon emission computed tomographic myocardial perfusion imaging for determining lesion significance in patients with multivessel coronary disease. Am J Cardiol. (2007) 99:896–902. doi: 10.1016/j.amjcard.2006.11.035
13. Pijls NH, van Schaardenburgh P, Manoharan G, Boersma E, Bech JW, van't Veer M, et al. Percutaneous coronary intervention of functionally nonsignificant stenosis: 5-year follow-up of the DEFER study. J Am Coll Cardiol. (2007) 49:2105–11. doi: 10.1016/j.jacc.2007.01.087
14. Pijls NH, Fearon WF, Tonino PA, Siebert U, Ikeno F, Bornschein B, et al. Fractional flow reserve versus angiography for guiding percutaneous coronary intervention in patients with multivessel coronary artery disease: 2-year follow-up of the FAME (fractional flow reserve versus angiography for multivessel evaluation) study. J Am Coll Cardiol. (2010) 56:177–84. doi: 10.1016/j.jacc.2010.04.012
15. De Bruyne B, Pijls NH, Kalesan B, Barbato E, Tonino PA, Piroth Z, et al. Fractional flow reserve-guided PCI versus medical therapy in stable coronary disease. N Engl J Med. (2012) 367:991–1001. doi: 10.1056/NEJMoa1205361
16. Patel MR, Calhoon JH, Dehmer GJ, Grantham JA, Maddox TM, Maron DJ, et al. ACC/AATS/AHA/ASE/ASNC/SCAI/SCCT/STS 2017 appropriate use criteria for coronary revascularization in patients with stable ischemic heart disease: a report of the American college of cardiology appropriate use criteria task force, American association for thoracic surgery, American heart association, American society of echocardiography, American society of nuclear cardiology, society for cardiovascular angiography and interventions, society of cardiovascular computed tomography, and society of thoracic surgeons. J Am Coll Cardiol. (2017) 69:2212–41. doi: 10.1016/j.jacc.2017.02.001
17. Neumann FJ, Sousa-Uva M, Ahlsson A, Alfonso F, Banning AP, Benedetto U, et al. 2018 ESC/EACTS guidelines on myocardial revascularization. Eur Heart J. (2019) 40:87–165. doi: 10.1093/eurheartj/ehy394
18. Pijls NH, Klauss V, Siebert U, Powers E, Takazawa K, Fearon WF, et al. Coronary pressure measurement after stenting predicts adverse events at follow-up: a multicenter registry. Circulation. (2002) 105:2950–4. doi: 10.1161/01.CIR.0000020547.92091.76
19. Li SJ, Ge Z, Kan J, Zhang JJ, Ye F, Kwan TW, et al. Cutoff value and long-term prediction of clinical events by FFR measured immediately after implantation of a drug-eluting stent in patients with coronary artery disease: 1- to 3-year results from the DKCRUSH VII registry study. JACC Cardiovasc Interv. (2017) 10:986–95. doi: 10.1016/j.jcin.2017.02.012
20. Driessen RS, Danad I, Stuijfzand WJ, Schumacher SP, Knuuti J, Mäki M, et al. Impact of revascularization on absolute myocardial blood flow as assessed by serial [15O]H2O positron emission tomography imaging: a comparison with fractional flow reserve. Circ Cardiovasc Imaging. (2018) 11:e007417. doi: 10.1161/CIRCIMAGING.117.007417
21. Lee JM, Hwang D, Choi KH, Rhee TM, Park J, Kim HY, et al. Prognostic implications of relative increase and final fractional flow reserve in patients with stent implantation. JACC Cardiovasc Interv. (2018) 11:2099–109. doi: 10.1016/j.jcin.2018.07.031
22. van Bommel RJ, Masdjedi K, Diletti R, Lemmert ME, van Zandvoort L, Wilschut J, et al. Routine fractional flow reserve measurement after percutaneous coronary intervention. Circ Cardiovasc Interv. (2019) 12:e007428. doi: 10.1161/CIRCINTERVENTIONS.118.007428
23. Wolfrum M, Fahrni G, de Maria GL, Knapp G, Curzen N, Kharbanda RK, et al. Impact of impaired fractional flow reserve after coronary interventions on outcomes: a systematic review and meta-analysis. BMC Cardiovasc Disord. (2016) 16:177. doi: 10.1186/s12872-016-0355-7
24. Agarwal SK, Kasula S, Hacioglu Y, Ahmed Z, Uretsky BF, Hakeem A. Utilizing post-intervention fractional flow reserve to optimize acute results and the relationship to long-term outcomes. JACC Cardiovasc Interv. (2016) 9:1022–31. doi: 10.1016/j.jcin.2016.01.046
25. Parikh RV, Liu G, Plomondon ME, Sehested TSG, Hlatky MA, Waldo SW, et al. Utilization and outcomes of measuring fractional flow reserve in patients with stable ischemic heart disease. J Am Coll Cardiol. (2020) 75:409–19. doi: 10.1016/j.jacc.2019.10.060
26. Toth GG, Toth B, Johnson NP, De Vroey F, Di Serafino L, Pyxaras S, et al. Revascularization decisions in patients with stable angina and intermediate lesions: results of the international survey on interventional strategy. Circ Cardiovasc Interv. (2014) 7:751–9. doi: 10.1161/CIRCINTERVENTIONS.114.001608
27. Piroth Z, Toth GG, Tonino PAL, Barbato E, Aghlmandi S, Curzen N, et al. Prognostic value of fractional flow reserve measured immediately after drug-eluting stent implantation. Circ Cardiovasc Interv. (2017) 10:e005233. doi: 10.1161/CIRCINTERVENTIONS.116.005233
28. Rubimbura V, Guillon B, Fournier S, Amabile N, Chi Pan C, Combaret N, et al. Quantitative flow ratio virtual stenting and post stenting correlations to post stenting fractional flow reserve measurements from the DOCTORS (Does optical coherence tomography optimize results of stenting) study population. Catheter Cardiovasc Interv. (2020) 96:1145–53. doi: 10.1002/ccd.28615
29. Masdjedi K, van Zandvoort LJ, Balbi MM, Nuis RJ, Wilschut J, Diletti R, et al. Validation of novel 3-dimensional quantitative coronary angiography based software to calculate fractional flow reserve post stenting [published online ahead of print, 2020 Oct 6]. Catheter Cardiovasc Interv. (2020) 10. doi: 10.1002/ccd.29311
30. Ely Pizzato P, Samdani AJ, Vergara-Martel A, Palma Dallan LA, Tensol Rodrigues Pereira G, Zago E, et al. Feasibility of coronary angiogram-derived vessel fractional flow reserve in the setting of standard of care percutaneous coronary intervention and its correlation with invasive FFR. Int J Cardiol. (2020) 301:45–9. doi: 10.1016/j.ijcard.2019.10.054
31. Buono A, Mühlenhaus A, Schäfer T, Trieb AK, Schmeißer J, Koppe F, et al. QFR predicts the incidence of long-term adverse events in patients with suspected CAD: feasibility and reproducibility of the method. J Clin Med. (2020) 9:220. doi: 10.3390/jcm9010220
32. Severino P, D'Amato A, Pucci M, Infusino F, Adamo F, Birtolo LI, et al. Ischemic heart disease pathophysiology paradigms overview: from plaque activation to microvascular dysfunction. Int J Mol Sci. (2020) 21:8118. doi: 10.3390/ijms21218118
33. Xu H, Liu J, Zhou D, Jin Y. Influence of microcirculation load on FFR in coronary artery stenosis model. BMC Cardiovasc Disord. (2020) 20:144. doi: 10.1186/s12872-020-01437-w
34. Severino P, D'Amato A, Netti L, Pucci M, Mariani MV, Cimino S, et al. Susceptibility to ischaemic heart disease: focusing on genetic variants for ATP-sensitive potassium channel beyond traditional risk factors [published online ahead of print, 2020 Jun 2]. Eur J Prev Cardiol. (2020). doi: 10.1177/2047487320926780
Keywords: fractional flow reserve, stable ischemic heart disease, percutaneous coronary intervention, vessel-oriented composite endpoint, coronary angiography-derived fractional flow reserve
Citation: Ai H, Zheng N, Li L, Yang G, Li H, Tang G, Zhou Q, Zhang H, Yu X, Xu F, Zhao Y and Sun F (2021) Agreement of Angiography-Derived and Wire-Based Fractional Flow Reserves in Percutaneous Coronary Intervention. Front. Cardiovasc. Med. 8:654392. doi: 10.3389/fcvm.2021.654392
Received: 16 January 2021; Accepted: 30 March 2021;
Published: 23 April 2021.
Edited by:
Kuei-Chun Wang, Arizona State University, United StatesReviewed by:
Masashi Fukunaga, Morinomiya Hospital, JapanPaolo Severino, Sapienza University of Rome, Italy
Copyright © 2021 Ai, Zheng, Li, Yang, Li, Tang, Zhou, Zhang, Yu, Xu, Zhao and Sun. This is an open-access article distributed under the terms of the Creative Commons Attribution License (CC BY). The use, distribution or reproduction in other forums is permitted, provided the original author(s) and the copyright owner(s) are credited and that the original publication in this journal is cited, in accordance with accepted academic practice. No use, distribution or reproduction is permitted which does not comply with these terms.
*Correspondence: Ying Zhao, enliamhtb2hAMTYzLmNvbQ==; Fucheng Sun, c3VuZmMyMDE2QHlhaG9vLmNvbQ==
†These authors have contributed equally to this work