Abstract
Background:
Cold exposure has been considered an essential risk factor for the global disease burden, while its role in cardiovascular diseases is still underappreciated. The increase in frequency and duration of extreme cold weather events like cold spells makes it an urgent task to evaluate the effects of ambient cold on different types of cardiovascular disease and to understand the factors contributing to the population's vulnerability.
Methods:
In the present systematic review and meta-analysis, we searched PubMed, Scopus, and Cochrane. We included original research that explored the association between cold exposure (low temperature and cold spell) and cardiovascular disease outcomes (mortality and morbidity). We did a random-effects meta-analysis to pool the relative risk (RR) of the association between a 1°C decrease in temperature or cold spells and cardiovascular disease outcomes.
Results:
In total, we included 159 studies in the meta-analysis. As a result, every 1°C decrease in temperature increased cardiovascular disease-related mortality by 1.6% (RR 1.016; [95% CI 1.015–1.018]) and morbidity by 1.2% (RR 1.012; [95% CI 1.010–1.014]). The most pronounced effects of low temperatures were observed in the mortality of coronary heart disease (RR 1.015; [95% CI 1.011–1.019]) and the morbidity of aortic aneurysm and dissection (RR 1.026; [95% CI 1.021–1.031]), while the effects were not significant in hypertensive disease outcomes. Notably, we identified climate zone, country income level and age as crucial influential factors in the impact of ambient cold exposure on cardiovascular disease. Moreover, the impact of cold spells on cardiovascular disease outcomes is significant, which increased mortality by 32.4% (RR 1.324; [95% CI 1.2341.421]) and morbidity by 13.8% (RR 1.138; [95% CI 1.015–1.276]).
Conclusion:
Cold exposure could be a critical risk factor for cardiovascular diseases, and the cold effect varies between disease types and climate zones.
Systematic Review Registration:
https://www.crd.york.ac.uk/PROSPERO, identifier: CRD42022347247.
1. Introduction
Climate change has a significant impact on human health and has become a global health concern (1–3). Global disease burden 2019 reported that non-optimal temperatures accounted for 1.01 million deaths in males and 0.946 million in females (1). Despite the long-term warming trends, there is an increase in the number, frequency, and duration of extreme weather events such as cold spells, which makes cold exposure a more significant threat (4, 5). It has been reported that for every 1°C temperature decrease below the reference point, the rate of non-accidental mortality increases by 4% (6). Therefore, it is crucial to clarify the impact of cold exposure on human health outcomes.
Cardiovascular diseases (CVDs) are the leading cause of disease burden, accounting for nearly one-third of total deaths worldwide (1). In many countries, CVD mortality is higher in winter than in summer (7, 8). As reported, sudden exposure to low temperatures could disturb cardiovascular activity (9, 10). Cold exposure induces an increase in blood pressure and changes in blood components, which could induce disease conditions such as hypertension, myocardial infarction (MI), and atherosclerosis (7, 11, 12). This evidence suggests that cold exposure might be an essential risk factor for cardiovascular diseases and increase the health burden. Considering the increasing intensity and frequency of cold surges and cold spells (4), it is vital to demonstrate the impact of cold exposure on cardiovascular diseases.
Previous studies have reported a positive association between cold exposure and cardiovascular mortality and morbidity (6, 11, 13, 14). However, the extent of cold impact on cardiovascular health remains disputable. Specifically, Ren et al. reported a 14.3% increase in cardiovascular mortality followed by every 1°C decrease in temperature (15), while Bai et al. found only a 1.1% increase (16). The wide variation between studies hinders a proper understanding of cold impact. More importantly, the influential factors that cause variations are worth investigating. Previous meta-analyses mainly focused on cold impact on all-cause mortality, in which cardiovascular disease was discussed only as a subgroup. Hence, there is currently no study that systematically analyzes cold impact on different kinds of cardiovascular disease, let alone discusses the influential factors of cold impact such as climate zones. A review that focuses on cold impact on cardiovascular disease is crucial to provide more specific and detailed information on matters such as cold impact on different kinds of cardiovascular diseases, the vulnerabilities of the population, and influential factors.
Therefore, we conducted a wide-ranging search and analysis of the available epidemiological evidence concerning the effects of cold exposure (low temperatures and cold spells) on cardiovascular disease outcomes. We carried out an elaborate stratification on the included literature, examining cold impact on different kinds of diseases and exploring the susceptibility of the population to cardiovascular disease outcomes resulting from cold exposure.
2. Methods
We followed the preferred reporting items for systematic reviews and meta-analysis (PRISMA) guidelines to plan and conduct this review (17) (Supplementary Table S1), and the study protocol was registered with PROSPERO (CRD42022347247).
2.1. Literature search and selection criteria
We searched the databases of PubMed, Scopus, and Cochrane. Keywords such as “temperature”, “weather”, “climate change”, or “cold” were used for exposures. As for health outcomes, we used “cardiovascular disease”, “heart disease”, “vascular disease”, “cerebrovascular disease”, “hypertensive disease”, “myocardial infarction”, “stroke”, “heart failure”, “arrhythmia”, “cardiac arrest”, “rheumatic heart disease”, “thrombotic disease”, “pulmonary heart disease”, and “aortic aneurysm and dissection”. Peer-reviewed studies published in English before February 6, 2023, were identified. Reference lists of all selected articles were independently screened to identify additional studies left out in the initial search. These processes were developed by two investigators (JF and YC), and any differences in investigators’ decisions were discussed. The complete search strategy used for each database is outlined in Supplementary Table S2.
2.2. Eligibility criteria
In the literature search, we included studies that met the following selection criteria: (1) original, peer-reviewed articles with an independent study population; (2) articles that included information on the relationship between cold exposure and cardiovascular-related mortality (death) and morbidity (hospitalization, emergency room visit, ambulance call-out, and out-of-hospital cardiac arrest); and (3) articles categorized as a time-series study or case-crossover study. For this review and meta-analysis, articles were excluded if they reported percentiles for exposure assessment or seasonal effects rather than specific temperatures. Figure 1 presents a flow diagram of the study selection process.
Figure 1
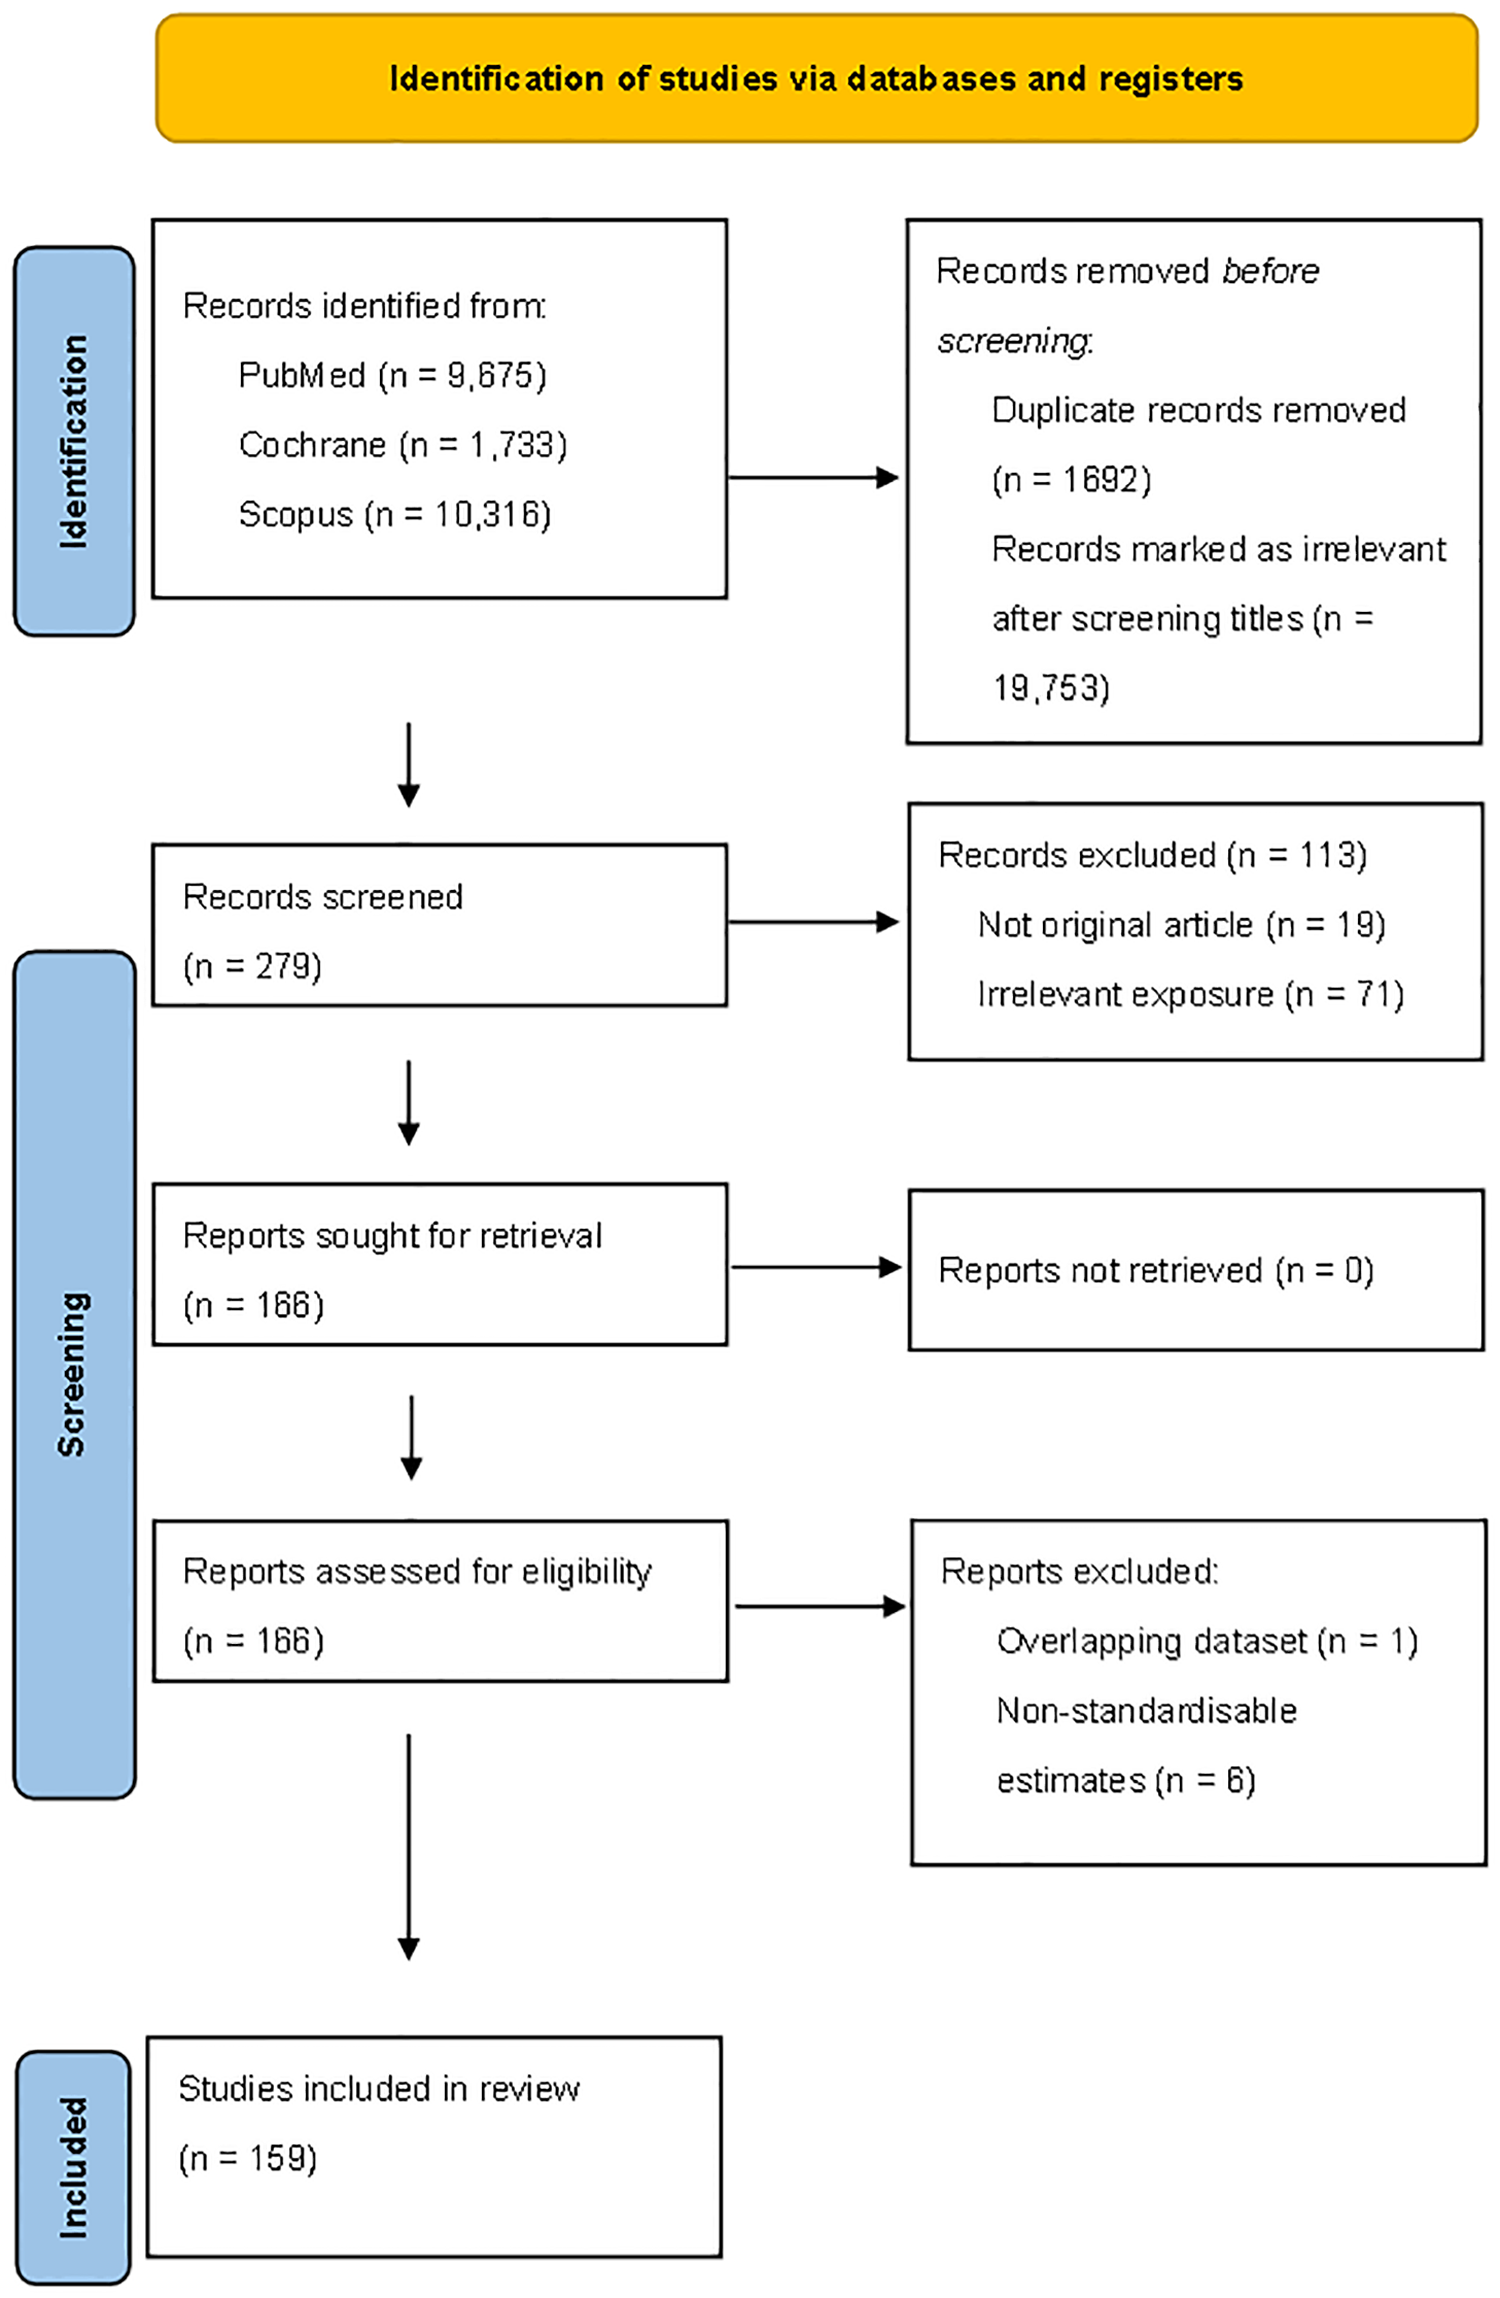
Flowchart of the assessment of eligible studies.
2.3. Data extraction
An Excel data extraction form was created to record study information on the study period, study population, exposure, outcome, and results on the effects of cold (Table 1). The summary estimates were obtained from the published tables and figures through textual descriptions and Supplementary Material. When information from the figures was imprecise or detailed data seemed available but not provided in the article, we contacted the authors to request further data. When both crude and adjusted estimates were reported, we used the adjusted estimates (18). If multiple studies were using the same data and were conducted by the same research group, we considered the results for the most recent publication. If different research groups conducted the studies, we included all of them in the pooled analysis.
Table 1
| ID | Author | Year | Location | Study period | Study design | Exposure | Mean value (°C), range | Mean value (°C) | Season | Adjusted for air pollution | Mortality/morbidity | Outcome (ICD) | Ages | Climate zones | Climate zones | Income group |
|---|---|---|---|---|---|---|---|---|---|---|---|---|---|---|---|---|
| 1 | Ren et al. | 2006 | Brisbane, Australia | 1996–2001 | TS | Mean | 15.42 (1.2 to 26) | 15.42 | Annual | PM10, O3 | Both | CVD (I00–I99) | All ages | Cfa | C-subtropical | H |
| 2 | Ferreira et al. | 2019 | Five cities, Brazil | 1996–2013 | TS | Mean | 20.5 to 26.5 (4.9 to 31.9) | 20.5 | Annual | NA | Mortality | ACS (I21–I22) | All ages | Af | A-tropical | UM |
| 3 | Analitis et al. | 2018 | Nine cities, Europe | 2004–2010 | TS | Tapp | 18.4 to 30 (NA to NA) | 23 | Cold (Oct–Mar) | PM10, O3, NO2 | Mortality | CVD (I00–I99) | All ages | Csb | C-mediterranean | H |
| 4 | Hashizume et al. | 2009 | Matlab, Bangladesh | 1994–2002 | TS | Mean | NA (NA to NA) | NA | Annual | NA | Mortality | CVD (I00–I99) | All ages | Aw | A-tropical | LM |
| 5 | Huang et al. | 2014 | Changsha, China | 2008–2011 | TS | Cold spell | NA (−5.3 to 40.7) | NA | Annual | PM10, NO2, SO2 | Mortality | CVD (I00–I99) | All ages | Cfa | C-subtropical | UM |
| 6 | Lin et al. | 2013 | Four metropolitans, Taiwan | 1994–2007 | TS | Mean | 24.2 (8.1 to 33) | 24.2 | Annual | PM10, O3, NO2 | Mortality | CVD (I00–I99) | All ages | Cfa | C-subtropical | H |
| 7 | Son et al. | 2016 | São Paulo, Brazil | 1996–2010 | TS | Mean | 20.1 (7.5 to 28.7) | 20.1 | Annual | PM2.5, PM10, O3 | Mortality | CVD (I00–I99) | All ages | Cfa | C-subtropical | UM |
| 8 | Xiong et al. | 2017 | Shanghai, China | 2011–2013 | TS | Mean | 17.4 (−2 to 36) | 17.4 | Annual | PM10, NO2, SO2 | Mortality | CVD (I00–I99) | All ages | Cfa | C-subtropical | UM |
| 9 | Ikefuti et al. | 2018 | São Paulo, Brazil | 2002–2011 | TS | Mean | 19.5 (8.4 to 27.6) | 19.5 | Annual | PM10, O3, NO2,SO2 | Mortality | Stroke (I60–I69) | All ages | Cfa | C-subtropical | UM |
| 10 | Gouveia et al. | 2003 | São Paulo, Brazil | 1991–1994 | TS | Mean | 19.3 (7 to 26.3) | 19.3 | Annual | PM10, O3, NO2, CO, SO2 | Mortality | CVD (I00–I99) | All ages | Cfa | C-subtropical | UM |
| 11 | Liu et al. | 2020 | Hong Kong, China | 2007–2015 | TS | Mean | 23.5 (8.4 to 32.4) | 23.5 | Annual | PM2.5, O3, NO2, SO2 | Mortality | CVD (I00–I99) | All ages | Cfa | C-subtropical | H |
| 12 | Guo et al. | 2011 | Tianjin, China | 2005–2007 | CC | Mean | 13 (−7 to 29) | 13 | Annual | PM10, NO2, SO2 | Mortality | CVD (I00–I99) | All ages | Dwa | D-continental | UM |
| 13 | Zhang et al. | 2014 | Five cities, China | 2004–2008 | TS | Mean | 17.12 (−10.5 to 34.2) | 17.12 | Annual | PM10, NO2 | Mortality | Stroke (I60–I69) | All ages | Dwa | D-continental | UM |
| 14 | Romani et al. | 2020 | Two cities, Spain | 2005–2017 | TS | Min | NA (−2.8 to 40.8) | NA | Annual | NA | Mortality | CVD (I00–I99) | All ages | Csb | C-mediterranean | H |
| 15 | Dai et al. | 2015 | Shanghai, China | 2006–2011 | TS | Mean | 18 (−2 to 34) | 18 | Annual | PM2.5, PM10, O3, NO2, CO, SO2 | Mortality | CHD (I20–I25) | All ages | Cfa | C-subtropical | UM |
| 16 | Silveira et al. | 2019 | 27 cities, Brazil | 2000–2015 | TS | Mean | 18.9 to 28.9 (3.8 to 36) | 23.9 | Annual | NA | Mortality | CVD (I00–I99) | All ages | Multi | Multi | UM |
| 17 | Guo et al. | 2012 | Chiang Mai, Thailand | 1999–2008 | TS | Mean | 26.2 (13.3 to 33.5) | 26.2 | Annual | PM10, O3 | Mortality | CVD (I00–I99) | All ages | Aw | A-tropical | UM |
| 18 | Seposo et al. | 2015 | Manila, Philippines | 2006–2010 | TS | Mean | 28.8 (23.5 to 33.3) | 18.8 | Annual | NA | Mortality | CVD (I00–I99) | All ages | Aw | A-tropical | LM |
| 19 | Zhang et al. | 2016 | Wuhan, China | 2003–2010 | TS | Mean | 17.9 (−2.7 to 35.8) | 17.9 | Annual | PM10, NO2, SO2 | Mortality | CVD (I00–I99) | All ages | Cfa | C-subtropical | UM |
| 20 | Yang et al. | 2012 | Guangzhou, China | 2003–2007 | CC | Mean | 23 (2.1 to 34.2) | 23 | Annual | PM10, NO2, SO2 | Mortality | CVD (I00–I99) | All ages | Cfa | C-subtropical | UM |
| 21 | Yu et al. | 2011 | Brisbane, Australia | 1996–2004 | TS | Mean | 20.1 (9.8 to 31.9) | 20.1 | Summer | PM10, O3, NO2 | Mortality | CVD (I00–I99) | All ages | Cfa | C-subtropical | H |
| 22 | Yu et al. | 2011 | Brisbane, Australia | 1996–2004 | TS | Mean | 20.1 (15.4 to 25.2) | 20.1 | Annual | PM10, O3, NO2 | Mortality | CVD (I00–I99) | All ages | Cfa | C-subtropical | H |
| 23 | Kwon et al. | 2015 | South Korea | 2004–2012 | TS | Min | 24.19 (10.2 to 32.7) | 24.19 | Cold (Dec–Feb) | PM10, O3, NO2, CO, SO2 | Mortality | CVD (I00–I99) | All ages | Multi | Multi | H |
| 24 | Ma et al. | 2020 | Jiangsu, China | 2015–2017 | TS | Mean | 13.9 (−11.5 to 30.6) | 13.9 | Annual | PM2.5, O3, NO2, CO, SO2 | Both | CVD (I00–I99) | All ages | Cfa | C-subtropical | UM |
| 25 | Ballester et al. | 1997 | Valencia, Spain | 1991–1993 | TS | Mean | 22 (NA to NA) | 22 | Cold (Nov–Apr) | SO2 | Mortality | CVD (I00–I99) | All ages | BSk | B-dry | H |
| 26 | Silveira et al. | 2021 | Rio de Janeiro, Brazil | 2001–2018 | CC | Mean | 24.7 (15.5 to 35) | 24.7 | Annual | NA | Mortality | CVD (I00–I99) | All ages | Aw | A-tropical | UM |
| 27 | Zhai et al. | 2022 | Qingdao, China | 2009–2017 | TS | Mean | 14.5 (NA to NA) | 14.5 | Annual | NA | Mortality | CVD (I00–I99) | All ages | Cwa | C-subtropical | UM |
| 28 | Ma et al. | 2014 | 17 cities, China | 1996–2008 | TS | Mean | 15.3 (−23.7 to 36.4) | 15.3 | Annual | PM10, NO2, SO2 | Mortality | CVD (I00–I99) | All ages | Multi | Multi | UM |
| 29 | O'Neill et al. | 2005 | Two cities, Mexico | 1996–1998 | TS | Tapp | 19.9 (−2.7 to 42.1) | 19.9 | Annual | PM10, O3 | Mortality | CVD (I00–I99) | All ages | Cwb | C-oceanic | UM |
| 30 | Yi and Chan | 2015 | Hong Kong, China | 2002–2011 | TS | Mean | 23.4 (8.2 to 31.8) | 23.4 | Annual | PM10, NO2, SO2 | Mortality | CVD (I00–I99) | All ages | Cfa | C-subtropical | H |
| 31 | Xing et al. | 2020 | Beijing, China | 2006–2011 | TS | Mean | 12.56 (−14.1 to 33) | 12.56 | Annual | PM2.5, O3, NO2, SO2 | Mortality | CVD (I00–I99) | All ages | Dwa | D-continental | UM |
| 32 | Sharovsky et al. | 2004 | São Paulo, Brazil | 1996–1998 | TS | Mean | 19.3 (8.8 to 28.3) | 19.3 | Annual | PM10, NO2, CO | Mortality | ACS (I21–I22) | All ages | Cfa | C-subtropical | UM |
| 33 | Achebak et al. | 2018 | 47 cities, Spain | 1980–2015 | TS | Mean | NA (NA to NA) | NA | Summer months | NA | Mortality | CVD (I00–I99) | All ages | Multi | Multi | H |
| 34 | Lin et al. | 2020 | Taiwan, China | 2000–2014 | TS | Mean | 23.3 (9.5 to 31.1) | 23.3 | Annual | PM2.5, PM10, O3, NO2, CO | Both | CVD (I00–I99) | All ages | Cfa | C-subtropical | H |
| 35 | Analitis et al. | 2007 | 15 European cities | 1990–2000 | CC | Mean | NA (NA to NA) | NA | Annual | NA | Mortality | CVD (I00–I99) | All ages | Multi | Multi | H |
| 36 | Denpetkul and Phosri | 2021 | 65 provinces, Thailand | 2010–2017 | TS | Mean | 27.48 (6.95 to 36.6) | 27.48 | Annual | NA | Mortality | CVD (I00–I99) | All ages | Aw | A-tropical | UM |
| 37 | Guo et al. | 2013 | Five cities, China | 2004–2008 | TS | Mean | 17.12 (−10.5 to 34.2) | 17.12 | Annual | PM10, NO2 | Mortality | CVD (I00–I99) | All ages | NA | NA | UM |
| 38 | Chen et al. | 2017 | Texas, United States | 1992–2011 | CC | Cold spell | 20.4 (−6.4 to 34.4) | 20.4 | Annual | NA | Mortality | CVD (I00–I99) | All ages | Dfa | D-continental | H |
| 39 | Zeka et al. | 2014 | Ireland | 1984–2007 | TS | Tapp | 5.8 (3.1 to 8.6) | 5.8 | Cold (Dec–Feb) | NA | Mortality | CVD (I00–I99) | 18+ | Cfb | C-oceanic | H |
| 40 | Medina-Ramon and Schwartz | 2007 | 50 cities, United States | 1989–2000 | CC | Min | 19.8 (18.5 to 32.1) | 19.8 | Warm (May–Sep) | NA | Mortality | CHD (I20–I25) | All ages | NA | NA | H |
| 41 | Ha and Kim | 2013 | Seoul, South Korea | 1993–2009 | TS | Mean | 24.4 (NA to NA) | 24.4 | Warm (Jun–Aug) | NA | Mortality | CVD (I00–I99) | All ages | Dwa | D-continental | H |
| 42 | Tian et al. | 2012 | Beijing, China | 2000–2011 | CC | Mean | 13.3 (−7.6 to 30.5) | 13.3 | Annual | NA | Mortality | CHD (I20–I25) | All ages | Dwa | D-continental | UM |
| 43 | Sharafkhani et al. | 2017 | Urmia, Iran | 2005–2010 | TS | Mean | NA (NA to NA) | NA | Annual | PM10, NO2, SO2 | Mortality | CVD (I00–I99) | All ages | Cfa | C-subtropical | UM |
| 44 | Pan et al. | 1995 | Taiwan, China | 1981–1991 | TS | Mean | NA (9 to 32) | NA | Annual | NA | Mortality | Stroke (I60–I69), CHD (I20–I25) | 45+ | Cfa | C-subtropical | H |
| 45 | Yang et al. | 2015 | Shanghai, China | 1981–2012 | TS | Mean | 16.9 (−4.8 to 34.6) | 16.9 | Annual | NA | Mortality | CVD (I00–I99) | All ages | Cfa | C-subtropical | UM |
| 46 | Breitner et al. | 2014 | Bavaria, Germany | 1990–2006 | TS | Mean | 9.5 (−14.2 to 29.2) | 9.5 | Annual | PM10, O3 | Mortality | CVD (I00–I99) | All ages | Dfb | D-continental | H |
| 47 | Rodrigues et al. | 2019 | Lisbon, Portugal | 2000–2013 | TS | Mean | 17.38 (4.1 to 33.3) | 17.38 | Annual | PM10 | Mortality | Stroke (I60–I69) | All ages | Csa | C-mediterranean | H |
| 48 | Chen et al. | 2014 | Six cities, China | 2009–2011 | TS | Mean | 4.9–23 (−24.2 to 33) | 15 | Annual | PM10, NO2, SO2 | Mortality | CHD (I20–I25) | All ages | NA | NA | UM |
| 49 | Chan et al. | 2012 | Hong Kong, China | 1998–2006 | TS | Mean | 27.6 (19.7 to 31.8) | 27.6 | Warm (May–Oct) | PM10, O3, NO2, SO2 | Mortality | CVD (I00–I99) | All ages | Cfa | C-subtropical | UM |
| 50 | Rocklöv et al. | 2011 | Stockholm, Sweden | 1990–2002 | TS | Tappmin | 21.6 (5.8 to 33.5) | 21.6 | Cold (Oct–Mar) | O3, NO2 | Mortality | CVD (I00–I99) | All ages | E-subarctic | H | |
| 51 | Fu et al. | 2018 | India | 2001–2013 | CC | Mean | NA (NA to NA) | NA | Annual | NA | Mortality | CVD (I00–I99) | All ages | C-subtropical | UM | |
| 52 | Goodman et al. | 2004 | Dublin, Ireland | 1980–1996 | TS | Min | 6.5 (−7.9 to 18.4) | 6.5 | Annual | PM10 | Mortality | CVD (I00–I99) | All ages | Cfb | C-oceanic | H |
| 53 | Bai et al. | 2014 | Three cities, Tibet | 2008–2012 | TS | Mean | 5.8–9.7 (−12.2 to 22.6) | 7.5 | Annual | NA | Mortality | CVD (I00–I99) | All ages | Dw(x) | D-continental | UM |
| 54 | Liu et al. | 2011 | Beijing, China | 2003–2005 | TS | Mean | 22.6 (6.9 to 32.1) | 22.6 | Cold (Oct–Mar) | PM2.5 | Mortality | CVD (I00–I99) | All ages | Dwa | D-continental | UM |
| 55 | Alahmad et al. | 2020 | Kuwait | 2010–2016 | TS | Mean | 27.9 (6.86 to 44.65) | 27.9 | Annual | PM10, O3 | Mortality | CVD (I00–I99) | All ages | BWh | B-dry | H |
| 56 | Iranpour et al. | 2020 | Ahvaz, Iran | 2014–2018 | TS | Mean | 26.95 (5.8 to 42.4) | 26.95 | Annual | PM2.5, PM10, O3, NO2, CO, SO2 | Mortality | CVD (I00–I99) | All ages | BSh | B-dry | UM |
| 57 | Yin et al. | 2019 | Beijing, China | 2010–2016 | TS | Mean | NA (−14 to 35) | NA | Annual | PM10 | Mortality | CVD (I00–I99) | All ages | Dwa | D-continental | UM |
| 58 | Chen et al. | 2018 | 272 cities, China | 2013–2015 | TS | Mean | 15 (−0.5 to 25) | 15 | Annual | PM10, O3 | Mortality | CVD (I00–I99) | All ages | NA | NA | UM |
| 59 | Hu et al. | 2019 | 89 Zhejiang counties, China | 2009–2015 | TS | Mean | 16.9 (−2 to 35.3) | 16.9 | Annual | PM10, O3 | Mortality | CVD (I00–I99) | All ages | Multi | Multi | UM |
| 60 | Yang et al. | 2015 | 15 cities, China | 2007–2013 | TS | Mean | 5.3–21.6 (−28 to 36.7) | 12 | Annual | NA | Mortality | CVD (I00–I99) | All ages | Dwa | D-continental | UM |
| 61 | Chen et al. | 2013 | Eight cities, China | 1996–2008 | TS | Mean | 16 (−22 to 34) | 16 | Annual | PM10, NO2, SO2 | Mortality | Stroke (I60–I69) | All ages | Multi | Multi | UM |
| 62 | Zhang et al. | 2021 | Ganzhou, China | 2015–2019 | TS | Mean | 20.4 (−3 to 39) | 20.4 | Annual | PM2.5, PM10, O3, NO2, CO, SO2 | Mortality | CVD (I00–I99) | All ages | Cfa | C-subtropical | UM |
| 63 | Rocklov and Forsberg | 2008 | Stockholm, Sweden | 1998–2003 | TS | Mean | NA (NA to NA) | NA | Annual | NA | Mortality | CVD (I00–I99) | All ages | Cfb | E-subarctic | H |
| 64 | Yatim et al. | 2021 | Klang Valley, Malaysia | 2006–2015 | TS | Mean | 27.7 (23.5 to 30.9) | 27.7 | Annual | PM10, O3 | Mortality | CVD (I00–I99) | All ages | Af | A-tropical | UM |
| 65 | Xu et al. | 2022 | Jiangsu, China | 2015–2019 | CC | Mean | NA (3.2–27.8) | NA | Annual | PM2.5, PM10, O3, NO2, CO, SO2 | Mortality | CVD (I00–I99) | All ages | Cfa | C-subtropical | UM |
| 66 | Schlte et al. | 2021 | seven geographic regions in Switzerland | 1998–2016 | TS | Mean | 22 (3 to 40) | 22 | Annual | NA | Both | CVD (I00–I99) | All ages | D-continental | H | |
| 67 | Lu et al. | 2021 | Queensland, Australia | 1997–2013 | CC | Mean | 23.4 (−8.9 to 48.3) | 23.4 | Annual | NA | Mortality | CVD (I00–I99) | All ages | Multi | Multi | H |
| 68 | Wang et al. | 2015 | two cities, China | 2007–2009 | TS | Mean | 15.65 (−9.4 to 34.6) | 15.65 | Annual | PM10, NO2, SO2 | Mortality | CVD (I00–I99) | All ages | Dwa | D-continental | UM |
| 69 | Polcaro-Pichet | 2019 | Quebec, Canada | 1981–2015 | CC | Mean | NA (NA to NA) | NA | Cold (Nov–Apr) | NA | Mortality | Stroke (I60–I69) | All ages | Dfb | D-continental | H |
| 70 | Klot et al. | 2012 | 48 cities in the United States | 1992–2000 | CC | Mean | NA (NA to NA) | NA | Cold (winter) | NA | Mortality | CVD (I00–I99) | All ages | Multi | Multi | H |
| 71 | Moghadamnia et al. | 2018 | Rasht, Iran | 2005–2014 | TS | Tapp | 17.38 (−2.6 to 38.6) | 17.38 | Annual | NA | Mortality | CVD (I00–I99) | All ages | Cfa | C-subtropical | UM |
| 72 | Breitner et al. | 2014 | Three regions, Germany | 1990–2006 | TS | Mean | 9.5 (−15.3 to 28.7) | 9.5 | Cold (Dec–Feb) | PM10, O3 | Mortality | CVD (I00–I99) | All ages | Cfb | C-oceanic | H |
| 73 | Chen et al. | 2019 | Augsburg, Germany | 1987–2014 | CC | Mean | 9.6 (−5.5 to 23.5) | 9.6 | Annual | PM10, O3, NO2 | Mortality | CHD (I20–I25) | All ages | Cfb | C-oceanic | H |
| 74 | Nafstad et al. | 2001 | Oslo, Norway | 1990–1995 | TS | Mean | 12.5 (NA to NA) | 12.5 | Warm (Apr–Sep) | NO2 | Mortality | CVD (I00–I99) | All ages | Dfb | E-subarctic | H |
| 75 | Zhang et al. | 2018 | Yinchuan, China | 2010–2015 | TS | Mean | 10.5 (−15 to 30.6) | 10.5 | Annual | NA | Mortality | CVD (I00–I99) | All ages | BSk | B-dry | UM |
| 76 | Gholampour et al. | 2019 | Isfahan, Iran | 2008–2016 | TS | Mean | 17.52 (−7.4 to 35.4) | 17.52 | Annual | NA | Mortality | CVD (I00–I99) | All ages | BWk | B-dry | UM |
| 77 | Tsoutsoubi et al. | 2021 | Greece | 1999–2012 | TS | Mean | NA(−3 to 42) | NA | Annual | NA | Mortality | CVD (I00–I99) | 70+ | Multi | Multi | H |
| 78 | Kim et al. | 2015 | Seoul, South Korea | 1995–2011 | TS | Mean | 12.8 (−15.7 to 30.4) | 12.8 | Annual | PM10 | Mortality | CVD (I00–I99) | All ages | Dwa | D-continental | H |
| 79 | Anderson and Bell | 2009 | 107 communities, United States | 1987–2000 | TS | Mean | NA (NA to NA) | NA | Annual | PM10, O3 | Mortality | CVD (I00–I99) | All ages | Multi | Multi | H |
| 80 | Saucy et al. | 2021 | Zurich, Switzerland | 2000–2015 | TS | Mean | 9 (−14 to 28) | 9 | Annual | PM2.5, NO2 | Mortality | CVD (I00–I99) | All ages | Cfb | C-oceanic | H |
| 81 | Ma et al. | 2021 | 47 prefectures, Japan | 1972–2015 | CC | Cold spell | NA (−0.5 to 18.6) | NA | Cold (Nov–Mar) | NA | Mortality | CVD (I00–I99) | All ages | Multi | Multi | UM |
| 82 | Ebi et al. | 2004 | Three regions, United States | 1983–1998 | TS | Min | NA (NA to NA) | NA | Annual | NA | Morbidity | CVD (I00–I99) | 55+ | Csa | C-mediterranean | H |
| 83 | Rocklov et al. | 2014 | Stockholm, Sweden | 1990–2002 | TS | Cold spell | NA (NA to NA) | NA | Annual | NO2 | Morbidity | CVD (I00–I99) | All ages | E-subarctic | H | |
| 84 | Wang et al. | 2013 | Jinan, China | 1990–2009 | TS | Mean | 15 (−10.5 to 35.8) | 15 | Annual | NA | Morbidity | Stroke (I60–I69) | All ages | Cwa | C-subtropical | UM |
| 85 | Hajat et al. | 2002 | London, United Kingdom | 1992–1995 | CC | Mean | 8.1 (NA to NA) | 8.1 | Cold (Oct–Mar) | SO2, O3, PM10 | Morbidity | CVD (I00–I99) | 65+ | Cfb | C-oceanic | H |
| 86 | Shaposhnikov et al. | 2014 | Moscow, Russia | 1992–2005 | TS | Mean | 5.5 (−17 to 25) | 5.5 | Annual | NA | Morbidity | Stroke (I60–I69) | All ages | Dfb | D-continental | UM |
| 87 | Kovats et al. | 2004 | London, United Kingdom | 1994–2000 | TS | Mean | 11.6 (3.1 to 26.7) | 11.6 | Annual | PM10, O3 | Morbidity | CVD (I00–I99) | All ages | Cfb | C-oceanic | H |
| 88 | Wu et al. | 2011 | Taiwan, China | 1994–2003 | CC | Cold spell | NA (NA to NA) | NA | Cold (Nov–Jan) | NA | Mortality | CVD (I00–I99) | All ages | Cfa | C-subtropical | UM |
| 89 | Kysely et al. | 2009 | Czech Republic | 1994–2006 | CC | Cold spell | NA (−1.9 to 21.9) | NA | Cold (Dec–Feb) | NA | Mortality | CVD (I00–I99) | 25+ | C-oceanic | H | |
| 90 | Madrigano et al. | 2013 | Worcester, United States | 1995–2003 | CC | Cold spell | 7.9 (−6.9 to 25.5) | 7.9 | Annual | PM2.5, O3 | Mortality | ACS (I21–I22) | All ages | Dfa | D-continental | H |
| 91 | Lu et al. | 2020 | Queensland, Australia | 1995–2016 | CC | Mean | 25.9 (−8.9 to 48.8) | 25.9 | Annual | NA | Morbidity | CVD (I00–I99) | All ages | Multi | Multi | H |
| 92 | Bai et al. | 2018 | Ontario, Canada | 1996–2013 | TS | Mean | NA (−33.1 to 32.2) | NA | Annual | PM10, NO2, PM2.5 | Morbidity | CVD (I00–I99) | All ages | Dfb | D-continental | H |
| 93 | Chen et al. | 2010 | Taiwan, China | 1997–2003 | TS | Cold spell | NA (NA to NA) | NA | Annual | NA | Mortality | CVD (I00–I99) | All ages | Cfa | C-subtropical | UM |
| 94 | Martinez-Solanas and Basagana | 2017 | Spain | 1997–2013 | TS | Max | 20.9 (6.88 to 34.69) | 20.9 | Annual | NA | Morbidity | CVD (I00–I99) | All ages | Multi | Multi | H |
| 95 | Mohammad et al. | 2020 | Hong Kong, China | 1998–2011 | TS | Mean | 23.52 (8.2 to 31.8) | 23.52 | Annual | PM10, NO2, O3 | Morbidity | CVD (I00–I99) | All ages | Cfa | C-subtropical | H |
| 96 | Ryti et al. | 2017 | Oulu, Finland | 1998–2011 | CC | Cold spell | 1.4 (−41.3 to 33) | 1.4 | Annual | NA | Mortality | CVD (I00–I99) | All ages | E-subarctic | H | |
| 97 | Ryti et al. | 2018 | Oulu, Finland | 1998–2011 | CC | Cold spell | 1.4 (−41.3 to 33) | 1.4 | Annual | NA | Mortality | Atherosclerotic heart disease (I25.1) | 35+ | E-subarctic | H | |
| 98 | Sartini et al. | 2016 | London, United Kingdom | 1998–2012 | TS | Cold spell | NA (NA to NA) | NA | Annual | NA | Mortality | CVD (I00–I99) | 60+ | Cfb | C-oceanic | H |
| 99 | Wichmann et al. | 2012 | Copenhagen, Denmark | 1999–2006 | CC | TappMax | 16 (0 to 30) | 16 | Annual | PM10, NO2, CO | Morbidity | ACS (I21–I22) | 18+ | Cfb | C-oceanic | H |
| 100 | Wang and Lin | 2014 | Taipei, China | 2000 –2009 | TS | Mean | 23.4 (8.3 to 33) | 23.4 | Annual | PM10, NO2, O3 | Morbidity | CVD (I00–I99) | All ages | Cfa | C-subtropical | UM |
| 101 | Liang et al. | 2008 | Taichung, China | 2000–2003 | TS | Mean | 27–29 (NA to NA) | 28 | Annual | PM10, NO2, CO, SO2, O3 | Morbidity | ACS (I21–I22) | All ages | Cfa | C-subtropical | H |
| 102 | Revich and Shaposhnikov | 2008 | Moscow, Russia | 2000–2006 | CC | Cold spell | NA (NA to NA) | NA | Annual | NA | Mortality | CHD (I20–I25), stroke (I60–I69) | All ages | Dfb | D-continental | H |
| 103 | Dahlquist et al. | 2016 | Stockholm, Sweden | 2000–2010 | CC | Mean | 7.1 (−18.2 to 25.2) | 7.1 | Annual | PM10, O3 | Morbidity | OHCA (I46) | All ages | Cfb | C-oceanic | H |
| 104 | Lin et al. | 2021 | Five cities, Taiwan, China | 2000–2014 | TS | Mean | 23.1–25.4 (NA to NA) | 14 | Annual | PM10, O3, NO2, SO2 | Morbidity | CVD (I00–I99) | 40+ | Cfa | C-subtropical | H |
| 105 | Vaičiulis et al. | 2021 | Kaunas, Lithuanian | 2000–2015 | TS | Cold spell | NA (NA to NA) | NA | Cold (Nov–Jan) | NA | Mortality | MI (I21–I23) | 25+ | D-continental | H | |
| 106 | Ma et al. | 2013 | Shanghai, China | 2001–2009 | TS | Cold spell | 17.5 (−3.4 to 39) | 17.5 | Cold (Jan–Mar) | NA | Mortality | CVD (I00–I99) | All ages | Dwa | D-continental | UM |
| 107 | Wichmann et al. | 2011 | Greater Copenhagen, Denmark | 2002–2006 | CC | Tapp | 10 (−8 to 30) | 10 | Cold (Oct–Mar) | PM10, NO2, CO | Morbidity | CVD (I00–I99) | All ages | Cfb | C-oceanic | H |
| 108 | Goggins et al. | 2017 | Hong Kong, China | 2002–2011 | TS | Mean | 23.4 (8.2 to 31.8) | 23.4 | Annual | PM10, O3 | Morbidity | CVD (I00–I99) | 0–59 ages | Cfa | C-subtropical | H |
| 109 | Kim et al. | 2021 | Seven metropolitan provinces, South Korea | 2002–2017 | TS | Mean | NA (NA to NA) | NA | Annual | PM2.5, PM10, O3, NO2, CO, SO2 | Morbidity | ACS (I21–I22) | All ages | Multi | Multi | H |
| 110 | Misailidou et al. | 2006 | Five rural regions, Greece | 2003–2004 | TS | Mean | NA (NA to NA) | NA | Annual | NA | Morbidity | ACS (I21–I22) | All ages | Multi | Multi | H |
| 111 | Vasconcelos et al. | 2013 | Lisbon and Oporto, Portugal | 2003–2007 | TS | Mean | NA (NA to NA) | NA | Cold (winter) | PM10 | Morbidity | MI (I21–I23) | All ages | Csa | C-mediterranean | H |
| 112 | Son et al. | 2014 | Eight cities, South Korea | 2003–2008 | TS | Mean | 14.1 (12.6 to 16.2) | 14.1 | Annual | NA | Morbidity | CVD (I00–I99) | All ages | Multi | Multi | H |
| 113 | Ma et al. | 2011 | Shanghai, China | 2005–2008 | TS | Cold spell | 17.7 (−3.1 to 34.1) | 17.7 | Cold (Jan–Feb) | NA | Morbidity | CVD (I00–I99) | All ages | Cfa | C-subtropical | UM |
| 114 | Cho et al. | 2018 | Seoul, South Korea | 2005–2009 | TS | Mean | 12.9 (−11.5 to 30.1) | 12.9 | Annual | O3, PM2.5 | Morbidity | Stroke (I60–I69) | All ages | Dwa | D-continental | H |
| 115 | Yamazaki and Michikawa | 2017 | Three prefectures, Japan | 2005–2012 | CC | Mean | 16.83 (NA to NA) | 16.83 | Annual | NA | Morbidity | OHCA (I46) | All ages | Cfa | C-subtropical | H |
| 116 | Bai et al. | 2014 | Lhasa, Tibet, China | 2005–2012 | TS | Max | 9.6 (−16.1 to 30.4) | 9.6 | Annual | NA | Morbidity | CVD (I00–I99) | All ages | Dwb | D-continental | UM |
| 117 | Tian et al. | 2016 | Hong Kong, China | 2005–2012 | CC | Mean | 23.4 (8.7 to 31.8) | 23.4 | Annual | NO2, PM10, O3 | Morbidity | CVD (I00–I99) | All ages | Cfa | C-subtropical | UM |
| 118 | Xu et al. | 2021 | Brisbane, Australia | 2005–2013 | CC | Mean | NA (NA to NA) | NA | Annual | PM10, NO2 | Morbidity | Stroke (I60–I69) | All ages | Cfa | C-subtropical | H |
| 119 | Moghadamnia et al. | 2018 | Rasht, Iran | 2005–2014 | TS | Tapp | 17.4 (−2.6 to 38.6) | 17.4 | Annual | NA | Morbidity | ACS (I21–I22) | All ages | Cfa | C-subtropical | UM |
| 120 | Onozuka et al. | 2017 | Japan | 2005–2014 | TS | Mean | 9.4–23.2 (−10.7 to 33.7) | 16 | Annual | NA | Morbidity | OHCA (I46) | All ages | Multi | Multi | H |
| 121 | Shin et al. | 2021 | Seoul, South Korea | 2005–2014 | CC | Min | 12.7 (NA to NA) | 12.7 | Annual | NO2, CO, SO2 | Morbidity | MI (I21–I23) | All ages | Dwa | D-continental | H |
| 122 | Cheng et al. | 2020 | Brisbane, Australia | 2005–2015 | TS | Mean | 16 (10 to 25) | 16 | Annual | PM10, NO2, | Morbidity | MI (I21–I23) | All ages | Cfa | C-subtropical | H |
| 123 | Zhou et al. | 2014 | 15 provinces in China | 2006–2010 | CC | Cold spell | NA (−1.9 to 21.9) | NA | Cold (Dec–Feb) | NA | Mortality | CVD (I00–I99) | All ages | Cfa | C-subtropical | UM |
| 124 | Ponjoan et al. | 2017 | Two regions, Spain | 2006–2013 | CC | Cold spell | 28.1 (27.3 to 29) | 28.1 | Cold (Nov–Jan) | PM10, O3, NO2, SO2, CO | Morbidity | CVD (I00–I99) | All ages | Multi | Multi | H |
| 125 | Lee et al. | 2014 | 16 cities, South Korea | 2006–2014 | TS | Mean | 13.3 (−19.5 to 37.7) | 13.3 | Annual | PM10, NO2, CO, SO2, O3,PM2.5 | Morbidity | ACS (I21–I22) | All ages | Multi | Multi | H |
| 126 | Wang et al. | 2020 | Taiwan, China | 2006–2014 | TS | Mean | 23.4 (10.6 to 31) | 23.4 | Annual | PM10,NO2, PM2.5 | Morbidity | OHCA (I46) | All ages | Cfa | C-subtropical | H |
| 127 | Moraes et al. | 2022 | São Paulo, Brazil | 2006–2015 | CC | Cold spell | NA (NA to NA) | NA | Annual | PM10 | Mortality | CVD (I00–I99) | All ages | Cfa | C-subtropical | UM |
| 128 | Chen et al. | 2019 | 31 cities, China | 2007–2013 | CC | Cold spell | NA (NA to NA) | NA | Annual | NA | Mortality | CVD (I00–I99) | All ages | Cfa | C-subtropical | UM |
| 129 | Doan et al. | 2021 | Brisbane, Australia | 2007–2019 | TS | Mean | 20.9 (10.4 to 30.1) | 20.9 | Annual | NA | Morbidity | OHCA (I46) | All ages | Cfa | C-subtropical | H |
| 130 | Giang et al. | 2014 | Thai Nguyen, Vietnam | 2008–2012 | TS | Mean | 23.6 (21 to 27.5) | 23.6 | Annual | NA | Morbidity | CVD (I00–I99) | 60+ | Cfa | C-subtropical | LM |
| 131 | Niu et al. | 2016 | Guangzhou, China | 2008–2013 | TS | Mean | 22.3 (5.1 to 33.5) | 22.3 | Annual | PM10, NO2, SO2 | Morbidity | OHCA (I46) | All ages | Cfa | C-subtropical | UM |
| 132 | Thu Dang et al. | 2019 | Two Central Coast regions, Vietnam | 2008–2015 | TS | Mean | 26.1 (15.0 to 36.9) | 26.1 | Annual | NA | Morbidity | ACS (I21–I22) | All ages | NA | NA | LM |
| 133 | Bijelović et al. | 2017 | Novi Sad, Serbia | 2010–2011 | TS | Mean | NA (NA to NA) | NA | Annual | NA | Morbidity | ACS (I21–I22) | 19+ | Cfa | C-subtropical | UM |
| 134 | Sangkharat et al. | 2020 | London, United Kingdom | 2010–2014 | TS | Mean | 11.8 (−2.2 to 25.4) | 11.8 | Annual | PM10, NO2, CO, SO2, O3, PM2.5 | Morbidity | CVD (I00–I99) | All ages | Cfb | C-oceanic | H |
| 135 | Hensel et al. | 2017 | Hamburg, Germany | 2010–2014 | TS | Mean | 10 (NA to NA) | 10 | Annual | NA | Morbidity | CVD (I00–I99) | All ages | Cfb | C-oceanic | H |
| 136 | Pourshaikhian et al. | 2019 | Rasht, Iran | 2010–2015 | TS | Tapp | 30.1 (NA to NA) | 30.1 | Warm (May–Sep) | NA | Morbidity | CVD (I00–I99) | All ages | Cfa | C-subtropical | UM |
| 137 | Zhan et al. | 2022 | Fujian province, China | 2010–2016 | TS | TappMean | 20 (−2 to 33.8) | 20 | Annual | PM10, NO2, CO, SO2 | Morbidity | CVD (I00–I99) | All ages | Cfa | C-subtropical | UM |
| 138 | Han et al. | 2017 | Jinan, China | 2011–2014 | TS | Cold spell | 14.7 (−9.4 to 34) | 14.7 | Annual | NA | Mortality | CVD (I00–I99) | All ages | Cwa | C-subtropical | UM |
| 139 | Mohammadi et al. | 2021 | Sabzevar, Iran | 2011–2017 | TS | Tapp | 12.9 (−11.2 to 45.4) | 12.9 | Annual | NA | Morbidity | CVD (I00–I99) | All ages | DSk | D-continental | UM |
| 140 | Zhao et al. | 2018 | Ningxia Hui Autonomous Region, China | 2012–2015 | TS | Mean | 8.5 (−18.6 to 29.7) | 8.5 | Annual | NO2, CO, SO2, PM2.5 | Morbidity | CVD (I00–I99) | All ages | BWk | B-dry | UM |
| 141 | Luo et al. | 2017 | Beijing, China | 2013–2014 | TS | Mean | 11.6 (−12.9 to 30.1) | 11.6 | Annual | PM2.5 | Morbidity | Stroke (I60–I69) | All ages | Cfa | C-subtropical | UM |
| 142 | Guo et al. | 2017 | Guangzhou, China | 2013–2015 | TS | Mean | NA (NA to NA) | NA | Annual | NO2, SO2, O3, PM2.5 | Morbidity | Stroke (I60–I69) | All ages | Cfa | C-subtropical | UM |
| 143 | Gao et al. | 2019 | Hefei, China | 2013–2015 | TS | Cold spell | NA (NA to NA) | NA | Annual | NO2, PM10, O3 | Morbidity | CVD (I00–I99) | All ages | Cfa | C-subtropical | UM |
| 144 | Lei et al. | 2022 | 272 cities, China | 2013–2015 | CC | Mean | NA | Annual | PM2.5, O3 | Mortality | CVD (I00–I99) | All ages | Cfa | C-subtropical | UM | |
| 145 | Liu et al. | 2018 | Beijing, China | 2013–2016 | TS | Mean | 12.8 (−16 to 32) | 12.8 | Annual | NA | Morbidity | ACS (I21–I22) | All ages | Dwa | D-continental | UM |
| 146 | Aklilu et al. | 2020 | Beijing, China | 2013–2017 | CC | Mean | 13.9 (−14.1 to 32.6) | 13.9 | Annual | PM10, NO2, CO, SO2, O3, PM2.5 | Morbidity | CVD (I00–I99) | All ages | Dwa | D-continental | UM |
| 147 | Garcı´a-Lledó et al. | 2020 | Madrid, Spain | 2013–2017 | TS | Max | NA (NA to NA) | NA | Annual | NA | Morbidity | ACS (I21–I22) | All ages | BSk | B-dry | H |
| 148 | Guo et al. | 2020 | Yancheng, China | 2013–2018 | TS | Mean | 15.2 (−4.7 to 32.9) | 15.2 | Annual | PM2.5, O3, NO2, CO, SO2 | Morbidity | ACS (I21–I22) | All ages | Cfa | C-subtropical | UM |
| 149 | Wang et al. | 2021 | Qingdao, China | 2014–2017 | TS | Mean | 14.9 (NA to NA) | 14.9 | Annual | PM10, PM2.5, SO2, NO2, CO, O3 | Morbidity | CVD (I00–I99) | All ages | Cfa | C-subtropical | UM |
| 150 | Wang et al. | 2021 | Shenzhen, China | 2015–2016 | TS | Mean | 23.5 (NA to NA) | 23.5 | Warm (May–Oct) | SO2, O3, PM2.5 | Morbidity | CVD (I00–I99) | All ages | Cfa | C-subtropical | UM |
| 151 | Cui et al. | 2019 | Hefei, China | 2015–2017 | TS | Mean | 18.1 (−5.9 to 35.6) | 18.1 | Annual | PM10, NO2, SO2 | Morbidity | CVD (I00–I99) | All ages | Cfa | C-subtropical | UM |
| 152 | Mohammad et al. | 2018 | Sweden | 2017–2018 | TS | Min | NA (−11.1 to 11.5) | NA | Annual | NO2, CO, O3, PM2.5 | Morbidity | CHD (I20–I25) | All ages | Dfb | E-subarctic | H |
| 153 | Li et al. | 2021 | Beijing, China | 2017–2019 | TS | Tapp | 10 to 12 (−6 to 33) | 11 | Annual | PM10, NO2, CO, SO2, O3, PM2.5 | Morbidity | ACS (I21–I22) | All ages | Dwa | D-continental | UM |
| 154 | Borghei et al. | 2020 | Rasht, Iran | 3-year period | TS | TappMean | 17.2 (NA to NA) | 17.2 | Annual | NA | Morbidity | OHCA (I46) | All ages | Cfa | C-subtropical | UM |
| 155 | Li et al. | 2017 | Shenyang, China | 2006–2015 | TS | Mean | 8.2 (−24.0 to 29) | 8.2 | Annual | PM10, NO2, SO2 | Morbidity | DVT (I82) | All ages | Dwa | D-continental | UM |
| 156 | Chiara et al. | 2021 | 8,084 municipalities of Italy | 2006–2015 | CC | Mean | 13.7 (−25.8 to 38.5) | 13.7 | Annual | PM2.5, PM10 | Morbidity | DVT (I82) | All ages | Cfb | C-oceanic | H |
| 157 | Chen et al. | 2022 | 11 cities, China | 2009–2019 | CC | Mean | NA (NA to NA) | NA | Annual | PM2.5, O3 | Morbidity | AAD (I71) | All ages | Cfa | C-subtropical | UM |
| 158 | Yu et al. | 2021 | Wuhan, China | 2011–2018 | TS | Mean | NA (NA to NA) | NA | Annual | SO2, NO2 | Morbidity | AAD (I71) | All ages | Cfa | C-subtropical | UM |
| 159 | Zhang et al. | 2022 | 131 cities, China | 2015–2020 | CC | Mean | NA (NA to NA) | NA | Annual | PM2.5, O3, NO2, CO, SO2 | Morbidity | AAD (I71) | All ages | Cfa | C-subtropical | UM |
Characteristics of included studies.
T-S, time series; C-C, case-crossover; Min, minimum temperature; Max, maximum temperature; Mean, mean temperature; Tapp, apparent temperature; D, daily resolution; W, weekly resolution; M, monthly resolution; ACS, acute coronary syndrome; OHCA, out-of-hospital cardiac arrest; H, high-income; UM, upper-middle income; LM, lower-middle income; NA, not available.
2.4. Study quality assessment
We further appraised the evidence included in the meta analysis by applying the risk of bias (RoB) assessment in each study and assessment of quality and strength of the body of included studies. A detailed description of the criteria for the assessments is provided in Supplementary Tables S3–S5.
2.5. Statistical analysis
A random-effects meta-analysis was used to compute the relative risk (RR) estimates associated with cold exposure. We converted all RRs to RRs associated with a 1°C decrease below the reference temperature points, assuming a log-linear relationship between mortality/morbidity and temperature below the reference temperature points (6, 19). If studies reported multiple lag RRs, we selected the lag associated with the maximum risk to conduct the meta-analysis. Subgroup analysis was carried out to analyze the vulnerabilities stratified by age, sex, national income level, and climate zones (classified by the Köppen–Geiger climate zones) (20). Subgroup interaction was employed to detect the significance of differences among subgroups.
I2 statistics and Cochrane Q were used to examine heterogeneity among effect estimates. The heterogeneity of pooled estimates with p < 0.10 (Cochrane Q test) was deemed significant (21). I2 statistics of 0%–25%, 25%–50%, and >50% indicated low, moderate, and high heterogeneity, respectively (21). Funnel plots and Egger's test were used to evaluate potential publication bias, and the Trim and Fill method was used to examine the sensitivity of the results to publication bias. Sensitivity analyses were carried out, separating studies by temperature metrics, study design (time-series or case-crossover), seasonality, lag effects, and air pollution adjustment for low-temperature exposure, and intensity (classified by cold spell duration) for cold spells. We further examined the influence of individual estimates on the pooled RRs using a leave-one-out analysis. Meta-regressions were used further to explore the heterogeneity of effects and determinants of heterogeneity. Statistical analyses were done using Stata (version 16.0).
3. Results
3.1. Search and study selection results
The initial database searches produced a total of 21,724 articles, of which 1,672 duplicate records were excluded. After screening titles and abstracts, 19,773 articles were eliminated for being irrelevant. We included 166 articles for full-text review and excluded 7: 1 because of an overlapping database (22) and 6 for providing non-standardizable estimates (23–28). Ultimately, we identified 159 studies on the basis of the inclusion criteria for the final review (Figure 1).
3.2. Study characteristic
The characteristics of the included studies presented in Table 1. Of these, 135 studies reported low-temperature effects, 21 assessed cold spell effects, and 2 examined the effects of both low temperature and cold spells. A total of 80 studies reported cardiovascular mortality, 64 studies assessed morbidity, and 4 reported both health outcomes. According to the Köppen–Geiger climate zones classification (20), 7 studies were carried out in the tropical zone, 7 in the dry zone, 5 in the Mediterranean zone, 16 in the oceanic climate zone, 63 in the subtropical zone, 29 in the continental area, and 7 in the subarctic zone (Figure 2).
Figure 2
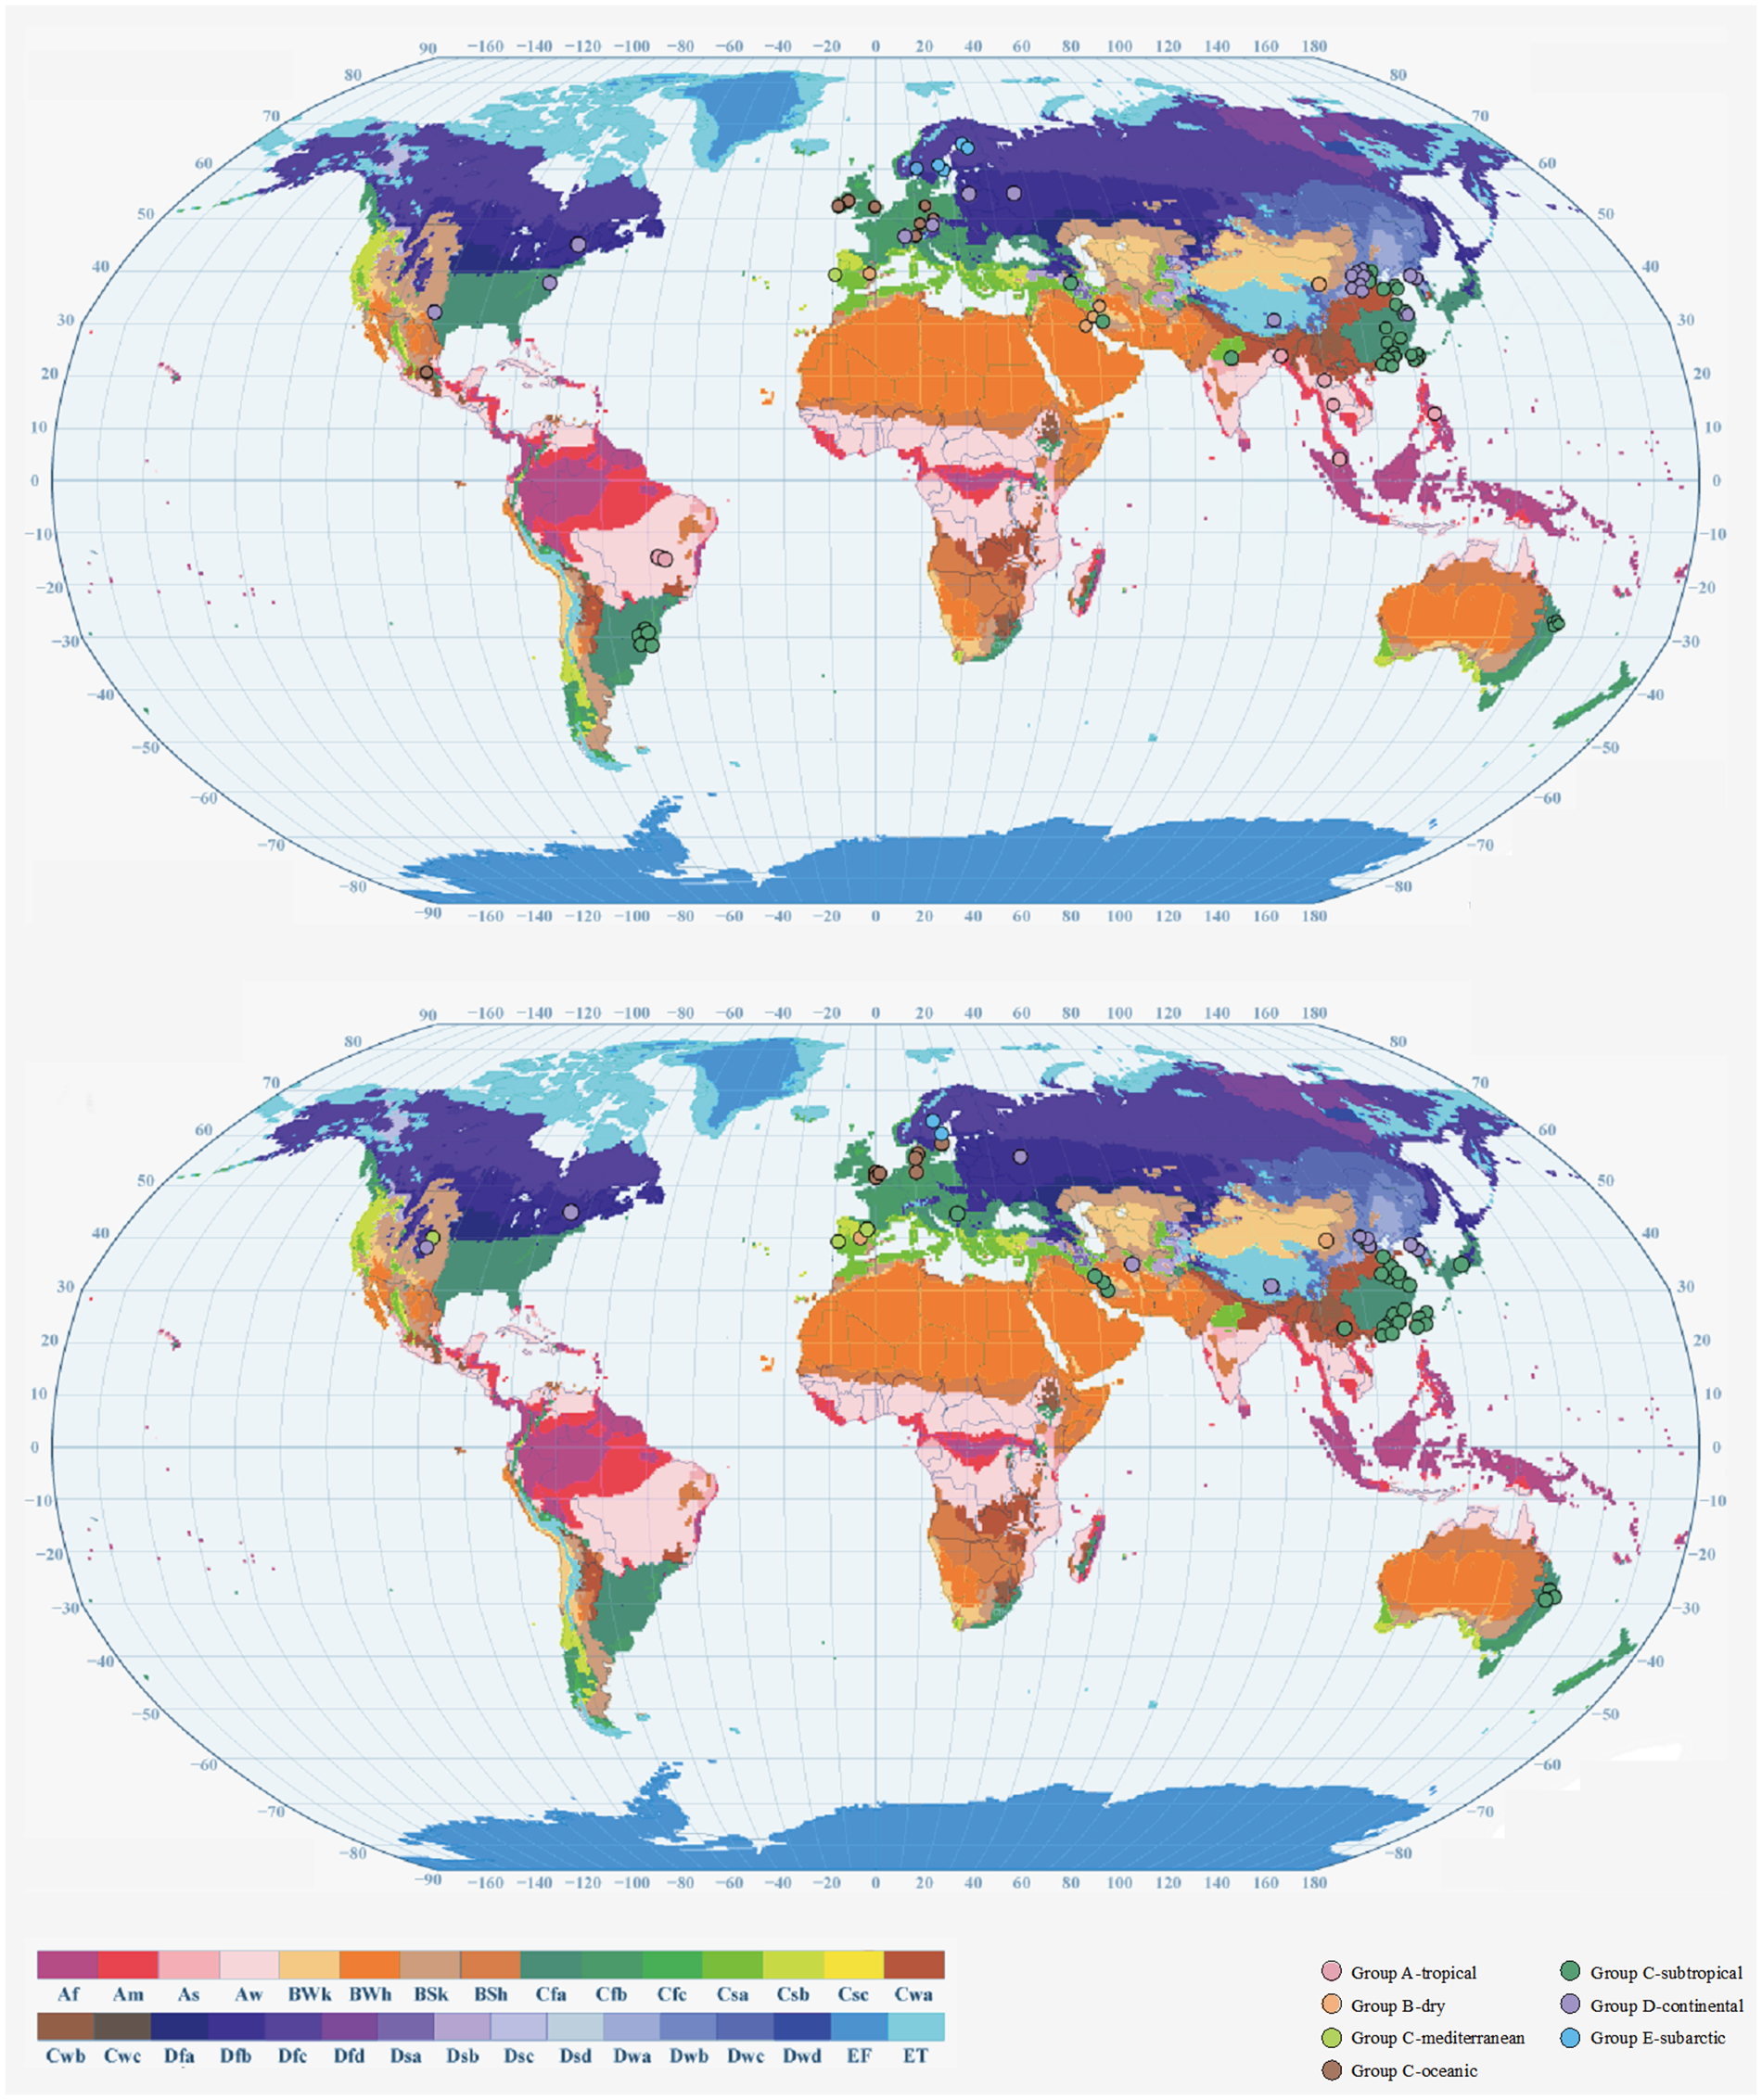
Geographical distribution of city-specific or region-specific cardiovascular disease mortality (A) and cardiovascular disease morbidity (B) estimates included in the meta-analysis by considering the Köppen–Geiger climate zone. Af, tropical rainforest climate; Am, tropical monsoon climate. Aw, tropical savanna climate. BWh, hot desert climate; BWk, cold desert climate; BSh, hot semiarid climate; BSk, cold semiarid climate; Csa, hot-summer Mediterranean climate; Csb, warm-summer Mediterranean climate; Csc, cold-summer Mediterranean climate; Cwa, monsoon-influenced humid subtropical climate; Cwb, subtropical highland climate or monsoon-influenced temperate oceanic climate; Cwc, cold subtropical highland climate or monsoon-influenced subpolar oceanic climate; Cfa, humid subtropical climate; Cfb, temperate oceanic climate; Cfc, subpolar oceanic climate; Dsa, Mediterranean-influenced hot-summer humid continental climate; Dsb, Mediterranean-influenced warm-summer humid continental climate; Dsc, Mediterranean-influenced subarctic climate; Dsd, Mediterranean-influenced extremely cold subarctic climate; Dwa, monsoon-influenced hot-summer humid continental climate; Dwb, monsoon-influenced warm-summer humid continental climate; Dwc, monsoon-influenced subarctic climate; Dwd, monsoon-influenced extremely cold subarctic climate; Dfa, hot-summer humid continental climate; Dfb, warm-summer humid continental climate; Dfc, subarctic climate; Dfd, extremely cold subarctic climate; ET, tundra climate; EF, ice cap climate.
3.3. Meta-analysis of low-temperature effects
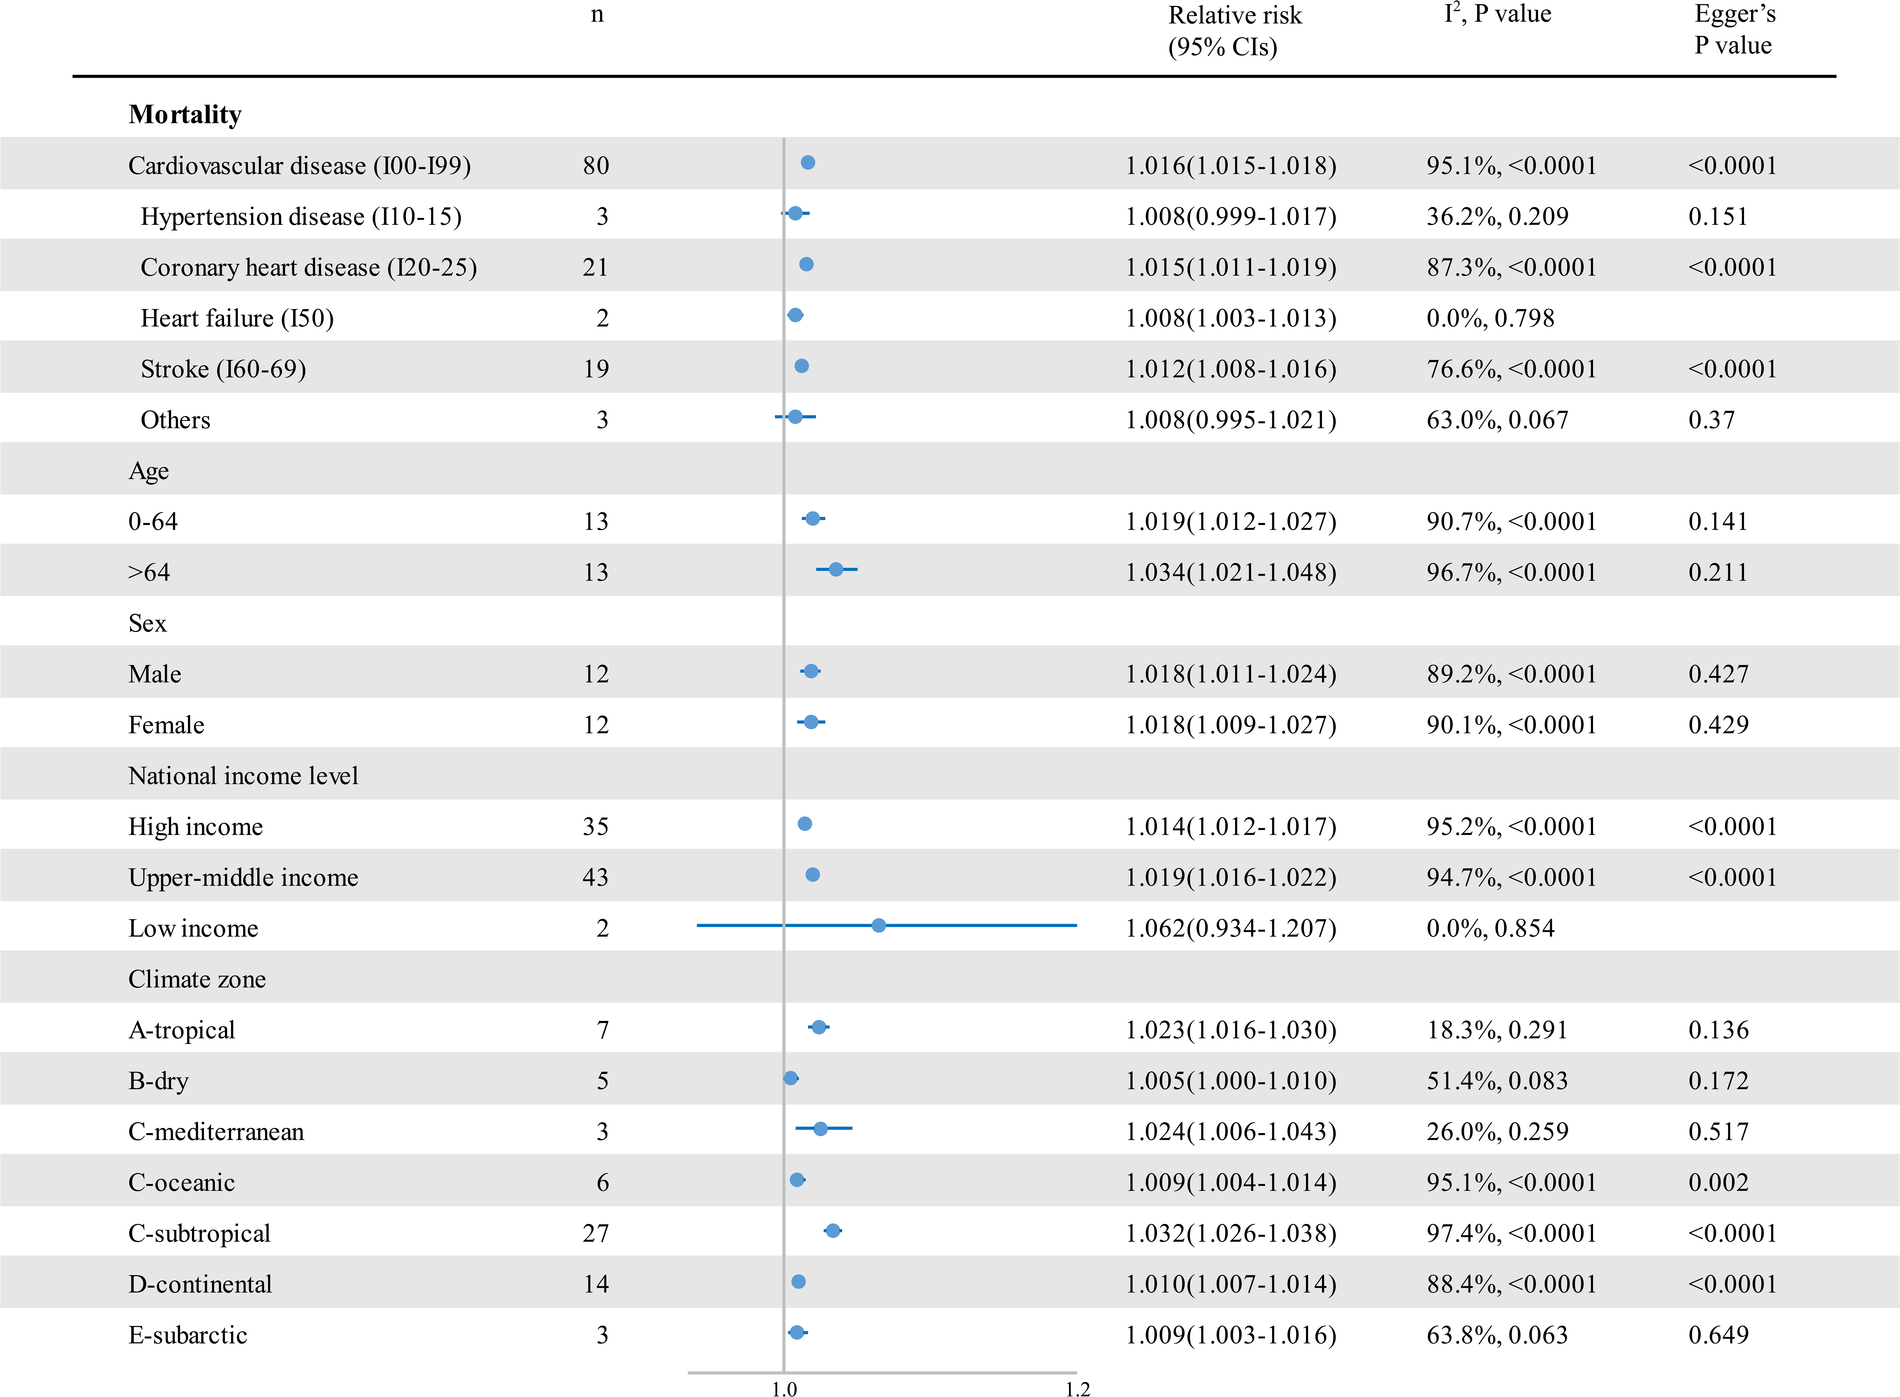
An analysis of pooled estimates showed that for every 1°C decrease in temperature, cardiovascular disease–related mortality increased by 1.6% [RR 1.016; 95% confidence interval (CI) 1.015–1.018] (Figure 3 and Supplementary Figure S1), and cardiovascular morbidity increased by 1.2% (RR 1.012; 95% CI 1.010–1.014) (Figure 4 and Supplementary Figure S2). Cause-specific analyses showed positive associations between low temperatures and the mortality of coronary heart disease (CHD) (RR 1.015; 95% CI 1.011–1.019), heart failure (HF) (RR, 1.008; 95% CI 1.003–1.013), and stroke (RR 1.012; 95% CI 1.008–1.016), while cold temperatures showed no significant association with hypertensive diseases and cardiac arrest mortality. For morbidity, low temperatures increased the morbidity of all kinds of cardiovascular diseases, apart from hypertensive diseases. Moreover, higher morbidity risks were attributable to HF (RR 1.030; [95% CI 1.013–1.048]), aortic aneurysm and dissection (AAD) (RR 1.026; 95% CI 1.021–1.031), and out-of-hospital cardiac arrest (RR 1.024; 95% CI 1.012–1.035). We further analyzed the cold effects in a population with different characteristics to explore the population's vulnerability. We found that people aged 65 or older were more vulnerable to cardiovascular disease–related mortality (p = 0.056). Considering the climate zones, a significant greater risk of cardiovascular disease–related mortality was observed in those who lived in tropical (p = 0.004) and subtropical (p < 0.001) climate zones than those in the subarctic climate zone. In addition, cardiovascular morbidity was significantly higher in people living in lower-middle-income countries than in those living in high-income and upper-middle-income countries (p = 0.002).
Figure 3
The impact of low temperatures on RR and 95% CIs for cardiovascular disease mortality in different groups. RR, relative risk; n, the number of effect estimates; CI, confidence interval.
Figure 4
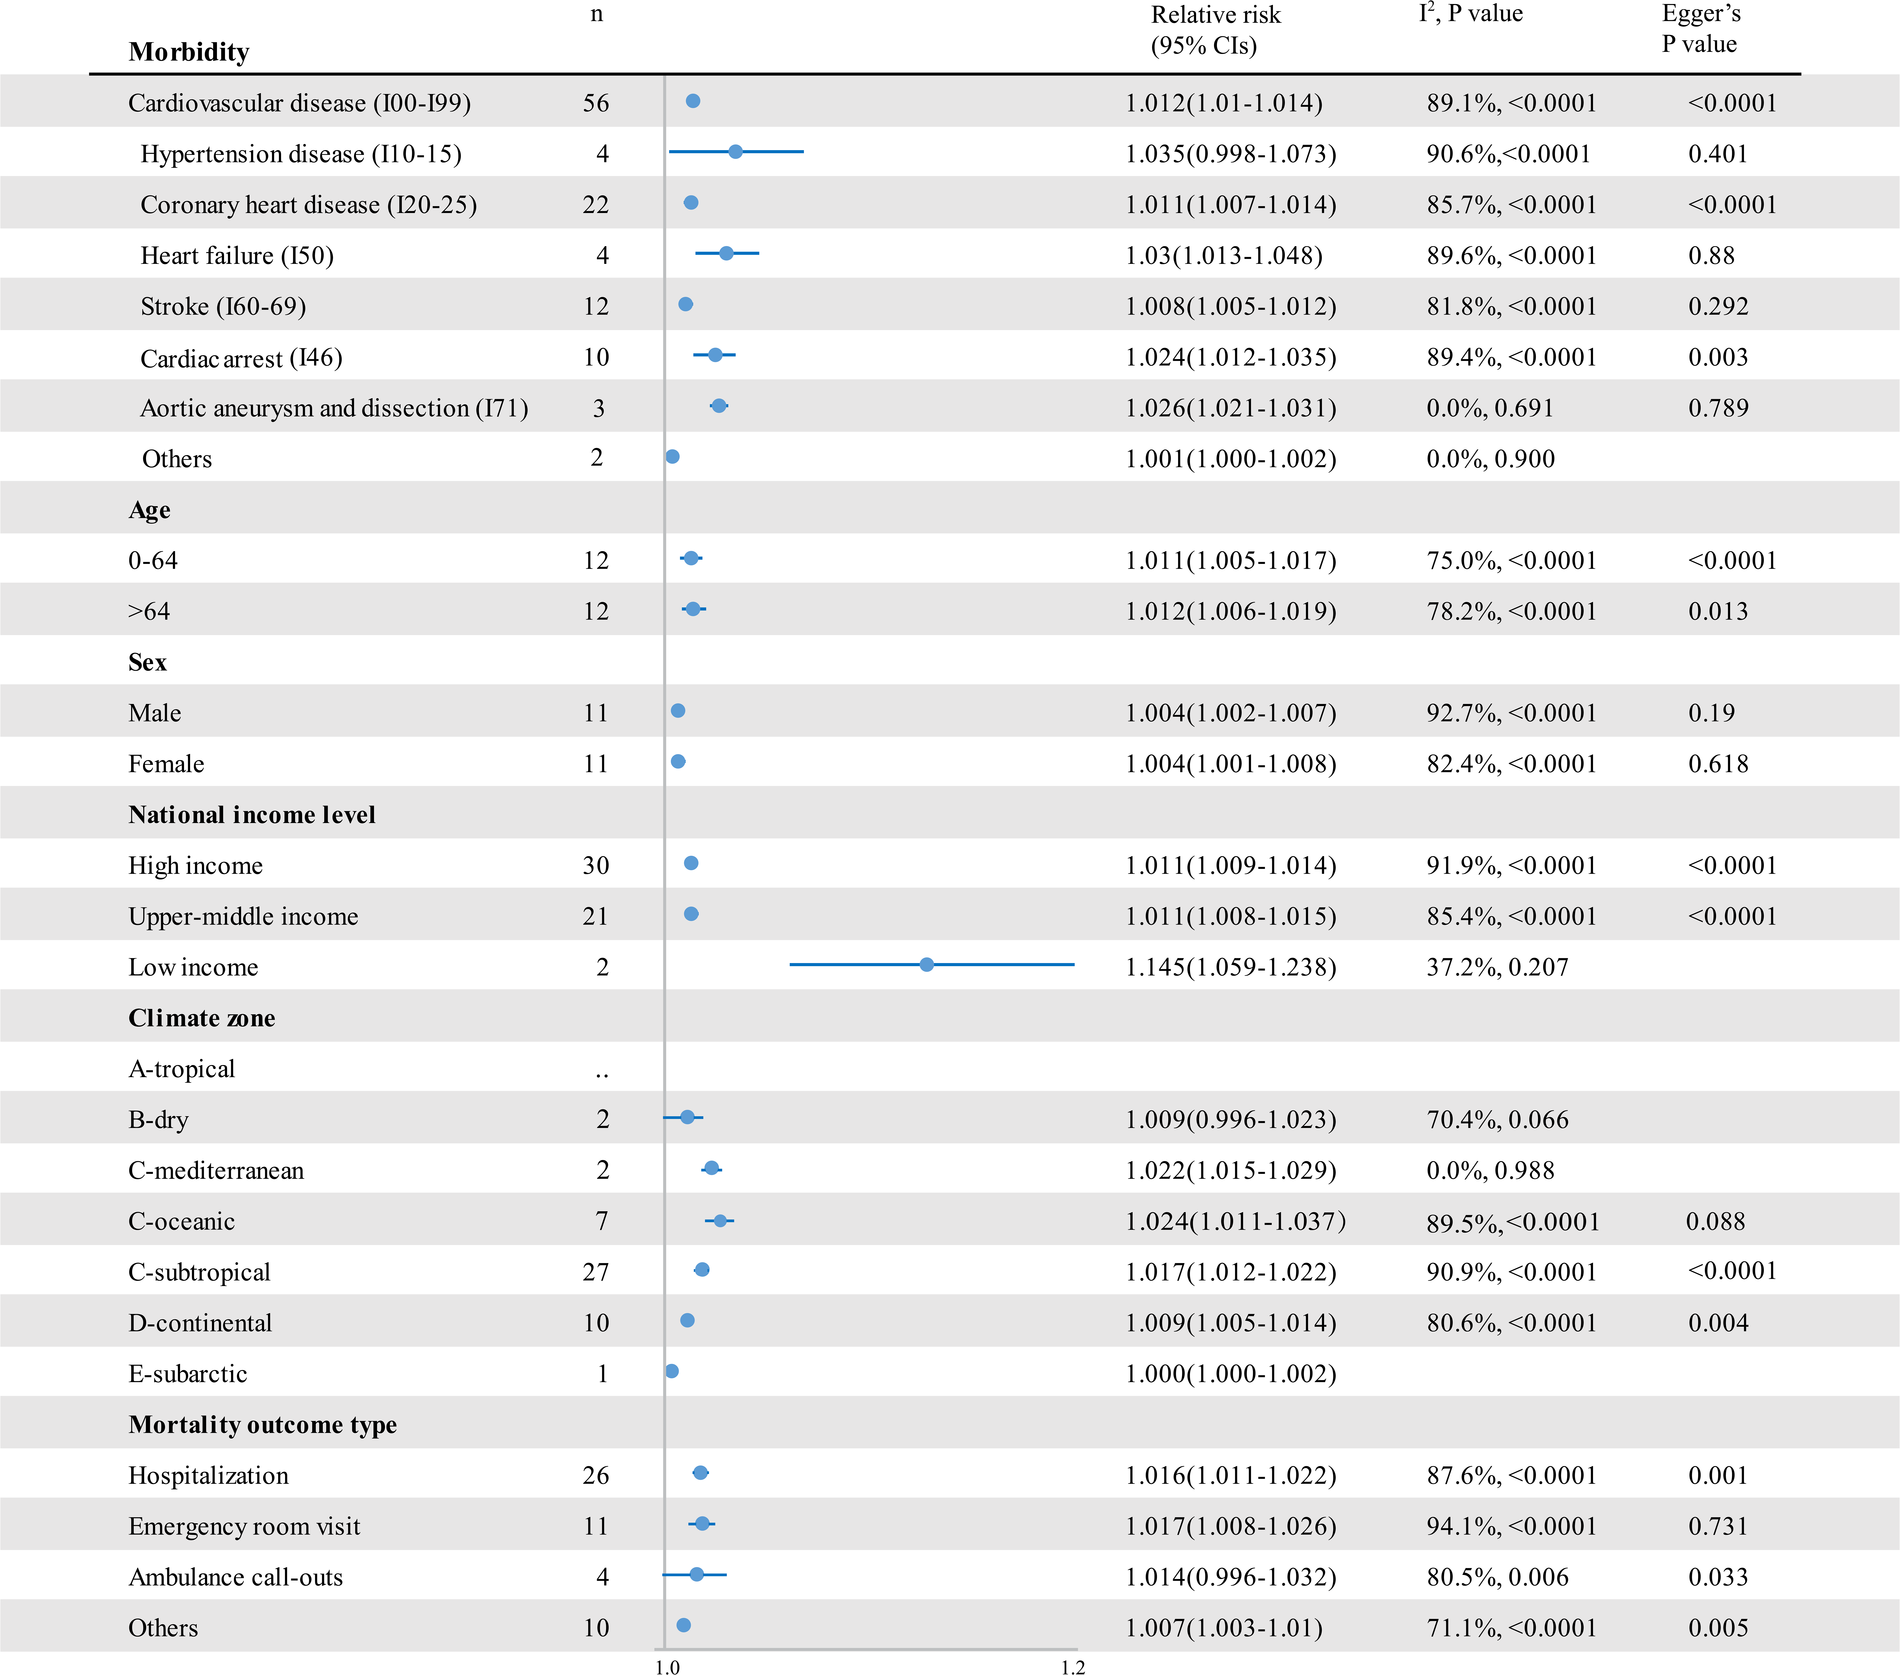
The impact of low temperatures on RR and 95% CIs for cardiovascular disease morbidity in different groups. RR, relative risk; n, the number of effect estimates; CI, confidence interval.
3.4. Meta-analysis of cold spell effects
Cold spells had a significant impact on cardiovascular outcomes, which increased cardiovascular disease–related mortality by 32.4% (RR 1.324; 95% CI 1.234–1.421) (Figure 5 and Supplementary Figure S3) and morbidity by 13.8% (RR 1.138; 95% CI 1.015–1.276) (Figure 6 and Supplementary Figure S4). There was no significant difference among cold spells of different intensities. Moreover, in the subarctic climate zone (RR 1.452; 95% CI 1.164–1.811), the effect of the cold spell on cardiovascular mortality was significantly higher than that in the continental area (p = 0.049).
Figure 5
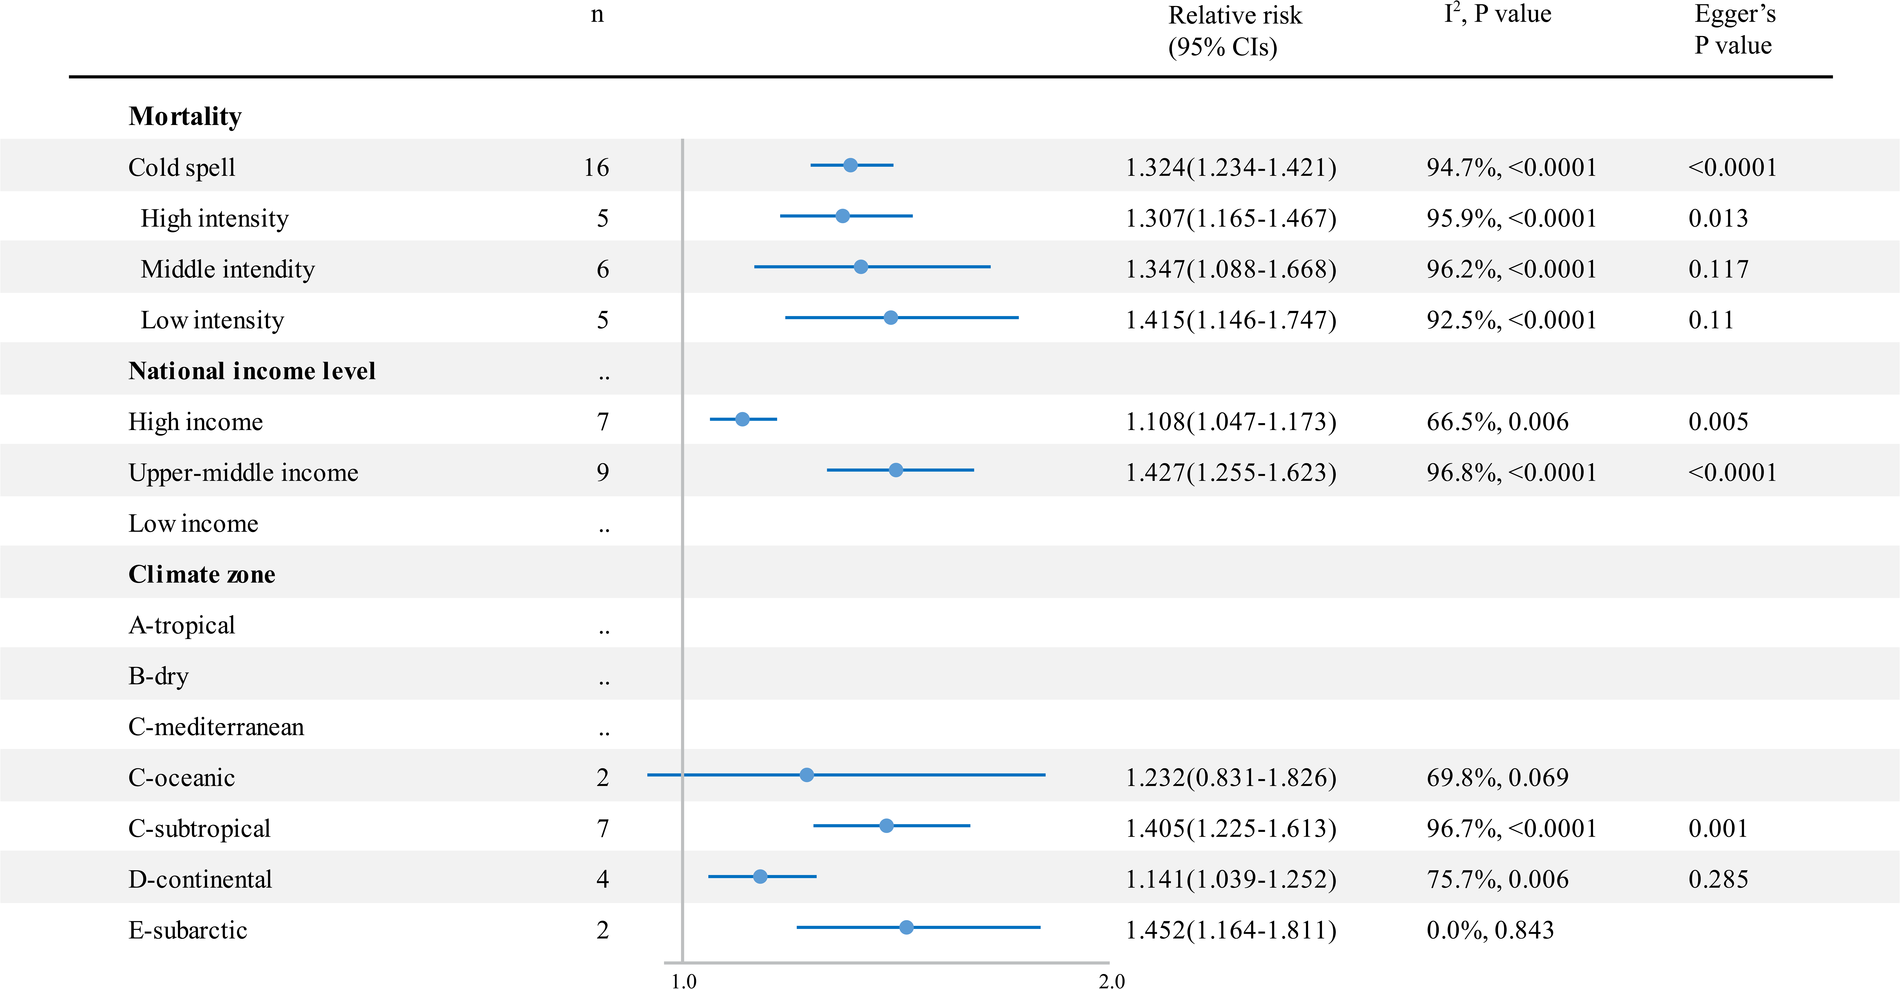
The impact of cold spells on RR and 95% CIs for cardiovascular disease mortality in different groups. RR, relative risk; n, the number of effect estimates; CI, confidence interval.
Figure 6
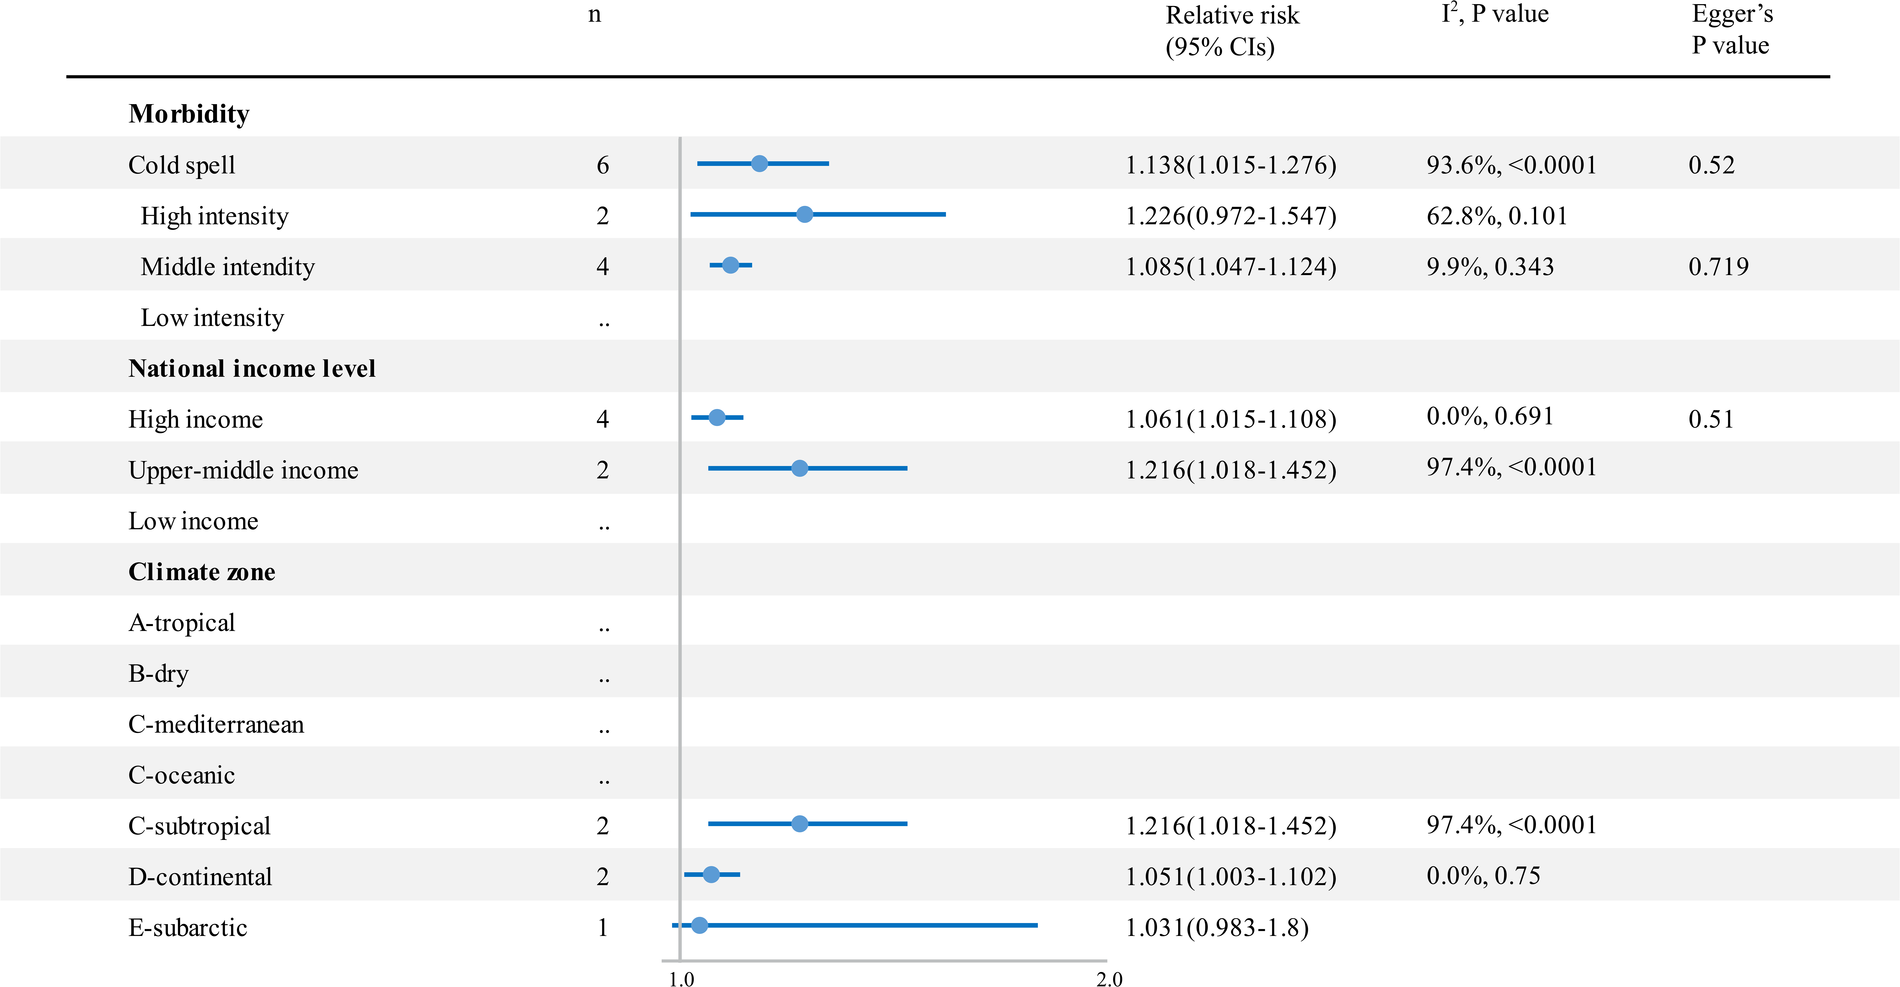
The impact of cold spells on RR and 95% CIs for cardiovascular disease morbidity in different groups. RR, relative risk; n, the number of effect estimates; CI, confidence interval.
3.5. Heterogeneity analysis
We found high heterogeneity in the summary effect estimates of low temperature (heterogeneity p-values < 0.0001, and all I2 > 50%). The stratification by sex and age did not help reduce heterogeneity, while it decreased in hypertensive disease and HF mortality stratum (Figure 3). We further conducted sensitivity analyses, finding no significant differences in the pooled RRs for the associations between cold exposure and cardiovascular disease–associated health outcomes in the leave-one-out analysis (low-temperature mortality RR 1.015–1.018; low-temperature morbidity RR 1.011–1.013). Moreover, for cardiovascular disease–related mortality and morbidity, a series of sensitivity analyses done by separating studies by temperature metrics, study design, seasonality, lag effects, and air pollution adjustment showed consistency in the direction and magnitude of the associations in the reviewed studies (Table 2). We further explored the source of heterogeneity using meta-regression (Supplementary Table S6), which showed that the lower-middle-income level was positively correlated with a 1% decrease in RRs for cold effects on cardiovascular morbidity (RR 1.124; 95% CI 1.035–1.221; p = 0.007; ref = high income level). The heterogeneity in the summary effect estimates of cold spells was large (heterogeneity p-values < 0.0001, and all I2 > 90%). The stratification of cold spell intensity only reduced the heterogeneity of the estimated morbidity RRs. No significant difference in the pooled RRs for the associations between cold spells and cardiovascular mortality was found in the leave-one-out analysis (cold spell morbidity RR 1.279–1.372). However, two (33%) studies could render the pooled effects of cold spells on cardiovascular disease morbidity insignificant when left out from the analysis.
Table 2
| k | RR | lci | uci | I2 | p | Eagger's p-value | |
|---|---|---|---|---|---|---|---|
| Adjusted for air pollution | |||||||
| PM2.5 mortality | 10 | 1.021 | 1.012 | 1.031 | 95.90% | <0.0001 | 0.013 |
| PM2.5 morbidity | 16 | 1.010 | 1.007 | 1.014 | 91.80% | <0.0001 | 0.005 |
| PM10 mortality | 40 | 1.024 | 1.019 | 1.028 | 96.40% | <0.0001 | <0.0001 |
| PM10 morbidity | 21 | 1.020 | 1.013 | 1.028 | 91.40% | <0.0001 | 0.001 |
| O3 mortality | 28 | 1.028 | 1.021 | 1.035 | 96.90% | <0.0001 | 0.003 |
| O3 morbidity | 19 | 1.028 | 1.012 | 1.027 | 92.10% | <0.0001 | 0.002 |
| NO2 mortality | 31 | 1.026 | 1.019 | 1.032 | 95.80% | <0.0001 | 0.001 |
| NO2 morbidity | 22 | 1.011 | 1.008 | 1.015 | 90.70% | <0.0001 | 0.001 |
| CO mortality | 8 | 1.025 | 1.010 | 1.040 | 96.60% | <0.0001 | 0.658 |
| CO morbidity | 5 | 1.019 | 1.008 | 1.030 | 87.20% | <0.0001 | 0.865 |
| SO2 mortality | 20 | 1.026 | 1.018 | 1.035 | 95.60% | <0.0001 | 0.068 |
| SO2 morbidity | 18 | 1.016 | 1.009 | 1.023 | 79.30% | <0.0001 | 0.001 |
| Null mortality | 28 | 1.011 | 1.009 | 1.014 | 91.10% | <0.0001 | 0.001 |
| Null morbidity | 21 | 1.007 | 1.005 | 1.009 | 89.10% | <0.0001 | <0.0001 |
| Exposure | |||||||
| Tmean mortality | 70 | 1.015 | 1.013 | 1.016 | 95.30% | <0.0001 | <0.0001 |
| Tmean morbidity | 48 | 1.014 | 1.011 | 1.017 | 90.00% | <0.0001 | <0.0001 |
| Tmax mortality | — | ||||||
| Tmax morbidity | 3 | 1.022 | 0.998 | 1.046 | 83.00% | 0.003 | 0.169 |
| Tmin mortality | 4 | 1.019 | 1.009 | 1.029 | 65.30% | 0.034 | 0.001 |
| Tmin morbidity | 3 | 1.012 | 0.996 | 1.028 | 93.70% | <0.0001 | 0.306 |
| Tapp mortality | 5 | 1.015 | 1.005 | 1.025 | 93.40% | <0.0001 | 0.168 |
| Tapp morbidity | 9 | 1.003 | 1.000 | 1.006 | 49.80% | 0.063 | 0.028 |
| Season | |||||||
| Annual mortality | 66 | 1.017 | 1.015 | 1.019 | 95.70% | <0.0001 | <0.0001 |
| Annual morbidity | 56 | 1.011 | 1.009 | 1.013 | 88.70% | <0.0001 | <0.0001 |
| Cold mortality | 9 | 1.010 | 1.006 | 1.015 | 84.20% | <0.0001 | 0.025 |
| Cold morbidity | 5 | 1.041 | 1.011 | 1.071 | 92.50% | <0.0001 | 0.235 |
| Warm mortality | 6 | 1.019 | 1.015 | 1.024 | 0.00% | 0.757 | 0.95 |
| Warm morbidity | 2 | 1.010 | 0.989 | 1.032 | 79.40% | 0.028 | — |
| Study design | |||||||
| TS mortality | 68 | 1.019 | 1.017 | 1.022 | 95.50% | <0.0001 | <0.0001 |
| TS morbidity | 48 | 1.011 | 1.090 | 1.013 | 89.80% | <0.0001 | <0.0001 |
| CC mortality | 12 | 1.007 | 1.005 | 1.008 | 83.20% | <0.0001 | 0.007 |
| CC morbidity | 14 | 1.016 | 1.009 | 1.022 | 91.50% | <0.0001 | 0.007 |
| Lag days mortality (day) | |||||||
| Cumulative 0–9 | 17 | 1.017 | 1.010 | 1.023 | 96.80% | <0.0001 | 0.142 |
| Cumulative 10–19 | 15 | 1.017 | 1.012 | 1.022 | 88.70% | <0.0001 | 0.0002 |
| Cumulative >20 | 10 | 1.025 | 1.017 | 1.034 | 96.00% | <0.0001 | 0.002 |
| Single 0–9 | 13 | 1.022 | 1.015 | 1.028 | 96.90% | <0.0001 | 0.02 |
| Single >10 | 8 | 1.022 | 1.013 | 1.032 | 92.00% | <0.0001 | 0.083 |
| Lag days morbidity (day) | |||||||
| Cumulative 0–9 | 7 | 1.005 | 1.001 | 1.009 | 74.50% | <0.0001 | 0.054 |
| Cumulative 10–19 | 4 | 1.012 | 1.003 | 1.022 | 91.80% | <0.0001 | 0.628 |
| Cumulative >20 | 12 | 1.043 | 1.029 | 1.058 | 81.30% | <0.0001 | 0.008 |
| Single 0–9 | 11 | 1.015 | 1.009 | 1.02 | 66.70% | 0.001 | 0.032 |
| Single >10 | 4 | 1.003 | 1 | 1.005 | 72.20% | 0.013 | 0.359 |
| Risk of bias (mortality) | |||||||
| Low | 10 | 1.014 | 1.009 | 1.019 | 83.20% | <0.0001 | 0.007 |
| Probably low | 67 | 1.016 | 1.015 | 1.018 | 95.50% | <0.0001 | <0.0001 |
| Probably high | 3 | 1.021 | 1.012 | 1.027 | 83.00% | 0.003 | 0.169 |
| Risk of bias (morbidity) | |||||||
| Low | 6 | 1.017 | 1.009 | 1.026 | 96.60% | <0.0001 | 0.658 |
| Probably low | 51 | 1.012 | 1.01 | 1.014 | 91.50% | <0.0001 | <0.0001 |
| Probably high | 4 | 1.023 | 1.014 | 1.027 | 93.40% | <0.0001 | 0.216 |
Sensitivity analysis of random-effects meta-analysis showing relative risk (RR) and 95% confidence intervals (CIs), for the association between low temperatures and cardiovascular disease morbidity, with every 1°C decrease in temperature.
RR, relative risk, CI, confidence interval; T-S, time series; C-C, case-crossover; Tmin, minimum temperature; Tmax, maximum temperature; Tmean, mean temperature; Tapp, apparent temperature.
3.6. Rob and study quality assessment
We assessed the RoB of the included studies and rated the overall RoB according to the key components such as exposure, outcome, and confounding bias. The details of the RoB assessment criteria and individual studies’ assessment are given in Supplementary Table S2 and Supplementary Figure S5. In summary, of the 154 (96%) studies that were rated with low risk or probably with a low risk of bias, 8 (4%) were rated with probably high risk, and no study was rated with a high risk of overall bias (Supplementary Figure S6). The initial quality rating was moderate, as the evidence was derived from observational studies. The evidence quality of studies on the effects of cold exposures (low temperature and cold spells) on cardiovascular disease–related mortality and morbidity was downgraded because of inconsistent results. All the I² >50% and 80% prediction intervals (PIs) included unity and were more than twice the random-effects meta-analysis confidence interval. Further, we upgraded the quality rating of the studies to moderate for the evident exposure-response gradients, except for the study on the effect of the cold spell on cardiovascular morbidity for its inconsistent dose response across studies (Supplementary Table S8).
4. Discussion
The present study aimed to clarify the effects of cold exposure (low temperature and cold spell) on cardiovascular disease–related health outcomes (mortality and morbidity) and explore the population’s susceptibilities to cold-induced cardiovascular diseases. We systematically reviewed 159 articles in the synthesis to strengthen the evidence on the increase in cardiovascular disease risk due to cold ambient exposures and to clarify the magnitude of cold impact. We provided new knowledge that the risk of cold exposure to cardiovascular diseases varies among climate zones. The meta-analysis indicated that following every 1°C decrease, cardiovascular-associated mortality increased by 1.6% and morbidity by 1.2%. A more substantial effect was observed in the morbidity of cardiac arrest and AAD, while the impact of cold exposure on hypertensive disease outcomes was not significant. Notably, cold spells significantly increased cardiovascular-related mortality and morbidity by 32.4% and 13.8%, respectively.
Our results update the findings of the previous studies and clarify the impact of cold exposure on cardiovascular outcomes with regard to both its direction and magnitude (11, 13, 14). Knowledge generated from previous studies was consistent in terms of direction, showing the positive association between cold exposure and cardiovascular disease outcomes, while its magnitude remained disputable. To better understand the extent of cold impact on cardiovascular disease, we conducted a wide-ranging search and analysis of current evidence with available information on daily temperature, location, and International Classification of Diseases-coded cause of death. Specifically, 80 studies exploring the association between low temperatures and cardiovascular disease were included in the meta-analysis. We found that with every 1°C drop in temperature, the RR of cardiovascular disease increased by 1.6%. We further conducted a series of sensitivity analyses by carrying out an elaborate stratification on included literature, considering the confounding factors. An analysis of different stratifications of the study also showed similar results for both direction and magnitude. These results suggested the robustness of our conclusion, which may be more in accord with the actual situation. Furthermore, we analyzed the impact of low temperatures on cardiovascular morbidity using the same method, which showed a 1.2% increase in cardiovascular mortality with every 1°C decrease. Notably, the impact of cold spells on cardiovascular disease was considerable, which increased mortality by 32.4% and morbidity by 13.8%. Our results provided the latest and unbiased evidence of the association between cold exposure and cardiovascular disease, which may help researchers better evaluate the impact of climate change.
The varied magnitude of cold impact suggests the existence of some crucial factors that could influence cold impact on cardiovascular health. Exploring these influential factors and the population’s susceptibility to cold-induced cardiovascular diseases is an important finding in our review. Here, we analyzed the cold effects in different climate conditions by stratifying the included articles using the Köppen–Geiger climate zones classification (20). As the results showed, the increased mortality caused by low-temperature exposure was more pronounced in a location with a higher mean daily temperature, such as the tropical climate zone (24.23°C; RR 1.023), Mediterranean climate zone (20.19°C; RR 1.024), and subtropical climate zone (19.78°C; RR1.032). In comparison, the cold effects were less pronounced in those with a lower mean daily temperature, such as the oceanic climate zone (10.38°C; RR 1.009), continental climate zone (14.60°C; RR 1.010), and subarctic climate zone (9.23°C; RR 1.009). Similar results have been found in clinical research worldwide (7, 29, 30). For example, Ebi and Mills reported that cold-related mortality increased significantly in regions with higher winter temperatures in the United Kingdom (29). Furthermore, Guo et al. found that the cold effects in southern China were more pronounced than in northern cities (7). Locations with higher mean temperatures tend to have higher optimal temperatures and to be intolerant to a fall in temperature, probably through physical adaptation (1). More importantly, social adaptation may play an even more critical role, as it is a known fact that the susceptible population, such as the elderly and patients with cardiovascular disease, should wear protective clothing and remain active in cold weather outdoors (29). However, The Eurowinter Group reported that in relatively warm countries, such a population often does not follow such practices because they do not feel the need (30). These findings suggest that excessive deaths in some instances could be avoided by way of the authorities taking several steps to promote subjective measures and public measures such as wind-proofing bus shelters. In addition, cold-related mortality is significantly higher in countries with lower-middle-income levels. The social capacity to adapt is also probably tied to economic development. People living in such countries may have less capacity to adapt to decreased temperatures, potentially exacerbating health inequalities across countries.
We further examined the cold impact on different kinds of cardiovascular diseases classified by the International Classification of Diseases-coded. Among them, cold exposure showed the most potent impact on the mortality of CHD and the morbidity of out-of-hospital cardiac arrest and AAD. In contrast, its role in hypertensive disease outcomes was not significant. Mechanically, the autonomic nervous system and humoral regulation system consist of a precise network to maintain blood pressure, which may not easily be disturbed by a change in ambient temperature. Moreover, our finding is consistent with that of a previous meta-analysis that explored the association between low temperatures and blood pressure. It was reported that a 1°C decrease in the mean daily outdoor temperature increased the systolic and diastolic blood pressure by 0.26 and 0.13 mmHg, respectively (12). These results suggested a possible correlation between decreased temperature and the incidence of hypertensive diseases, while the precise relationship remained largely unknown, which warrants future research. For example, research with a more detailed classification of the extent of temperature change and patients with underlying diseases is still needed. Recently, a meta-analysis that explored the effect of heat exposure on cardiovascular diseases reported a 2.8% and 17% increase in cardiovascular mortality followed by high temperatures and heat wave exposure, respectively (19). Coincidentally, both heat and cold exposure exercised the most substantial impact on cardiac arrest and minimum effect on hypertensive disease (19). Future exploration of the critical mechanism elicited by non-optimal temperatures may explain the results.
Cold temperatures could impact cardiovascular activity through many mechanisms. For example, cold exposure increases blood viscosity by elevating blood, platelet count, and red blood cell count in a few hours, which may increase the risk of ischemic heart disease and stroke (31–33). This could explain our study’s finding of increased risk of CHD and stroke after cold exposure. Furthermore, the present analysis suggested a high correlation between low temperatures and cardiac arrest morbidity, which may be explained by cold-induced autonomic nervous system disruption and inflammation–coagulation cascade activation (34–36). In addition, cold exposure was found to be associated with several risk factors for cardiovascular disease. It was reported that exposure to lower temperatures could be associated with a higher risk of metabolic derangement, including higher plasma glucose and more insulin resistance (37). Moreover, patients with diabetes were more prone to cold-related cardiovascular disease (38). Similarly, cold exposure impacted lipid metabolism disorder and influenza epidemics (39) and may induce more fat and alcohol intake.
The present synthesis showed a substantial interstudy heterogeneity. Considering the significant number of studies included in this meta-analysis, it is hard to avoid some inherent differences related to factors such as study design, meteorological variables, study population, and statistical mode. To analyze the source of heterogeneity, we carried out sensitivity analysis, subgroup analysis, and meta-regression, considering various covariant aspects such as temperature metrics, study design, study season, lag effects, air pollution adjustment, and cold spell intensity. However, all these analyses failed to reduce heterogeneity, indicating that other unmeasured factors still contribute to the cold effects on cardiovascular diseases as covariants, which still needs future research. In addition, a series of sensitivity analyses done by separating studies by various covariants and let-one-out analyses showed consistency in direction and magnitude, except for the impact of cold spells on cardiovascular morbidity. In this study, two (33%) studies could render the pooled effects of cold spells on cardiovascular disease morbidity insignificant when left out from the analysis, indicating the instability of the result. This inconsistency may be attributed to the small amount of evidence present in the synthesis. More importantly, there needs to be a clear definition and reference periods for cold spells, which may cause significant heterogeneity and various estimated effects (40, 41).
The main advantages of our estimates of risk attributed to cold exposure are as follows. To our knowledge, this review is the first to focus on the impact of cold weather on cardiovascular disease and to analyze the influential factors that cause differences in terms of cold impact. Notably, we found that cold exposure had the most powerful impact on CHD and AAD. Moreover, we identified the climate zone as an essential influential factor in terms of the impact of ambient cold exposure on cardiovascular disease. We also provided strong evidence of the impact of cold exposure on cardiovascular disease with regard to both its direction and magnitude by conducting a wide-ranging search and analysis of the current evidence and carrying out a series of sensitivity analyses that attest to the robustness of our findings. However, our study still has some limitations to be addressed. First, we unbiasedly included relative peer-reviewed literature. However, the available studies are far from conclusive, and the quality of several studies is a matter of concern. These may inevitably affect the quality of the pooled results, which suggests the requirement for rigor and better instruments in future research. Second, we found a high heterogeneity among included studies. Although we employed a series of subgroup analyses and meta-regression, the source of heterogeneity was not identified. Therefore, we used a random-effects model to pool individual estimates in studies quantitatively. However, considering the undetected source of heterogeneity and confounders, caution should be exercised when interpreting these pooled effect estimates. Third, we referred to the methodology of the previous meta-analysis and chose the lag RRs with the maximum risks (18, 19), which could lead to mistakes in the pooled results. For example, such extracted data could inevitably induce higher estimated RRs. Moreover, temperatures in the following lag days could affect the results in the form of an unadjusted confounder. However, which lag RR gives a true picture of cold impact remains largely unknown, and it is unlikely to make the best choice on the basis of the available evidence. This suggests the need for future research on the relationship between the lag days and the impact of temperature. Fourth, despite the great amount of literature included in the pooled estimates, there were still a small number of estimates in some subgroups such as the mortality and morbidity of hypertensive disease and health outcomes in lower-middle-income-level countries.
This systematic review and meta-analysis used the most up-to-date data assessment method and included 159 pieces of literature on cold exposure and cardiovascular disease outcomes. This study provided updated evidence that cold exposure (both low temperatures and cold spells) could elevate the risk of cardiovascular disease–related mortality and morbidity. Findings from this review also highlight that people living in warmer climate zones and lower-middle-income countries are more susceptible to cold-induced cardiovascular diseases. This study helps evaluate the current risk factors for cardiovascular diseases and provides important implications for future healthcare prevention strategies and resource allocation for high-risk populations. Given the increases in the frequency and intensity of consecutive cold climatic extremes, urgent attention is called for to devise more successful strategies to reduce risks.
Statements
Data availability statement
The original contributions presented in the study are included in the article/Supplementary Material, further inquiries can be directed to the corresponding authors.
Author contributions
JF-F, Y-CX, Y-KW, and W-ZW contributed to the conception and design of the study. Y-FF organized the database. J-FF and L-YN performed the statistical analysis. J-FF wrote the first draft of the manuscript. XT, J-SC, Y-QL, and W-YL wrote sections of the manuscript. W-ZW and Y-KW reviewed and edited the manuscript. All authors contributed to the article and approved the submitted version.
Funding
This work was supported by the Funding of the Chinese Logistics Scientific Research Project (BHJ21J008) and the Key Construction Projects for Naval Academy Disciplines and Specialties (21JX017).
Acknowledgments
We sincerely acknowledge the support and help from statistical professor Ying-Yi Qin (from the Department of Statistical Analysis, NMU).
Conflict of interest
The authors declare that the research was conducted in the absence of any commercial or financial relationships that could be construed as a potential conflict of interest.
Publisher’s note
All claims expressed in this article are solely those of the authors and do not necessarily represent those of their affiliated organizations, or those of the publisher, the editors and the reviewers. Any product that may be evaluated in this article, or claim that may be made by its manufacturer, is not guaranteed or endorsed by the publisher.
Supplementary material
The Supplementary Material for this article can be found online at: https://www.frontiersin.org/articles/10.3389/fcvm.2023.1084611/full#supplementary-material.
References
1.
Collaborators GBDRF. Global burden of 87 risk factors in 204 countries and territories, 1990–2019: a systematic analysis for the Global Burden of Disease Study 2019. Lancet. (2020) 396:1223–49. 10.1016/S0140-6736(20)30752-2
2.
GasparriniAGuoYHashizumeMLavigneEZanobettiASchwartzJet alMortality risk attributable to high and low ambient temperature: a multicountry observational study. Lancet. (2015) 386:369–75. 10.1016/S0140-6736(14)62114-0
3.
ChenRYinPWangLLiuCNiuYWangWet alAssociation between ambient temperature and mortality risk and burden: time series study in 272 main Chinese cities. Br Med J. (2018) 363:k4306. 10.1136/bmj.k4306
4.
MaCYangJNakayamaSFIwai-ShimadaMJungCRSunXLet alCold spells and cause-specific mortality in 47 Japanese prefectures: a systematic evaluation. Environ Health Perspect. (2021) 129:67001. 10.1289/EHP7109
5.
ShiJCuiLWenKTianZWeiPZhangB. Trends in the consecutive days of temperature and precipitation extremes in China during 1961-2015. Environ Res. (2018) 161:381–91. 10.1016/j.envres.2017.11.037
6.
LuoQLiSGuoYHanXJaakkolaJJK. A systematic review and meta-analysis of the association between daily mean temperature and mortality in China. Environ Res. (2019) 173:281–99. 10.1016/j.envres.2019.03.044
7.
GuoYLiSZhangYArmstrongBJaakkolaJJTongSet alExtremely cold and hot temperatures increase the risk of ischaemic heart disease mortality: epidemiological evidence from China. Heart. (2013) 99:195–203. 10.1136/heartjnl-2012-302518
8.
GibelinP. Do weather and seasons influence our heart?. Presse Med. (2015) 44:821–7. 10.1016/j.lpm.2015.07.004
9.
Manou-StathopoulouVGoodwinCDPattersonTRedwoodSRMarberMSWilliamsRP. The effects of cold and exercise on the cardiovascular system. Heart. (2015) 101:808–20. 10.1136/heartjnl-2014-306276
10.
KimHKSohnDWLeeSEKimYJOhBHParkYB. Coronary blood flow after cold exposure and the effect of warm-up exercise. J Am Soc Echocardiogr. (2006) 19:386–90. 10.1016/j.echo.2005.11.006
11.
PhungDThaiPKGuoYMorawskaLRutherfordSChuC. Ambient temperature and risk of cardiovascular hospitalization: an updated systematic review and meta-analysis. Sci Total Environ. (2016) 550:1084–102. 10.1016/j.scitotenv.2016.01.154
12.
WangQLiCGuoYBarnettAGTongSPhungDet alEnvironmental ambient temperature and blood pressure in adults: a systematic review and meta-analysis. Sci Total Environ. (2017) 575:276–86. 10.1016/j.scitotenv.2016.10.019
13.
MoghadamniaMTArdalanAMesdaghiniaAKeshtkarANaddafiKYekaninejadMS. Ambient temperature and cardiovascular mortality: a systematic review and meta-analysis. PeerJ. (2017) 5:e3574. 10.7717/peerj.3574
14.
SongXWangSHuYYueMZhangTLiuYet alImpact of ambient temperature on morbidity and mortality: an overview of reviews. Sci Total Environ. (2017) 586:241–54. 10.1016/j.scitotenv.2017.01.212
15.
RenCWilliamsGMTongS. Does particulate matter modify the association between temperature and cardiorespiratory diseases?Environ Health Perspect. (2006) 114:1690–6. 10.1289/ehp.9266
16.
BaiLWoodwardALiuQ. Temperature and mortality on the roof of the world: a time-series analysis in three Tibetan counties, China. Sci Total Environ. (2014) 485-486:41–8. 10.1016/j.scitotenv.2014.02.094
17.
LiberatiAAltmanDGTetzlaffJMulrowCGotzschePCIoannidisJPet alThe PRISMA statement for reporting systematic reviews and meta-analyses of studies that evaluate healthcare interventions: explanation and elaboration. Br Med J. (2009) 339:b2700. 10.1136/bmj.b2700
18.
SunZChenCXuDLiT. Effects of ambient temperature on myocardial infarction: a systematic review and meta-analysis. Environ Pollut. (2018) 241:1106–14. 10.1016/j.envpol.2018.06.045
19.
LiuJVargheseBMHansenAZhangYDriscollTMorganGet alHeat exposure and cardiovascular health outcomes: a systematic review and meta-analysis. Lancet Planet Health. (2022) 6:e484–95. 10.1016/S2542-5196(22)00117-6
20.
BeckHEZimmermannNEMcVicarTRVergopolanNBergAWoodEF. Present and future Koppen-Geiger climate classification maps at 1-km resolution. Sci Data. (2018) 5:180214. 10.1038/sdata.2018.214
21.
HigginsJPThompsonSGDeeksJJAltmanDG. Measuring inconsistency in meta-analyses. Br Med J. (2003) 327:557–60. 10.1136/bmj.327.7414.557
22.
YuWGuoYYeXWangXHuangCPanXet alThe effect of various temperature indicators on different mortality categories in a subtropical city of Brisbane, Australia. Sci Total Environ. (2011) 409:3431–7. 10.1016/j.scitotenv.2011.05.027
23.
Hurtado-DiazMCruzJCTexcalac-SangradorJLFelix-ArellanoEEGutierrez-AvilaIBriseno-PerezAAet alShort-term effects of ambient temperature on non-external and cardiovascular mortality among older adults of metropolitan areas of Mexico. Int J Biometeorol. (2019) 63:1641–50. 10.1007/s00484-019-01778-y
24.
XuWThachTQChauYKLaiHKLamTHChanWMet alThermal stress associated mortality risk and effect modification by sex and obesity in an elderly cohort of Chinese in Hong Kong. Environ Pollut. (2013) 178:288–93. 10.1016/j.envpol.2013.03.020
25.
RenCWilliamsGMMorawskaLMengersenKTongS. Ozone modifies associations between temperature and cardiovascular mortality: analysis of the NMMAPS data. Occup Environ Med. (2008) 65:255–60. 10.1136/oem.2007.033878
26.
HaJKimH. Changes in the association between summer temperature and mortality in Seoul, South Korea. Int J Biometeorol. (2013) 57:535–44. 10.1007/s00484-012-0580-4
27.
GaoHLanLYangCWangJZhaoY. The threshold temperature and lag effects on daily excess mortality in Harbin, China: a time series analysis. Int J Occup Environ Med. (2017) 8:85–95. 10.15171/ijoem.2017.979
28.
YangLTChangYMHsiehTHHouWHLiCY. Associations of ambient temperature with mortality rates of cardiovascular and respiratory diseases in Taiwan: a subtropical country. Acta Cardiol Sin. (2018) 34:166–74. 10.6515/ACS.201803_34(2).20171101A
29.
EbiKLMillsD. Winter mortality in a warming climate: a reassessment. WIRES Climate Change. (2013) 4:203–12. 10.1002/wcc.211
30.
KeatingeWR. Cold exposure and winter mortality from ischaemic heart disease, cerebrovascular disease, respiratory disease, and all causes in warm and cold regions of Europe. The Eurowinter group. Lancet. (1997) 349:1341–6. 10.1016/S0140-6736(96)12338-2
31.
WangXCaoYHongDZhengDRichteringSSandsetECet alAmbient temperature and stroke occurrence: a systematic review and meta-analysis. Int J Environ Res Public Health. (2016) 13. 10.3390/ijerph13070698
32.
KeatingeWRColeshawSRCotterFMattockMMurphyMChelliahR. Increases in platelet and red cell counts, blood viscosity, and arterial pressure during mild surface cooling: factors in mortality from coronary and cerebral thrombosis in winter. Br Med J (Clin Res Ed). (1984) 289:1405–8. 10.1136/bmj.289.6456.1405
33.
HeFSuWWuRLiHLouLWuAet alThe effect of cold exposure on serum cholesterol is dependent upon ApoE. J Therm Biol. (2021) 99:102972. 10.1016/j.jtherbio.2021.102972
34.
BrookRDWederABRajagopalanS. “Environmental hypertensionology” the effects of environmental factors on blood pressure in clinical practice and research. J Clin Hypertens (Greenwich). (2011) 13:836–42. 10.1111/j.1751-7176.2011.00543.x
35.
HuangMYooJKStickfordASLMooreJPHendrixJMCrandallCGet alEarly sympathetic neural responses during a cold pressor test linked to pain perception. Clin Auton Res. (2021) 31:215–24. 10.1007/s10286-019-00635-7
36.
ZhaYPWangYKDengYZhangRWTanXYuanWJet alExercise training lowers the enhanced tonically active glutamatergic input to the rostral ventrolateral medulla in hypertensive rats. CNS Neurosci Ther. (2013) 19:244–51. 10.1111/cns.12065
37.
ValdesSDoulatram-GamgaramVLagoAGarcia TorresFBadia-GuillenROlveiraGet alAmbient temperature and prevalence of diabetes and insulin resistance in the Spanish population: Di@bet.es study. Eur J Endocrinol. (2019) 180:273–80. 10.1530/EJE-18-0818
38.
IkaheimoTMJokelainenJHassiJHiltunenLKeinanen-KiukaanniemiSLaatikainenTet alDiabetes and impaired glucose metabolism is associated with more cold-related cardiorespiratory symptoms. Diabetes Res Clin Pract. (2017) 129:116–25. 10.1016/j.diabres.2017.04.022
39.
ChenZLiuPXiaXWangLLiX. The underlying mechanisms of cold exposure-induced ischemic stroke. Sci Total Environ. (2022) 834:155514. 10.1016/j.scitotenv.2022.155514
40.
RytiNRGuoYJaakkolaJJ. Global association of cold spells and adverse health effects: a systematic review and meta-analysis. Environ Health Perspect. (2016) 124:12–22. 10.1289/ehp.1408104
41.
WangLLiuTHuMZengWZhangYRutherfordSet alThe impact of cold spells on mortality and effect modification by cold spell characteristics. Sci Rep. (2016) 6:38380. 10.1038/srep38380
Summary
Keywords
low temperature, cold spell, cardiovascular disease, meta-analysis, climate
Citation
Fan J-F, Xiao Y-C, Feng Y-F, Niu L-Y, Tan X, Sun J-C, Leng Y-Q, Li W-Y, Wang W-Z and Wang Y-K (2023) A systematic review and meta-analysis of cold exposure and cardiovascular disease outcomes. Front. Cardiovasc. Med. 10:1084611. doi: 10.3389/fcvm.2023.1084611
Received
30 October 2022
Accepted
22 February 2023
Published
27 March 2023
Volume
10 - 2023
Edited by
Giulio Francesco Romiti, Sapienza University of Rome, Italy
Reviewed by
Maurizio Giuseppe Abrignani, Asp trapani, Italy Andrea Zito, Catholic University of the Sacred Heart, Italy
Updates
Copyright
© 2023 Fan, Xiao, Feng, Niu, Tan, Sun, Leng, Li, Wang and Wang.
This is an open-access article distributed under the terms of the Creative Commons Attribution License (CC BY). The use, distribution or reproduction in other forums is permitted, provided the original author(s) and the copyright owner(s) are credited and that the original publication in this journal is cited, in accordance with accepted academic practice. No use, distribution or reproduction is permitted which does not comply with these terms.
*Correspondence: Yang-Kai Wang wyangkai2005@smmu.edu.cn Weizhong Wang weizhongwang@smmu.edu.cn
These authors have contributed equally to this work
Specialty Section: This article was submitted to Cardiovascular Epidemiology and Prevention, a section of the journal Frontiers in Cardiovascular Medicine
Disclaimer
All claims expressed in this article are solely those of the authors and do not necessarily represent those of their affiliated organizations, or those of the publisher, the editors and the reviewers. Any product that may be evaluated in this article or claim that may be made by its manufacturer is not guaranteed or endorsed by the publisher.