 Tom D. Pering1*
 Tehnuka Ilanko1
 Thomas C. Wilkes1
 Rebecca A. England1
 Siân R. Silcock1
 Leigh R. Stanger2Jon R. Willmott2
 Robert G. Bryant1
 Andrew J. S. McGonigle1,3
- 1Department of Geography, University of Sheffield, Sheffield, United Kingdom
- 2Department of Electronic and Electrical Engineering, University of Sheffield, Sheffield, United Kingdom
- 3School of Geosciences, The University of Sydney, Sydney, NSW, Australia
Lava lakes provide a rare opportunity to study conduit flow processes through direct observation of the exposed magma surface. The recent lava lake activity at Masaya volcano (Nicaragua), which commenced in 2015, displayed several unusual phenomena. We report on the dynamics of this rapidly convecting lake, which, to the best of our knowledge manifested the highest lava flow velocities ever reported for a lava lake: 13.7–16.4 m s−1, in addition to unusual fluid dynamic behavior involving alteration in surface flow direction. We studied this system with multiparametric and high time resolution remote sensing measurements, performed during June 2017, including ultraviolet camera observations of SO2 emission rates, near infrared thermal camera measurements and video analyses of the lake surface. Median SO2 emission rates of 3.1 (±0.8) and 3.7 (±0.9) kg s−1 were found, which are lower than previously published estimates, and could represent challenging remote sensing conditions or a waning in lava lake activity. Video analyses enabled characterization of frequent bursts of approximately hemispherical spherical-cap bubbles on the surface with diameters ranging 0.6–8.5 m (median of 2.6 m), and calculation of individual bubble masses, which contribute to active bubble bursting values estimated at 1.9 to 3.9 kg s−1. We show that only a small fraction, 7–17%, of total emission volumes are contributed by these bubbles, based on estimated emission rates of 22.5 and 26.9 kg s−1. Furthermore, periodicity analysis reveals regular 200–300 s oscillations in SO2 emissions. These are not shared by any of our other datasets and particularly during the contemporaenously acquried thermal data, hence, we tentatively assign an atmospheric causal generation mechanism, driven by atmospheric transport and turbulence phenomena, such as eddying. Overall, we highlight the uniquely high velocity and fluid dynamic behavior of Masaya lava lake.
Introduction
Lava lakes are one of the most spectacular volcanic phenomena, providing the opportunity to observe actively convecting magmatic systems. However, the rarity of these lakes, coupled with logistic and accessibility issues, limit our ability to study them. Between December 2015 and March 2016, a lava lake emerged at Masaya volcano in Nicaragua (Global Volcanism Program, 2017; Aiuppa et al., 2018), manifesting a rapidly convecting and turbulent lava surface. This provided a valuable opportunity to study the dynamics of this vigorously convecting lava lake, which appeared to share some characteristic surface behaviors with those at Villarrica (Chile; Moussallam et al., 2016) and Ambrym (Vanuatu; Allard et al., 2016a,b), i.e.; turbulent surfaces punctuated by frequent bubble bursts, which cover a significant proportion of the lake surface. Such behavior is in direct contrast with the prolonged slower surface motions and cooled plates exhibited at Halema'uma'u Crater, Kilauea (USA; Patrick et al., 2016), Erta Ale (Ethiopia; Jones et al., 2006), and Nyiragongo (Congo; Burgi et al., 2014). Table 1 summarizes key characteristics of lava lakes across the globe.
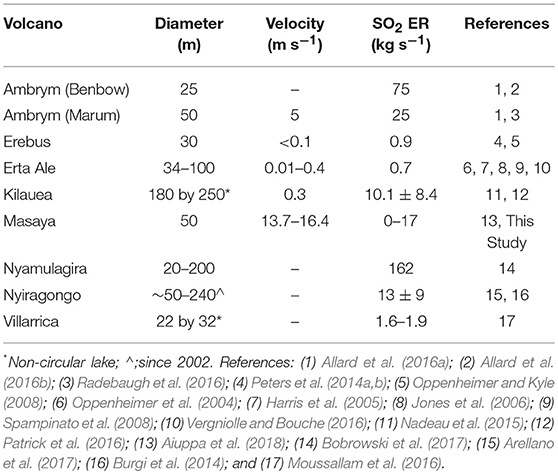
Table 1. An overview of current and past lava lakes, their dimensions, lake surface velocities (where available) and degassing characteristics associated with those.
The dynamics of lava lakes can be investigated through the study of gas emissions (e.g., Nadeau et al., 2015; Moussallam et al., 2016), gas ratios (e.g., Ilanko et al., 2015; Allard et al., 2016a,b), thermal fluxes (e.g., Spampinato et al., 2008; Peters et al., 2014a; Radebaugh et al., 2016), seismicity (e.g., Palma et al., 2008; Richardson et al., 2014), infrasound (e.g., Bouche et al., 2010) and visible video imagery (e.g., Harris et al., 2005). Of these, gas studies can provide information on the style of magma convection through identification of temporal trends in emission and ratio data. Moussallam et al. (2016) identified three broad models to explain lava lake behaviors: (1) fluctuating uni-directional flow (e.g., Witham et al., 2006) where upward and downward magma flow alternate, (2) bi-directional flow (e.g., Kazahaya et al., 1994) where both upward and downward flow occur at the same time, i.e., via convection, and (3) bubble flux driving heat transfer into a lava lake (e.g., Bouche et al., 2010). These models can, in combination or in isolation, help explain variations in visible lava lake behaviors such as the movement of lava lake surfaces, changes in lake level, and surface activities, e.g., spattering, bubble bursting and fountaining (Moussallam et al., 2016).
Masaya is an open vent, basaltic volcano (Walker et al., 1993; Stix, 2007), which has four pit craters at its summit, with recent activity concentrated solely within the Santiago crater (Rymer et al., 1998). The very recent appearance of the lava lake at Masaya, which was initiated in the latter half of 2015 (Global Volcanism Program, 2017), has produced a number of publications (Stephens et al., 2017; Aiuppa et al., 2018; Stephens and Wauthier, 2018; Wilkes et al., 2018). Of these reports, Aiuppa et al. (2018) give a thorough overview of gas emissions and ratios between 2014 and 2017. These authors identified an initial CO2-rich plume composition prior to lake formation, which then became more SO2-rich as the lake appeared at the surface, however, their data only extended to early 2017, prior to our own field study, performed in June of that year.
Here, using a multiparametric dataset captured from ultraviolet camera, thermal, and visible measurements performed during June 2017, we present a study into the high temporal resolution dynamics of Masaya lava lake.
Methods, Results, and Analysis
In order to study the behavior associated with the lava lake at Masaya we applied a range of high time resolution remote sensing imaging approaches to capture visual, thermal and degassing phenomena. Our fieldwork on Masaya volcano was conducted between the 12th and 18th June 2017. We note that our observations only provide information about the lava lake behavior during this period. Indeed, the lava lake activity has changed significantly since its inception, in terms of magma level within the crater, the number of active vents (Global Volcanism Program, 2017), and in the fluid behavior of the lake (see Supplementary Table 1 for video links).
Figure 1 shows the characteristics of the lake during our fieldwork period. The lake exhibited rapid surface motion, with lava moving from an inflow in the southeast toward the northwest. As this material hit the crater walls, it overturned, creating vigorous splashbacks that threw individual lava clots onto the lake surface and walls. In addition, near-circular burst events were observed to occur with high frequently (several per second) across the lake surface. We hypothesize that these correspond to the release of spherical-cap bubbles, given the burst dimensions and presence within a wider fluid, i.e., the bubbles are not constrained within a narrow conduit (Wegener and Parlange, 1973; Bhaga and Weber, 1981). From our observation position on the crater rim (11.983043°, −86.168961°) it was not possible to observe the entire lake. Where the lava first entered the field of view it appeared to travel at high horizontal velocities. However, the portion not visible from our vantage point was visible from the opposite side of the crater, where the lava appears to be traveling at slower horizontal velocities. Unfortunately, it was not possible to measure the velocity of the lake from that point as only a small fraction of the lake was visible.
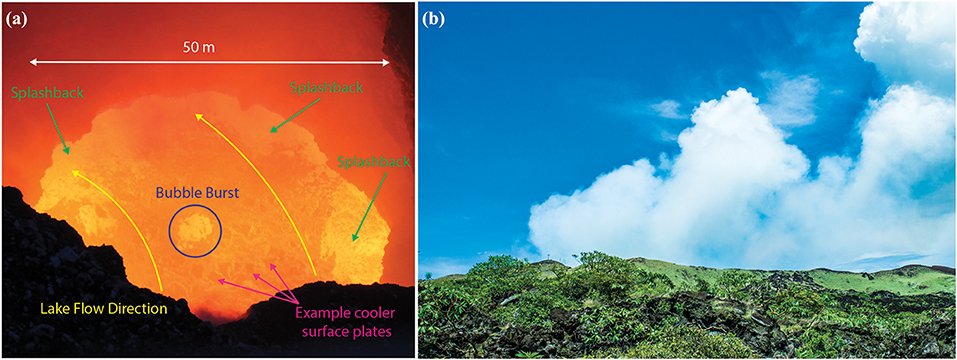
Figure 1. (a) An overview of the features of Masaya lava lake during our period of measurement in June 2017, and (b) an image of typical conditions during the measurements.
All location data are provided in the Supplementary Material Google Earth File. Where central values are given for datasets, we report either the mean or the median depending on the statistical distribution. The mean is given for normally distributed and the median for non-normally distributed data, as assessed using Skewness and Kurtosis. The presence of periodicity within the datasets was also investigated using: Fast Fourier transform (FFT) via Welch's method (Welch, 1967), Lomb-Scargle analysis for unevenly sampled data (Lomb, 1976; Scargle, 1982), and the continuous wavelet transform (CWT) using the Morlet wavelet (Morlet et al., 1982; Torrence and Compo, 1998; Grinsted et al., 2004). All of these approaches are commonly used for detecting periodicity in environmental datasets (Pering et al., 2014a) and were implemented in this study using Matlab® routines.
UV Camera Data
UV camera data were acquired from the flanks of Masaya on 15 and 18 June 2017 (Local Time) using the low-cost “PiCam” instrumentation of Wilkes et al. (2016, 2017). For full hardware details of these units please see Wilkes et al. (2016, 2017). Here we give a brief synopsis of UV camera acquisition and processing protocols, which are discussed in detail elsewhere (e.g., Kantzas et al., 2010; McGonigle et al., 2017).
The two deployed cameras have filters (produced by Edmund Optics Inc.) with full width at half maxima of 10 nm, centered on 310 and 330 nm, respectively. These are the two wavelengths where SO2 absorbs and does not absorb, respectively. Images from the cameras were taken synchronously at a rate of 0.25 Hz. The data were linearly interpolated to 1 Hz timeseries after processing, to facilitate comparison with other datasets. Dark and clear sky images were taken to correct for sensor noise and inhomogeneous illumination (vignetting) of the sensor. The images were aligned to correct for small offsets between the camera alignment, and the pixel intensities were converted to uncalibrated absorption values, using the Beer-Lambert law. These data were then converted to column amount values, on the basis of calibration with gas cells of known concentration (0, 304 ± 31 and 1,257 ± 58 ppm m). To calculate each SO2 emission rate the integrated column amount (ICA) along a defined line (see Figure 2a) was multiplied by the plume speed, calculated using cross correlation, which has associated errors of <10% (McGonigle et al., 2005; Williams-Jones et al., 2006).
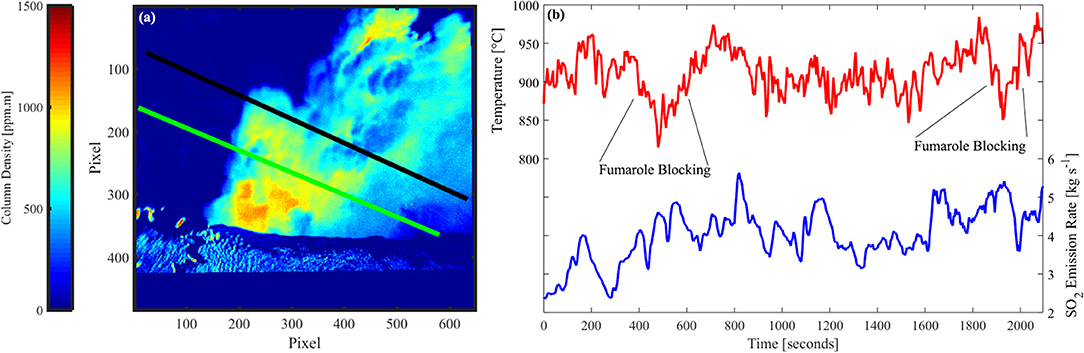
Figure 2. (a) an example absorption image from 18th June with indicated integration lines for determining integrated column amount (green line) and plume speed via cross correlation (black line), (b) example temperature (red line) and SO2 emission rate (blue line) traces through time during a period of synchronous acquisition on the 18th June.
The plume at Masaya was optically thick above a certain height. We therefore selected integration lines across the plume width as close as possible to the crater rim during processing. Cross correlation was used rather than optical flow for plume speed determination, as at this ICA location optical flow methods did not sufficiently register the plume motion, likely a failure of the optical flow algorithm used. The optical thickness also causes a deviation from the Beer-Lambert law, leading to errors in retrievals of SO2 emission rates. Kern et al. (2013) studied the effects of varying plume optical thicknesses and plume SO2 column amounts (ranging 0–10,000 ppm·m). For conditions in the plume at Masaya with approximate maximum SO2 column amounts of 2000 ppm·m at a viewing distance of <2 km from the gas, the authors suggested a 20% deviation from Beer-Lambert law, and we therefore take this as our error arising from this effect. Furthermore, given our proximity to the plume, error from light dilution is expected to be low—at the lower end of the 20–80% quoted by Campion et al. (2015). Overall, therefore, the root-mean-square error (assuming a lower light dilution error of +20% (i.e., a systematic underestimation of SO2 content), plume speed error of ±10%, deviation from Beer-Lambert law of ±20%, and accuracy of ±10% on gas cell concentrations) associated with our UV camera measurements is estimated at ~25%.
UV camera data for 18 June 2017 are displayed in Figure 2b, and for 15 June 2017 in Figure S1. See Supplementary Video 1, where puffing behavior of the plume is evident. Our UV camera emission rate data had medians of ~3.1 ± 0.8 and 3.7 ± 0.9 kg s−1 and ranged ~0.9–5.7 kg s−1 and ~0.8–5.6 kg s−1, on the 15th and 18th, respectively. Aiuppa et al. (2018) report median daily SO2 emission rates of 0–17 kg s−1 between March 2014 and March 2017, with an average median daily emission rate of 7.8 kg s−1 on the basis of data from the NOVAC network (Johansson et al., 2009; Galle et al., 2010). The temporal difference between the data from Aiuppa et al. (2018) and our study precludes a direct comparison. However, our data fits within their general reported range. Although, it is possible that SO2 emissions are too low because of the optically thick plume (Kern et al., 2013).
NIR Thermal Measurements
We used a Raspberry Pi near infrared (NIR) system identical to that described in Wilkes et al. (2018). The camera system operates on the principle of Planck's law, which is that all objects radiate according to their temperature. Hotter objects radiate with greater power and with a peak wavelength that becomes shorter at higher temperatures. If an object is hotter than approximately 600°C then it radiates with significant power that can be measured by silicon cameras. This enables thermal imaging to be undertaken with the very mature technology used in consumer cameras; achieving low cost, high resolution and high frame rates. Daylight can interfere with the measurements and so 850 nm filters are used to virtually eliminate the daylight, whilst leaving significant sensitivity in the NIR region that silicon technology is sensitive to. This unit operated in the ~850–1,100 nm wavelength region, by virtue of an installed 850 nm long pass filter (Thorlabs, RG850), to provide sensitivity at magmatic temperatures. The camera had a 10° field of view, achieved using a 3D printed lens holder and custom optical system (a Cooke Triplet lens specifically designed for the application), and was situated above the lava lake on the crater terrace. Images were taken on 12, 14, 15, 17, and 18 June 2017 (full datasets are provided in the Supplementary Material). There are a number of sources of uncertainty with this technique, including calibration, sensor noise, flat-field, emissivity, and path transmission. For full details of camera construction, calibration and discussion of uncertainty calculation, see Wilkes et al. (2018). On the basis of this article we consider the error in temperature to be ~10–15°C, in the range of reported temperatures ~800–1,100°C.
Post-acquisition, the images were stabilized for camera motion and then interrogated for temperature fluctuations across the whole lake area, indicating a median temperature range of ~911–994°C, as detailed in Table 2. An example thermal flux trace is displayed alongside contemporaneous UV camera time series data from 18 June 2017 in Figure 2b. Visible dips in thermal flux, associated with obscuration by a fumarole which obscured the lake surface sporadically, are indicated. See Figure S2 for example calibrated images, and an example acquisition sequence is available via Supplementary Video 2.
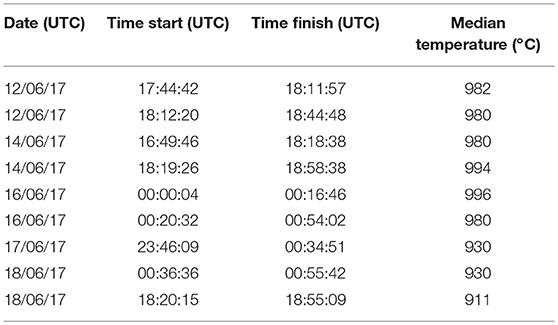
Table 2. An overview of median temperatures acquired from near infrared acquisitions on indicated dates.
DSLR Camera
Visible video capture of the lava lake dynamics was conducted using a Canon EOS 1100D DSLR camera, which recorded video at 25 fps at a resolution of 1,280 by 720 pixels, using a 75–300 mm focal length lens. Videos were recorded on the 12, 14, 15, and 17 June 2017 (local date), and we selected videos from the 17th for analysis based on their length and clarity (see Supplementary Video 3). Lake velocity was calculated using particle image velocimetry (PIV) with a Matlab GUI (PIVlab) detailed by Thielicke and Stamhuis (2014). PIV is a common method for mapping fluid flow velocities (Raffel et al., 2007). Our images were pre-processed using the in-built PIVlab CLAHE (contrast limited adaptive histogram equalization) method, which sharpened the contrast between different regions of the lake surface (e.g., the cooler plates). During analysis, PIVlab splits each image into a matrix of cells (interrogation areas), and then calculates the offset between subsequent images in time. We used a fast Fourier transform (FFT) option for this to reduce computational burden. A region of interest (ROI) on the lake surface was selected that did not overlap with the area of vigorous splashback, and, as far as possible, avoided obscuration by fumarolic gas (see Figures 1a, 4). The direction of lake motion was determined by manually tracking cooled surface plates using ImageJ (https://imagej.nih.gov/ij/) and software plugin MTrackJ (Meijering et al., 2012; https://imagescience.org/meijering/software/mtrackj/).
The calculated median lake surface velocities (Figure 3) of 13.7–16.4 m s−1 (49.3–59.0 km h−1) are to the best of our knowledge, by far the highest ever reported for a lava lake: see Table 1 for data for other lava lakes across the globe. In addition, this velocity was observed to vary across the lake. Figure 4 shows averaged velocity values for segments of the ROI indicated by the dashed box. There is a clear difference in flow velocity from the point the lava first enters our imagery, at >17.5 m s−1, to the western portions of the lake where velocities slow to <14 m s−1. There is also a clear difference between lake velocity and curvature on the western and eastern portion of the lake, i.e., the eastern portion is faster by 1–2 m s−1, while the western and eastern portions were angled at >30° and <30°, respectively (see Figure 5). This highly unique behavior is reminiscent of the cresting of water in a waterfall or a river rapid, i.e., a change in the vertical gradient of the magma causes an acceleration of the fluid.
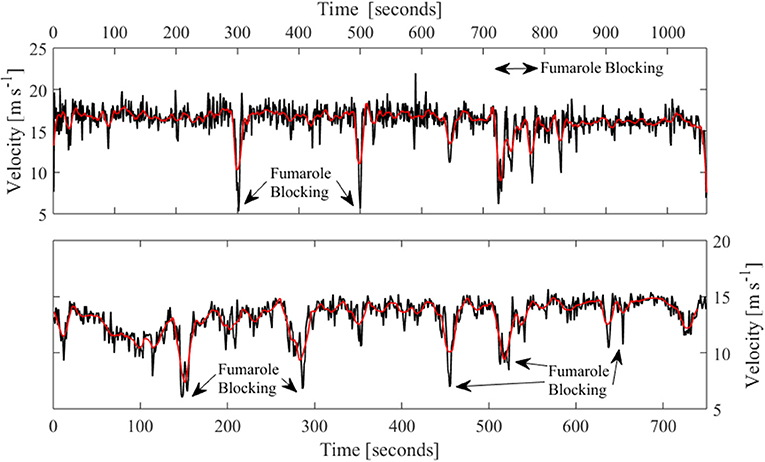
Figure 3. Two separate examples of average lake surface velocity (on the region of interest) through time. Arrows indicate where fumaroles significantly blocked the view of the lava lake and affected the velocity analysis.
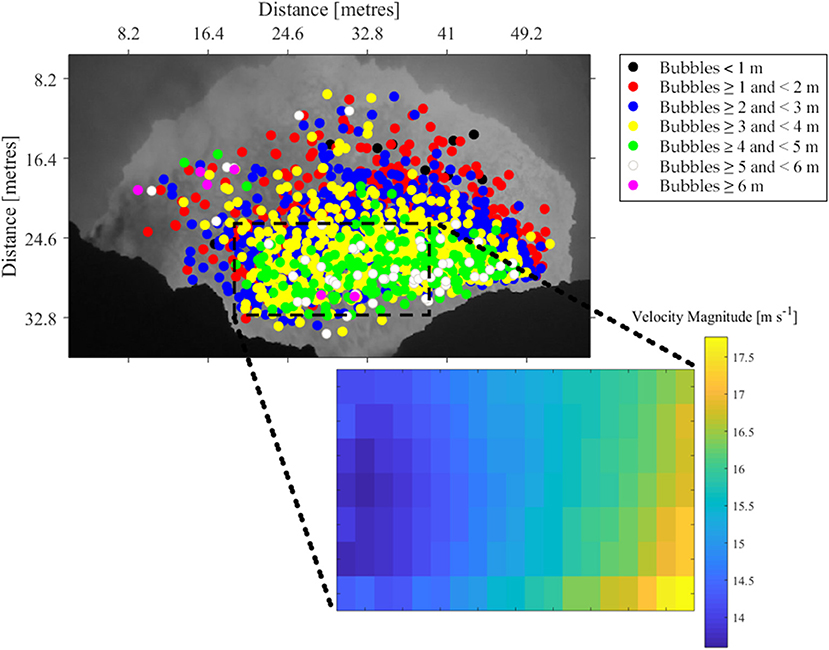
Figure 4. Monochrome image of the lava lake with bubble burst positions indicated, highlighting the general trend that as bubbles get larger their median “Y-axis” position moves closer to the point at which the lavas arrive at the lake surface. Dashed rectangle indicates the region of interest used to calculate averaged pixel area velocity.
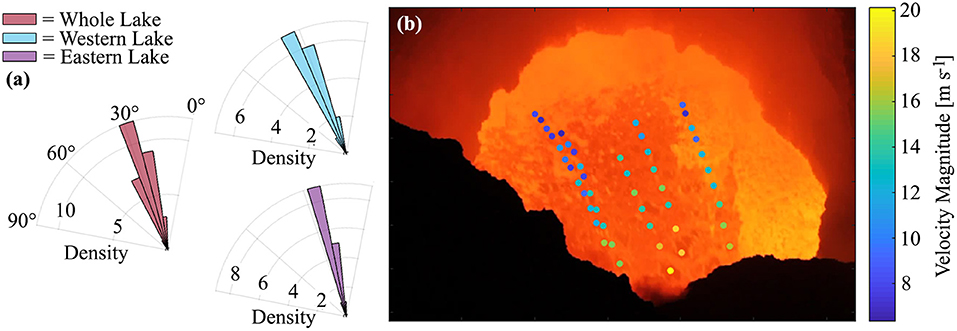
Figure 5. (a) Direction of tracked plates from first appearance to disappearance across the whole lake, and the right and left sides. Left and right were determined by splitting the lake in half. (b) representative plate tracks, with each dot color coded by its measured velocity. A clear curving and reduction in velocity is highlighted.
MtrackJ was also used to map the surface positions, diameters, and time of bubble bursts, these phenomena were readily resolvable given their clear circular imprint on the lake surface (see Figure 1a). Given the reasonable assumption that each bursting bubble is of spherical-cap morphology, i.e., the bubble is not constrained within a narrow conduit, which would promote Taylor bubble formation (e.g., a similar analysis was performed on Erta ‘Ale by Bouche et al., 2010; see also Pering and McGonigle, 2018), we can then calculate the masses of individual bubbles. We use the constant 0.57 and our measured bubble diameter db to convert to the term de (a characteristic length scale of a cap bubble), the equivalent diameter, as per Davies and Taylor (1950):
We then used de, to calculate the volume of the bubble (Vb) at burst, after Joseph (2003):
The number of moles in each bubble can then be derived from the ideal gas law (PV = nRT), where P is atmospheric pressure (Pa), V is volume (m3), n are the number of moles in the bubble, R is the real gas constant (8.314 J−1 mol−1), and T is the temperature in Kelvin (taken to be 1,238 K, e.g., 965°C, which was the average surface temperature recorded from our thermal camera images during the entire measurement period). Here, we have used atmospheric pressure to approximate the bursting pressure of all bubbles. In reality, the rheological characteristics of the magma mean that the pressure threshold for bursting will be above atmospheric values (e.g., Del Bello et al., 2012); pressure is therefore a key source of error in our estimates of number of moles per bubble. Using the molar gas ratios from Aiuppa et al. (2018), (CO2/SO2 = 5 and H2O/SO2 = 10), we can calculate the following molar proportions for the major volcanic gases: 6% SO2; 31% CO2; and 63% H2O. These ratios are from data reported for the latter part of 2016 and early 2017, which are the most contemporaneously available data for our measurement period (see Figures 2b,f in Aiuppa et al. (2018)) and best available given the lack of direct measurement of bubble molar composition. These molar proportions can then be converted to mass of each gas species in the bubble, and thus total mass. Assuming atmospheric pressure at burst, the median total bubble mass is therefore 0.5 kg, with a range of 5 × 10⁻³-15.4 kg. In total, 1,830 kg was released from 2,351 bubble bursts over the 948 s observation sequence, corresponding to a bubble flux of ~1.9 kg s−1 (Figures 6C,D). However, in an approximate sensitivity analysis we can estimate the effect of a change in pressure on our results. For example, a doubling in burst pressure would give a median total bubble mass of 1.0 kg, with 3,741 kg released in total, and a bubble flux of 3.9 kg s−1. Based on both these burst pressure scenarios bubble flux accounts for 7% to 17% of the total emission rates of 22.5 and 26.9 kg s−1 for 15 and 18 June 2017, estimated from the UV camera SO2 data combined with ratios from Aiuppa et al. (2018). This indicates that a relatively low proportion of emissions are derived from these active bubble bursts.
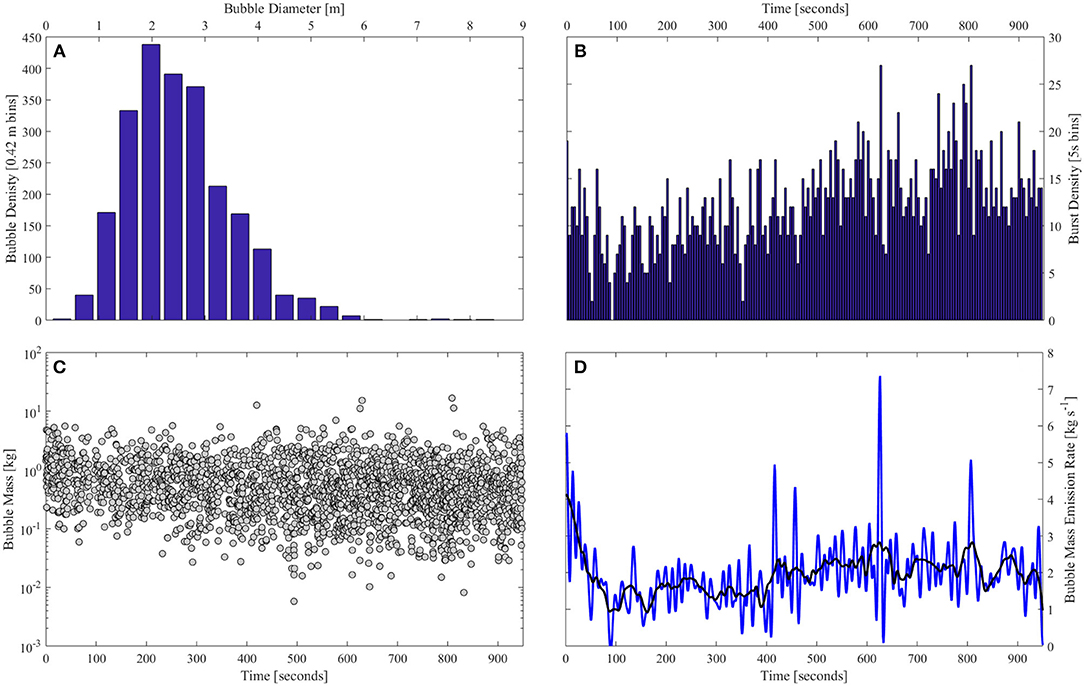
Figure 6. (A) the distribution of bubble burst diameters on the lake surface, (B) the number of bursts in 5 s bins, (C) the mass of each bubble burst through time, and (D) bubble mass emission rate with a superimposed savitzy golay filter of 1 min.
Bubble burst diameters ranged from 0.6 to 8.5 m, with a median of 2.6 m (Figure 6A). There is no clear temporal pattern in bubble bursts behavior (Figure 6B). There is, however, a significant difference between the median “Y-axis” positions of bubble bursts when considering ranged steps of 1 m up to 6 m in diameter (t-tests significant at the 0.05 significance level for steps of 1 m), with a strong trend for larger diameter bubbles bursting closest to the lake entrance area, which probably reflects the faster ascent time of large diameter spherical-cap bubbles (Joseph, 2003). In the western portion of the lava lake there are four bubble bursts of >6 m, which could result from the collection of multiple smaller bubbles against the crater wall.
Periodicity and Regression Analysis
All of the acquired datasets (UV emission rate, thermal, lake surface velocity, bubble burst frequency, bubble location, bubble diameter, and bubble mass) were investigated for potential periodicities and relationships through use of regression. The one interval of overlap between the UV and thermal data (18/06/18) revealed no clear linkage between the two datasets (see Figure 7), although the UV data contain potential periodicities on timescales of 200–300 s. There were no clear periodicities in any of the analyzed thermal data, and those in the bubble burst and velocity data were only evident at short periods, <20 s, and likely driven by random fluctuations. Furthermore, there were no clear relationships between the thermal and velocity datasets.
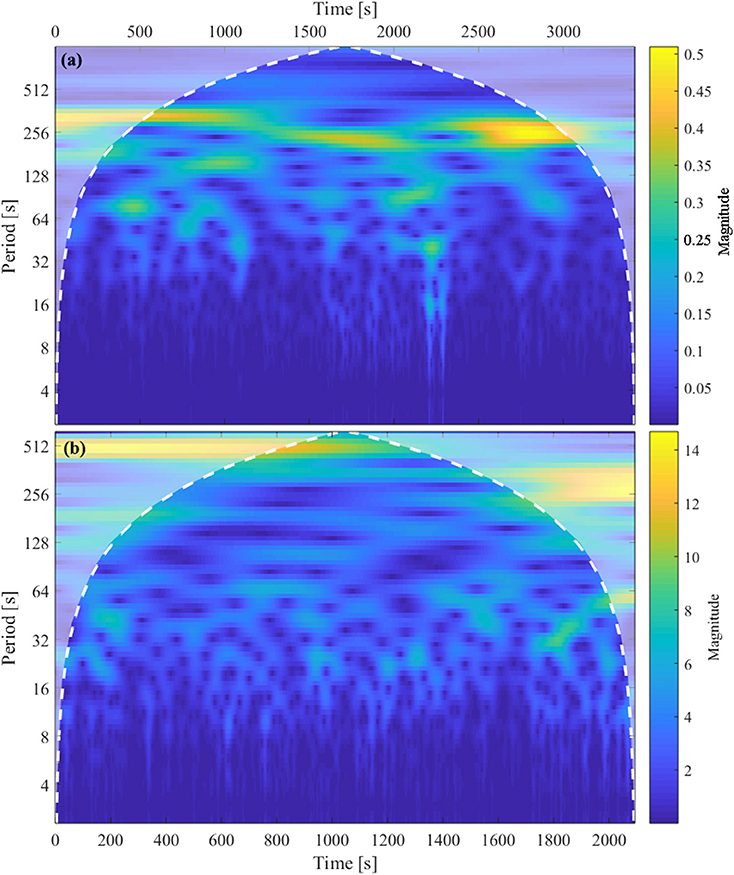
Figure 7. Wavelet power spectrum analysis of synchronous data from 18/06/17 of (a) UV camera emission rates and (b) the thermal camera data, showing a potential periodicity at ~200–300 s in the UV data which isn't shared in the thermal time series. Dashed white line indicates the wavelet cone of influence. Note differing times on the x axes.
In the field, puffs of gas were visibly emanating from the crater area at regular intervals (see Figure 1B) during the acquisition periods, and we cannot rule out a volcanogenic cause for this activity. However, given the lack of apparent correlation between the UV camera and thermal data, we tentatively posit an atmospheric causal mechanism for the periodicity in the former dataset. An atmospheric mechanism could relate to micro-climatological conditions around the volcano and/or atmospheric transport and turbulence phenomena, such as eddying, which could be driven by crater geometry. This said, we cannot rule out at this stage that a magmatic or an alternative volcanogenic mechanism (e.g., through CO2 or H2O rich pulses) could drive this puffing given the short period of overlapping thermal and UV camera data. In order to investigate these hypotheses, contemporaneous gas ratio data would be required (e.g., Multi-GAS, as in Pering et al., 2014b).
Discussion and Conclusion
Here we highlight the dynamics of the recent lava lake at Masaya volcano, which manifested, to the best of our knowledge, the highest surface velocities (13.7–16.4 m s−1) ever reported for a lava lake. In comparison, despite its turbulent surface motion and comparatively high gas emissions, even the surface velocities at Ambrym volcano are two to three times lower than those for Masaya (Table 1). Whilst the lake surface at Villarrica volcano appeared to also manifest rapid lateral motion (see Supplementary Videos of Moussallam et al., 2016), its velocity was not quantified in that article. The flow velocities at Masaya lava lake are indeed more reminiscent of lava flow behavior rather than convective overturn in a lava lake, but even the infamous flows of Nyiragongo in 2002 only reached 2.8–5.6 m s−1 (Favalli et al., 2009) and lava streams within lava tubes at Kilauea have only been observed to flow at velocities up to 4.2 m s−1 by Kauahikaua et al. (1998). Velocities comparable to those reported here may be theoretically possible for the longest basaltic lava flows on Earth (of over 100 km in length), e.g., >4–12 m s−1 (Keszthelyi and Self, 1998), further highlighting the uniqueness of our observations. It should, however, be noted that at the first point of the lava appearing at the surface, i.e., further to the southeast than visible in the imagery used for our analyses, the lava surface appeared to be traveling at visibly reduced velocities (see videos in Supplementary Table 1). This intimates some mechanism whereby the lava velocity increases, and then, as observed in our velocity analysis, begins to slow. We also observed a curvature in lake motion that was more pronounced on the western than eastern side (Figure 5). Figure 8 highlights a possible causal mechanism, involving the deflection of rapidly ascending magma into a surface chamber, where observers see only a window into this process.
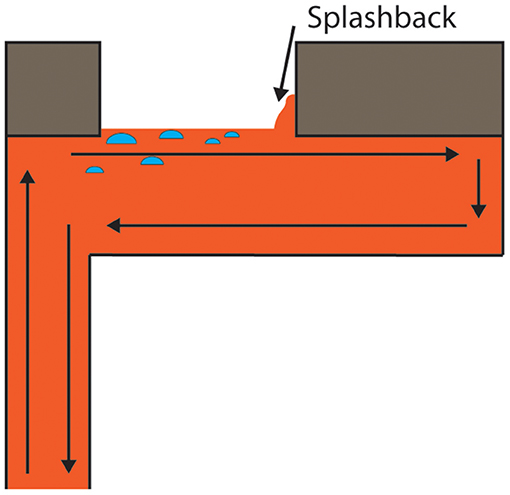
Figure 8. An illustration of hypothetical lava lake behavior at Masaya. Arrows indicated possible directions of fluid flow. The deflection of rapidly ascending magma into a surface chamber could drive the processes measured at the surface, through the “window” available to observers.
Our gas data, with SO2 emission rates of 3.1–3.7 kg s−1, are similar to those reported by Aiuppa et al. (2018), but are toward the lower range of reported values, during an earlier stage of the lava lake (with data ending in early 2017). This is consistent with the general waning in activity throughout 2017 as seen in our video, but measurements were potentially hampered by an optically thick plume, so are likely an underestimation (Kern et al., 2013). Supplementary Table 1 shows videos from different stages of the lake's activity, highlighting that early on in the lake's existence, the rapid lateral motion of its surface was punctuated by visibly larger bursts, which were not present during our measurement period. This reduction in explosion rates, and potentially lava lake level, is entirely consistent with the lower SO2 emission rates reported here.
Periodicity analysis only revealed oscillations in the SO2 emission dataset (of period 200–300 s), and not in any of the other datasets, suggesting that as per Moussallam et al. (2016) at Villarrica, turbulent mixing of the magma within the conduit disrupts any potential periodicity, and that the detected periodicity in the degassing data was of atmospheric origin. Specifically, any large puffs of gas, which would likely be driven by the bursting of large bubbles, were not observed on the lake surface. Furthermore, the absence of clear periodicity in thermal data suggests that a gas-rich and higher temperature pulse could also not drive the periodic behavior. The range of bubble diameters was 0.6–8.5 m, a wider range than the 3–6 m observed at Erta ‘Ale by Bouche et al. (2010), but with a lower median value at Masaya of 2.6 m. We suggest that these bursting bubbles have little influence on the dynamics of the lake, given their small contribution to total gas emissions (~7–17%; figures which are likely lower given possible underestimation of SO2 emissions). It is likely that they are formed within the conduit, as this would explain the observation that larger diameter bubbles burst closer to the lake entrance area than those of smaller diameters; i.e., a larger diameter spherical-cap bubble will ascend at a faster velocity than a smaller one (Joseph, 2003) and therefore appear sooner at the surface than smaller bubbles, which are transported further into the lake by the rapid convection before bursting. In contrast, if bubbles were formed within the lake their size distribution ought not to vary according to location.
This study highlights the wealth of information that can be gained through the combination of visible, thermal, and gas emission imaging data, revealing a lava lake with a uniquely high flow velocity with lake surface punctuated by the bursting of spherical-cap bubbles. Similar approaches at other volcanoes could provide further refinement on our understanding of how degassing processes drive the dynamics of lava lakes and other basaltic classes of activity.
Data Availability Statement
Access to the supplementary information “Locations.kmz“ Google Earth locations file is available on request from the corresponding author.
Author Contributions
TP, TW, and RE conducted the fieldwork. JW, AM, RB, and LS provided significant technical help with instrumentation. TI, RE, SS, and TP conducted analysis. TP wrote the manuscript.
Funding
TP acknowledges funding from the Royal Society (RG170226). RE and TP were supported by a University of Sheffield GLOSS studentship. AM acknowledges funding from a Leverhulme Research Fellowship (RF-2016-580) and The Rolex Institute. JW acknowledges support of a EPSRC Fellowship (EP/M009106/1).
Conflict of Interest Statement
The authors declare that the research was conducted in the absence of any commercial or financial relationships that could be construed as a potential conflict of interest.
Acknowledgments
Thanks to INETER (Istituto Nicaraguense de Estudios Territoriales), in particular Wilfried Strauch, and the Masaya National Park for providing help with access to the volcano.
Supplementary Material
The Supplementary Material for this article can be found online at: https://www.frontiersin.org/articles/10.3389/feart.2018.00241/full#supplementary-material
References
Aiuppa, A., Maarten de Moor, J., Arellano, S., Coppola, D., Francofonte, V., Galle, B., et al. (2018). Tracking formatino of a lava lake from ground and space: Masaya volcano (Nicaragua), 2014–2017. Geochem. Geophys. Geosyst. 19, 496–414. doi: 10.1002/2017/GC007227
Allard, P., Aiuppa, A., Bani, P., Métrich, N., Betagnini, A., Gauthier, P.-J., et al. (2016a). Prodigious emission rates and magma degassing budget of major, trace and radioactive volatile species from Ambrym basaltic volcano, Vanuatu island Arc. J. Volcanol. Geother. Res. 322, 119–143. doi: 10.1016/j.volgeores.2015.10.004
Allard, P., Burton, M., Sawyer, G., and Bani, P. (2016b). Degassing dynamics of basaltic lava lake at a top-ranking volatile emitter: Ambrym volcano, Vanuatu arc. Earth Planet. Sci. Lett. 448, 69–80. doi: 10.1016/j.epsl.2016.05.014
Arellano, S., Yalire, M., Galle, B., Bobrowski, N., Dingwell, A., et al. (2017). Long-term monitoring of SO2 quiescent degassing from Nyiragongo's lava lake. J. Afr. Earth Sci. 134, 866–873. doi: 10.1016/j.afrearsci.2016.07.002
Bhaga, D., and Weber, M. E. (1981). Bubbles in viscous liquids: shapes, wakes, and velocities. J. Fluid Mech. 105, 61–85.
Bobrowski, N., Giuffrida, G. B., Arellano, S., Yalire, M., Liotta, M., Brusca, L., et al. (2017). Plume composition and volatile flux of Nyamulagira volcano, Democratic Republic of Congo, during birth and evolution of the lava lake, 2014–2015. Bull. Volcanol. 79:90. doi: 10.1007/s00445-017-1174-0
Bouche, E., Vergniolle, S., Staudacher, T., Nercessian, A., Delmont, J.-C., Frogneux, M., et al. (2010). The role of large bubbles detected from acoustic measurements on the dynaics of Erta ‘Ale lava lake (Ethiopia). Earth Planet. Sci. Lett. 295, 37–48. doi: 10.1016/j.epsl.2010.03.020
Burgi, P.-Y., Darrah, T. H., Tedesco, D., and Eymold, W. K. (2014). Dynamics of the Mount Nyiragongo lava lake. J. Geogr. Res. Solid Earth 119, 4106–4122. doi: 10.1002/2013JB010895
Campion, R., Delgado-Granados, H., and Mori, T. (2015). Image-based correction of the light dilution effect for SO2 camera measurements. J. Volcanol. Geother. Res. 300, 48–57. doi: 10.1016/j.volgeores.2015.01.004
Davies, R. M., and Taylor, G. I. (1950). The mechanics of large bubbles rising through extended liquids and through liquids in tubes. Proc. R. Soc. Lond. A 200, 375–390. doi: 10.1098/rspa.1950.0023
Del Bello, E., Llewellin, E. W., Taddeucci, J., Scarlato, P., and Lane, S. J. (2012). An analytical model for gas overpressure in slug-driven explosions: insights into Strombolian volcanic eruptions. J. Geophys. Res. Solid Earth 117. doi: 10.1029/2011JB008747
Favalli, M., Chirico, G. D., Papale, P., Pareschi, M. T., and Boschi, E. (2009). Lava flow hazard at Nyiragongo volcano, D.R.C. Bull. Volcanol. 71, 363–374. doi: 10.1007/s00445-008-0233-y
Galle, B., Johansson, M., Rivera, C., Zhang, Y., Kihlman, M., Kern, C., et al. (2010). Network for Observation of Volcanic and Atmospheric Change (NOVAC)—A global network for volcanic gas monitoring: network layout and instrument description. J. Geophys. Res. 115:D05304. doi: 10.1029/2009JD011823
Global Volcanism Program (2017). Masaya. Available online at: https://volcano.si.edu/volcano.cfm?vn=344100#bgvn_201709 (Accessed August 1, 2018).
Grinsted, A., Moore, J. C., and Jevrejeva, S. (2004). Application of the cross wavelet transform and wavelet coherence to geophysical time series. Nonlinear Processes Geophys. 11, 561–566. doi: 10.5194/npg-11-561-2004
Harris, A. J. L., Carniel, R., and Jones, J. (2005). Identification of variable convective regimes at Erta Ale Lava Lake. J. Volcanol. Geother. Res. 142, 207–223. doi: 10.1016/j.volgeres.2004.11.011
Ilanko, T., Oppenheimer, C., Burgisser, A., and Kyle, P. (2015). Cyclic degassing of Erebus volcano, Antarctica. Bull. Volcanol. 77:56. doi: 10.1007/s00445-015-0941-z
Johansson, M., Galle, B., Zhang, Y., Rivera, C., Chen, D., and Wyser, K. (2009). The dual-beam mini-DOAS technique—measurements of volcanic gas emission, plume height and plume speed with a single instrument. Bull. Volcanol. 71, 747–751. doi: 10.1007/s00445-008-0260-8
Jones, J., Carniel, R., Harris, A. J. L., and Malone, S. (2006). Seismic characteristics of variable convection at Erta ‘Ale lava lake, Ethiopia. J. Volcanol. Geother. Res. 153, 64–79. doi: 10.1016/j.volgeores.2005.08.004
Joseph, D. D. (2003). Rise velocity of a spherical cap bubble. J. Fluid Mech. 488, 213–223. doi: 10.1017/S0022112003004968
Kantzas, E. P., McGonigle, A. J. S., Tamburello, G., Aiuppa, A., and Bryant, R. G. (2010). Protocols for UV camera volcanic SO2 measurements. J. Volcanol. Geotherm. Res. 194, 55–60. doi: 10.1016/j.jvolgeores.2010.05.003
Kauahikaua, J., Cashman, K. V., Mattox, T. N., Heliker, C. C., Hon, K. A., Mangan, T. M., et al. (1998). Observations on basaltic lava streams in tubes from Kilauea Volcano, island of Hawai'i. J. Geophys. Res. 103, 27303–27323.
Kazahaya, K., Shinhara, H., and Saito, G. (1994). Excessive degassing of Izu-Oshima volcano: magma convection in a conduit. Bull. Volcanol. 56, 207–216. doi: 10.1007/BF00279605
Kern, C., Werner, C., Elias, T., Sutton, A. J., and Lubcke, P. (2013). Applying UV camera for SO2 detection to distant or optically thick volcanic plumes. J. Volcanol. Geotherm. Res. 262, 80–89. doi: 10.1016/j.volgeores.2013.06.009
Keszthelyi, L., and Self, S. (1998). Some physical requirements for the emplacement of long basaltic lava flows. J. Geophys. Res. 103, 27447–27464.
Lomb, N. R. (1976). Least-squares frequency analysis of unequally spaced data. Astrophys. Space Sci. 39, 447–462. doi: 10.1007/BF00648343
McGonigle, A. J. S., Hilton, D. R., Fischer, T. P., and Oppenheimer, C. (2005). Plume velocity determination for volcanic SO2 flux measurements. Geophys. Res. Lett. 32:L11302. doi: 10.1029/2005GL022470
McGonigle, A. J. S., Pering, T. D., Wilkes, T. C., Tamburello, G., D'Aleo, R., Bitetto, M., et al. (2017). Ultraviolet imagine of volcanic plumes: a new paradigm in volcanology. Geosciences 7:68. doi: 10.3390/geosciences7030068
Meijering, E., Dzyubackyk, O., and Smal, I. (2012). “Methods for cell and particle tracking,” In: Imaging and Spectroscopic Analysis of Living Cells, Methods in Enzymology, ed P. M. Conn. 183–200.
Morlet, J., Arens, G., Fourgeau, E., and Giard, D. (1982). Wave propagation and sampling theory—Part 1: complex signal and scattering in multilayered media. Geophysics 47, 203–221. doi: 10.1190/1.1441328
Moussallam, Y., Bani, P., Curtis, A., Barnie, T., Moussallam, M., Peters, N., et al. (2016). Sustaining persistent lava lakes: observations from high-resolution gas measurements at Villarrica volcano, Chile. Earth Planet. Sci. Lett. 454, 237–247. doi: 10.1016/j.epsl.2016.09.012
Nadeau, P. A., Werner, C. A., Waite, G. P., Carn, S. A., Brewer, I. D., Elias, T., et al. (2015). Using SO2 camera imagery and seismicity to examine degassing and gas accumulation at Kilauea Volcano, May 2010. J. Volcanol. Geother. Res. 300, 70–80. doi: 10.1016/j.volgeores.2014.12.005
Oppenheimer, C., and Kyle, P. R. (2008). Probing the magma plumbing of Erebus volcano, Antarctica, by open-path FTIR spectroscopy of gas emissions. J. Volcanol. Geother. Res. 177, 743–754. doi: 10.1016/j.volgeores.2007.08.022
Oppenheimer, C., McGonigle, A. J. S., Allard, P., Wooster, M. J., and Tsanev, V. (2004). Sulfur, heat, and magma budget of Erta ‘Ale lava lake, Ethiopia. Geology 32, 509–512. doi: 10.1130/G20281.1
Palma, J. L., Calder, E. S., Basualto, D., Blake, S., and Rothery, D. A. (2008). Correlations between SO2 flux, seismicity, and outgassing activity at the open vent of Villarrica volcano, Chile. J. Geophys. Res. 113:B10201. doi: 10.1029/2008JB005577
Patrick, M. R., Orr, T., Swanson, D. A., and Lev, E. (2016). Shallow and deep controls on lava lake surface motion at Kilauea Volcano. J. Volcanol. Geother. Res. 328, 247–261. doi: 10.1016/j.volgeores.2016.11.010
Pering, T. D., and McGonigle, A. J. S. (2018). Combining spherical-cap and taylor bubble fluid dynamics with plume measruements to characterize basaltic degassing. Geosciences 8:42. doi: 10.3390/geosciences8020042
Pering, T. D., Tamburello, G., McGonigle, A. J. S., Aiuppa, A., Cannata, A., Giudice, G., et al. (2014a). High time resolution fluctuations in volcanic carbon dioxide degassing from Mount Etna. J. Volcanol. Geother. Res. 270, 115–121. doi: 10.1016/j.volgeores.2013.11.014
Pering, T. D., Tamburello, G., McGonigle, A. J. S., Hanna, E., and Aiuppa, A. (2014b). Correlation of oscillatory behaviour in Matlab using wavelets. Computers Geosci. 70, 206–212. doi: 10.1016/j.cageo.2014.06.006
Peters, N., Oppenheimer, C., Killingsworth, D. R., Frechette, J., and Kyle, P. (2014b). Correlation of cycles in Lava Lake motion and degassing at Erebus Volcano, Antarctica. Geochem. Geophys. Geosyst. 15, 3244–3257. doi: 10.1002/2014GC005399
Peters, N., Oppenheimer, C., Kyle, P., and Kingsbury, N. (2014a). Decadal persistence of cycles in lava lake motion at Erebus volcano, Antarctica. Earth Planet. Sci. Lett. 395, 1–12. doi: 10.1016/j.epsl.2014.03.032
Radebaugh, J., Lopes, R. M., Howell, R. R., Lorenz, R. D., and Turtle, E. P. (2016). Eruptive behavior of the Marum/Mbwelesu lava lake, Vanuatu and comparisons with lava lakes on Earth and Io. J. Volcanol. Geother. Res. 322, 105–118. doi: 10.1016/j.volgeores.2016.03.019
Raffel, M., Willert, C. E., Wereley, S. T., and Kompenhans, J. (2007). Particle Image Velocimetry: A Practical Guide, 2nd Edn. New York, NY: Springer.
Richardson, J. P., Waite, G. P., and Palma, J. L. (2014). Varying seismic-acoustic properties of the fluctuating lava lake at Villarrica volcano, Chile. J. Geophys. Res. Solid Earth 119, 5560–5573. doi: 10.1002/2014JB011002
Rymer, H., van Wyk de Vries, B., Stix, J., and Williams-Jones, G. (1998). Pit crater structure and processes governing persistent activity at Masaya Volcano, Nicaragua. Bull. Volcanol. 59, 345–355.
Scargle, J. D. (1982). Studies in astronomical time series analysis. II—Statistical aspects of spectral analysis of unevenly spaced data. Astrophys. J. 263, 835–853. doi: 10.1086/160554
Spampinato, L., Oppenheimer, C., Calvari, S., Cannata, A., and Montalto, P. (2008). Lava lake surface characterization by thermal imaging: Erta ‘Ale volcano (Ethiopia). Geochem. Geophys. Geosyst. 9:e2164. doi: 10.1029/2008GC002164
Stephens, K. J., Ebmeier, S. K., Young, N. K., and Biggs, J. (2017). Transient deformation associated with explosive eruption measured at Masaya volcano (Nicaragua) using Interferometric Synthetic Aperture Radar. J. Volcanol. Geother. Res. 344, 212–223. doi: 10.1016/j.volgeores.2017.05.014
Stephens, K. J., and Wauthier, C. (2018). Satellite geodesy captures offset magma supply associated with lava lake appearance at Masaya volcano, Nicaragua. Geophys. Res. Lett. 45, 2669–2678. doi: 10.1002/2017GL076769
Stix, J. (2007). Stability and instability of quiescently active volcanoes: the case of Masaya, Nicaragua. Geology 35, 535–538. doi: 10.1130/g23198a.1
Thielicke, W., and Stamhuis, E. J. (2014). PIVlab—Towards user-friendly, affordable and accurate digital particle image velocimetry in MATLAB. J. Open Res. Softw. 2:e30. doi: 10.5334/jors.bl
Torrence, C., and Compo, G. P. (1998). A practical guide to wavelet analysis. Bull. Am. Meteorol. Soc. 79, 61–78. doi: 10.1175/1520-0477(1998)079
Vergniolle, S., and Bouche, E. (2016). Gas-driven lava lake fluctuations at Erta'Ale volcano (Ethiopia) revealed by MODIS measurements. Bull. Volcanol. 78:60. doi: 10.1007/s00445-016-1047-y
Walker, J. A., Williams, S. N., Kalamarides, R. I., and Feigenson, M. D. (1993). Shallow open-system evolution of basaltic magma beneath a subduction zone volcano—The Masaya Caldera Complex, Nicaragua. J. Volcanol. Geother. Res. 56, 379–400.
Welch, P. D. (1967). The use of fast fourier transform for the estimation of power spectra: a method based on time averaging over short, modified periodograms. IEEE Transac. Audio Electroacoust. 15, 70–73. doi: 10.1109/TAU.1967.1161901
Wilkes, T. C., McGonigle, A. J. S., Pering, T. D., Taggart, A. J., White, B. S., Bryant, R. G., et al. (2016). Ultraviolet imaging with low cost smartphone sensors: development and application of a Raspberry Pi-based UV camera. Sensors 16:1649. doi: 10.3390/s16101649
Wilkes, T. C., Pering, T. D., McGonigle, A. J. S., Tamburello, G., and Willmott, J. R. (2017). A low-cost smartphone sensor-based UV camera for volcanic SO2 emission measurements. Rem. Sens. 9:27. doi: 10.3390/rs9010027
Wilkes, T. C., Stanger, L. R., Willmott, J. R., Pering, T. D., McGonigle, A. J. S., and England, R. A. (2018). The development of a low-cost, near infrared high-temperature thermal imaging system and its application to the retrieval of accurate lava lake temperatures at Masaya volcano, Nicaragua. Rem. Sens. 10:450. doi: 10.3390/rs10030450
Williams-Jones, G., Horton, K. A., Elias, T., Garbeil, H., Mouginis-Mark, P. J., Sutton, A. J., et al. (2006). Accurately measuring volcanic plume velocity with multiple UV spectrometers. Bull. Volcanol. 68, 328–332. doi: 10.1007/s00445-005-0013-x
Keywords: lava lake, sulfur dioxide emissions, spherical-cap bubble, rapid convection, multiparametric, lake velocity
Citation: Pering TD, Ilanko T, Wilkes TC, England RA, Silcock SR, Stanger LR, Willmott JR, Bryant RG and McGonigle AJS (2019) A Rapidly Convecting Lava Lake at Masaya Volcano, Nicaragua. Front. Earth Sci. 6:241. doi: 10.3389/feart.2018.00241
Received: 03 September 2018; Accepted: 13 December 2018;
Published: 13 February 2019.
Edited by:
Franco Tassi, Università degli Studi di Firenze, ItalyReviewed by:
Dmitri Rouwet, National Institute of Geophysics and Volcanology (INGV), ItalyMark Thomas, University of Leeds, United Kingdom
Copyright © 2019 Pering, Ilanko, Wilkes, England, Silcock, Stanger, Willmott, Bryant and McGonigle. This is an open-access article distributed under the terms of the Creative Commons Attribution License (CC BY). The use, distribution or reproduction in other forums is permitted, provided the original author(s) and the copyright owner(s) are credited and that the original publication in this journal is cited, in accordance with accepted academic practice. No use, distribution or reproduction is permitted which does not comply with these terms.
*Correspondence: Tom D. Pering, t.pering@sheffield.ac.uk