 Bing Bai
 Qiang Zhang1,2*
 Wei Shao
- 1School of Atmospheric Sciences, Lanzhou University, Lanzhou, China
- 2Lanzhou Institute of Arid Meteorology, China Meteorological Administration, Lanzhou, China
- 3School of Hydrology and Water Resources, Nanjing University of Information Science and Technology, Nanjing, China
- 4Lanzhou Central Meteorological Observatory, Lanzhou, China
The study region was the East Asian summer monsoon (EASM) transition zone. The datasets used in this study included the daily data of national stations, reanalysis datasets of the European Centre for Medium-Range Weather Forecasts (ECMWF), Cloud-Aerosol Lidar and Infrared Pathfinder Satellite Observations (CALIPSO) and Moderate Resolution Imaging Spectroradiometer (MODIS) data. All datasets covered a total period of more than 1 year (from January 2008 to December 2016). We analyzed the influence of EASM on aerosol optical depth (AOD) in the transition zone and the response of different types of aerosols in the transition zone to the abundant and deficient monsoon years. It was found that the AOD was 0.15 in abundant years, while it was 0.09 in deficient years. The abundant year’s AOD was 40% larger than deficient years. In deficient years, with less precipitation, the influence of precipitation on the AOD was more significant. The dust was mainly distributed at 2–6 km in the western part of the transition zone, while the polluted aerosols were distributed at 0–4 km in the central and eastern region. The frequency of dust was significantly lower in abundant years, and dust particles accounted for about 19.6%. The frequency of polluted aerosols had an opposite trend, accounting for about 71.8%. Our findings bringed insight into the vertical distribution of aerosols in the atmospheric boundary layer and the interannual variation over the transition zone.
Introduction
Aerosol pollution can affect human health and has an important role in global climate change. The concentration of aerosol in East Asia is relatively high, which is due to the large emissions associated with rapid economic growth and industrialization. The interaction between the East Asian summer monsoon (EASM) and aerosols had attracted much attention in climatic and environmental studies, such as the deterioration of air quality, intensification of drought, and exacerbated flooding disasters (Gao et al., 2018; Wang et al., 2018; Zhu et al., 2018; Duan et al., 2019; Yu et al., 2019). The aerosol concentration in eastern China had shown rising trend after South Asia over time. In both regions, the main input of aerosol were anthropogenic aerosols and the aerosol concentration in China was relatively high (Zhang et al., 2013). In addition, East Asia is one of the main monsoon regions. The climate characteristics such as temperature, precipitation, and atmospheric circulation display obvious seasonal variation. The variation over different time scales are directly related to regional precipitation and temperature. Many studies on the interaction have been the focus of long-term global climate change research (Zhou et al., 2009; An et al., 2015; Su et al., 2016).
In recent years, there have been many studies on the interaction between aerosols and the monsoon climate. Bollasina et al. (2011) conducted a series of simulation experiments using the air-sea coupled model. It was found that the observed decrease in precipitation in South Asia was mainly attributed to the emission of anthropogenic aerosols, and aerosols played an important role in the climate change process in South Asia. Patil et al. (2017) studied the influence of aerosols on cloud properties in abundant and deficient monsoon years, and found that aerosols could change cloud properties in opposite ways in different monsoon years. Using long-term aerosol and cloud observation data from the South Great Plains (SGP) of the United States, Li et al. (2011) studied the effects of aerosols on clouds and precipitation under various weather conditions. The results showed that in wet areas or seasons, an increase in aerosol concentration would lead to the development of deeper clouds. The frequency and intensity of precipitation would increase significantly. In contrast, aerosols would inhibit cloud development, reduce precipitation, and increase the probability of drought in dry season or regions. Wu G.X. et al. (2016) found that the influence of aerosols was related to the regional monsoon on the East Asian. The summer monsoon makes East Asia warm and humid, and aerosols may enhance convection and precipitation at this time.
Much attention has been paid to the influence of aerosols on the intensity and precipitation of the Asian summer monsoon, while less attention was given to the influence of the EASM on aerosols. Some researchers have considered this issue and have undertaken relevant studies. Through model and data analysis, in a deficient monsoon year, it was found that the aerosol column concentration and optical depth was well distributed in southern China under the similar surface emissions. While in an abundant monsoon year, the distribution extended to northern China. The East Asian monsoon is also accompanied by an abundant water vapor transport, which enhances the atmospheric humidity over eastern China in summer (Yan et al., 2011). Li et al. (2012) showed that the abundance of summer tropospheric water vapor in East Asia relative to that in Europe and the United States would enhance the growth of hygroscopic aerosols (such as sulfate aerosols). The subsequent direct radiation forcing indicated that the radiative effect of East Asian aerosols was closely related not only to the aerosol concentration, but also to the water vapor characteristics in the region.
The influence of the EASM gradually declines from southeast to northwest China, and finally transits to the westerly zone, which is the edge of summer monsoon activity. There have been many different definitions proposed for the summer monsoon boundary. Synthesizing these definitions, Hu and Qian (2007) defined the northern boundary of summer monsoon using precipitation (1/6 monthly average precipitation ≥20 mm), wind (southwest wind), and the Pseudo equivalent temperature (850 hPa potential temperature ≥335 K). Their definition can objectively reflect the advance of summer monsoon. The distribution of northern boundary of summer monsoon over the past 44 years (Figure 1) was generally “southwest→northeast” and it obliquely penetrated China hinterland.
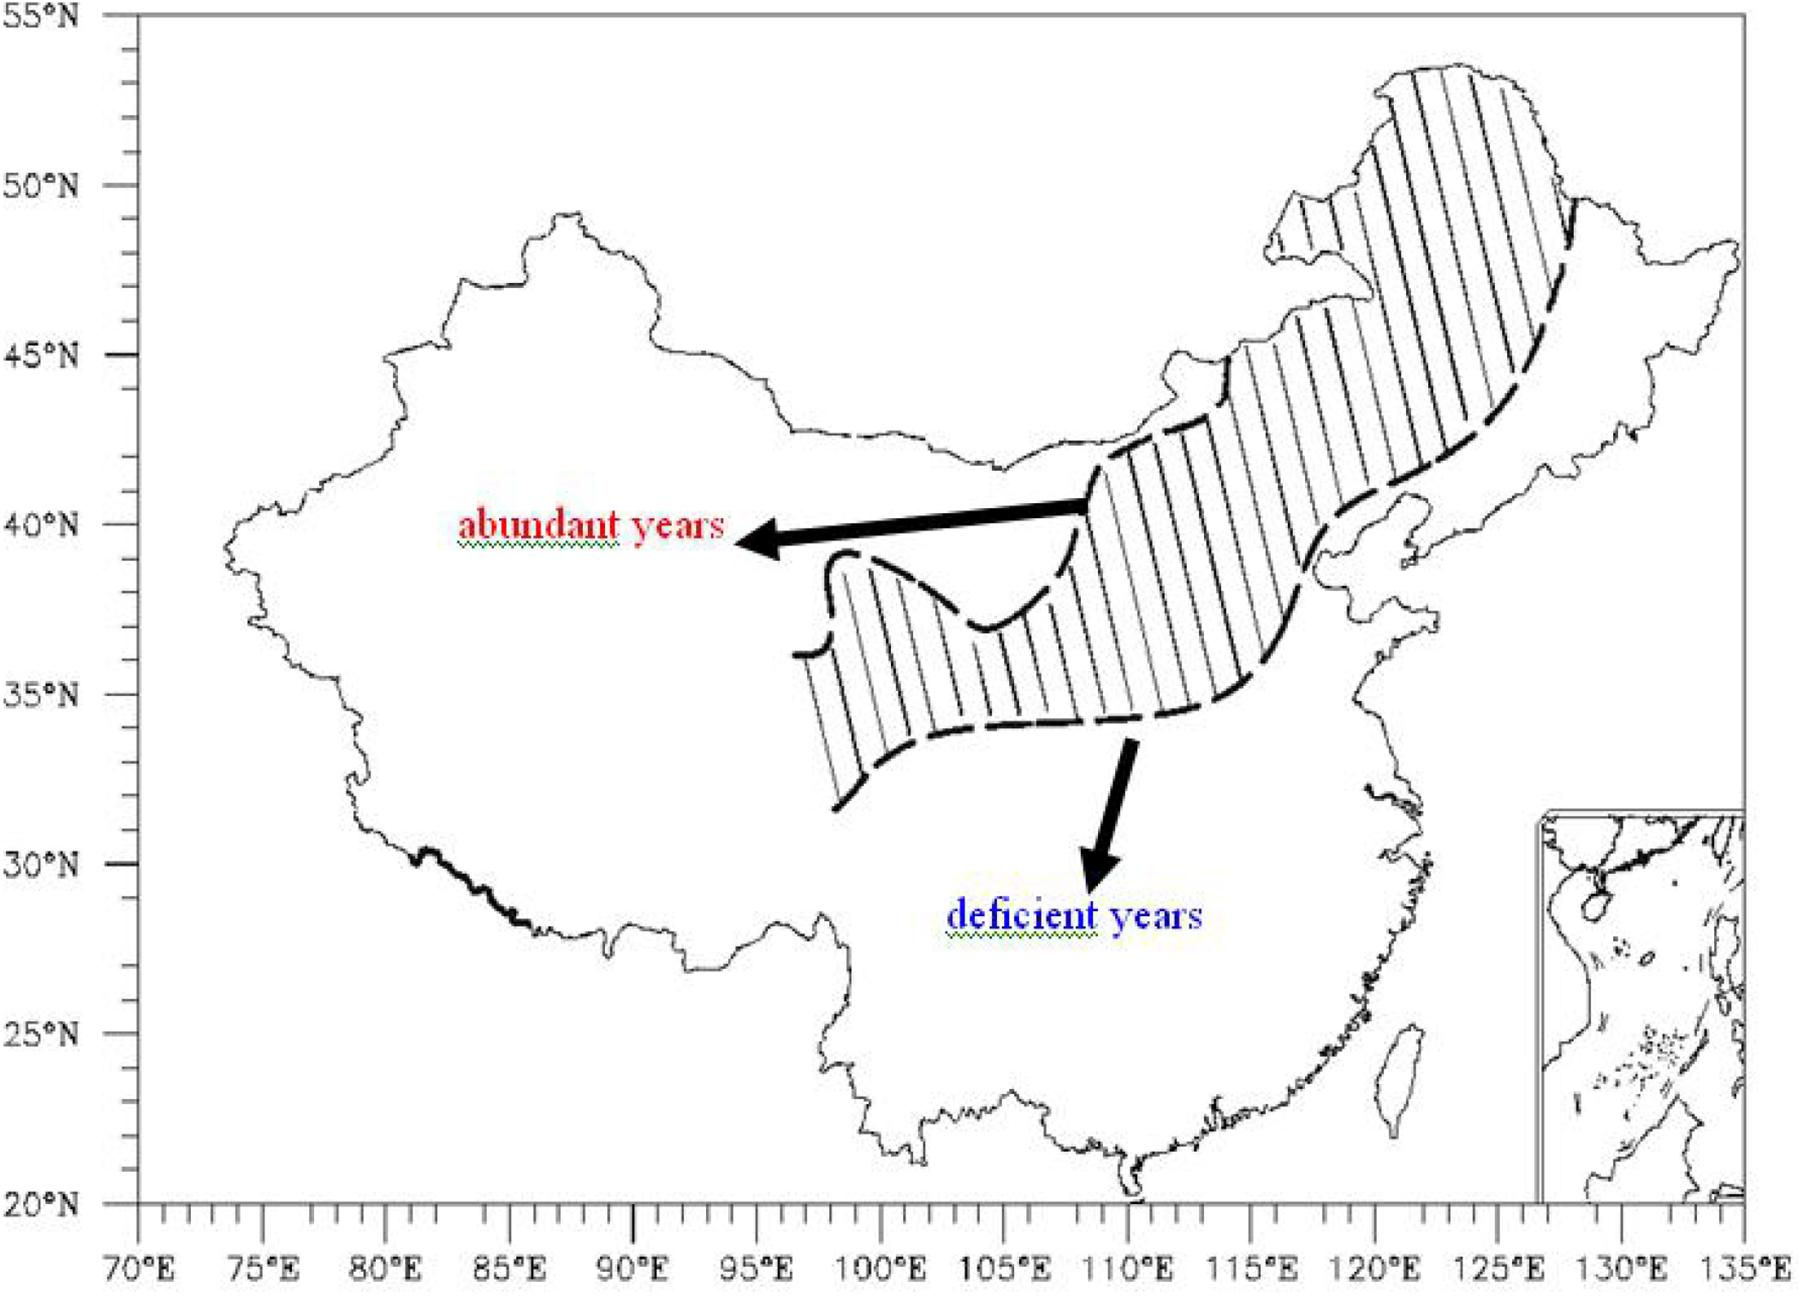
Figure 1. Distribution of the summer monsoon transition zone in China (the area marked by the oblique line represents the summer monsoon transition zone).
However, the northern boundary of summer monsoon is not fixed, and there will always be obvious interannual and interdecadal oscillations. The summer monsoon oscillates about 33°∼44° N near 110° E. The interannual oscillations of the summer monsoon is 11° of latitude and the interdecadal oscillations of the summer monsoon is 1.5° of latitude. Usually, this oscillation region is called “the transition zone of summer monsoon,” and there have been few studies on aerosols over the transition zone. The region is very sensitive to the influence of summer monsoon activity. Summer monsoon precipitation makes a key contribution to annual precipitation. When the EASM become weaker, the transition zone is exposed to drought and desertification. This is the key region in our studies. In this study, we investigated the distribution of aerosols in the transition zone affected by EASM circulation and the response mechanism of different kinds of aerosols to abundant and deficient monsoon years. We employed observational, reanalysis data and satellite remote sensing data to study the distribution of aerosols in the transition zone. This is also a very prominent scientific problem.
Materials and Methods
Cressman Interpolation
The Cressman interpolation algorithm was proposed by Cressman (Berjamin and Seaman, 1985). Cressman interpolation algorithm is an objective analysis method and it is mostly used in Meteorological Field. A stepwise correction method is used to optimize the interpolation. The difference between the actual data and the initial value is used to change and revise the initial value. A new field is obtained, and then the difference between the new field and the actual value is obtained. The last field is corrected until the corrected field approaches the actual data. For any meteorological element α, α0 is the first guess value of α on the lattice point (i, j), α′ is the correction of α on the lattice point (i, j) and Δαk is the difference between the observed value and the first guess value at the observation point k. Wi, j, k is the weighting factor, which varies between 0 and 1. K is the number of stations in the radius of influence R. The most important part of the Cressman objective analysis method is the determination of the weighting function Wi, j, k. The algorithm is defined as follows:
The radius of influence R is a constant, which is selected by scanning from near to far. The commonly used influence radius R are 1, 2, 4, 7, and 10. Di,j,k is the distance between the lattice point (i, j) and the observation point k.
The Cressman interpolation algorithm is an objective analysis method. It is a gradual correction interpolation method which inserts discrete points into regular lattice points and produces smaller errors. It is widely used in the objective analysis of various diagnostic and numerical prediction schemes in meteorological fields.
Summer Monsoon Index
The EASM has the obvious inter-annual variability. The monsoon index reflects the inter-annual variability of large scale, which can be used to indicate the intensity of the monsoon. The EASM includes not only equatorial and mid-latitude circulation systems, but also lower and upper tropospheric systems. Based on this, Zhao et al. (2015) defined a new EASM index using the 200 hPa zonal wind field. The index could capture the interannual and interdecadal variability of the EASM. Compared with the other 15 summer monsoon indices, the new index was more effective at describing precipitation and temperature in East Asia. Because the EASM has an obvious interannual variation, a study of the aerosol characteristics under the background of monsoon intensity in extreme years would have a clear physical significance and scientific basis. In this study, the new EASM index (NEWI) was calculated from 2008 to 2016. According to the NEWI results, the abundant monsoon years were 2010 and 2013, and the deficient monsoon years were 2008 and 2015, as shown in Figure 2.
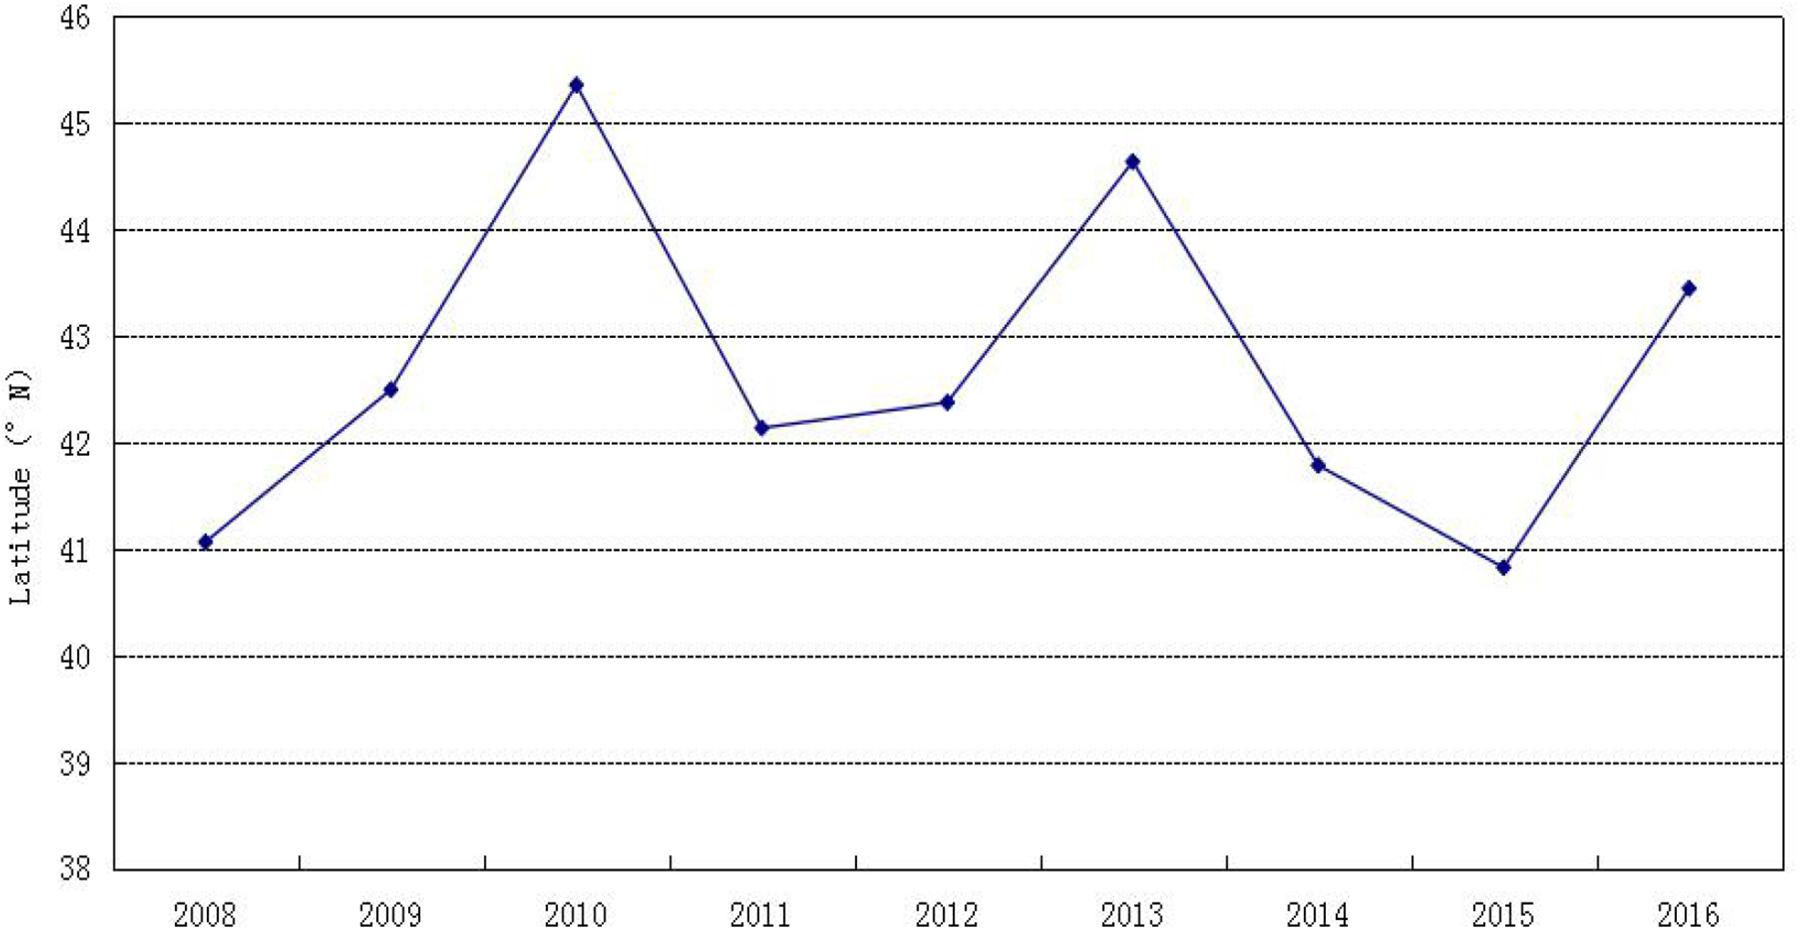
Figure 2. The new East Asian summer monsoon index (NEWI) for 2008–2016.
Data
The datasets used in this study include observational data from surface stations, the reanalysis product from European Centre for Medium-Range Weather Forecasts (ECMWF) (horizontal resolution of 2.5 × 2.5 and vertical height of 100–1000 hpa), MODIS level 3 gridded product (MOD08) and the Cloud-Aerosol Lidar and Infrared Pathfinder Satellite Observations (CALIPSO) Level 2 aerosol layer products. All datasets covered a total period of more than 1 year (from January 2008 to December 2016). The CALIPSO satellite has contained an active lidar instrument called the Cloud-Aerosol Lidar with Orthogonal Polarization (CALIOP) Lidar and a passive infrared visible imager. It could provide new data for studying the vertical structure and characteristics of the cloud and aerosol (Wu Y.R. et al., 2016; Wu et al., 2017).
CALIPSO aerosol model was based on cluster analysis of Aerosol Robotic Network (AERONET) measurements and determined the types, physical and optical properties (Omar et al., 2005). Aerosol types were divided to six based on this approach: clean marine, dust, polluted continental, clean continental, polluted dust and smoke (in Table 1). δV is the depolarization ratio, is the backscattering coefficient, Area is underlying surface and Lift phenomenon means whether the particles could lift. Because the study region include only inland areas, we mainly studied dust, polluted continental, polluted dust, smoke. The lidar ratios at 532 nm (1064 nm) were 40(55), 70(30), 65(30), and 70(40)sr, respectively. The result was comparable with other findings and confirmed by a lot of observation (Voss et al., 2001; Liu et al., 2002). Based on lidar ratios of different aerosol types, we classified aerosols as dust and polluted aerosols that include polluted continental, polluted dust and smoke. We analyzed the characteristics of dust and polluted aerosols in abundant and deficient year.
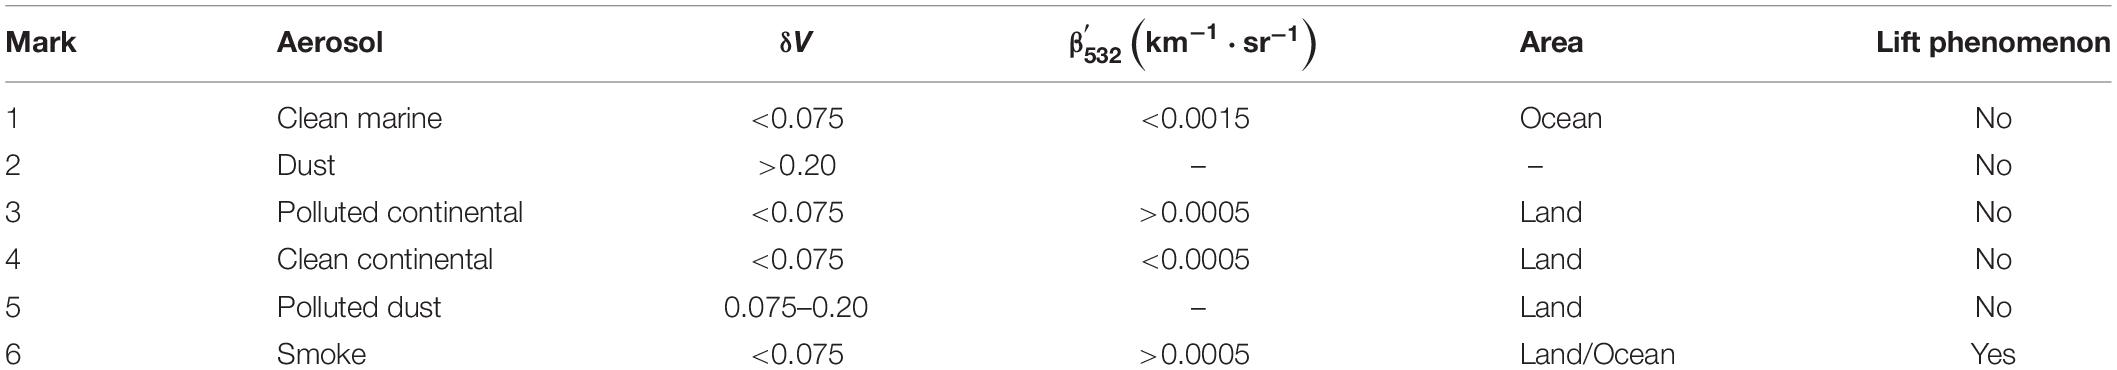
Table 1. Level 2 dataset aerosol classification.
Results
The Aerosol Spatial Distribution
The error source of satellite retrieving aerosol optical depth (AOD) is surface albedo. NASA estimate the error range of MODIS AOD. The error range is Δτ = ± 0.05 ± 0.2τ and the relative error is about 20% (Chu et al., 2002). In the dense vegetation surface inland, the root mean square error is less than 0.1. However, that is up to 0.3 in the coastal region. Retrieval of AOD is in the environment background. The extinction coefficient of aerosol is significantly affected by relative humidity. In the case of high relative humidity, the water-soluble aerosol particles are increased significantly through moisture absorption growing with the extinction coefficient increment. In abundant years, with the higher relative humidity, the error is larger.
Figure 3 shows the monthly average AOD from the MOD08 and the distribution of precipitation interpolated to lattice points by the Cressman interpolation algorithm. In abundant years, the high AOD values were mainly distributed in the middle of the transition zone. While in deficient years, the high AOD values were mainly distributed in the middle and northeast of the transition zone. Due to the warm wet air flow and high relative humidity caused by the summer monsoon, the AOD was larger in abundant years. In abundant years, the mean AOD was 0.15 in the transition zone, while the mean AOD was 0.09 in deficient years. The abundant years’ AOD was about 40% larger than that of deficient years.
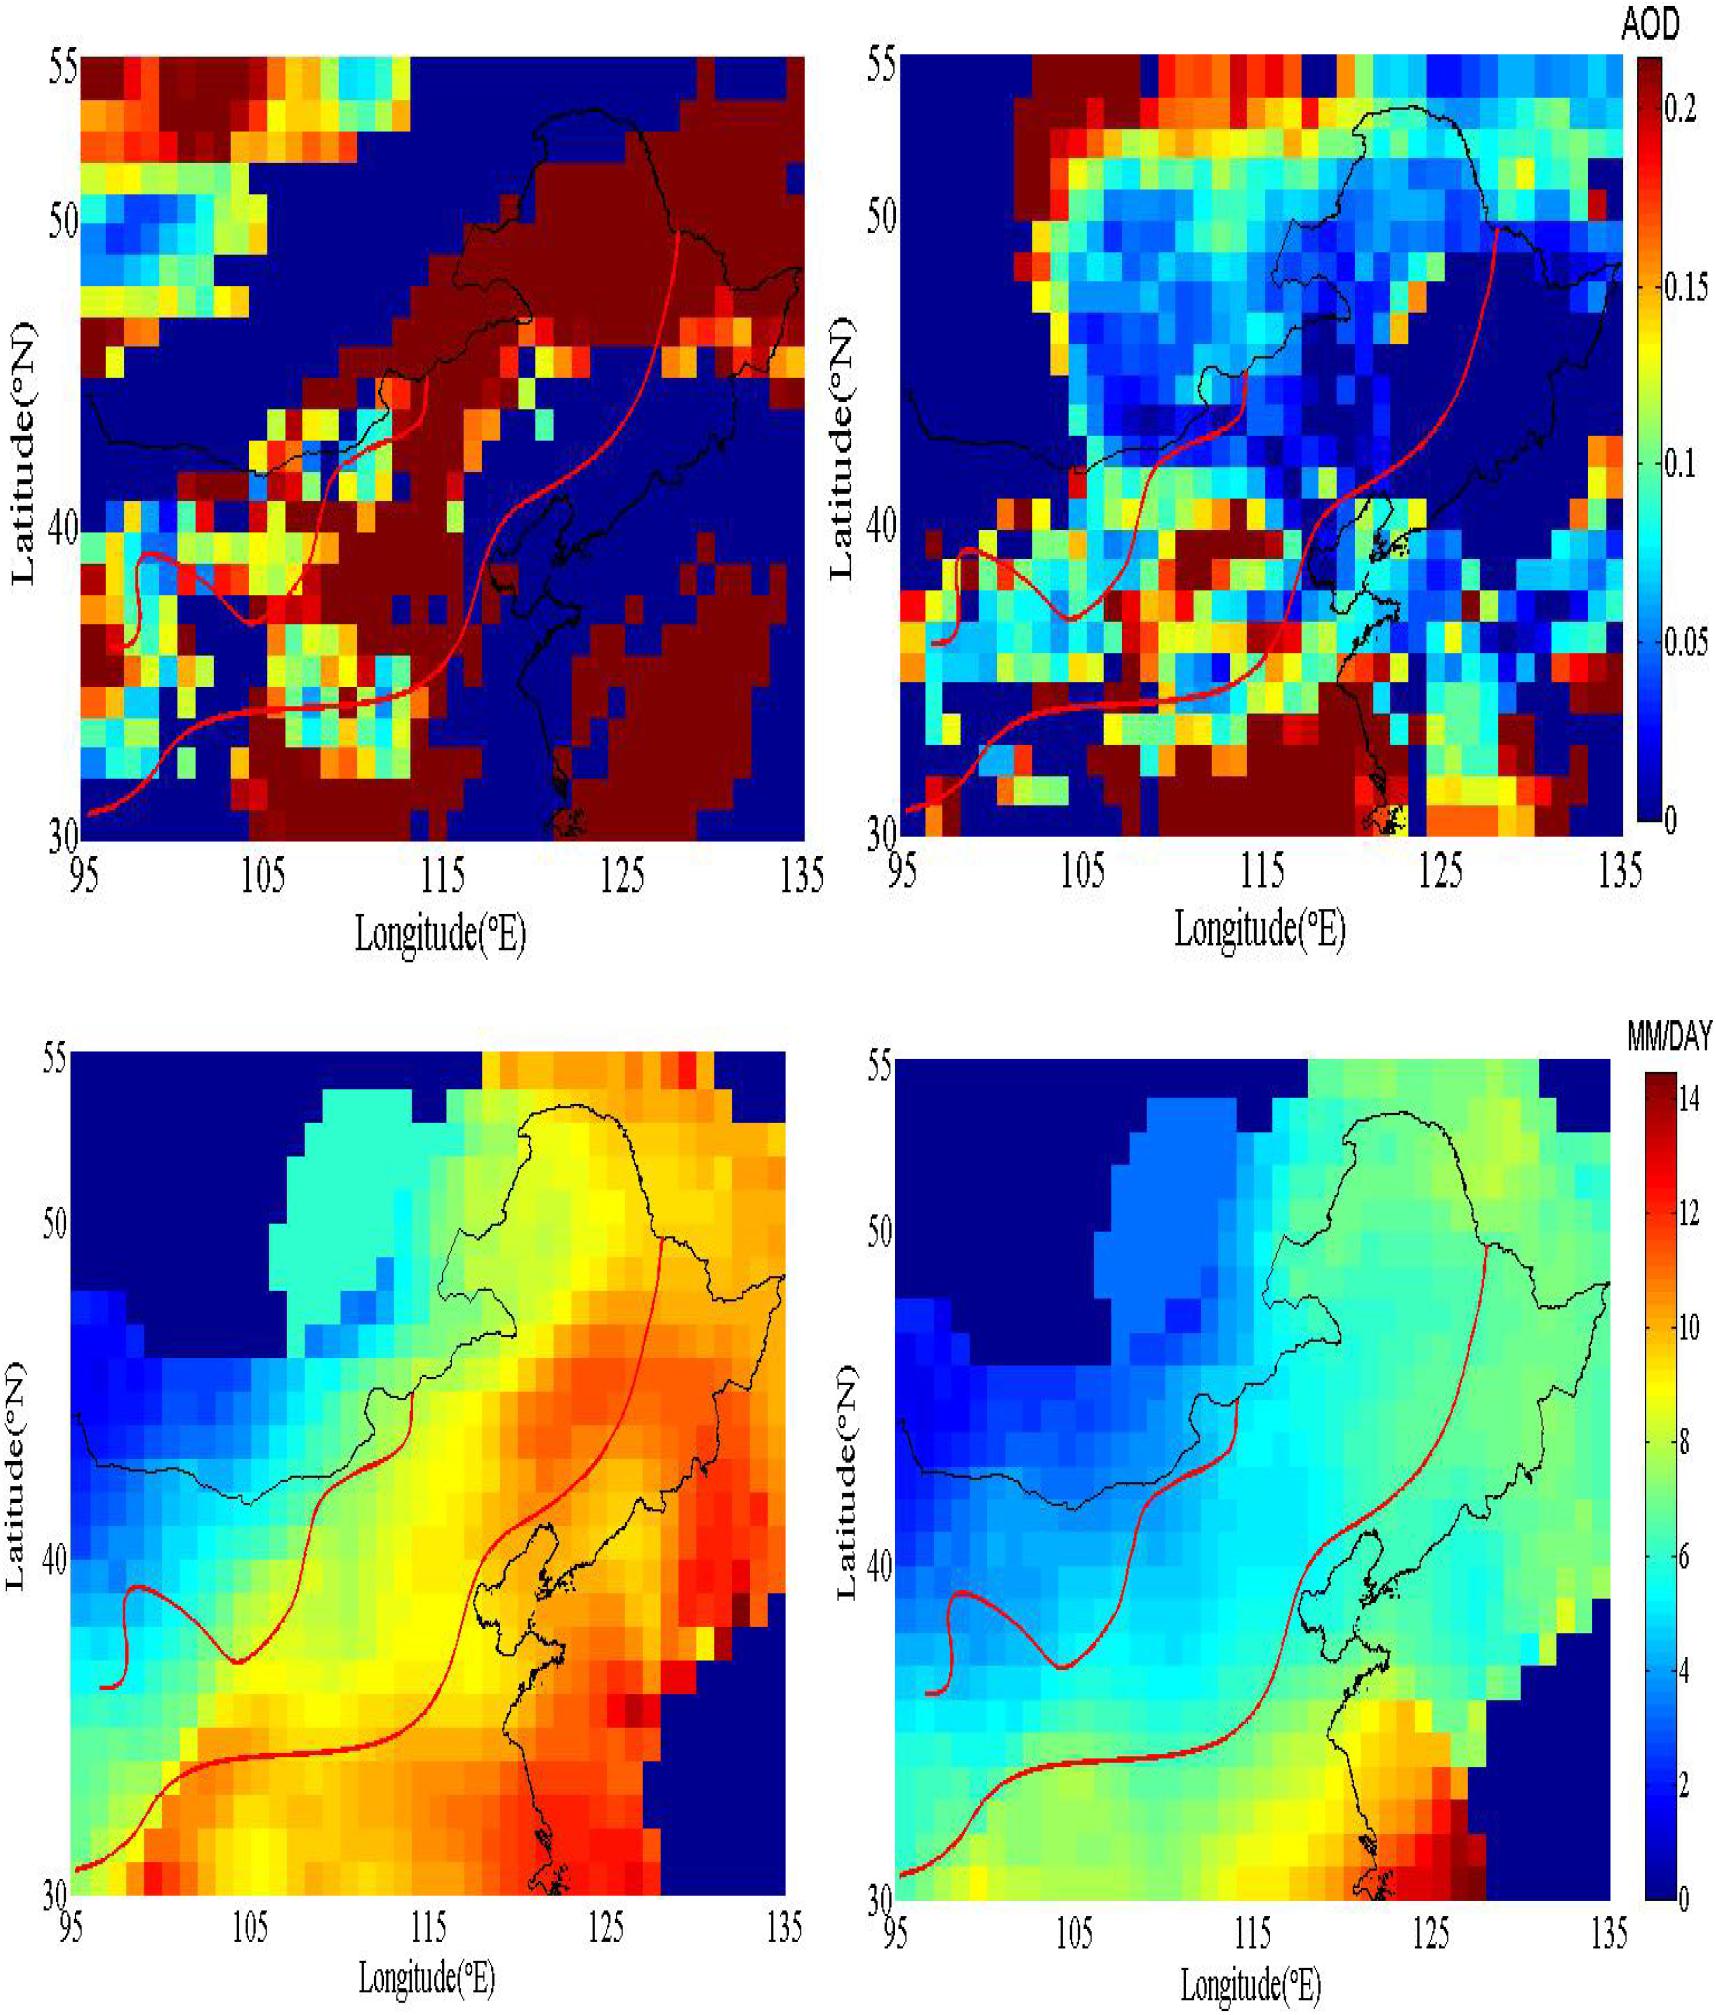
Figure 3. Aerosol optical depth (AOD) and precipitation over the transition zone in abundant and deficient years (Left: abundant years; Right: deficient years).
The variation of EASM intensity and the north-south swing determined the change in the transition zone. Huang et al. (2009) studied the relation between the north boundary of summer monsoon in East Asian and the precipitation with soaking rainfall. They found that the change of the north boundary had a great impact on the precipitation in the transition zone. The summer rainfall along the belt had comparatively interannual change and the precipitation positively correlated with the intensity of summer monsoon (Tang et al., 2006). Based on the distribution of precipitation, it was apparent that the precipitation had a stepwise decreasing trend from southeast to northwest in East Asia. It was more prominent in the transitional zone and the precipitation decreased sharply from southeast to northwest, especially in abundant years. In summer, there is abundant water vapor content in the air. Because of high relative humidity, the AOD is increased significantly through moisture absorption growing (Xia et al., 2007). In abundant years, the water vapor content is higher over the transition zone. So the AOD is also larger. Besides, we considered the aerosol’s wet deposition and the correlation between the AOD and precipitation was calculated. The correlation coefficient between the AOD and precipitation was −0.65 in abundant years, but the corresponding value was −0.77 in deficient years, with the confidence level of 95%. It showed that the correlation between the AOD and precipitation was stronger in deficient years. So the impact of precipitation on the AOD is more significant.
Frequency of Dust and Polluted Aerosols
Because aerosols and clouds usually have great spatial variability and strong backscattering intensity at low altitude, the focus of this study was the altitude region between 0 and 10 km. It was divided into five layers of 0–2, 2–4, 4–6, 6–8, and 8–10 km, respectively. Figure 4 shows the frequency of dust and polluted aerosols in the transitional area affected during the abundant and deficient monsoon years in different altitude layers.
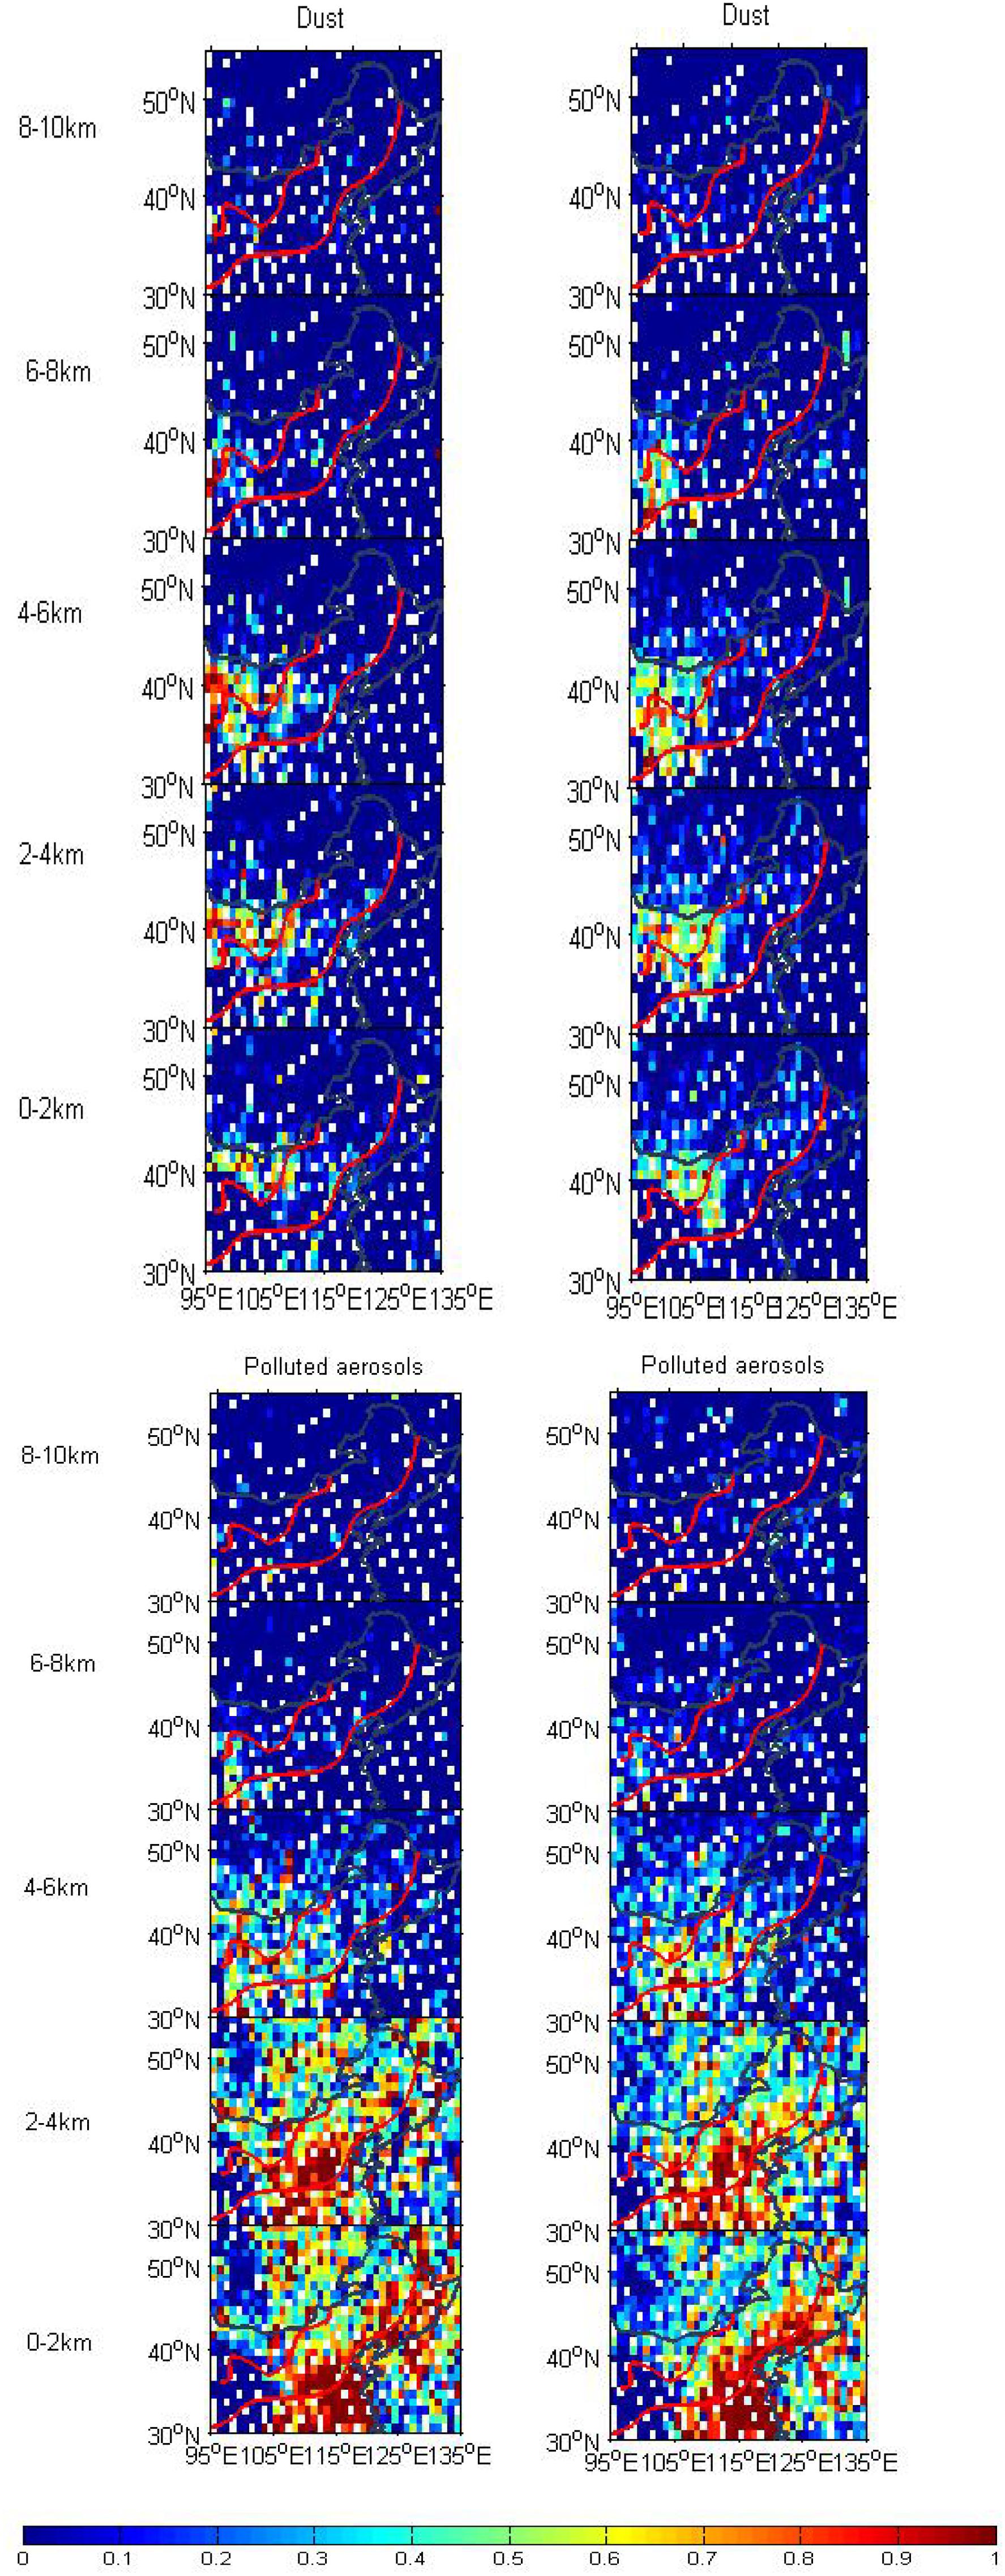
Figure 4. Frequency of dust and polluted aerosols over the transition zone (red curve region) in abundant and deficient years (Left: abundant years; Right: deficient years).
In abundant years, the frequency of dust is about 4% at 0–2 km. It is about 6% at 2–4 km and distributed primarily in central of the transition zone. For 4–6 km, it is about 8% in the west of the transition zone. The land here is mainly desert and the frequency of dust is the highest in this altitude. Zhang et al. (2005) found the existence of convective boundary layer extending up to 4 km during extreme arid region in summer sunny day. Over the Sahara desert, Marsham et al. (2008) observed the deep convective boundary layer up to 5.5 km and the characteristics of its residual layer were very prominent. The deep boundary layer convection could transport dust to the higher altitudes (Takemi, 1999) and it provided advantages for long-distance transportation of dust in horizontal direction (Iwasaka et al., 2003).
In deficient years, the frequency of dust is about 8.9% at 2–4 km and about 9.3% at 4–6 km. It is distributed primarily in the central and west of the transition zone. The characteristics are significantly different from the abundant years. We find the dust particles at 6–8 km. There were studies that showed the spaceborne lidar was an effective tool to height measurement of boundary layer (Ao et al., 2012). As a tracer, dust particles can be used to retrieve the height of boundary layer. Jordan et al. (2010) firstly proposed the maximum standard deviation method, which calculated the height of boundary layer by CALIPSO 532 nm extinction backscattering. CALIPSO data also showed that the dust was mixed throughout the depth.
The height of polluted aerosols was lower, which were distributed primarily in central and east of the transition zone. They concentrated from ground to 4 km. In the abundant year, the frequency of polluted aerosols was about 19% at 0–2 km and 21% at 2–4 km; In the deficient year, the frequency of polluted aerosols was about 15% at 0–2 km and 18% at 2–4 km. If we only considered wet deposition, the same as dust, the frequency of polluted aerosols was lower in abundant year than that in deficient year. Interestingly, observation was just the opposite. We attempted to determine the reason for this. Figure 5 showed the ECMWF reanalysis (ERA) wind at 700 hPa and 850 hPa. At 700 hPa, the deficient year’s prevailing wind was northwest in the transition zone and the north boundary of summer monsoon displays obvious recession to the south. But the abundant year’s prevailing wind was southeast and the north boundary of summer monsoon moves to north. At 850 hPa, the prevailing wind were the southern both in the abundant and deficient years. Southern winds were stronger in abundant years. The polluted particles were transmitted from South China to the transition zone by atmospheric circulation. In the following study, we would simulate the trajectory of pollutants by numerical model.
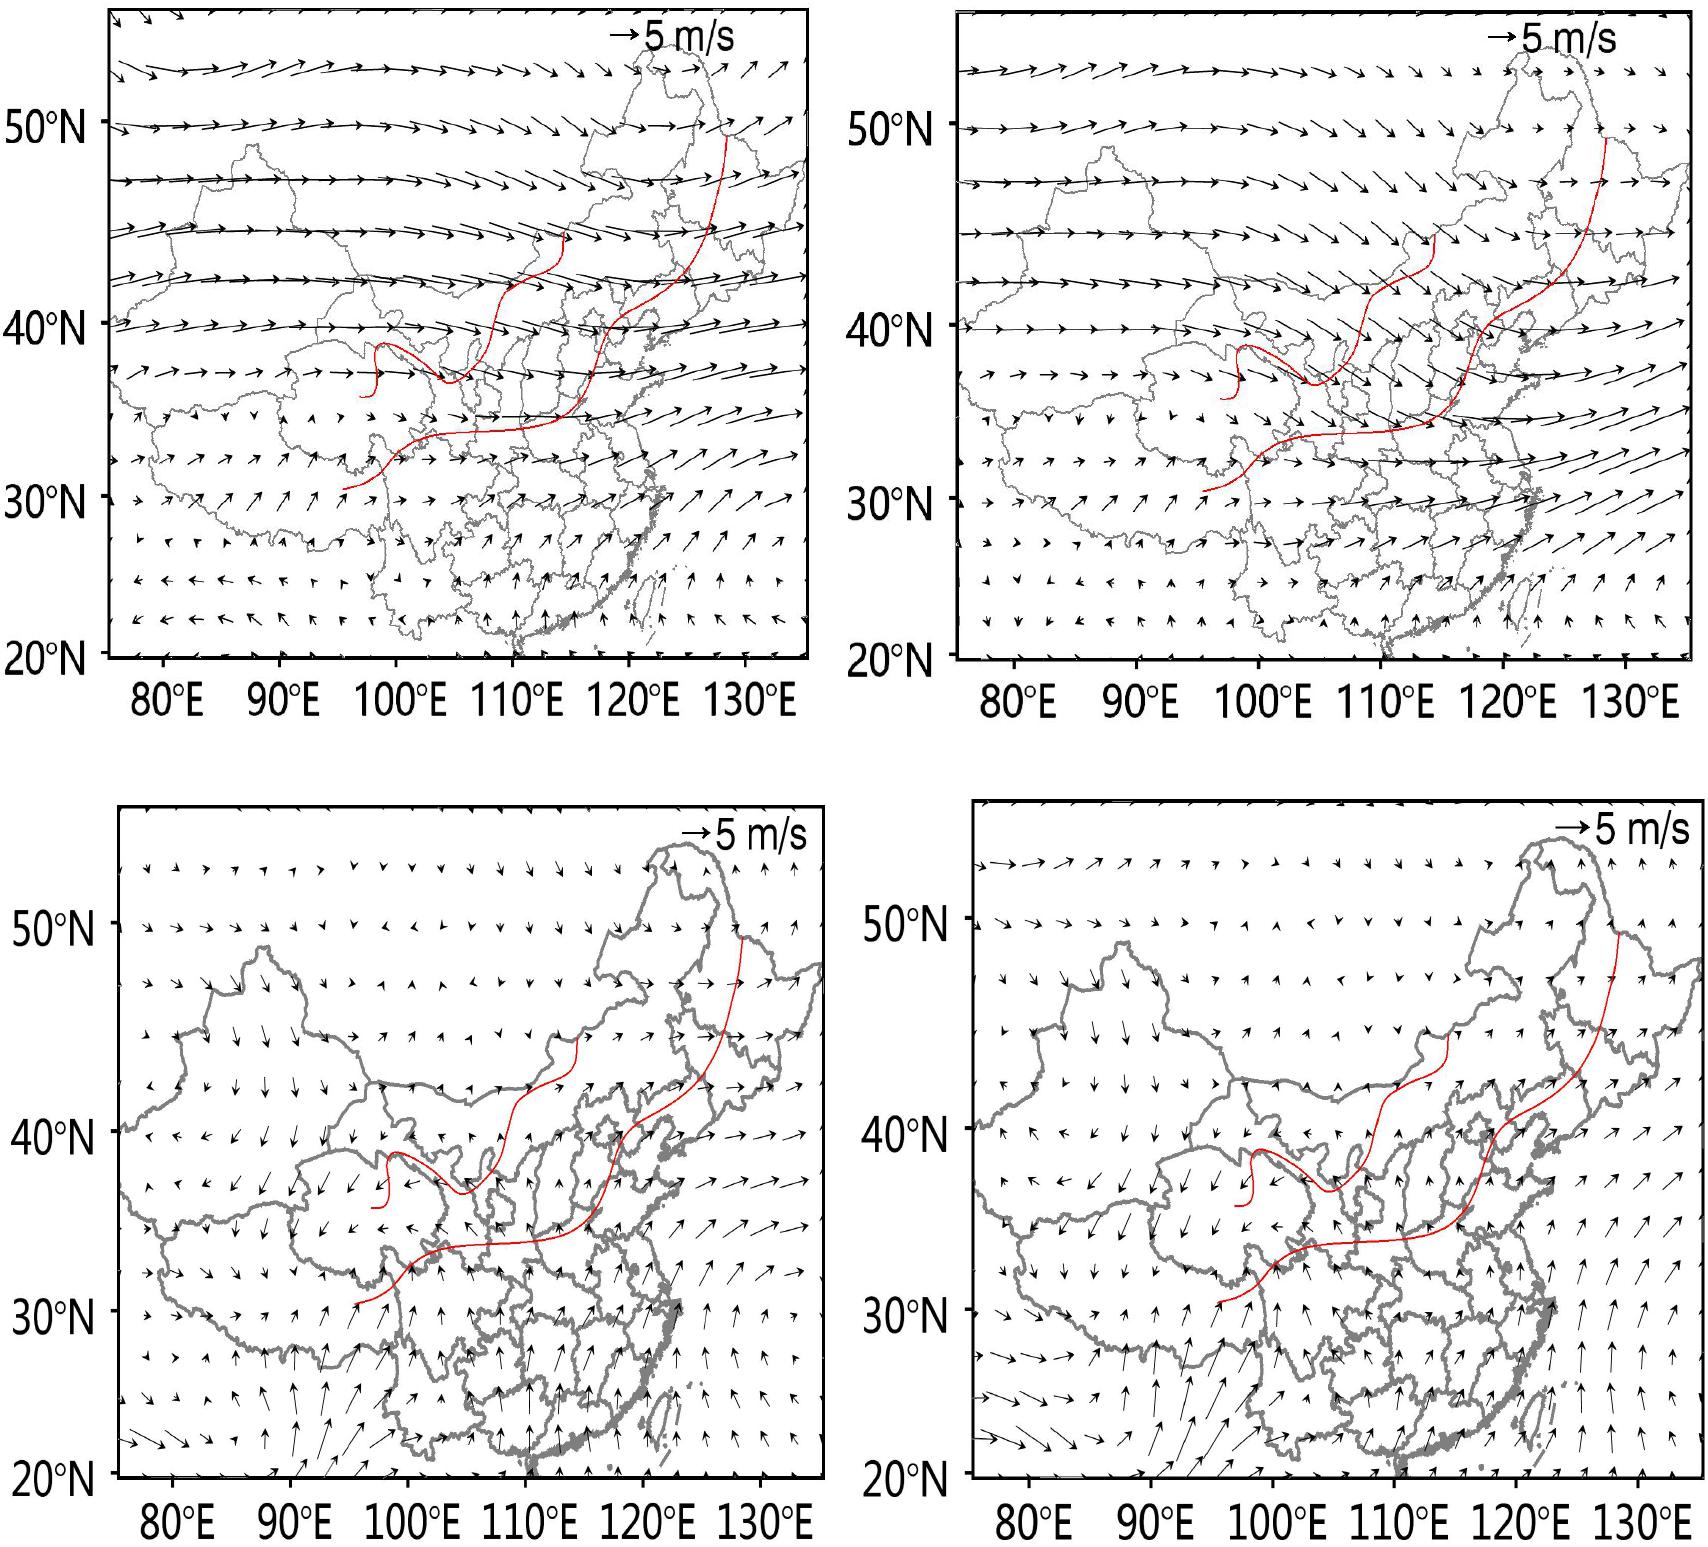
Figure 5. The wind field in summer of ECMWF at 700 hPa (above chart) and 850 hPa (bellow chart) over the transition zone in abundant and deficient monsoon years (Left: abundant years; Right: deficient years).
The main components of the aerosols over the transition zone were dust and polluted aerosols (Figure 6). In abundant years, dust accounted for about 19.6%, while polluted aerosols accounted for about 71.8%. The two kinds of aerosols accounted for about 91.4% of the total aerosols. In deficient years, dust accounted for about 31.2% of the total aerosols, while polluted aerosols accounted for 61.4%, i.e., the two kinds of aerosols accounted for about 92.6% of the total atmospheric aerosol. Therefore, the total amount of aerosol particles over the transition zone was basically the same in different extreme monsoon years. The proportion of large particle size (dust) and smaller particle size (polluted aerosols) were different. Due to general circulation and moisture transfer in abundant years, the proportion of polluted particles increased and the particle size of polluted particles became larger through moisture absorption growing. This phenomenon would affected AOD of this field. The main factors affecting the atmospheric AOD of this field were the wet deposition of dust particles and the hygroscopic growth of polluted particles. In further studies, we need to figure out which is the main factor to AOD of this field.
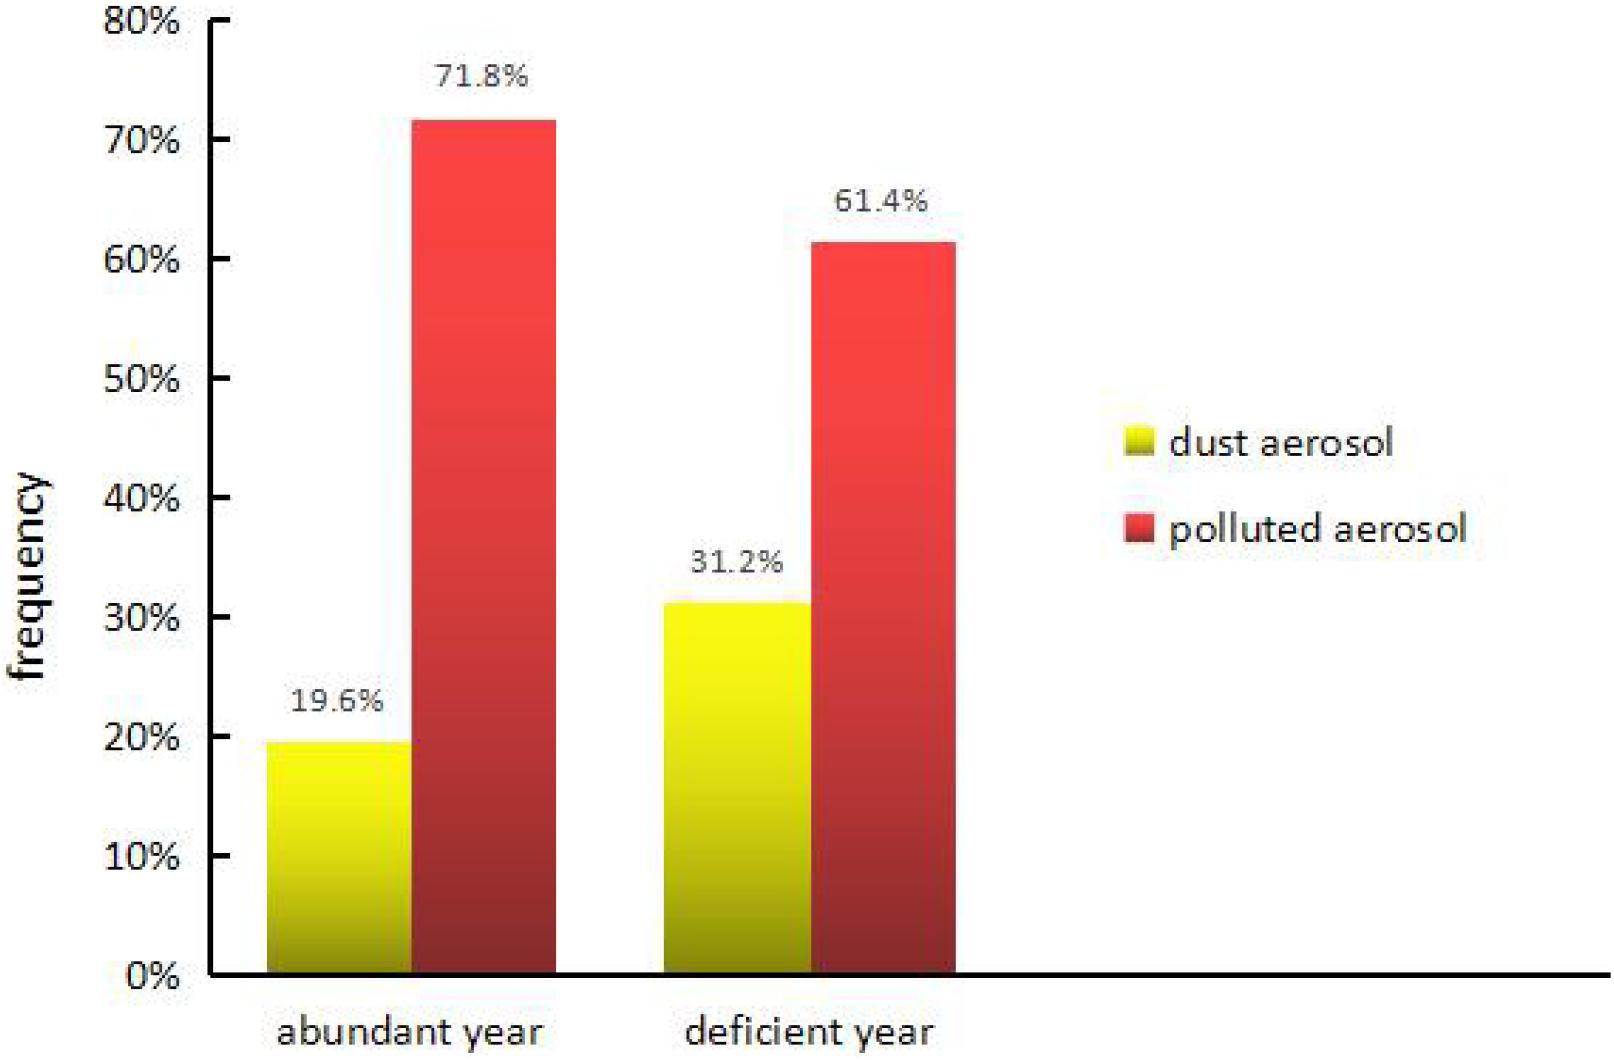
Figure 6. The proportion of dust and polluted aerosols over the transition zone in abundant and deficient years.
Conclusion
In this study, we investigated the distribution of AOD and the vertical frequency of two aerosols over the transition zone and analyzed the mechanism controlling this difference. The following conclusions were obtained:
(1) The deficient years’ AOD was lower than abundant years’ about 40% over the transition zone. In deficient years, less precipitation, the impact of precipitation on the AOD is more significant.
(2) It was found that dust was mainly concentrated at 2–6 km and was distributed in the west of the transition zone. Polluted aerosols were concentrated from the ground to 4 km and were primarily distributed in the central and eastern parts of the transitional zone. The frequency of dust is lower in abundant years, while the frequency of polluted aerosols was higher in abundant years. The total amount of aerosol particles over the transition zone was basically the same in different extreme monsoon years. The proportion of large size particles (dust) and small size particles (polluted aerosols) were different. Due to the general circulation, the polluted particles were transmitted from the South of China to the transition zone and gathered in abundant years. So the proportion of polluted particles is increased in abundant years.
In future studies, the numerical model will be used to simulate the transport trajectory of polluted particles. In addition, we will investigate the vertical distribution and composition of aerosols over the transition zone around the monsoon onset.
Data Availability Statement
The datasets generated for this study are available on request to the corresponding authors.
Author Contributions
QZ provided the study concept and interpretation of results. BB and YW carried out the data analysis. All authors reviewed the manuscript.
Funding
This work was jointly supported by the National Natural Science Foundation of China (41630426 and 41807286) and the National Basic Research Program of China (2013CB430200).
Conflict of Interest
The authors declare that the research was conducted in the absence of any commercial or financial relationships that could be construed as a potential conflict of interest.
Acknowledgments
We thank the NASA Langley Research Center for the CALIPSO and MODIS data. We also thank International Science Editing (http://www.internationalscienceediting.com) for editing this manuscript.
References
An, L., Jiang, J., and Zhou, Y. (2015). Impacts of East Asian summer monsoon circulation on aerosol distribution. J. Meteorol. 35, 26–32.
Ao, C. O., Waliser, D. E., Chan, S. K., Li, J. -L., Tian, B., Xie, F., et al. (2012). Planetary boundary layer heights from GPS radio occulation refractivity and humidity profiles. J. Geophs. Res. 117:D16117.
Berjamin, S. G., and Seaman, N. L. (1985). A simple scheme for objective in curved flow. Mon. Wea. Rev. 113, 1184–1198. doi: 10.1175/1520-0493(1985)113<1184:assfoa>2.0.co;2
Bollasina, M. A., Ming, Y., and Ramaswamy, V. (2011). Anthropogenic aerosols and the weakening of the South Asian summer monsoon. Science 334, 502–505. doi: 10.1126/science.1204994
Chu, D. A., Kaufman, Y. J., Ichoku, G., Remer, L. A., Tanré, D., and Holben, B. N. (2002). Validation of MODIS aerosol optical depth retrieval over land. Geophys. Res. Lett. 29, 1617–1621.
Duan, Z., Tuo, Y., Liu, J., Gao, H., Song, X., Zhang, Z., et al. (2019). Hydrological evaluation of open-access precipitation and air temperaturedatasets using SWAT in a poorly gauged basin in Ethiopia. J. Hydrol. 569, 612–626. doi: 10.1016/j.jhydrol.2018.12.026
Gao, H., Sabo, J. L., Chen, X., Liu, Z., Yang, Z., Ren, Z., et al. (2018). Landscape heterogeneity and hydrological processes: a review of landscape-based hydrological models. Landsc. Ecol. 22, 89–101.
Hu, H. R., and Qian, W. (2007). The confirmation of the North East Asian summer monsoon. Prog. Nat. 1, 57–65.
Huang, F., Li, D. L., Tang, X., Wang, S. G., and Wang, H. (2009). Determination on the North Boundary of summer Monsoon in East Asian with Soaking Rainfall. J. Appl. Meteorol. Sci. 20, 530–538.
Iwasaka, Y., Shibata, T., Nagatani, T., Shi, G.-Y., Kim, Y. S., Matsuki, A., et al. (2003). Large depolarization ratio of free tropospheric aerosols over the Taklamakan desert revealed by Lidar measurements: possible diffusion and transport of dust particles. J. Geophys. Res. 108:8652.
Jordan, N. S., Hoff, R. M., and Bacmeister, J. T. (2010). Validation of goddard earth observing system version 5 MERRA planetary boundary layer heights using CALIPSO. J. Geophs. Res. 115:D24218.
Li, J. D., Sun, Z. A., Liu, Y. M., Li, J. N., Wang, W. C., and Wu, G. X. (2012). A study on sulfate optical properties and direct radiative forcing using the LASG-IAP general circulation model. Adv. Atmos. Sci. 29, 1185–1199. doi: 10.1007/s00376-012-1257-y
Li, Z. Q., Niu, F., Fan, J. W., Liu, Y. G., Rosenfeld, D., and Ding, Y. N. (2011). The long-term impacts of aerosols on the vertical development of clouds and precipitation. Nat. Geosci. 4, 888–894. doi: 10.1038/ngeo1313
Liu, Z. Y., Sugimoto, N., and Murayama, T. (2002). Extinction-to-backscatter ratio of asian dust observed with high-spectral-resolution lidar and raman lidar. Appl. Opt. 41, 2760–2767.
Marsham, J. H., Parker, D. J., Crams, C. M., Johnson, B. T., Grey, W. M. F., and Ross, A. N. (2008). Obsevations of mseoscale and boundary-layer circulation affecting dust uplift and transport in the Saharan boundary-layer. Atmo. Chem. Phys. Discuss. 8, 8817–8845.
Omar, Ali, Won, J. G., Winker, D., Yoon, S., Dubovik, O., and Mccormick, M. (2005). Development of global aerosol models using cluster analysis of Aerosol Robotic Network (AERONET) measurements. J. Geophys. Res. 110, 10–14.
Patil, N., Dave, P., and Venkataraman, C. (2017). Contrasting influences of aerosols on cloud properties during deficient and abundant monsoon years. Sci. Rep. 7, 44996–45005. doi: 10.1038/srep44996
Su, X., Li, K., and Wei, Q. (2016). The optical properties of East Asian dust aerosol and its impact on radiative forcing and temperature. J. Desert Res. 36, 1381–1390.
Takemi, T. (1999). Structure and evolution of a severe squall line over the arid region in Northwest China. Mon. Wea. Rev. 127, 1301–1309. doi: 10.1175/1520-0493(1999)127<1301:saeoas>2.0.co;2
Tang, X., Qian, W. H., and Liang, P. (2006). Climatic features of boundary belt for East Asian Summer Monsoon. Plateau Meteorol. 25, 375–381.
Voss, K., Welton, E., Quinn, P., Johnson, J., Thompson, A., and Gordon, H. (2001). Lidar measurements during Aerosols99. J. Geophys. Res. 106, 821–831.
Wang, S., Zuo, H., Yin, Y., Hu, C., Yin, J., Ma, X., et al. (2018). Interpreting rainfall anomalies using rainfall’s non-negative nature. Geophys. Res. Lett. 46, 426–436.
Wu, G. X., Li, Z. Q., Fu, C. B., Zhang, X. Y., Zhang, R. Y., Zhang, R. H., et al. (2016). Advances in studying interactions between aerosols and monsoon in China. Sci. China Earth Sci. 59, 1–16. doi: 10.1007/s11430-015-5198-z
Wu, Y. R., Martin, G., and Massimo, M. (2016). Improved MODIS Dark Target aerosol optical depth algorithm over land: angular effect correction. Atmos. Meas. Tech. 9, 5575–5589. doi: 10.5194/amt-9-5575-2016
Wu, Y. R., Martin, G., and Massimo, M. (2017). The impact of aerosol vertical distribution on aerosol optical depth retrieval using CALIPSO and MODIS data: case study over dust and smoke regions. J. Geophys. Res. 122, 8801–8815. doi: 10.1002/2016jd026355
Xia, X., Li, Z., Holben, B., Wang, P., Eck, T., Chen, H., et al. (2007). Aerosol optical properties and radiative effects in the yangtze delta region of china. J. Geophs. Res. 112:D22S12. doi: 10.1016/j.scitotenv.2018.09.262
Yan, L., Liu, X., Yang, P., Yin, J., and North, G. R. (2011). Study of the impact of summer monsoon circulation on spatial distribution of aerosols in East Asia based on numerical simulations. J. Appl. Meteor. Climat. 50, 2270–2282. doi: 10.1175/2011jamc-d-11-06.1
Yu, W., Li, Y., Cao, Y., and Schillerberg, T. (2019). Drought assessment using GRACE terrestrial water storage deficit in Mongolia from 2002 to 2017. Water 11, 1301–1315.
Zhang, Q., Huang, R. H., and Wang, S. (2005). NWC-ALIEX and its research advances. Adv. Earth Sci. 20, 427–441.
Zhang, X., Sun, J., Wang, Y., and Li, W. (2013). Factors contributing to haze and fog in China. Chin. Sci. Bull. 58, 1178–1187.
Zhao, G., Huang, G., Wu, R., Tao, W., Gong, H., Qu, X., et al. (2015). A new upper-level circulation index for the East Asian summer monsoon variability. J. Clim. 28, 9977–9996. doi: 10.1175/jcli-d-15-0272.1
Zhou, X., Zhao, P., and Liu, G. (2009). Asian-Pacific oscillation index an variation of East Asian summer monsoon over the past millennium. Chin. Sci. Bull. 54, 3768–3771. doi: 10.1007/s11434-009-0619-z
Keywords: summer monsoon, dust aerosols, optical depth, frequency, polluted aerosol
Citation: Bai B, Zhang Q, Shao W, Wang Y and Tan D (2020) The Response of the Aerosol Distribution to Monsoon Intensity Over the Summer Monsoon Transition Zone. Front. Earth Sci. 7:356. doi: 10.3389/feart.2019.00356
Received: 05 August 2019; Accepted: 24 December 2019;
Published: 21 January 2020.
Edited by:
Wen Chen, Institute of Atmospheric Physics (CAS), ChinaReviewed by:
Bijoy Vengasseril Thampi, Science Systems and Applications, Inc., United StatesHuizheng Che, Chinese Academy of Meteorological Sciences, China
Copyright © 2020 Bai, Zhang, Shao, Wang and Tan. This is an open-access article distributed under the terms of the Creative Commons Attribution License (CC BY). The use, distribution or reproduction in other forums is permitted, provided the original author(s) and the copyright owner(s) are credited and that the original publication in this journal is cited, in accordance with accepted academic practice. No use, distribution or reproduction is permitted which does not comply with these terms.
*Correspondence: Bing Bai, baibing_119@163.com; Qiang Zhang, zhangqiang@cma.gov.cn