 Hao Wei1,2
 Liangwei Xu3*
 Dong Li1
 Yunlei Feng1*Xiaogui Wu4Honglun Chang1Duixing Wang1Zhuo Liu1Wenbiao Du1
- 1Hebei Key Laboratory of Strategic Critical Mineral Resources, Hebei GEO University, Shijiazhuang, China
- 2Eco-Environmental Geology Applied Technology R&D Center, Hebei GEO University, Shijiazhuang, Hebei, China
- 3School of Earth and Space Sciences, Peking University, Beijing, China
- 4Mineral Exploration Department of Xinjiang Baodi Mining Co., Ltd., Xinjiang Geology and Mineral Investment (Group) Co., Ltd., Urumqi, China
In this study, petrographic, microthermometric, and synchrotron radiation X-ray fluorescence (SRXRF) analyses of fluid inclusions were conducted to shed light on the mineralization mechanism of the Dongtongyu deposit and provide some evidence of the relationship among CO2, Au, and other ore elements (e.g., Cu, Fe, Zn, and Pb) in ore-forming fluids. The ore-forming fluid is characterized as the H2O–CO2–NaCl system with medium–high temperatures and low salinities. Four structural mineralization stages are distinguished: Pyrite-quartz (Stage 1), gold-quartz-pyrite (Stage 2), gold-quartz-polymetallic sulfide (Stage 3), and quartz-calcite (Stage 4). Fluid inclusions in Stages 1–3 are dominated by the H2O–CO2 type, and most of them contain liquid H2O and liquid CO2 at room temperature. The melting temperatures (Tm-CO2 = −82.1°C to −57.5°C) of solid CO2 in Stage 1 are relatively low. The values of Tm-CO2 in Stages 2–3 are quite close, with ranges of −60.5°C to −56.5°C and −59.2°C to −58.6°C, respectively. The melting temperatures of clathrate in Stages 1–3 are −2.7°C to +7.8°C, −5.5°C to +7.8°C, and +3.7°C to +7.2°C. The homogenization temperatures of the CO2 phase in the H2O–CO2 inclusions of the three stages are measured as −7.5°C to +31.7°C, −7.5°C to +29.3°C, and 7.1°C to +24.1°C. The total homogenization temperatures in Stages 1–3 are 180°C–394°C, 202°C–305°C, and 224°C–271°C, with salinities of 4.3 wt.%–18.2 wt% NaCl, 4.3 wt.%–20.0 wt% NaCl, and 5.3 wt.%–11.0 wt% NaCl, respectively. The laser Raman spectroscopy results show that the CO2–H2O inclusions in the quartz veins contain abundant CO2 and CH4. The SRXFR results show that most of the elements, especially As, Te, and Cu, are more enriched in liquid CO2 than in liquid H2O. The elements of Au, Fe, Ni, Cu, and Pb have higher concentrations in H2O–CO2-type fluid inclusions in Stage 2 than other fluid inclusions in Stages 1–2, suggesting that gold mineralization is closely related to CO2-rich fluids. During the fluid evolution process, fluid immiscibility is an important mineralization mechanism of gold. The increase in CO2 and CH4 and the decrease in the fluid temperature might promote fluid immiscibility.
Introduction
The Xiaoqinling district in Central China is the second largest gold-producing district next to the Jiaodong Peninsula in China, with 380 t Au (Li et al., 1996; Jiang et al., 1999). The Xiaoqinling district consists of several orogenic gold deposits, including Wenyu, Dongchuang, and Dongtongyu (Figure 1). The studies on mineralization and fluid inclusions in the Xiaoqinling gold ore field have accumulated a lot of literature (Chen et al., 1992; Xu et al., 1998; Jiang et al., 1999; Fan et al., 2000). These literature works recorded the types of fluid inclusions, homogenization temperature, salinity, density, metallogenic pressure, and other physical and chemical parameters, mainly for Wenyu, Dongchuang, Yangzhaiyu, and other large gold deposits in Henan Province. For the Dongtongyu gold deposit, fluid research data are relatively scarce; research on the single fluid inclusion composition has not been reported. The Dongtongyu gold deposit is located in Tongguan County, Shanxi Province, west of the Xiaoqinling gold field. It is one of the main large gold deposits in the ore field. The Dongtongyu deposit developed abundant CO2-rich fluid inclusions with big sizes. However, the metallogenic mechanism of ore-forming fluids and the relationship among CO2, gold, and other ore-forming elements is still unclear. Therefore, it is necessary to study the quartz vein generation and fluid inclusions of the Dongtongyu gold deposit, especially the composition analysis of single inclusions.
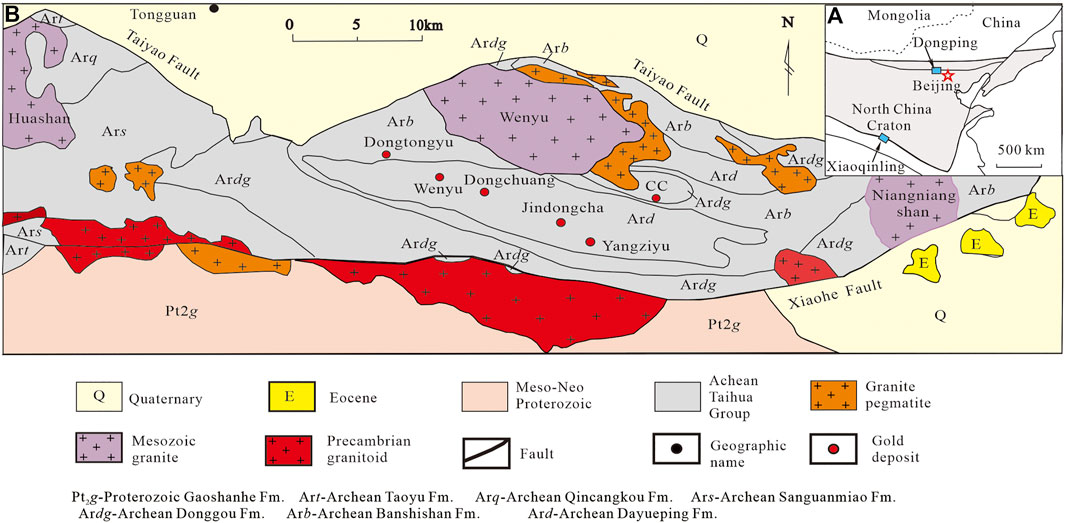
FIGURE 1. Geological sketch map of the research area; (A)-Tectonic subdivisions of North China Craton, showing the location of Xiaoqinling gold districts (modified after Hart et al., 2002; Zhou and Wang, 2012); (B)-Geological sketch map of the area around the Xiaoqinling gold district (modified after Xu et al., 1998; Jiang et al., 1999).
The non-destructive microbeam analysis of single inclusions is a major frontier topic in the field of international geology. At present, the research on single fluid inclusions mainly adopts the laser ablation-inductively coupled plasma-mass spectrometry (LA-ICP-MS) destructive component analysis technology. Although the LA-ICP-MS method can well obtain the element content in a single fluid inclusion, it cannot intuitively observe the distribution characteristics of the relative content of ore-forming elements in the whole fluid inclusion. The light source of synchrotron radiation X-ray fluorescence (SRXRF) microbeam analysis has the advantages of high intensity, continuous energy spectrum, adjustable monochromaticity, good accuracy, and strong polarization. The detection limit can reach 10−6. It is a non-destructive and low-detection-limit technology. It is also an ideal means for non-destructive in-situ quantitative analysis of single fluid inclusions.
The Dongtongyu deposit developed abundant CO2-rich fluid inclusions with big sizes, which are good candidates for the SRXRF analysis of a single inclusion. The SRXRF analysis can help analyze the migration and metallogenic mechanism of gold and the distribution behavior of trace elements in fluid inclusions.
In this paper, we review the geological settings and deposit geology of the Dongtongyu gold deposit and analyze the petrographic characteristics and microthermometry of fluid inclusions. Moreover, we analyze the in-situ composition of single inclusions through SRXRF. This study aims to shed light on the mineralization of the Dongtongyu gold deposit and quantify the behaviors of Au and other elements involved in H2O–CO2 fluids.
Geological settings
The Xiaoqinling district is located in the northern Qinling-Dabie Orogen, bounded by two regional scale faults—the Taiyao fault on the north side and the Xiaohe fault on the south side (Figure 1; Zhou et al., 2014). The major structures in the Xiaoqinling area are east-west-trending folds formed in the Precambrian Era and faults evolved during ages from the Triassic to the Cretaceous period (Mao et al., 2002; Zhao et al., 2011, 2012).
The Archean Taihua Group underlying much of the area is composed of amphibolites, plagioclase gneisses, and migmatites with estimated metamorphic ages of 1.82 to 1.95 Ga (Li et al., 1996; Santosh et al., 2010; Deng et al., 2013). The Taihua Group includes the biotite plagio-gneiss of the Sanguanmiao Formation, biotite hornblende granulite of the Donggou Formation, biotite granulite of the Banshishan Formation, and plagioclase amphibolite of the Dayueping Formation (Figure 1). Several magmatism events affected this area. They are represented by the Early Proterozoic Guijiayu biotite hornblende granite (−1.8 Ga; Li et al., 1996; Deng et al., 2016), Middle Proterozoic Xiaohe biotite granite (1463 Ma; Li et al., 1996), and Yanshanian granite, including Huashan, Wenyu, and Niangniangshan biotite granites (138–146 Ma; Mao et al., 2010).
More than 200 gold-bearing veins concentrated in a dozen large-scale gold deposits (e.g., Wenyu, Dongchuang, Yangzhaiyu, and Dongtongyu) have been found in the Xiaoqinling district. Most gold deposits were hosted in a series of east-west shear zones within the Archean Taihua Group. The Dongtongyu gold deposit represents typical vein-type gold deposits in the Xiaoqinling district, with gold reserves of approximately 50 t at an average grade of 6 g/t (Li et al., 1996). It consists of approximately 40 ore veins with Au > 1 ppm. The deposits were mostly hosted in the Dayueping Formation (Figure 2). Many fault structures, mainly east-west brittle-ductile shear zones and north-northeast extensional fractures, are commonly developed in the deposit area. Gold-bearing quartz veins were formed by the filling and replacement of the late hydrothermal fluids. The ore bodies are strictly controlled by fractures and distributed in parallel (Figure 2). Although there have been no chronological data reported for the mineralization of the Dongtongyu so far, the gold mineralization age in the Xiaoqinling district is generally believed to be in the Early Cretaceous (128–143 Ma; Jiang et al., 1999; Li et al., 2002; Mao et al., 2002).
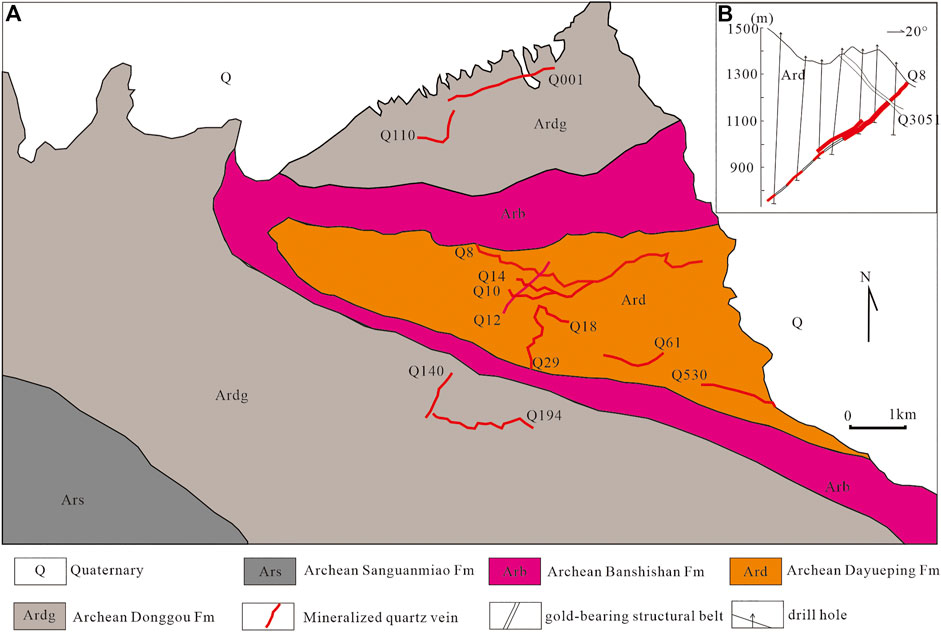
FIGURE 2. Geological sketch map and cross section for the Au-bearing quartz vein; (A)-Geological sketch map of the Dongtongyu gold deposit (modified after 1: 10000 geological map by the Dongtongyu Gold Orefield, Tongguan China Gold Mining Co., Ltd.); (B)-cross section (line XVII) for the Au-bearing quartz vein (modified after Bai, 2003)
Materials and methods
Petrographic studies were carried out on 50 polished thin sections with conventional transmitted light and reflected light microscopes. A fluid inclusion study was conducted on samples collected from mineralized quartz veins of different stages in the Dongtongyu deposits.
Petrographic observation and microthermometry of fluid inclusions were completed in the laboratory of the Department of Resources, University of Science and Technology Beijing. The test instrument was a Linkam THMS600 heating and freezing station with a Leica microscope. The measurements consist of an ice melting temperature (Tm-ice), halite dissolution temperature (Tm-halite), clathrate melting temperatures (Tm-clath), and homogenization temperature (Th-total). The precision of the temperature measurements is ±0.1°C for <30°C, ±1°C for the interval of 30°C–300°C, and ±2°C for temperatures >300°C, respectively. Fluid salinities and densities were calculated using the Clathrates and Fluids software packages of Bakker (1997; 2003).
The SRXFR mapping results of the fluid inclusions were conducted using the hard X-ray microfocusing beamline (BL15U1) in the Shanghai Synchrotron Radiation Facility, Shanghai Institute of Applied Physics, Chinese Academy of Sciences. The samples were excited by a white spectrum with an energy of 14 keV and a flux current of 260 mA. The beam diameter was 2 μm, and mapping was used for single fluid inclusions. The 2D mapping (50 μm × 50 μm) of 676 points (26 × 26) was conducted for each inclusion, and each point was analyzed for 2 s.
The SRXRF quantitative determination of metal elements in fluid inclusions was conducted at the Beijing Synchrotron Radiation Facility. As shown in Figure 3, the X-ray source used in the experiment comes from the 4W1B beamline with a range between 8 and 15 keV in the quasi-monochromatic light focusing mode. The electron energy of the collider storage ring is 2.2 GeV with a beam intensity of 60–120 mA. The beam diameter can reach 10–15 μm. The microscope in the microscopic observation system is a product of Digital Instruments, United States, with a magnification of 450×. The Si (Li) detector has a beryllium window thickness of 7.5 μm and an energy resolution of 133 eV (at 5.9 keV).
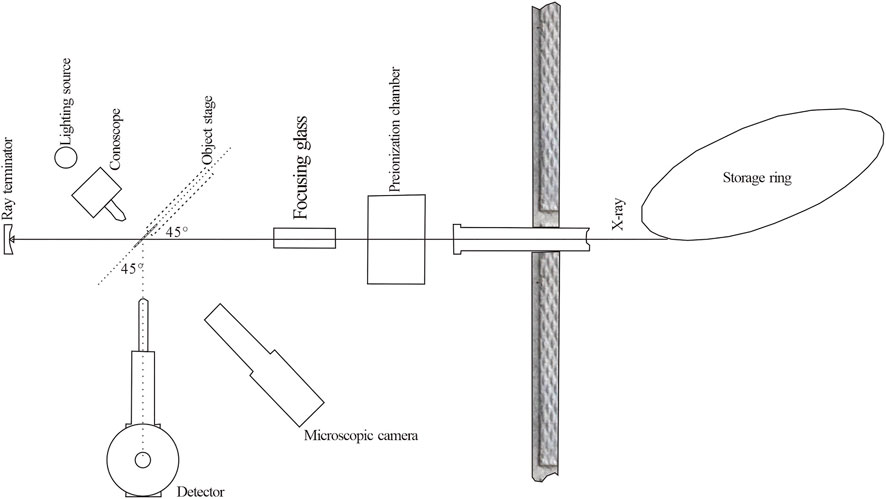
FIGURE 3. Schematic diagram of SRXRF.
The software PyMca was used for picking assignments, deconvolution of complex lines, reduction of continuous background, and elemental contents. NISTSRM610 from the National Bureau of Standards was selected for calibration. The standard material is a glass disk with a thickness of approximately 3 mm and a diameter of approximately 10 mm. The nominal value of all elements is −500 ppm. Fluid inclusions (>20 μm in diameter) were located near the sample surface (1–10 μm). The depth and thickness of the inclusions were measured with a Leica microscope (error of ±1 μm in the Z direction). Details on the absorption correction are presented in Philippot et al. (1998). After data processing steps, such as fitting, normalization, background subtraction, and absorption correction, the stimulated fluorescence count of each element and the measured peak area were obtained, and then the content of each trace element was calculated by comparing the standard samples. The content calculation formula is as follows:
where Ci and Cs are the content of elements in the measured sample and standard sample, respectively, and Ni and Ns are the average values of the net peak area counts of the Ka or La lines of the elements in the measured sample and standard sample, respectively.
Net peak area value = Measured peak area value × ionization chamber count (normalization) × Dwell time (normalization).
Ionization chamber count (normalization): Ionization chamber count of the measured sample/Ionization chamber count of the standard sample.
Dwell time (normalized): Dwell time of the measured sample/Dwell time of the standard sample.
Based on the definition given by Currie (1968), the minimum detection limit (MDL) is given by
where Np and Nb are the X-ray fluorescence intensities (counts) at the peak and background, respectively, and Ci is the elemental content.
Laser Raman probe analysis was conducted at the Geological Experiment Center, School of Earth and Space Sciences, Peking University. The instrument is the RM-1000 Raman spectrometer produced by Renishaw, UK, with the conditions of 514 nm Ar + laser counting time of 10 s, resolution of 1–2 cm−1, and laser beam spot of 1–2 μm.
Results
Petrographic studies
The major ore minerals in gold-bearing veins are native gold, electrum, pyrite, chalcopyrite, galena, and sphalerite (Figures 4A–C; Table 1). The gangue minerals are dominated by quartz, chlorite, calcite, and sericite (Table 1). The gold ore is mainly hosted by quartz veins and alteration zones. Wall rock alterations associated with gold mineralization include silicification, potassic alteration, pyritization (Figure 4C), sericitization (Figure 4D), and carbonatization. Most of the gold occurs as native gold and electrum in pyrite, as either inclusion or in fissures. Other host minerals include quartz, galena, and chalcopyrite.
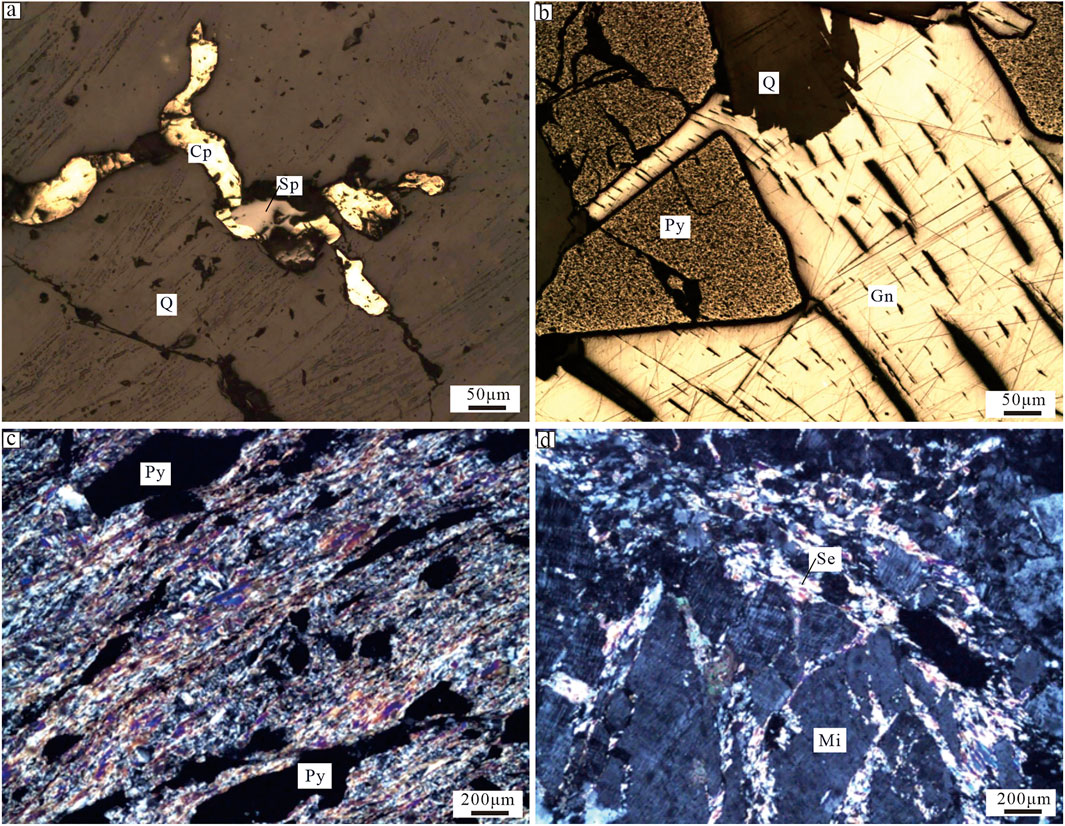
FIGURE 4. Petrographic photos showing ore minerals and alterations in the Dongtongyu (A)- Chalcopyrite and sphalerite veinlets in a quartz vein, Sample TY020b, RL (−); (B)- Pyrite was replaced by galena in a quartz vein, Sample TY052a, RL (−); (C)- Pyrite in mylonite, TL (+); (D)- Cataclastic microcline, and sericite in fractures, TL (+). Cp-chalcopyrite; Sp-sphalerite; Q-quartz; Py-pyrite; Gn-galena; Se-sericite; Mi-microcline.
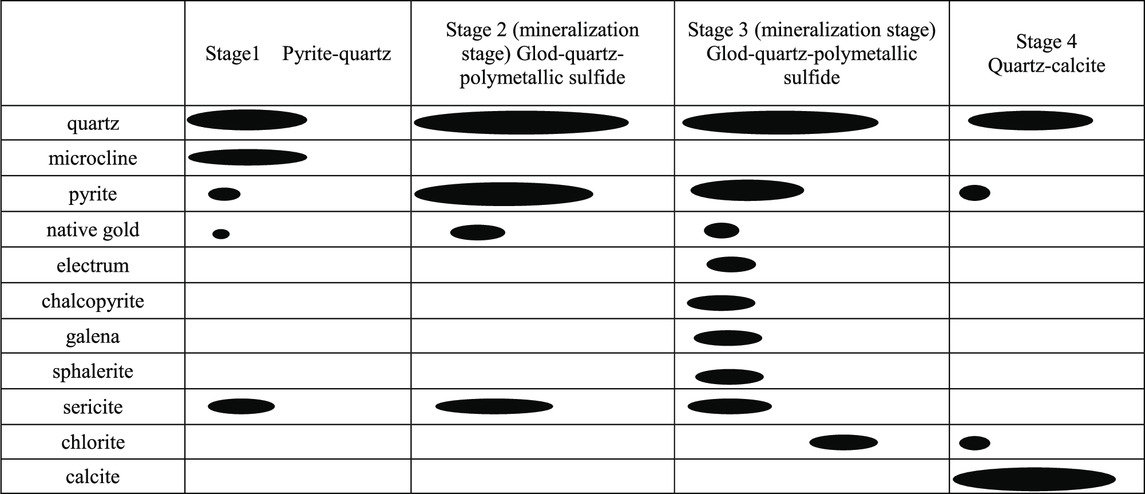
TABLE 1. Paragenetic sequence of minerals for the Dongtongyu gold deposit.
Based on the field geological characteristics and interspersed relationship, four structural mineralization stages can be distinguished.
Stage 1 (pyrite-quartz stage) is characterized by large amounts of white quartz veins and disseminated cubic pyrite (Figures 5A–C). The early ductile shear resulted in a nearly equidistant local extension space, forming a white quartz vein (Q1) that contains a small amount of disseminated pyrite (Figure 5A). This stage produced strong sericitization and weak gold mineralization in the surrounding rock.
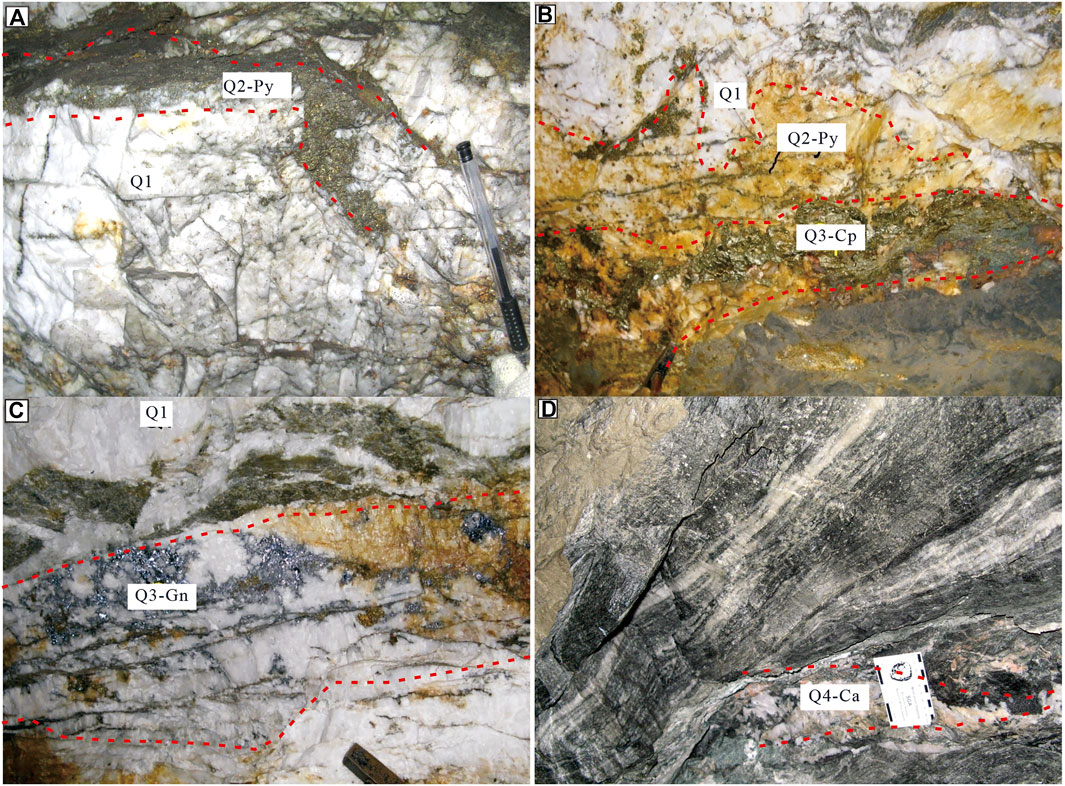
FIGURE 5. Occurrences of quartz veins in the Dongtongyu gold deposit (A)-Quartz-pyrite vein (Py-Q2) crosscut white quartz vein (Q1), at 600 m level; (B)-Quartz-chalcopyrite veinlets (Q3-Cp) and Pyrite-quartz vein (Q2-Py) filled along the bottom of the first stage of quartz vein (Q1), at 600 m level; (C)-Quartz-galena (Q3-Gn) stockworks and veinlets filled along the first stage of quartz vein (Q1), at 600 m level; (D)-Quartz and calcite veins in the mylonitized shear zone (Q4), at 600 m level. Qi- Quartz of stage i; Cp-chalcopyrite; Py-pyrite; Gn-galena; Ca-calcite.
Stage 2 (gold-quartz-pyrite stage) is characterized by abundant pyrite, minor gray quartz, and the highest grade of gold (Figures 5A, B). In this stage, the ductile deformation transforms into brittle deformation. The white quartz veins formed in the early stage produce micro-fractures. The coarse-fine-grained pyrite veins are filled in the fractures of quartz in Stage 1 or directly in the fractures of surrounding rocks.
Stage 3 (gold-quartz-polymetallic sulfide) is characterized by various metallic sulfides (Figures 5B, C) associated with siderite, quartz, and ankerite. This stage is the middle-late stage of the ductile-brittle deformation. The brittle fractures in Q1 are more developed and are filled and cemented by the later-formed minerals (chalcopyrite, sphalerite, pyrrhotite, and galena).
Stage 4 (Quartz-calcite stage) is composed of fine-grained quartz and calcite crystals (Figure 5D) and no economic gold. This is the late stage of shearing and mineralization in this area.
Stages 2 and 3 are the main gold mineralization stages. Most gold grains are located in the fissures of pyrite, but some are found in the fissures of ankerite and quartz or occur as inclusions within pyrite crystals. Native gold and electrum are the main gold minerals. Native gold grains are common in Stage 2 and rare in Stages 1 and 3, whereas electrum is common in Stage 3 and less common in Stage 2.
Fluid inclusion study
1) Petrography
The fluid inclusions of each quartz vein were studied. All stages contain abundant primary and secondary inclusions. Primary fluid inclusions are generally round or sub-round with sizes from 5 to 25 μm and distributed in isolation or clusters, whereas secondary fluid inclusions are in long trails. Primary and undamaged inclusions were selected with fluid inclusion assemblages (FIAs). Isolated or clustered fluid inclusions, or fluid inclusions in short trails, with similar vapor percentages and regular shapes within a microdomain, were regarded as good candidates for further analysis, whereas inclusions with an elongated or necking-down shape and inclusions in long trails cutting across the crystal edges of host minerals were all discarded.
Three types (five subtypes) of primary fluid inclusions can be recognized (Figure 6): CO2-rich fluid inclusions (LCO2 or LCO2–VCO2), H2O–CO2 fluid inclusions (LH2O–LCO2 or LH2O–LCO2–VCO2), and H2O-rich fluid inclusions (L–V). CO2-rich fluid inclusions contain 1–2 phases (liquid CO2 (LCO2); liquid CO2 (LCO2) + vapor CO2 (VCO2)) at room temperature and usually occur as isolated ellipse; H2O–CO2 fluid inclusions contain 2–3 phases (liquid H2O (LH2O) + liquid CO2 (LCO2)); liquid H2O (LH2O) + liquid CO2 (LCO2) + vapor CO2 (VCO2)) at room temperature and usually occur as isolated or clustered ellipse; H2O-rich fluid inclusions show two phases (liquid H2O (LH2O) + vapor H2O (VH2O)) at room temperature and usually occur as an isolated ellipse or irregular shape.
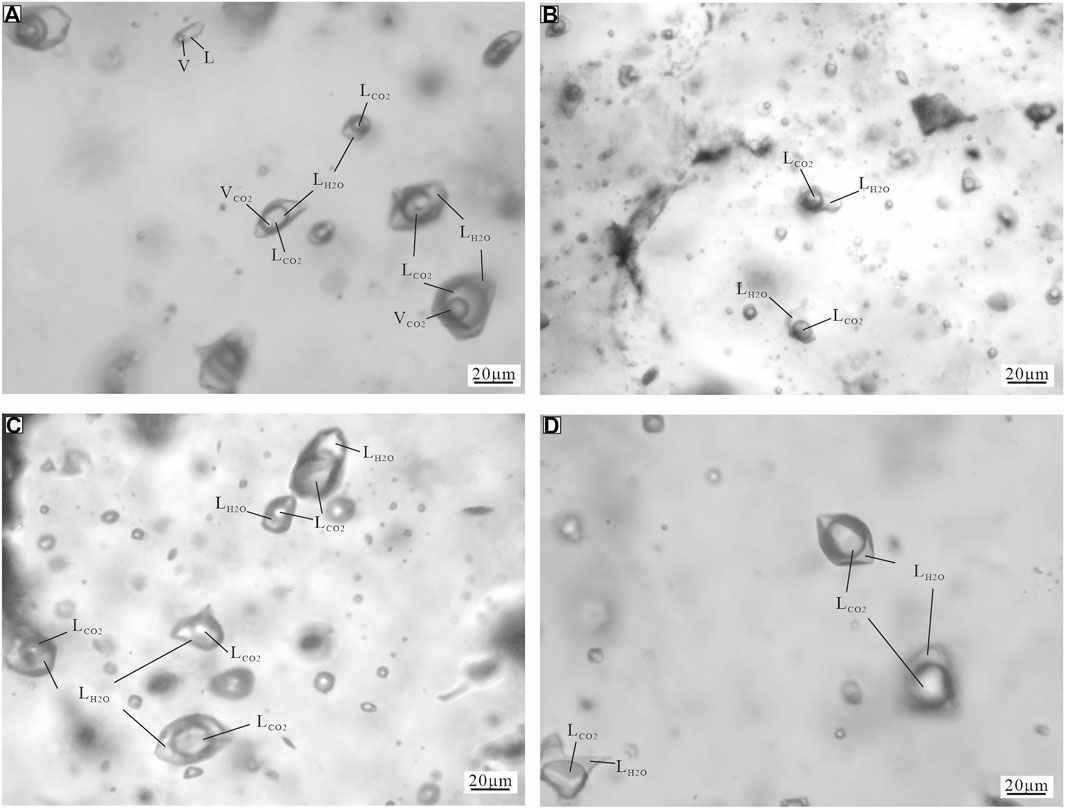
FIGURE 6. Fluid inclusions in the Dongtongyu gold deposit. (A)-Some L-V fluid inclusions coexist with H2O-CO2 inclusions (LH2O-LCO2 and LH2O-LCO2-VCO2) in a quartz vein (Q2); (B)-LH2O-VCO2 and LH2O-LCO2-VCO2 inclusions (some were decrepitated) in a quartz vein (Q2); (C)-LH2O-LCO2 inclusions in a quartz vein (Q2); (D)-LH2O-LCO2 fluid inclusions in a quartz vein (Q3).
Stage 1: Abundant H2O–CO2-type (LH2O–LCO2 and LH2O–LCO2–VCO2) fluid inclusions were trapped in this stage. They are generally large (up to 20 m) that contain randomly distributed or crack-hosted H2O–CO2 type (CO2% = 20%–30%) FIs.
Stage 2: Some L–V fluid inclusions can be found coexisting with these H2O–CO2 inclusions (Figure 6A). Fluid inclusions are mainly H2O–CO2 types and minor H2O-rich types (Figures 6B, C). The inclusions of H2O–CO2 (mainly LH2O–LCO2 type) are composed of 70 to 90 vol% liquid CO2 and 10 to 30 vol% H2O. Water occurs as a film on the inner cavity wall in some CO2-rich inclusions.
Stage 3: Similar to Stage 2, LH2O–LCO2-type fluid inclusions are dominated in this stage (Figure 6D). The proportion of CO2 in LH2O–LCO2 inclusions are also >50% commonly, and minor CO2-rich inclusions (LCO2 type) can be found locally.
Stage 4: H2O-rich fluid inclusions (L–V type) are well-developed in this stage. They are mainly small in size (<5 μm) and randomly distributed. There are almost no CO2 inclusions found in this stage.
2) Microthermometry
Fluid inclusions in Stages 1–3 are dominated by the H2O–CO2 type, and most of them contain liquid H2O and liquid CO2 (some also with vapor CO2) at room temperature. The melting temperatures (Tm-CO2 = −82.1°C to −57.5°C) of solid CO2 in Stage 1 are relatively low. The values of Tm-CO2 in Stages 2–3 are quite close, with ranges of −60.5°C to −56.5°C and −59.2°C to −58.6°C, respectively. The melting temperatures of clathrate in Stages 1–3 are −2.7°C to +7.8°C, −5.5°C to +7.8°C and +3.7°C to +7.2°C, corresponding to salinities of 4.3 wt.%–18.2 wt% NaCl, 4.3 wt.%–20.0 wt% NaCl, and 5.3 wt.%–11.0 wt% NaCl, respectively (Table 2).
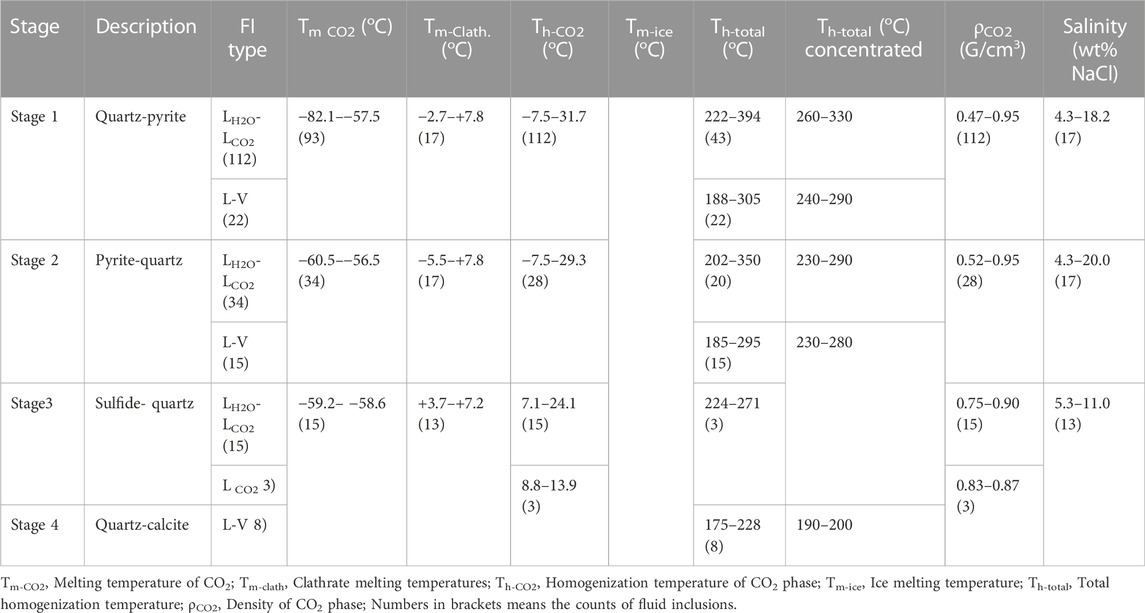
TABLE 2. Microthermometric results of fluid inclusions from the Dongtongyu gold deposits.
The homogenization temperatures of the CO2 phase in the H2O–CO2 inclusions of the three stages were −7.5°C to +31.7°C, −7.5°C to +29.3°C, and 7.1°C to +24.1°C. The densities of CO2 were calculated according to their Th-CO2, and the value ranges were mainly from 0.47 g/cm3 to 0.95 g/cm3, 0.52 g/cm3 to 0.95 g/cm3, and 0.75 g/cm3 to 0.90 g/cm3 for the three stages, respectively. A few LCO2 inclusions in Stage 3 were measured, and their CO2 homogenization temperatures were from +8.8°C to +13.9°C, which are within the value ranges of H2O–CO2 inclusions.
The total homogenization temperatures in Stages 1–2 significantly varied with ranges of 180°C–394°C in Stage 1 and 202°C–305°C in Stage 2, which is mainly concentrated in 260°C–330°C in Stage 1 and 230°C–290°C in Stage 2. However, fluid inclusions with different CO2% in the same sample have quite narrow Th ranges. Most of the inclusions decrepitated before homogenization, and only three values (224°C–271°C) were obtained in Stage 3.
The inclusions of the L–V type in Stage 4 are difficult to measure because of their small size, and only eight homogenization temperatures (175°C–228°C) were obtained.
The fluid inclusions in Stages 1, 3, and 4 were all homogenized to the liquid H2O phase. Meanwhile, some H2O–CO2-type fluid inclusions with a large proportion of CO2 were homogenized to the CO2 phase in Stage 2, and the others in Stage 2 were homogenized to the liquid H2O phase. Moreover, some L–V and H2O–CO2 inclusions with different CO2 ratios coexisted in the same field of view (Figure 6A), and the homogenization temperatures were similar, which were homogeneous to the aqueous and CO2 phases, respectively.
3) SRXRF results of fluid inclusions
Five fluid inclusions (one H2O–CO2-type fluid inclusion in Stage 1 for mapping; one H2O–CO2-type fluid inclusion and one L–V-type fluid inclusion in Stage 1; and one H2O–CO2-type fluid inclusion and L–V-type fluid inclusion in Stage 2 for quantitative determination) with sizes larger than 20 μm were selected for the SRXRF analysis. Based on the mapping results (Figure 7), As, Te, Cu, Fe, Zn, Mn, Sb, Sn, W, and Co were slightly concentrated in the H2O–CO2-type fluid inclusion in Stage 1. However, most of the elements, especially As, Te, and Cu, were more enriched in liquid CO2 than in liquid H2O. Au was almost not detected, as shown in the SRXRF mapping (Figure 7). According to the quantitative results (Table 3), Au, Fe, Ni, Cu, and Pb have higher concentrations in the H2O–CO2-type fluid inclusions in Stage 2 than other fluid inclusions in Stages 1 and 2. The enriched Cu, Fe, and Pb correspond to the ore minerals of chalcopyrite, pyrite, and galena.
4) Laser Raman results of fluid inclusions
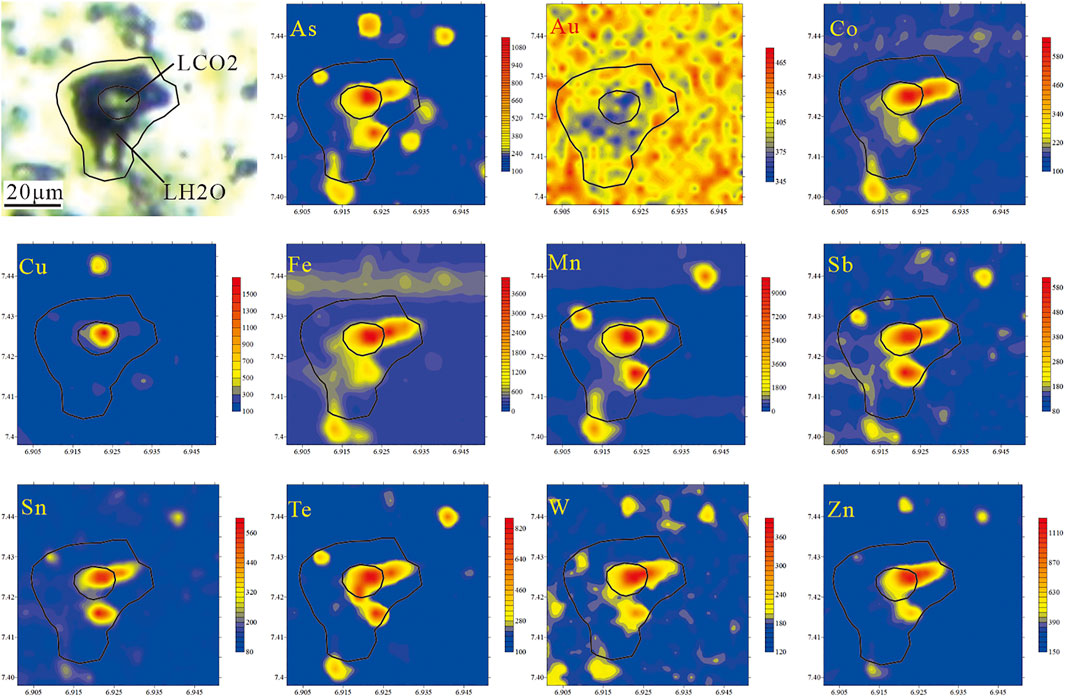
FIGURE 7. SRXRF mapping results of fluid inclusions in gold-bearing quartz veins from the Dongtongyu gold deposit. Elements of As, Cu, Zn, Fe, Co, Mn, Te, Sb, Sn, and W are slightly concentrated, while Au is almost not enriched in the fluid inclusion of the Dongtongyu gold deposit.
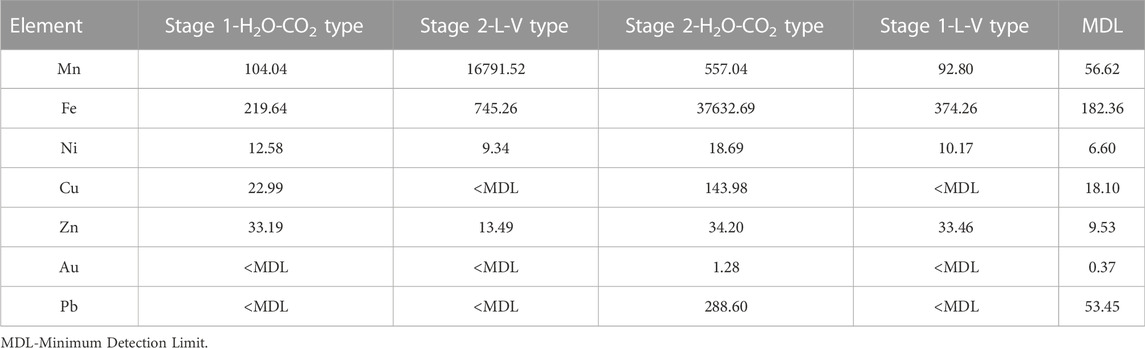
TABLE 3. SRXRF quantitative results of fluid inclusions in quartz veins from the Dongtongyu gold deposit (ppm).
The laser Raman results show that the CO2–H2O inclusions in the quartz veins of the Dongtongyu gold deposit contain abundant CO2 and CH4 (Figure 8), which is consistent with the measured initial melting temperature (Tm-CO2) of the CO2 phase (Van den Kerkhof et al., 2001).
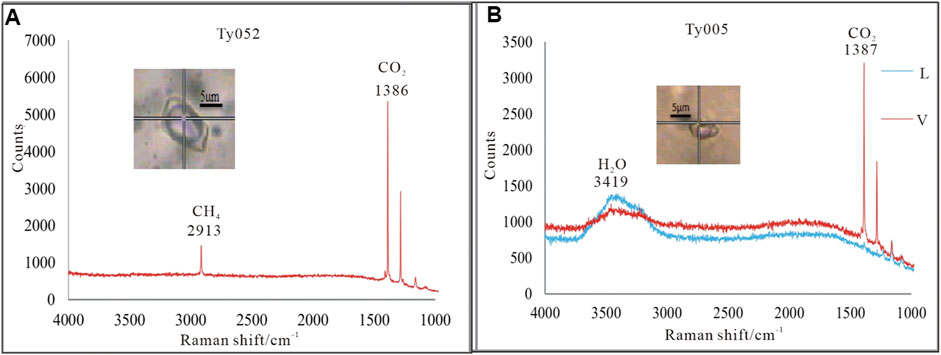
FIGURE 8. Laser Raman spectra of inclusions in the Dongtongyu gold deposit. (A)- H2O-CO2 type inclusion in Stage 3, TY052; (B)- H2O-CO2 type inclusion in Stage 2, TY005.
Discussion
Implications for the mineralization mechanism of gold in the H2O–NaCl–CO2 fluid system
H2O–CO2 fluid inclusions with CO2-rich and low-salinity characteristics are common in orogenic gold deposits, and CO2–CH4 fluid inclusions are also widely developed in some gold deposits. According to the mapping and quantitative results of SRXRF, gold is not enriched in Stage 1, but with the increase in CO2 in Stage 2, gold and some elements, such as Pb, Cu, and Fe, are enriched, suggesting that gold mineralization is closely related to CO2-rich fluids. Previous studies confirmed that fluid inclusions in gold-bearing quartz veins tend to be CO2-rich (Xu et al., 2007, 2015). He et al. (2001) investigated the gold content in volcanic rocks from CO2 and non-CO2 gas reservoirs in the Shengli Oil Field and concluded that CO2 degassing from the mantle made an important contribution to the formation of gold-rich fluids. Phillips and Evans (2004) proposed that CO2 played a crucial role in gold mineralization by comparing the gold-bearing properties of CO2-rich and CO2-poor fluids. The main role of CO2 is to buffer the pH range of the fluid, increase the gold content in the fluid and maintain its complexation migration with the reduced sulfur, and then precipitate gold in ore-bearing rocks with favorable chemical conditions (Phillips and Evans, 2004).
Aside from gold, CO2 also has a certain effect on the enrichment of other metal elements. In a study on polymetallic sulfide deposits in a basin in the Western Pacific, Yang and Scott (1996) found that the contents of Cu, Zn, Pb, Ag, and Au in CO2-rich vapor of melt inclusions in submarine massive sulfide deposits were very high. In addition, noble metals and copper-philic elements are also highly enriched in CO2 vapor during the volcanic eruption (Olmez et al., 1986). The mapping results of SRXRF in the Dongtongyu gold deposit show that most of the elements, especially As, Te, and Cu, are more enriched in liquid CO2 than in liquid H2O, which provides direct evidence that these metals tend to be enriched in CO2-rich fluid. Moreover, CO2 plays a crucial role in the enrichment of gold and some metal elements.
However, because the chemical bond between gold ions and CO2 is not strong, CO2 cannot play a direct role in the migration and precipitation of gold. Xu et al. (2007) pointed out that CO2 could enlarge the temperature ranges of critical fluids and increase the immiscible range of fluids. Fluid immiscibility can lead to the change in physicochemical properties (e.g., temperature, pressure, oxygen fugacity, and pH value) of ore-forming fluids and decrease the solubility of gold in high-temperature sulfide solutions (Seward, 1991; Phillips and Evans, 2004). Therefore, fluid immiscibility is one of the important factors leading to gold precipitation. The coexistence of L–V-type and H2O-CO2-type inclusions in Stage 2 and their similar homogenization temperatures with different homogeneous phases indicate that the ore fluids once experienced an immiscibility process, which is also suggested by other researchers (Fan et al., 2001; Mao et al., 2003; Zhou et al., 2014). H2O-CO2-type and L–V-type inclusions in Stage 2 can represent two types of immiscible fluids. The quantitative results of the SRXFR show that the enrichment degrees of Au, Pb, Cu, Zn, and Fe elements in H2O–CO2-type and L–V-type inclusions in Stage 2 have obvious differentiation, and these elements are more enriched in H2O–CO2-type fluid inclusions, which further indicates that CO2 plays a crucial role in the enrichment of these elements. The immiscibility of ore-forming fluid is mainly caused by the phase separation of H2O–CO2 fluid at low temperatures. The decrease in temperature will greatly increase the immiscibility range (Lu, 2004). The homogenization temperature of Stage 2 of the Dongtongyu gold deposit is concentrated at 230°C–290°C, which is significantly lower than that of Stage 1 (260°C–330°C). Therefore, the decrease in temperature might be an important factor for the immiscibility in Stage 2.
Furthermore, CH4 has a greater effect on immiscibility than CO2. At 300°C, the immiscibility of the fluid can only occur when the CO2 content is greater than 15 mol% (Nadon, 1989), whereas the immiscibility can occur when the CH4 content is greater than 5 mol%. Raman spectroscopy shows that the fluid inclusions in the quartz veins of the Dongtongyu gold deposit contain abundant CH4. Therefore, CH4 further expands the immiscible range of ore-forming fluids.
Evolution of ore-forming fluids
The structure of the Xiaoqinling gold field has experienced the process of ductile shear deformation-ductile brittleness-brittle deformation. The gold-bearing quartz veins in the Dongtongyu gold deposit recorded the mineralization of multi-stage fluids.
The early hydrothermal activity was characterized by the formation of white quartz veins. The initial ore-forming fluid belongs to the H2O–NaCl–CO2 system with the minimum capture temperature of the fluid of 180°C–394°C and salinity of 4.3 wt.%–18.2 wt% (concentrated in 5–8 wt%). This fluid was captured by white quartz in the early ductile shear-silicification stage (Stage 1). Then, the early white quartz vein was subjected to shear deformation, and the CO2-rich fluid migrated and metasomatized along the weak structural zone.
In Stage 2, the fluid temperature decreased (concentrated in 230°C–290°C), and the temperature entered the immiscible range of the H2O–NaCl–CO2–CH4 system, resulting in the phase separation of CO2 and H2O. They are separated into low-density CO2-rich fluid and high-density H2O-rich fluid, which is captured in different proportions to form mixed FIAs. During the phase separation of CO2 and H2O, gold and some metal elements are more easily enriched in CO2-rich fluids. Because Au migrates in the form of sulfur-hydrogen complexes in hydrothermal fluids (Hayashi and Ohmoto, 1991; Phillips and Evans, 2004), immiscibility can decrease the solubility of gold and other elements in high-temperature sulfide solutions and lead to the precipitation of siliceous and pyrite in hydrothermal fluids, forming banded and massive quartz-pyrite veins.
Subsequently, the temperature of the ore-forming fluid in Stage 3 decreased again, and more metal sulfides, such as galena and chalcopyrite, precipitated on the white quartz veins, forming net veins and veinlet quartz-polymetallic sulfides.
In Stage 4, which is the end of collision, quartz mainly showed brittle deformation. Due to the uplift of the shear tectonic belt, the minimum trapping temperature of fluid was reduced to 175°C–228°C, a large amount of carbonate precipitated, and the CO2 content decreased. Aqueous fluids dominated at this stage.
Conclusion
1) The structure of the Xiaoqinling gold ore field has experienced the process of ductile shear deformation-ductile brittleness-brittle deformation. According to the field geological characteristics and interspersed relationship, four structural mineralization stages are distinguished: pyrite-quartz stage, gold-quartz-pyrite stage, gold-quartz-polymetallic sulfide stage, and quartz-calcite stage. Fluid inclusions in Stages 1–3 are dominated by the H2O–CO2 type. The homogenization temperatures in Stages 1–3 are 180°C–394°C, 202°C–305°C, and 224°C–271°C, with salinities of 4.3 wt.%–18.2 wt% NaCl, 4.3 wt.%–20.0 wt% NaCl, and 5.3 wt.%–11.0 wt% NaCl, respectively.
2) The SRXFR results show that most of the elements, especially As, Te, and Cu, are more enriched in liquid CO2 than in liquid H2O; Au, Fe, Ni, Cu, and Pb have higher concentrations in H2O–CO2-type fluid inclusions in Stage 2, suggesting that gold and some other metals are closely related to CO2-rich fluids. CO2 tends to promote the enrichment of these elements.
3) During the fluid evolution process, fluid immiscibility is an important mineralization mechanism of gold. The increase in CO2 and CH4 and the decrease in the fluid temperature promote the phase separation of CO2 and H2O in the NaCl–H2O–CO2 system.
Data availability statement
The original contributions presented in the study are included in the article/supplementary material, further inquiries can be directed to the corresponding author.
Author contributions
Wrote the paper, performed data treatment HW; formulated the scientific problem, participated in writing the manuscript and revised paper, LX; provided natural samples and edited paper format, DL; organized the research team, guided the study, YF; conduct the experiment, HC, XW, DW, ZL, and WD. All authors have read and agreed to the published version of the manuscript.
Funding
This work is granted by the Natural Science Foundation of Hebei Province (Grant No. D2020403019), Science and Technology Project of Hebei Education Department (Grant No. ZD2020134) and Natural Science Foundation of Hebei Province Grant No. D2020403101, Grant No. D2177399).
Acknowledgments
We are grateful to reviewers for their helpful comments and suggestions.
Conflict of interest
The author XW was employed by Mineral Exploration Department of Xinjiang Baodi Mining Co., Ltd. of Xinjiang Geology and Mineral Investment (Group) Co., Ltd.
The remaining authors declare that the research was conducted in the absence of any commercial or financial relationships that could be construed as a potential conflict of interest.
Publisher’s note
All claims expressed in this article are solely those of the authors and do not necessarily represent those of their affiliated organizations, or those of the publisher, the editors and the reviewers. Any product that may be evaluated in this article, or claim that may be made by its manufacturer, is not guaranteed or endorsed by the publisher.
References
Bai, H. (2003). Geology of gold deposit Q8 and the deep-seated potential mineral resources in Xiaoqinling. Shaanxi Geol. 21 (1), 19–27. (in Chinese with English abstract).
Bakker, R. J. (2003). Package FLUIDS 1. Computer programs for analysis of fluid inclusion data and for modeling bulk fluid properties. Chem. Geol. 194, 3–23.
Bakker, R. J. (1997). Clathrates: Computer programs to calculate fluid inclusion V–X properties using clathrate melting temperatures. Comput. Geosci. 23, 1–18.
Chen, Y., and Fu, S. (1992). Metallogenic regularity of gold deposits in western Henan. Beijing, China: Earthquake Press, 234.
Currie, L. A. (1968). Limits for quantitative detection and quantitative determination. Anal. Chem. 40, 586–593.
Deng, X., Chen, Y., Santosh, M., and Yao, J. (2013). Genesis of the 1.76 Ga zhaiwa Mo–Cu and its link with the xiong'er volcanics in the north China craton: Implications for accretionary growth along the margin of the columbia supercontinent. Precambrian Res. 227, 337–348.
Deng, X., Peng, T., and Zhao, T. (2016). Geochronology and geochemistry of the late Paleoproterozoic aluminous A-type granite in the Xiaoqinling area along the southern margin of the North China Craton: Petrogenesis and tectonic implications. Precambrian Res. 285, 127–146.
Fan, H., Xie, Y., and Zhai, M. (2001). Study of ore-forming fluids in the Dongping gold deposit, North-Western Hebei. Sci. China( Ser. D) 31 (7), 537–544. (in Chinese).
Fan, H., Xie, Y., Zhao, R., and Wang, Y. (2000). Dual origins of xiaoqinling gold-bearing quartz veins: Fluid inclusion evidence. Chin. Sci. Bull. 45, 1424–1430.
Hart, C. J. R., Goldfarb, R. J., Qiu, Y. M., Snee, L., Miller, L. D., and Miller, M. L. (2002). Gold deposits of the northern margin of the north China craton: Multiple late paleozoic-mesozoic mineralizing events. Miner. Deposita 37, 326–351.
Hayashi, K., and Ohmoto, H. (1991). Solubility of gold in NaCl-and H2S-bearing aqueous solutions at 250350°C. Pergamon 55 (8), 2111–2126.
He, Y., and Liao, Y. (2001). Auriferous CO2-rich fluids in Shengli oil field, Shandong province and their origin. Geoloical Rev. 47 (5), 500–507. (in Chinese with English abstract).
Jiang, N., Xu, J., and Song, M. (1999). Fluid inclusion characteristics of mesothermal gold deposits in the Xiaoqinling district, Shaanxi and Henan Provinces, People’s Republic of China. Minerium Deposita 34, 150–162.
Li, Q., Chen, Y., Zhong, Z., Li, W., Li, S., Guo, X., et al. (2002). Ar-Ar dating on the metallogenesis of the Dongchuang gold deposit in the Xiaoqinling area. Acta Geol. Sin. 76, 488–493.
Li, S., Qu, L., Su, Z., Huang, J., Wang, X., and Yue, Z. (1996). Geology and metallogenic prognosis of fold deposits in the xiaoqinling district. Beijing, China: Geological Publishing House, 250.
Lu, H., Fan, H., Ni, P., Shen, K., and Zhang, W. (2004). Fluid inclusions. Beijing, China: Science Press, 1–487.
Mao, J., Goldfarb, R. J., Zhang, Z., Xu, W., Qiu, Y., and Deng, J. (2002). Gold deposits in the xiaoqinling-xiong'ershan region, qinling mountains, central China. Miner. Deposita 37, 306–325.
Mao, J., Li, Y., Goldfarb, R., He, Y., and Zaw, K. (2003). Fluid inclusions and noble gas studies of the dongping gold deposit, Hebei province, China: A mantle connection for mineralization? Econ. Geol. 98, 517–534.
Mao, J., Xie, G., Pirajno, F., Ye, H., Wang, Y., Li, Y., et al. (2010). Late jurassic-early cretaceous granitoid magmatism in eastern qinling, centraleastern China: SHRIMP zircon U-Pb ages and tectonic implications. Aust. J. Earth Sci. 5, 51–78.
Olmez, I., Finnegan, D. L., and Zoller, W. H. (1986). Iridium emissions from Kilauea volcano. J. Geophys Res. 91, 653–663.
Philippot, P., Ménez, B., and Chevallier, P. (1998). Absorption correction procedures for quantitative analysis of fluid inclusions using synchrotron radiation X-ray fluorescence. Chem. Geol. 144 (1-2), 121–136.
Phillips, G. N., and Evans, K. A. (2004). Role of CO2 in the formation of gold deposits. Nature 429 (6994), 860–863.
Santosh, M. (2010). Assembling North China craton within the columbia supercontinent: The role of double-sided subduction. Precambrian Res. 178, 149–167.
Xu, J., Wang, J., Xiang, P., Li, Y., Xiao, X., Zhang, H., et al. (2015). Extremely CO2-rich fluid inclusion in an orogenic gold deposit: Hamadi gold deposit of Sudan. Acta Petrol. Sin. 31 (4), 1040–1048. (in Chinese with English abstract).
Xu, J., Xie, Y., Ding, R., Yin, Y., Shan, L., and Zhang, G. (2007). CO2-CH4 fluids and gold mineralization: Southern margin of altay, China and muruntau of Uzbekistan. Acta Petrol. Sin. 23 (8), 2026–2032. (in Chinese with English abstract).
Xu, J., Xie, Y., Jiang, N., and Bie, F. (1998). Mineralogical‚fluid inclusion‚and stable isotope study of Wenyu-Dongchuang gold deposits in the Xiaoqinling Mt. Area‚ west Henan‚ China. Explor. Minning Geol. 7 (4), 321–332.
Yang, K., and Scott, S. D. (1996). Possible contribution of metal-rich magmatic fluid to a seafloor hydrothermal system. Nature 383, 420–423.
Zhao, H. X., Jiang, S. Y., Frimmel, H. E., Dai, B. Z., and Ma, L. (2012). Geochemistry, chronology and Sr-Nd-Hf isotopes of two mesozoic granitoids in the xiaoqinling gold district: Implication for large-scale lithospheric thinning in the north China craton. Chem. Geol. 294–295, 173–189.
Zhao, H. X., Frimmel, H. E., Jiang, S. Y., and Dai, B. Z. (2011). LA-ICP-MS trace element analysis of pyrite from the xiaoqinling gold district, China: Implications for ore Genesis. Ore Geol. Rev. 43, 142–153.
Zhou, L., and Wang, Y. (2012). Late carboniferous syn-tectonic magmatic flow at the northern margin of the North China craton-evidence for the reactivation of cratonic basement. J. Asian Earth Sci. 54 (55), 131–142.
Keywords: mineralization stages, fluid inclusion, SRXRF, Dongtongyu, gold deposit
Citation: Wei H, Xu L, Li D, Feng Y, Wu X, Chang H, Wang D, Liu Z and Du W (2023) Fluid mineralization of the Dongtongyu gold deposit in the southern margin of North China craton: Evidence from microthermometry and composition of fluid inclusions. Front. Earth Sci. 10:1081634. doi: 10.3389/feart.2022.1081634
Received: 27 October 2022; Accepted: 30 November 2022;
Published: 06 January 2023.
Edited by:
Zhuang Li, College of Geosciences, China University of Petroleum, ChinaReviewed by:
Jiaxin Wang, Chinese Academy of Geological Science, ChinaXian Yang, East China University of Technology, China
Copyright © 2023 Wei, Xu, Li, Feng, Wu, Chang, Wang, Liu and Du. This is an open-access article distributed under the terms of the Creative Commons Attribution License (CC BY). The use, distribution or reproduction in other forums is permitted, provided the original author(s) and the copyright owner(s) are credited and that the original publication in this journal is cited, in accordance with accepted academic practice. No use, distribution or reproduction is permitted which does not comply with these terms.
*Correspondence: Yunlei Feng, yunlei_feng@126.com; Liangwei Xu, xuliangwei@pku.edu.cn