 Seock-Ho Kim*
 Minho KwakMeina BianZachary Feldberg
 Travis HenryJuyeon Lee
 İbrahim Burak Ölmez
 Yawei ShenYanyan TanVictoria Tanaka
 Jue WangJiajun XuAllan S. Cohen
- Department of Educational Psychology, The University of Georgia, Athens, GA, United States
Item response theory modeling articles from 83 years of Psychometrika are sorted based on the taxonomy by Thissen and Steinberg (1986). Results from 377 research and review articles indicate that the usual unidimensional parametric item response theory models for dichotomous items were employed in 51 per cent of the articles. The usual unidimensional parametric item response theory models for polytomous items were employed in 21 per cent of the articles. The multidimensional item response theory models were employed in 11 per cent of the articles. Item response theory models from the selected psychometric textbooks are also reviewed and contrasted with those from Psychometrika to explore the instructional use of various item response models. A new classification based on data types is proposed and discussed.
1. Introduction
A large number of item response theory (IRT) models currently exist for analysis of item response data. An important question is, “How are these models related?” In this study, we give answers to several related questions about IRT models based on review of two sets of materials, articles in Psychometrika and textbooks on psychometric theory. We address the following questions: “What are the basic IRT models frequently employed in research and teaching?” and “What additional IRT models are used most often beyond the basic ones?” For psychometricians, measurement specialists, and applied statisticians who want to study and use IRT models as well as for teachers preparing courses in psychometrics and educational measurement for advanced undergraduate and graduate students, we report a summary of IRT models based on this review.
Classifications of the models in the articles and the textbooks are based mainly on the taxonomy of Thissen and Steinberg (1986). The taxonomy and its entries are only briefly described here. Interested readers are referred to the original, seminal work of Thissen and Steinberg (1986). In their taxonomy, Thissen and Steinberg (1986) classified item response models into four distinct types based on assumptions and constraints on the parameters: binary models, difference models, divided-by-total models, and left-side-added models. They classified, for example, the two-parameter normal ogive model and the Rasch model as the binary models; Samejima's graded response model in normal ogive and logistic forms as the difference model; Bock's nominal response model and Master's partial credit model as the divide-by-total models; and Birnbaum's three-parameter logistic model as the left-side-added model (see Thissen and Steinberg, 1986, and references therein).
Since the publication of the taxonomy, there have been many different directions of the development of IRT. Many different IRT models have been proposed, and even experts in the psychometric field may not be able to comprehend the full scope of the theory and applications of IRT. In this paper, a different classification of the IRT models based on the type of data analyzed is proposed.
2. Methods
2.1. Review of Articles
For the purpose of review of articles, this study considered Volumes 1 through 83 (March 1936 through December 2018) of Psychometrika. The initial review included all articles identified in the table of contents as Articles, Notes, Comments, Brief Comments, Tables, and Presidential Addresses. Excluded from the initial review were Errata, Announcements, Abstracts, Book Reviews, Rules, Obituaries, Reports, Minutes, Notices, Constitution, and Lists of Members. The total number of initially reviewed articles was 2,883. Next, a group of measurement specialists eventually selected 377 articles for detailed review. The 377 articles were selected for their direct relevance to various IRT models. Finally, at least two measurement specialists independently reviewed each of the 377 articles for their use of IRT models and completed a checklist documenting topics and models. All reviewers were faculty members or graduate students trained in both quantitative methodology and applied statistics.
Each reviewer read the abstract, the methods section, and all tables, and also scanned other sections of each article for information relevant to the review. For each one of 377 selected articles, the presence or absence of topic categories used in the abstract submission of the 2018 annual meeting of the Psychometric Society was recorded and entered in coded form into a computer record. The purpose of this preliminary categorization was to understand the research context of the IRT relevant articles before performing detailed classifications based on the models. Two categories were assigned to each article, the IRT category and one additional category assigned by the reviewer. The IRT category was required for the article to remain in the review.
2.2. Topic Categories of Articles
Table 1 lists the 28 topic categories used for abstracts submitted to the 2018 annual meeting of the Psychometric Society. Table 1 contains both the primary category of IRT and the one secondary category. The sum of the frequencies of the secondary categories was 377.
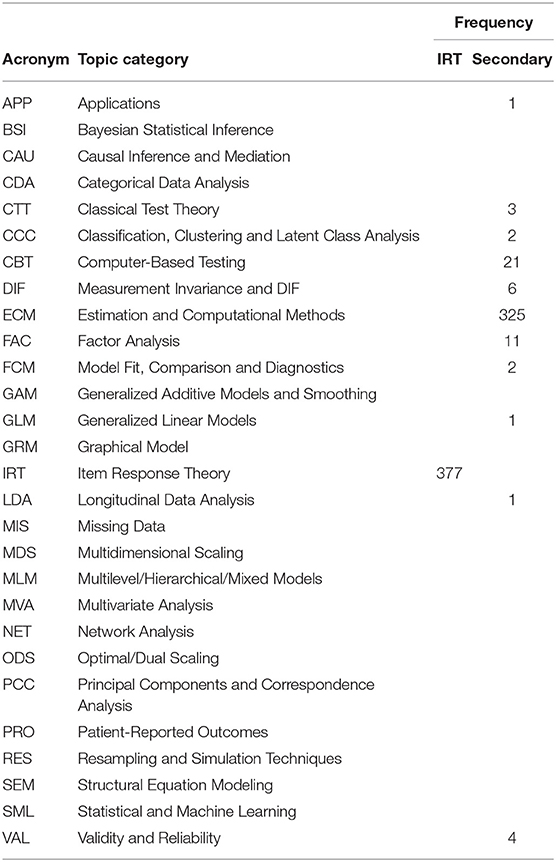
Table 1. IRT and the secondary topic categories for articles.
Because the 377 articles were selected for their relevance to IRT modeling, all of the articles fit the IRT topic. It should be noted that IRT might not have been the main topic or even the secondary topic of the article. In such cases, IRT was nevertheless selected to be the main topic and what was initially the main topic of the article became the secondary topic. Hence, the primary and secondary notion didn't really reflect the strict order of the importance of the topics in the articles. Also, occasionally several equally weighted additional topics were mentioned and used within an article. These primary and secondary topics and their frequencies were clearly based on the reviewers' judgment.
2.3. Article Review Process
For each of the articles receiving detailed review, any disagreements between the two or more independent reviewers were removed after discussion and negotiation. We also partitioned these articles into theoretical and application types. All articles except for four were classified as theoretical.
The main task of the article review was to determine the frequency of the IRT models employed in the articles. The classification framework by Thissen and Steinberg (1986) was used in sorting of the articles.
2.4. Psychometric Textbooks
IRT models presented in 37 psychometric textbooks also were sorted based on the classification framework by Thissen and Steinberg (1986). The textbooks were selected mainly from the lists of the references of four graduate level psychometric courses (i.e., courses on test theory, IRT, Rasch modeling, and applications of IRT). Several of them were used as the primary textbooks for respective courses. Others were either recommended textbooks or suggested reading materials.
3. Results
3.1. Trend of Articles
The blue dot in Figure 1 represents the number of articles published in each volume of Psychometrika from 1936 to 2018. The red dot in Figure 1 represents the number of IRT relevant articles in each volume. In terms of the summary statistics, the average of the number of articles in each volume was 34.7 and its standard deviation was 8.6. The five number summary of (minimum, 25th percentile, median, 75th percentile, maximum) by Tukey (1977) was (19, 29, 33, 41, 59). As can be seen in Figure 1, there was a steadily increasing pattern in the number of articles in each volume. The average of the number of IRT relevant articles in each volume was 4.6 and its standard deviation was 4.7. The five number summary was (0, 0, 3, 8, 17). A rapid increase occurred between the 70's and the 90's for the number of IRT relevant articles in each volume.
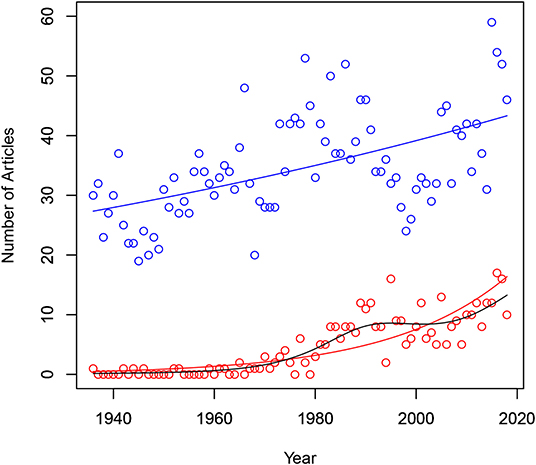
Figure 1. Number of articles and number of item response theory relevant articles by year.
Using generalized linear modeling, the predicted number of articles can be modeled with year as the explanatory variable. With Poisson as a random component and the log link, the prediction equation was log(average articles) = −7.5603636 + 0.0056141 × year. The line for the predicted values of the number of articles is plotted in blue in Figure 1. Also the predicted number of IRT relevant articles can be modeled with year as the explanatory variable. With Poisson as a random component and the log link, the prediction equation was log(average IRT articles) = −84.123074 + 0.043072 × year. The line for the predicted values of the number of IRT relevant articles is plotted in red in Figure 1. Due to the somewhat irregular shape observed in the relationship between the number of IRT relevant articles and year, a smoothing method based on generalized additive models was performed (see Agresti, 2007, p. 78). The fitting line with Poisson as a random component is shown in black in Figure 1. The R package ‘gam’ by Hasti (2018) was used to obtain the fitted line.
The pattern of the proportion of the IRT relevant articles in each volume from 1936 to 2018 can be seen in Figure 2. The average proportion was 0.12 and its standard deviation was 0.12. The five number summary of IRT articles was (0, 0, 0.07, 0.22, 0.50). The proportion seems to rapidly increase between the 70's and the 90's.
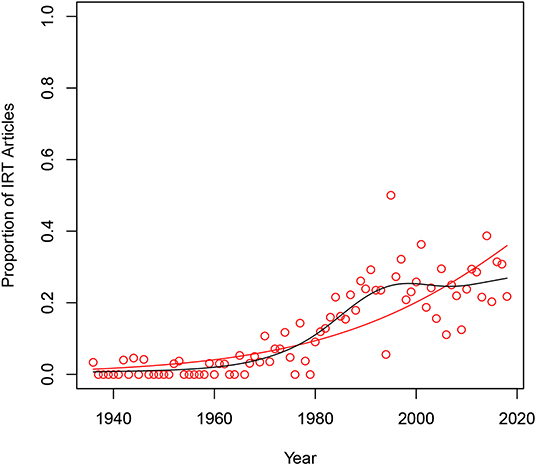
Figure 2. Proportion of item response theory relevant articles by year.
The predicted proportion of the number of IRT relevant articles can be modeled with year as the explanatory variable. With binomial as a random component and the logit link, the prediction equation was logit(average proportion of IRT articles) = −90.289061 + 0.044456 × year. The line for the predicted values of the proportion of IRT relevant articles is plotted in red in Figure 2. Due to somewhat irregular shape observed in the relationship between the proportion of IRT relevant articles and year, a smoothing method based on generalized additive models was performed. Also, note that the logit link may not be a good choice. The fitted line with quasi-binomial as a random component is shown in black in Figure 2. About 20 per cent of the articles in Psychometrika for last 30 years seem to employ some type of IRT models.
3.2. Classification by Decades
The use of IRT models by decades can be seen in Table 2. The bottom line contains the total number of IRT relevant articles by decades. Note that the entries are not mutually exclusive, although the numbers of unique IRT articles in the bottom line are mutually exclusive. The far right-hand-side column of Table 2 shows the frequency of IRT models found in Volumes 1 through 83 of Psychometrika. Full names of the acronyms of the models in Table 2 can be found in the note (see also Table 4).

Table 2. IRT models from psychometrica articles.
Based on the analysis of the models in the 377 articles in Psychometrika, a reader who is familiar with the usual unidimensional parametric IRT models for dichotomous items (e.g., the Rasch model, the one-parameter logistic model, the two-parameter logistic or normal ogive model, and the three-parameter logistic or normal Ogive model) can recognize IRT models used in 194 out of 377 articles (51 per cent). Note that the number 194 was not obtained from Table 2 but rather was based on separate counting of the articles: The numbers in Table 2, especially for the row total values, are not mutually exclusive because, for example, an article might employ two or more different IRT models together. A reader who is familiar with the unidimensional parametric IRT models for polytomous items (e.g., the graded response model, the partial credit model, the rating scale model, the nominal categories model, or the generalized partial credit model) can recognize models used in an additional 79 out of 377 articles (21 per cent). Assuming that a reader who is familiar with polytomous models can understand all dichotomous models, the rate of the recognition can be cumulatively 72 per cent. It is hypothesized that familiarity with each of the more complicated IRT models gradually increases the percentage of accessible articles. A reader who is familiar with the multidimensional IRT models can recognize models in an additional 40 articles (11 per cent). Cumulatively, this would be 83 per cent of the number of articles reviewed.
More complicated models (e.g., non-parametric models, testlet models, mixture models, multilevel models, etc.) were used in journal articles together with the usual parametric models for the dichotomous and polytomous items. Hence, models contained in 64 out of 377 (17 per cent) of the articles cannot be fully understood, if a reader knows only the three classes of parametric models.
In terms of the models, articles published recently in roughly the last 20 years were more complicated, both mathematically and statistically, than previously. Articles reporting theoretical research investigations based on more complicated IRT models require a deeper understanding of and more extensive training in psychometrics and applied statistics.
3.3. Models in Textbooks
Table 3 shows various IRT models presented in the 37 selected psychometrics and educational measurement textbooks (see Table 4 for the acronyms for the models). The textbooks included G = Gullickson (1950), R = Rasch (1960), LN = Lord and Novick (1968), WS = Wright and Stone (1979), AY = Allen and Yen (1979), L = Lord (1980), A = Andersen (1980), WM = Wright and Masters (1982), H = Hambleton (1983), HDP = Hulin, Drasgow, and Parsons (1983), HS = Hambleton and Swaminathan (1985), B = Baker (1985), CA = Crocker and Algina (1986), HSR = Hambleton, Swaminathan, and Roger (1991), B1 = Baker (1992), FM = Fischer and Molenaar (1995), VH = Van der Linden and Hambleton (1997), mD = McDonald (1999), JA = Johnson and Albert (1999), ER = Embretson and Reise (2000), TW = Thissen and Wainer (2001), BK = Baker and Kim (2004), dBW = De Boeck and Wilson (2004), SS = Smith and Smith (2004), RS = Rao and Sinharay (2006), dA = De Ayala (2009), Re = Reckase (2009), NO = Nering and Ostini (2010), dM = deMars (2010), RM = Raykov and Marcoulides (2011), F = Fox (2010), E = Engelhard (2013), RR = Reise and Revicki (2015), SZ = Stone and Zhu (2015), V = Van der Linden (2016a), BK1 = Baker and Kim (2017), and Bd = Bandalos (2018). Appendix contains the full list of the 37 textbooks.
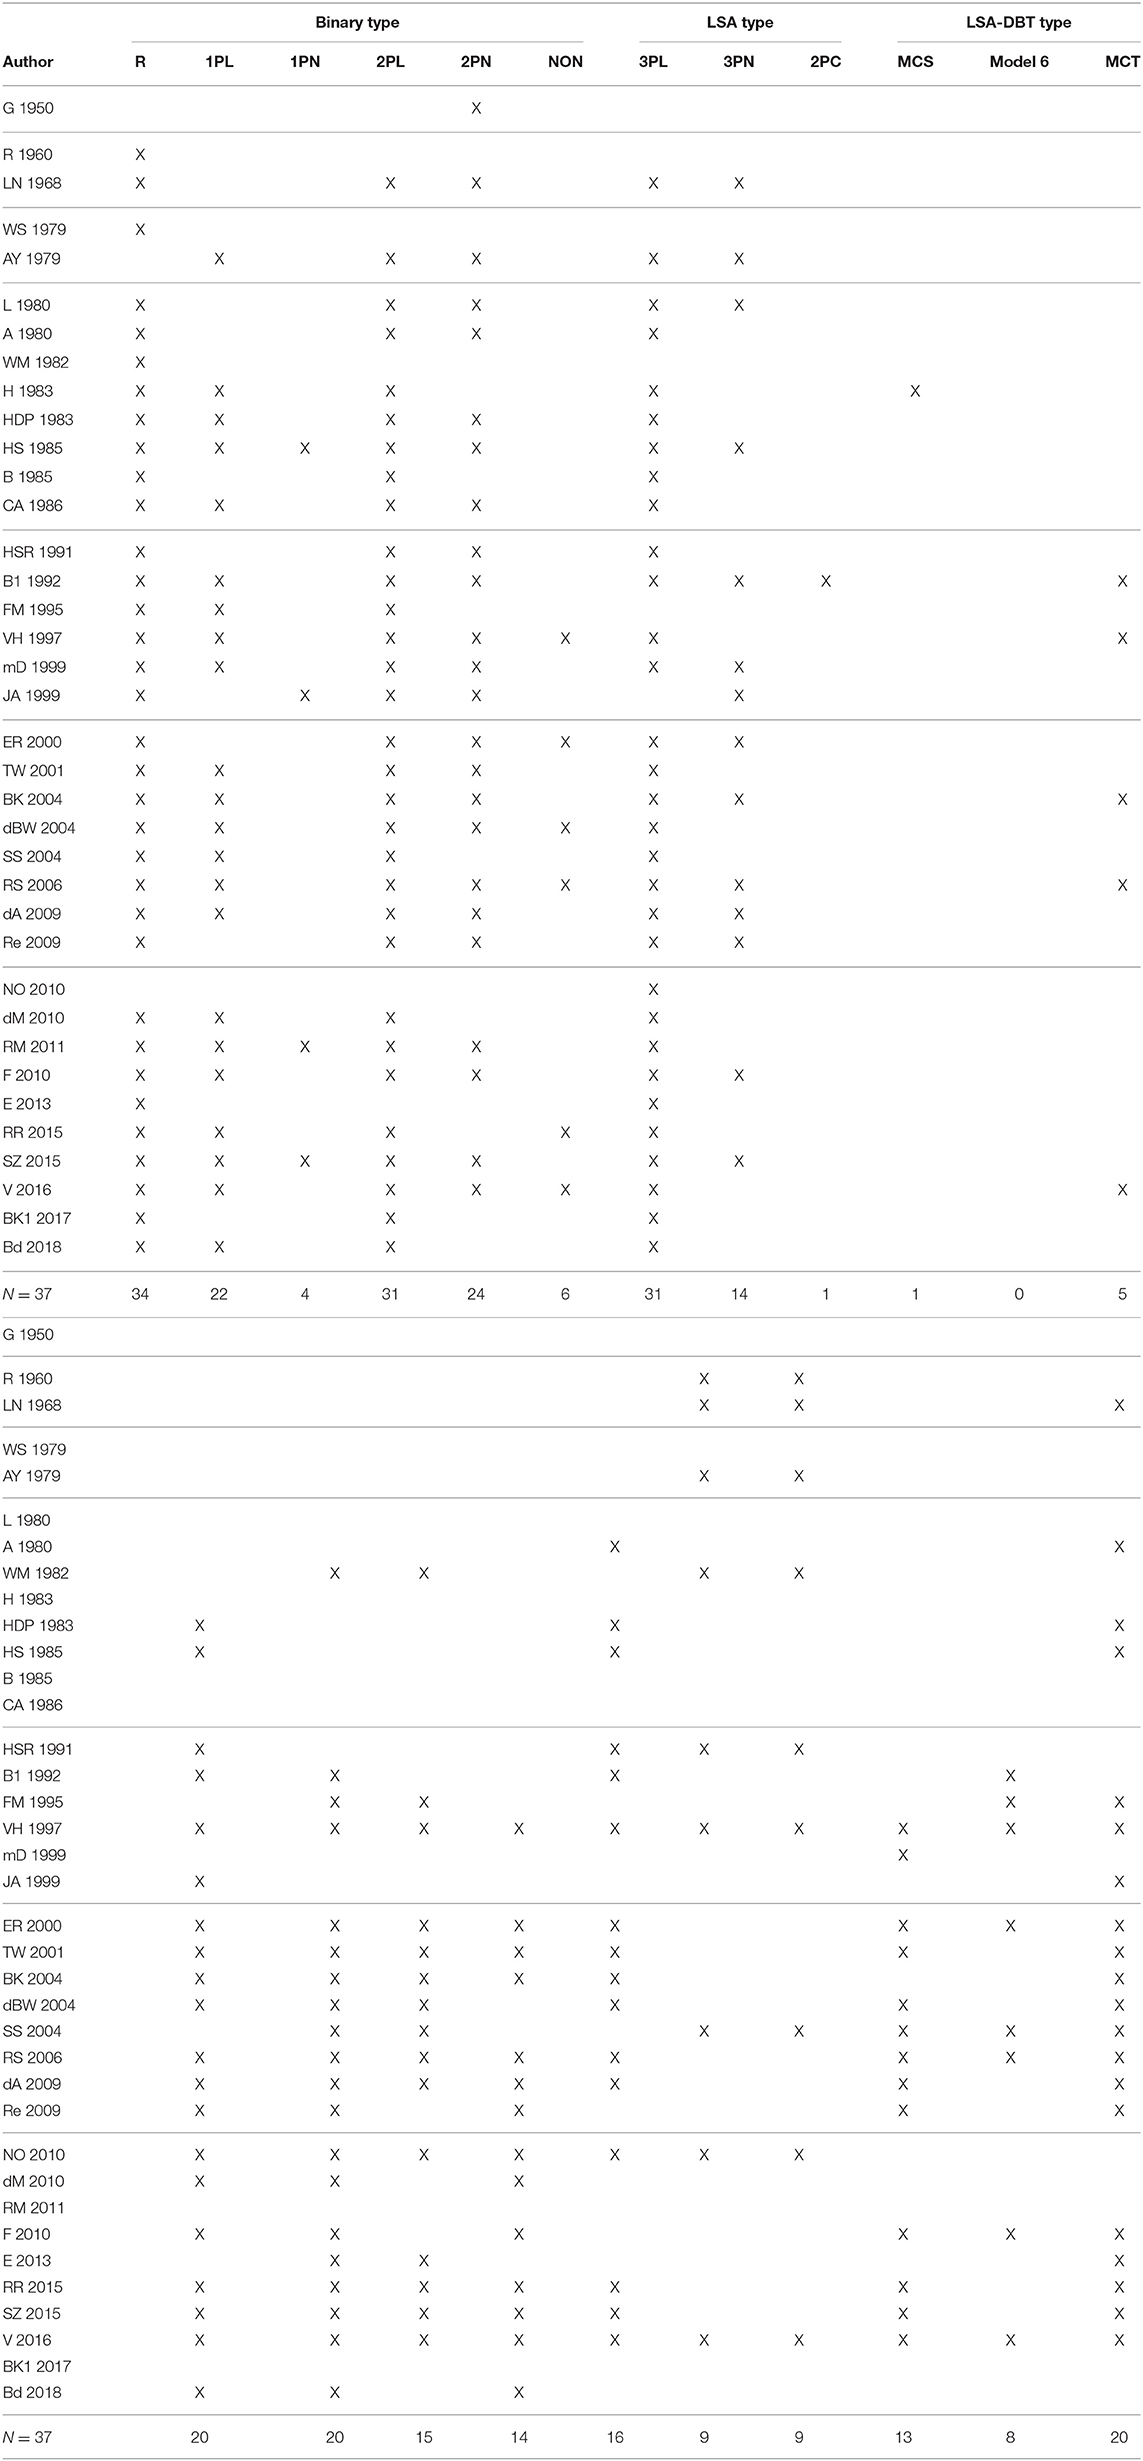
Table 3. Summary of item response theory models presented in psychometric textbooks.
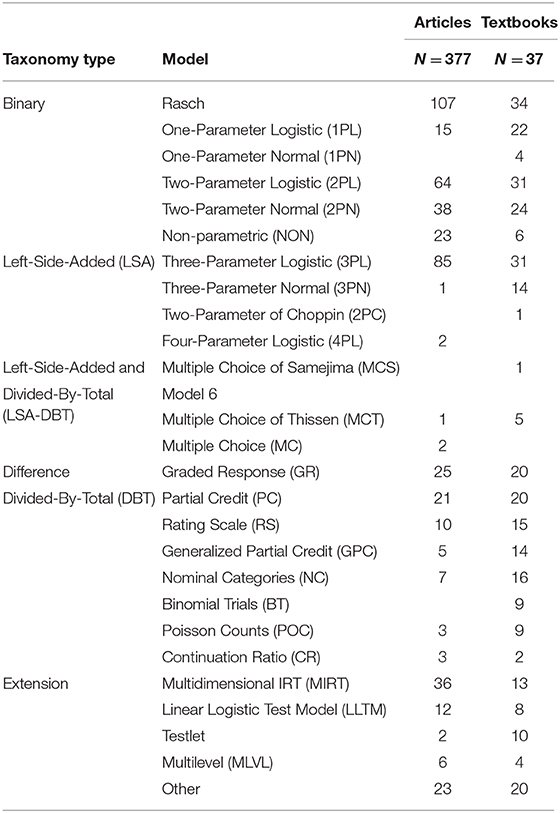
Table 4. Item response theory models from the Psychometrika articles and the textbooks.
Gullickson (1950) contained only the two-parameter normal-ogive model. The handbooks by Van der Linden and Hambleton (1997) and by Van der Linden (2016a), respectively, contained more than 17 IRT models. Nearly all textbooks present the Rasch model, the two-parameter logistic model, and the three-parameter logistic model. More recent textbooks contained models for the polytomous items, multidimensional IRT models, and other more complicated models.
3.4. Summary of Models
Table 4 indicates that journal articles in Psychometrika made slightly different use of IRT models than did mostly graduate level textbooks in psychometrics and educational measurement. Although details of the IRT models in the 37 textbooks were not clearly presented here, because only marginal sums of the respective models were recorded in the last column, many introductory psychometric textbooks contained only models for the dichotomously scored items. Numbers in some IRT models showed lower frequencies, indicating that those models were used relatively less often in the textbooks or in Psychometrika.
Table 4 shows that many of the articles reviewed relied on some type of unidimensional dichotomous IRT models (see also Table 2). The Rasch model was the most frequently used model in Psychometrika (i.e., 107 out of 377 articles). The next most frequently used model was the three-parameter logistic model (i.e., 85 out of 377 articles). The third most frequently used model was the two-parameter logistic model (i.e., 64 out of 377 articles). The polytomous IRT models were generally used less frequently (25 for the graded response model, 21 for the partial credit model, 10 for the rating scale model, 5 for the generalized partial credit model, and 7 for the nominal categories model, all out of 377 articles). The multidimensional model was used in 36 out of 377 articles.
Table 4 also shows models used in the 37 psychometric textbooks. The Rasch model was the most frequently described model in the textbooks (i.e., 34 out of 37 textbooks). The next most frequently used models are the two-parameter logistic model and the three-parameter logistic model (i.e., 31 out of 37 textbooks, respectively). The polytomous IRT models are generally used less frequently (20 for the graded response model, 20 for the partial credit model, 15 for the rating scale model, 14 for the generalized partial credit model, and 16 for the nominal categories model; all out of 37 textbooks). The multidimensional model was described in 13 out of 37 textbooks. Note that the depth of the treatment of these models should not be inferred from the information summarized in Table 4.
In Table 4, IRT models from the psychometric textbooks are contrasted with those from Psychometrika to explore the use of various item response models. The IRT models presented in the usual psychometric textbooks are somewhat well-aligned with those from the IRT theory articles in Psychometrika. Furthermore, the various textbooks reviewed are oriented to different groups of psychometric researchers, and contain a wide variety of psychometric applications.
4. Categorizing Models by Item Type
There are many different item formats, and one way to classify IRT models is in terms of the item response data plus any additional variables included in modeling, as shown in Table 5. If we denote the original item response data for multiple choice items as U, then IRT models for multiple choice items can be used to estimate model parameters without imposing any modification or transformation of U. When we denote the keyed or scored data to be R and further denote dichotomously scored data to be D, then we can use the Rasch model and other IRT models for dichotomously scored items (e.g., 1PL, …, 4PL). If R is further specified by the types of polytomously scored items, denoted by P, then we can use IRT models for polytomous items. We can further divide P into ordered scored data O and nominal data N.
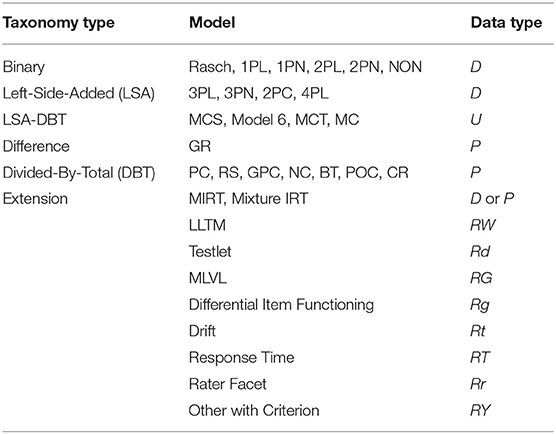
Table 5. Item response theory models by data type employed.
If we denote the set of item parameters as ξ and the set of ability parameters as θ, the parametric models in Table 5, except for those classified as extension type, yield the probability of observing R of P(R) = f(ξ, θ). No other parameters need to be included. If we allow additional dimensionality to the item and ability parameters, then we can have respective sets of multidimensional IRT models for R. In this sense, the multidimensional models are fully inclusive ones. If there exists a hyperparameter τ that designates the membership of latent groups and both ability and item parameters are characterized by τ, then we may have respective sets of mixture IRT models [cf. in Bayesian analysis, P(R) = f(ξ, η, θ, τ) with a hyperparameter η for ξ]. Note that in both unidimensional and multidimensional sets of models, we are not required to use any auxiliary variables other than item response data, say R, in modeling. All of the aforementioned models for R can be seen as measurement models.
When examinee groups are organized with a manifested variable (e.g., male and female), then the data can be denoted as Rg. In conjunction with IRT modeling, such data can be treated as multiple group data (e.g., differential item functioning data, linking/equating data from a certain data collection design, measurement invariance data, etc.). Models for differential item functioning, for example, can be applied to such data. A similar case with a timing variable t can yield data Rt. The IRT model for such data can be termed a parameter drift model. It can be seen that, in case of obtaining R, raters also can be entered to the modeling as a new facet of the resulting data in the generalizability context. If the raters' information, denoted as r, is also entered in the data, then we can express the data as Rr and add the set of raters' parameters (e.g., severity) to the model. If there exists information about the cognitive process components required to solve the items (e.g., W for the linear logistic test model), the resulting models relate ξ to another set of basic parameters (e.g., η in the linear logistic test model). There are several linear logistic or component test models that use RW as input data. The testlet model seems to require an additional vector that contains item relationship or dependency d, that is, Rd as the input data and tries to explicate the dependency among the items. If the matrix of a nested grouping structure G is added to the data, then the required IRT model for analyzing such data of RG becomes the multilevel IRT model. In addition, if the time matrix T that contains examinees' response time to items is combined with the response data to yield RT, then IRT models that contain speediness parameters can be used. All of these models which require additional variables to R seem to seek structural relations of the variables involved. Moderation or mediation on the simple measurement function, P(R) = f(ξ, θ), could be investigated using the information from the additional variables entered in the models. According to Kane (2006), all can be viewed as the models for validation or for structural equations.
Table 5 summarizes the classification of IRT models by the data type employed in modeling. In the above classification, the type of input data determines the resulting so called parametric IRT models. For convenience, the non-parametric model is placed as a binary type model. In fact, the class of non-parametric models can be applicable to many other item types. There are many non-parametric IRT models for different types of data as well as models for non-monotone items.
Except for general IRT review articles in Psychometrika, not many IRT models have been used simultaneously in each research article. Although models are grouped based on the data type, in real testing situations, models can be combined to analyze data from mixed item types. The models in Table 5 with data R can be further classified into ones with either D or P. Hence, all of these appear in the extension category and can be further classified with models for dichotomous or polytomous items.
It can be noted that dichotomous data, say D, can be fitted with many different models. A set of simple item response models can be hypothesized to have two set of parameters. For example P(D) = f(ξ, θ) in the likelihood framework or P(D) = f(ξ, η, θ, τ) in the Bayesian framework. Because the same data can be employed in multidimensional models and mixture models, the total number of parameters is effectively unlimited. Sometimes, because too many parameters are utilized in a model, the usual standard estimation methods cannot be used to estimate the parameters. Many models in complicated forms may require estimation methods beyond the traditional ones such that complicated models may not be viable in the usual science for prediction and control. That is, as the complexity of the structure of a given model increases, the practical utility may decrease.
5. Discussion
The selected articles relevant to IRT modeling in Psychometrika and the textbooks were sorted based on the classification framework by Thissen and Steinberg (1986). Another recent classification based on van der Linden (2016), however, also can be used, and a more refined subclassification (e.g., Nering and Ostini, 2010) might also be considered. Note that articles may be further sorted by the parameter estimation methods (e.g., Baker and Kim, 2004; de Ayala, 2009) as well as by the computer programs used to implement the estimation methods (e.g., Hambleton et al., 1991, p. 159–160). Thissen and Steinberg's 1986 classification was partly based on the parameter estimation context. Models employed in a journal article may have a different role from the ones appearing in a textbook. Although textbooks try to describe many models, there seem to be several core IRT models for item responses.
If data contain more than item responses, then the model that accounts for both item response data and the additional data should be viewed as a validation model that basically seeks to determine the relationship between the underlying ability and the criterion variable (whether such a variable is latent or directly observable). IRT models are measurement models. Validation models are akin to structural equation models, because they subsume measurement models, for example, see Bollen (1989). The models in the extended class, except for the multidimensional models and the mixture models, are hence validation models. As long as the measurement modeling is concerned, the classification by Thissen and Steinberg (1986) is expected to continue to be useful.
The taxonomic tabulations in this study can aid psychometricians who are planning their continued training in IRT, as well as faculty who design or teach courses on psychometric methods and educational measurement. According to Bock (1997) and Popham (1993), understanding even basic models in IRT requires extensive psychometric training. Moreover, many more complicated models for item response data have been recently proposed. As an essential purpose of science is classification as suggested by Bloom (1956) and Campbell and Reece (2005), a more refined taxonomy, especially for the extension type, will be of help.
There are several limitations of the study. It should be noted that only articles published in Psychometrika were reviewed. Although Psychometrika is the most prestigious psychometric journal, there are also premier measurement journals including, for example, Educational and Psychological Measurement, Journal of Educational Measurement, British Journal of Mathematical and Statistical Psychology, Applied Psychological Measurement, Journal of Educational and Behavioral Statistics, Applied Measurement in Education, Journal of Applied Measurement, and so on. Care should be exercised to generalize the use of IRT models shown in this study to the entire field of psychometrics. There are likely many IRT relevant models suggested in other journals than Psychometrika. For example, a model for multiple choice items proposed in Deng and Bolt (2016) was not accounted in the current review because it was published in Applied Psychological Measurement. Hence, many studies relevant to IRT were not included in the current review. It is recommended that similar summaries of the IRT models can be performed for the respective journals to obtain a full picture of the IRT models in theory and practice.
Note that there is a problem of lack of representativeness of the textbooks we reviewed based on the four graduate level psychometric courses. It is not claimed that the list of the textbooks is complete and exhaustive. A new textbook by Paek and Cole (2019) may be added to the review. Nevertheless, it is believed that these textbooks would provide reasonable snapshots of the use of IRT models in instruction and training of psychometricians and assessment professionals. It is suggested that more studies by other scholars be performed to obtain possibly different summaries of IRT models from the psychometric textbooks.
In addition, it should be mentioned that the hierarchical nature of IRT models may not be chiseled firmly into stone. Hence, the hierarchy in terms of understanding IRT models is somewhat arbitrary. It is nevertheless believed that models for polytomous items are more difficult to understand than those for dichotomous items. It is also assumed that more complicated models could be comprehended much easier if understanding of less complicated models is accompanied. As many books on methodology and statistics, the coverage of IRT models seems to progress from simple to complex in many IRT textbooks.
Lastly, it should be noted that the taxonomy based on data types might not be fully complete. Such a taxonomy, however, will help to understand the IRT models. It should be emphasized that the classification shown in the new taxonomy is tentative. It is hoped that other classifications based on more profound reasoning should appear in a near future by other scholars.
Author Contributions
All authors listed have made a substantial, direct and intellectual contribution to the work, and approved it for publication.
Conflict of Interest
The authors declare that the research was conducted in the absence of any commercial or financial relationships that could be construed as a potential conflict of interest.
Acknowledgments
Portions of paper were presented at the 2018 International Meeting of the Psychometric Society in New York.
References
Bloom, B. S. (1956). Taxonomy of Educational Ojbectives: The Classification of Educational Goals. Handbook 1: Cognitive Domain. New York, NY: Longman.
Campbell, N. A., and Reece, J. B. (2005). Biology, 7th Edn. San Francisco, CA: Pearson; Benjamin Cummings.
Deng, S., and Bolt, D. M. (2016). A sequential IRT model for multiple-choice items and a multidimensional extension. Appl. Psychol. Meas. 40, 243–257. doi: 10.1177/0146621616631518
Hasti, T. (2018). Package ‘gam’. Retrieved from: https://cran.r-project.org/web/packages/gam/gam.pdf
Kane, M. T. (2006). “Validation”, in Educational Measurement, 6th Edn., ed R. L. Brennan (Westport, CT: Praegerz), 17–64.
Paek, I., and Cole, K. (2019). Using R for Item Response Theory Model Applications. New York, NY: Routledge.
Popham, W. J. (1993). Educational measurement in America: what's right, what's wrong? A criterion referenced perspective. Educ. Meas. Issues Pract. 12, 11–14.
Thissen, D., and Steinberg, L. (1986). A taxonomy of item response models. Psychometrika 51, 567–577.
Appendix: Psychometric Textbooks in Alphabetical Order
1. Allen, M. J., and Yen, W. M. (1979). Introduction to Measurement Theory. Monterey, CA: Brooks/Cole.
2. Andersen, E. B. (1980). Discrete Statistical Models With Social Science Applications. Amsterdam, Netherlands: North-Holland.
3. Baker, F. B. (1985). The Basics of Item Response Theory. Porsmouth, NH: Heinemann.
4. Baker, F. B. (1992). Item Response Theory: Parameter Estimation Techniques. New York, NY: Dekker.
5. Baker, F. B., and Kim, S.-H. (2004). Item Response Theory: Parameter Estimation Techniques, 2nd Edn. New York, NY: Dekker.
6. Baker, F. B., and Kim, S.-H. (2017). The Basics of Item Response Theory Using R. New York, NY: Springer.
7. Bandalos, D. L. (2018). Measurement Theory and Applications for the Social Sciences. New York, NY: Guilford Press.
8. Crocker, L., and Algina, J. (1986). Introduction to Classical & Modern Test Theory. Belmont, CA: Wadsworth.
9. De Ayala, R. J. (2009). The Theory and Practice of Item Response Theory. New York, NY: The Guilford Press.
10. De Boeck, P., and Wilson, M. (Eds.). (2004). Explanatory Item Response Models: A Generalized Linear and Nonlinear Approach. New York, NY: Springer.
11. DeMars, C. (2010). Item Response Theory. New York, NY: Oxford University Press.
12. Embretson, S. E., and Reise, S. P. (2000). Item Response Theory for Psychologists. Mahwah, NJ: Lawrence Erlbaum Associates.
13. Engelhard, G. Jr. (2013). Invariant Measurement: Using Rasch Models in the Social, Behavioral, and Health Sciences. New York, NY: Routledge.
14. Fischer, G. H., and Molenaar, I. W. (1995). Rasch Models: Foundations, Recent Developments, and Applications. New York, NY: Springer.
15. Fox, J.-P. (2010). Bayesian Item Response Theory. New York, NY: Springer.
16. Gulliksen, H. (1950). Theory of Mental Tests. New York, NY: Wiley.
17. Hambleton, R. K. (ed.). (1983). Applications of Item Response Theory. Vancouver, BC: Educational Research Institute of British Columbia.
18. Hambleton, R. K., and Swaminathan, H. (1985). Item response Theory: Principles and Applications. Boston, MA: Kluwer-Nijhoff.
19. Hambleton, R. K., Swaminathan, H., and Rogers, H. J. (1991). Fundamentals of Item Response Theory. Newbury Park, CA: Sage.
20. Hulin, C. L., Drasgow, F., and Parsons, C. K. (1983). Item Response Theory: Application to Psychological Measurement. Homewood, IL: Dow Jones-Irwin.
21. Johnson, V. E., and Albert, J. H. (1999). Ordinal Data Modeling. New York, NY: Springer.
22. Lord, F. M (1980). Applications of Item Response Theory to Practical Testing Problems. Hillsdale, NJ: Lawrence Erlbaum Associates.
23. Lord, F. M., and Novick, M. R. (1968). Statistical Theories of Mental Test Scores. Reading, MA: Addison-Wesley.
24. McDonald, R. P. (1999). Test Theory: A Unified Treatment. Mahwah, NJ: Lawrence Erlbaum Associates.
25. Nering, M. L., and Ostini, R. (2010). Handbook of Polytomous Item Response Theory Models. New York, NY: Routledge.
26. Rao, C. R., and Sinharay, S. (eds.). (2006). Handbook of Statistics 26: Psychometrics. Amsterdam: North Holland.
27. Rasch, G. (1960). Probabilistic Models for Some Intelligence and Attainment Tests. Copenhagen: Danmarks Pædagogiske Institut.
28. Raykov, T., and Marcoulides, G. A. (2011). Introduction to Psychometric Theory. New York, NY: Routledge.
29. Reckase, M. (2009). Multidimensional Item Response Theory. New York, NY: Springer.
30. Reise, S. P., and Revicki, D. A. (Eds.). (2015). Handbook of Item Response Theory Modeling: Applications to Typical Performance Assessment. New York, NY: Routledge.
31. Smith, E. V., and Smith, R. M. (Eds.). (2004). Introduction to Rasch Measurement. Maple Grove, MN: JAM Press.
32. Stone, C. A., and Zhu, X. (2015). Bayesian Analysis of Item Response Theory Models Using SAS. Cary, NC: SAS Institute.
33. Thissen, D., and Wainer, H. (eds.). (2001). Test Scoring. Mahwah, NJ: Lawrence Erlbaum Associates.
34. Van der Linden, W. J. (ed.). (2016). Handbook of Item Response Theory, Volume 1: Models. Boca Raton, FL: CRC Press.
35. Van der Linden, W. J., and Hambleton, R. K. (eds.). (1997). Handbook of Modern Item Response Theory. New York, NY: Springer.
36. Wright, B. D., and Masters, G. N. (1982). Rating Scale Analysis. Chicago, IL: MESA Press.
37. Wright, B. D., and Stone, M. H. (1979). Best Test Design. Chicago, IL: MESA Press.
Keywords: item response theory, models, psychometric textbooks, Psychometrika, taxonomy
Citation: Kim S-H, Kwak M, Bian M, Feldberg Z, Henry T, Lee J, Ölmez İB, Shen Y, Tan Y, Tanaka V, Wang J, Xu J and Cohen AS (2020) Item Response Models in Psychometrika and Psychometric Textbooks. Front. Educ. 5:63. doi: 10.3389/feduc.2020.00063
Received: 05 December 2019; Accepted: 04 May 2020;
Published: 09 June 2020.
Edited by:
Bernard Veldkamp, University of Twente, NetherlandsReviewed by:
April Lynne Zenisky, University of Massachusetts Amherst, United StatesYong Luo, Educational Testing Service, United States
Copyright © 2020 Kim, Kwak, Bian, Feldberg, Henry, Lee, Ölmez, Shen, Tan, Tanaka, Wang, Xu and Cohen. This is an open-access article distributed under the terms of the Creative Commons Attribution License (CC BY). The use, distribution or reproduction in other forums is permitted, provided the original author(s) and the copyright owner(s) are credited and that the original publication in this journal is cited, in accordance with accepted academic practice. No use, distribution or reproduction is permitted which does not comply with these terms.
*Correspondence: Seock-Ho Kim, c2hraW1AdWdhLmVkdQ==