 Rebecca A. Dore
 Jaclyn M. Dynia
- Crane Center for Early Childhood Research and Policy, The Ohio State University, Columbus, OH, United States
Although the amount of time that preschoolers spend with screen media at home is continuing to increase, less is known about the types of media experiences children are having in preschool settings. Furthermore, little research has investigated the purposes for which preschool teachers use technology and media in the classroom and the contexts in which such use occurs. The current study addresses that gap by providing a nuanced picture of technology and media use in preschool classrooms. Lead teachers were recruited via email lists of educators who participated in previous studies or expressed interest in receiving communication from our research group. Participants (N = 312, 98.6% female; Mage = 43.9 years) all taught preschool-age children. Participants were first asked to check which of four devices they used with children in their classroom (tablet, smartphone, computer, television). If participants responded that they used each device, they were asked how often. Survey items also assessed (1) Purposes: how often teachers used each device for instructional purposes (e.g., teaching new material, practicing material) and non-instructional purposes (e.g., entertainment, as a reward), and (2) Context: how often teachers used devices for both teacher-supported and non-teacher-supported activities. Results indicated that tablet and computer use were most common, whereas smartphone and television use were less prevalent. Teachers reported most frequently using tablets, computers, and smartphones for instructional purposes. Television was most frequently used for entertainment. Tablets and smartphones were most frequently used in teacher-supported individual contexts, whereas computers were most frequently used in teacher-supported whole group contexts. Latent class analysis showed five classes of classroom technology and media use: tablet and computer users, tablet only users, low technology users, computer for teacher-supported instruction users, and television only users. Finally, we determined that these classes were predicted by program funding (publicly- or privately-funded), teacher experience, and teacher education.
Introduction
Substantial research has investigated teacher practices and the activities that occur in classrooms, including during the preschool years (e.g., Connor et al., 2006; see Hamre and Pianta, 2007, for a review). However, little research has explored the use of technology and media in preschool classrooms. Research conducted primarily in home settings shows that young children spend a substantial amount of time with technology and media. For instance, preschoolers in the United States, the United Kingdom, Australia, and Portugal spend over 2 h per day with screens (Magee et al., 2014; Office of Communications, 2017; Rideout, 2017; Rodrigues et al., 2020), and from 2013 to 2017, the time United States children spent using mobile devices tripled (Rideout, 2017). Similar data from China shows that over 40% of 3- to 6-year-olds have more than 2 h of screen time a day (Wu et al., 2017). In a study of Greek preschoolers, 95% of parents reported that their child used a mobile device daily or almost daily (Papadakis et al., 2019). A recent study showed that over the last two decades, technology and media use in United States home settings during early childhood increased by 32% (Goode et al., 2019). Notably, while the vast majority of the literature has focused solely on technology and media use in the home environment, less is known about either the prevalence or the nature (i.e., purposes and contexts) of technology and media use in preschool classrooms. Therefore, the present study examined teachers’ reported use of technology and media in preschool classrooms.
Technology and Media Use in Preschool Classrooms
The little empirical evidence available suggests that teachers are increasingly incorporating technology and media into the classroom. Vanderloo (2014) conducted a systematic review of eight international studies that reported daily screen-viewing in early childcare settings. Results showed relatively high levels of daily screen time, with studies of center-based childcare reporting rates of up to 1.3 h of screen time per day. However, this report may significantly underestimate current technology and media use, as many of the included studies focused solely on TV before the rise of mobile devices. A 2015 report found that over half of United States preschool teachers reported using tablets in class at least once a week (Northwestern University, 2015), and in a 2019 report, preschool teachers’ access to technology in the classroom was rising, such that, most had access to the internet (89%), computers (81%), and tablets in the classroom (71%; Pila et al., 2019). A 2016 study from New Zealand shows that over 60% of public kindergartens reported using tablets and computers in the classroom at least weekly (Gerritsen et al., 2016).
Potential Effects of Classroom Media Use
Understanding the prevalence and nature of classroom technology and media use is essential because these activities may detract from classroom instruction. Concerning home settings, researchers propose that time spent with media could be detrimental to children’s development because it displaces other enriching activities like shared reading and caregiver-child interaction. For example, Khan et al. (2017) found that in a United States representative sample of over 8000 4-year-olds, higher TV viewing was associated with less frequent parent-child book reading. Furthermore, both the quantity and quality of caregiver speech and caregiver-child engagement are lower during TV viewing as compared to free play or other activities (Nathanson and Rasmussen, 2011; Pempek et al., 2011). There is also some evidence for an association between preschoolers’ home media use and lower levels of school readiness (e.g., Clarke and Kurtz-Costes, 1997; Pagani et al., 2013). Among older children, using less than 2 h of recreational screen time per day was associated with higher global cognition scores (Walsh et al., 2018).
It is less clear how these dynamics may play out in the classroom setting. However, classroom activities are likely to be primarily educational and enriching, meaning that technology and media use in the classroom that is unrelated to high-quality instruction may be even more disruptive to development than home use. Technology and media may be provided as a fun or entertaining activity, including as a reward (Pila et al., 2019), potentially leading to reduced time for instruction. Furthermore, if instruction occurs via technology and media use, it may not be as high-quality as other types of instruction. For example, evidence suggests that many “educational” apps are not based on evidence on about how children learn best (Hirsh-Pasek et al., 2015), do not provide developmentally-appropriate guidance like scaffolded feedback (Callaghan and Reich, 2018), and rarely provide enough information for teachers to make informed choices prior to use (Dubé et al., unpublished). Even if technology and media use does not displace instruction, it may occur during center or free choice time, which could reduce social interactions with peers and teachers, potentially preventing opportunities for the development of social-emotional skills (Elliott and Gresham, 1993). Furthermore, some research suggests that certain types of media use are associated with lower executive function skills immediately after exposure (Lillard et al., 2015; Huber et al., 2018). Given that executive function is essential for skill development (Bierman et al., 2008), using these media in the classroom could disrupt opportunities for learning afterward.
Purposes and Contexts of Classroom Media Use
Despite reason to believe that technology and media use, in general, may be detrimental for children’s learning, technology and media may also be used in positive ways that could enhance learning. Notably, the existing data have primarily focused on access to devices and frequency of use rather than more nuanced pictures of how teachers are using technology and media. However, a position statement by the National Association for the Education of Young Children (NAEYC) purports that technology and media can be effective tools in the classroom when (1) they are used to support learning goals, rather than as an isolated activity, and (2) their use involves co-viewing and co-participation between adults and children (National Association for the Education of Young Children [NAEYC], 2012). In the current study, we directly examine these two aspects of technology and media.
First, we examined the purposes for which teachers use technology and media in the preschool classroom: the extent to which they are being used for instructional purposes and non-instructional purposes. Some existing research has explored the use of specific educational media content in the classroom. Studies have shown positive impacts of classroom technology and media interventions on literacy (Penuel et al., 2012), vocabulary (Dore et al., 2019), math (Schacter et al., 2016; McCarthy et al., 2018), computational thinking (Portelance et al., 2016), English language learning (Michael Cohen Group, 2013) and health and safety knowledge (Borzekowski and Henry, 2010) during preschool. Based on these and similar findings, experts have argued that educational media could be beneficial for learning in preschool settings (Pasnik et al., 2016) and have called for better models to understand its appropriate use (Daugherty et al., 2014). If teachers primarily use educational media and use technology in service of their curricular goals, it may supplement instruction and benefit students’ learning. Yet, it is unclear how much teachers currently use technology and media for instructional purposes in the absence of researcher-driven interventions.
Second, we examined the context in which classroom technology and media use occurred: the extent to which it occurs in teacher-supported contexts and non-teacher-supported contexts. Studies outside of the classroom have found that adult facilitation, also called joint media engagement, can support children’s comprehension and learning from media (Stevens and Penuel, 2010; Takeuchi and Stevens, 2011; see Dore and Zimmermann, 2020, for a review). For example, Strouse et al. (2013) trained one group of parents to pause an educational video while watching with their child, ask questions, and encourage their child to retell parts of the story. Other parents in the study were asked to watch the video with their child as usual. Results showed that when parents interacted with their child, children understood the story better and learned more words. Thus, if teachers often use technology and media in teacher-supported contexts, such use may benefit students’ learning by providing new vocabulary and new topics for discussion (Lavigne et al., 2015). Indeed, researchers have argued that it is how teachers implement classroom technology that influences its effectiveness (Couse and Chen, 2010). However, as with instructional purposes, little is known about the extent to which teachers use technology and media in the context of teacher-supported instruction as opposed to providing technology and media for children to use independently.
Predictors of Classroom Technology and Media Use
Beyond describing the prevalence and nature of classroom technology and media use, it is essential to examine the characteristics of the teacher, classroom, and program that may be related to the use of technology and media. This information will be valuable in understanding whether programs or teachers with specific characteristics should be targeted for future interventions aiming to influence classroom technology and media use. Indeed, existing evidence suggests that technology and media use may vary based on the characteristics of the teacher, classroom, and program. Vanderloo (2014) found that higher levels of teacher education were associated with lower screen time in early childcare settings, whereas Blackwell et al. (2014) found that teacher experience was related to more negative attitudes toward classroom technology use and lower levels of use. Christakis et al. (2006) also found that program schedule (i.e., offering extended hours) and being in a low-SES neighborhood were associated with higher TV viewing. Similarly, Blackwell et al. (2014) found that teachers who taught lower SES students had more favorable attitudes toward and higher levels of classroom technology use. More recently, Pila et al. (2019) found that in a 2018 survey, non-Head-Start center-based programs had greater access to technology than Head Start programs but not significantly more use of these devices. These data suggest that teacher, classroom, and program characteristics may influence the technology and media use that children experience in the preschool setting. However, as with the rest of the literature in this area, these studies have focused primarily on the frequency of use rather than on how media and technology is being used across different teachers and programs.
The Current Study
In sum, technology and media use is increasingly prevalent during the early childhood years, yet little is known about its use in preschool classrooms, The current study is unique in that it goes beyond prevalence to examine the purposes and contexts of preschool classroom technology and media use, as well as the extent to which the characteristics of teachers, classrooms, and programs may be related to technology and media use. Most prior studies have focused solely on prevalence without examining the extent to which teachers use technology and media for instructional purposes and in teacher-supported contexts. It is vital to fill this gap because technology and media use may be either detrimental or beneficial to children’s learning, depending on how it is used. Furthermore, many prior studies are from 2015 and earlier, whereas the availability and accessibility of technology has changed drastically in the last 5 years, potentially increasing technology and media use in preschool classrooms and leading to shifts in the characteristics of teachers, classrooms, and programs that may predict use. Thus, the current study addresses three exploratory aims: (1) Establish the frequency, purposes (instructional or non-instructional), and contexts (teacher-supported or not teacher-supported) for which preschool teachers report using technology and media. (2) Identify whether and to what extent preschool teachers’ classroom technology and media use can be represented by distinct classes, and (3) Examine demographic and classroom predictors of teachers’ technology and media use.
Materials and Methods
Recruitment
To recruit participants for this study, we drew upon databases of educators who participated in previous studies on the effects of preschool experiences on children’s development and a database of educators who previously expressed interest in receiving communication from our research group. Although the latter database could include national and international educators, in practice, the majority were likely from Ohio, based on the groups of educators who are likely to be familiar with our research group. In total, the survey was sent to 1,835 individuals via a Qualtrics link. Individuals identified in our data as lead preschool classroom teachers were asked to take the survey, and individuals identified as administrators and program coordinators were asked to send the survey to the lead teachers they work with. The role of current lead teacher was confirmed at study enrollment. Participating teachers had the opportunity to enter into a lottery to receive 1 of 125 Amazon gift cards worth $20 for completing the survey.
Participants
A total of 317 early childhood lead teachers participated and were included in these analyses. An additional 125 individuals started the survey but were not eligible to participate because they reported that they were not lead teachers, and an additional twenty teachers began the survey but did not complete all technology survey items (see below), so they were excluded from the final sample. Furthermore, an additional seven teachers reported teaching only children under three or over five and were excluded as they did not teach preschool-age children. The majority of teachers in our final sample were female (98.6%) and White, non-Hispanic/Latino (83.9%, n = 266). Teachers were an average of about 44-years-old (SD = 10.89 years, Range = 24 to 78 years). Most of the teachers had obtained a bachelor’s degree (37.8%, n = 120), whereas one teacher did not have a high school diploma (0.3%), four teachers had obtained a high school diploma (1.3%), 13 had completed some college (4.1%), 29 had obtained an associate’s degree (9.1%), 97 had obtained a master’s degree (30.6%), and five had obtained a doctoral degree (1.6%); 48 unreported (15.1%). Teachers reported having an average of 12.83 years of experience as a lead teacher (SD = 8.96 years, Range = 1 to 39 years). Teachers represented the geographic diversity of the state: 33% urban, 38% suburban, and 29% rural.
Procedure
Teachers were sent the original email invitation to participate in the survey via a Qualtrics link in January 2020. Teachers that did not respond were sent weekly email reminders for up to 3 weeks.
Measures
Technology and Media Use
We used researcher-created items to assess teachers’ technology and media use. Teachers were first asked to check which of the four devices (tablet, smartphone, computer, and television) they used with children in their classroom or if they did not use any of these devices. If they reported using a specific device, they were then asked how often they used that device in the classroom for instructional or entertainment purposes. This wording was used to clarify that teachers should exclude device use solely for documentation or other classroom management tasks (e.g., taking attendance, reporting results of child assessments). Five response options were given: Never, Less than once a week, About once a week, 2 to 3 times a week, and Every day. For devices that they reported using, teachers were also asked about the purposes for which and contexts in which they used the device (see Tables 1, 2). These included two instructional purposes (teaching new material and practicing or reviewing already learned material) and four non-instructional purposes (for entertainment, to occupy a child/children during center time or while working with another small group, to occupy a child/children during a transition, and as a reward), resulting in six items for each device. Contexts included four group sizes (whole group, small group, pair, and individual) that were each asked about in both teacher-supported contexts (e.g., “How often do you use tablets for teacher-supported whole group instruction?”) and non-teacher-supported contexts (e.g., “How often do you use tablets for whole class use without teacher support?”), resulting in eight items for each device. Context items were not asked for television as we expected television would be used only in whole group settings, and it was unclear how respondents would define teacher-supported vs. non-teacher-supported television use. Response options were the same as for overall frequency, from Never to Every day.
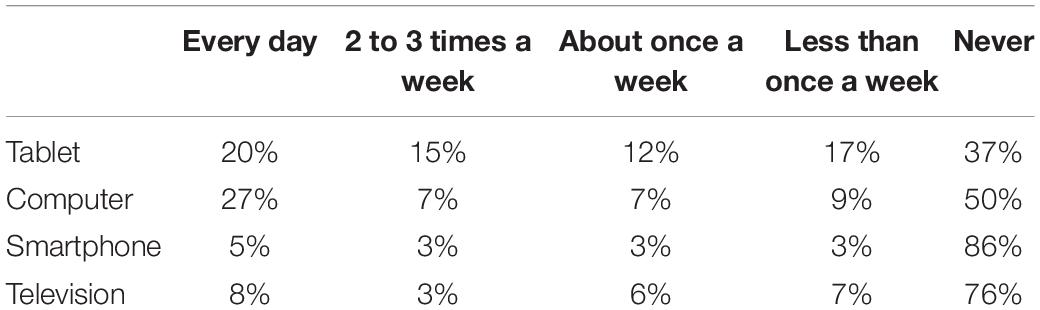
Table 1. Frequencies of teachers’ reported technology and media use.
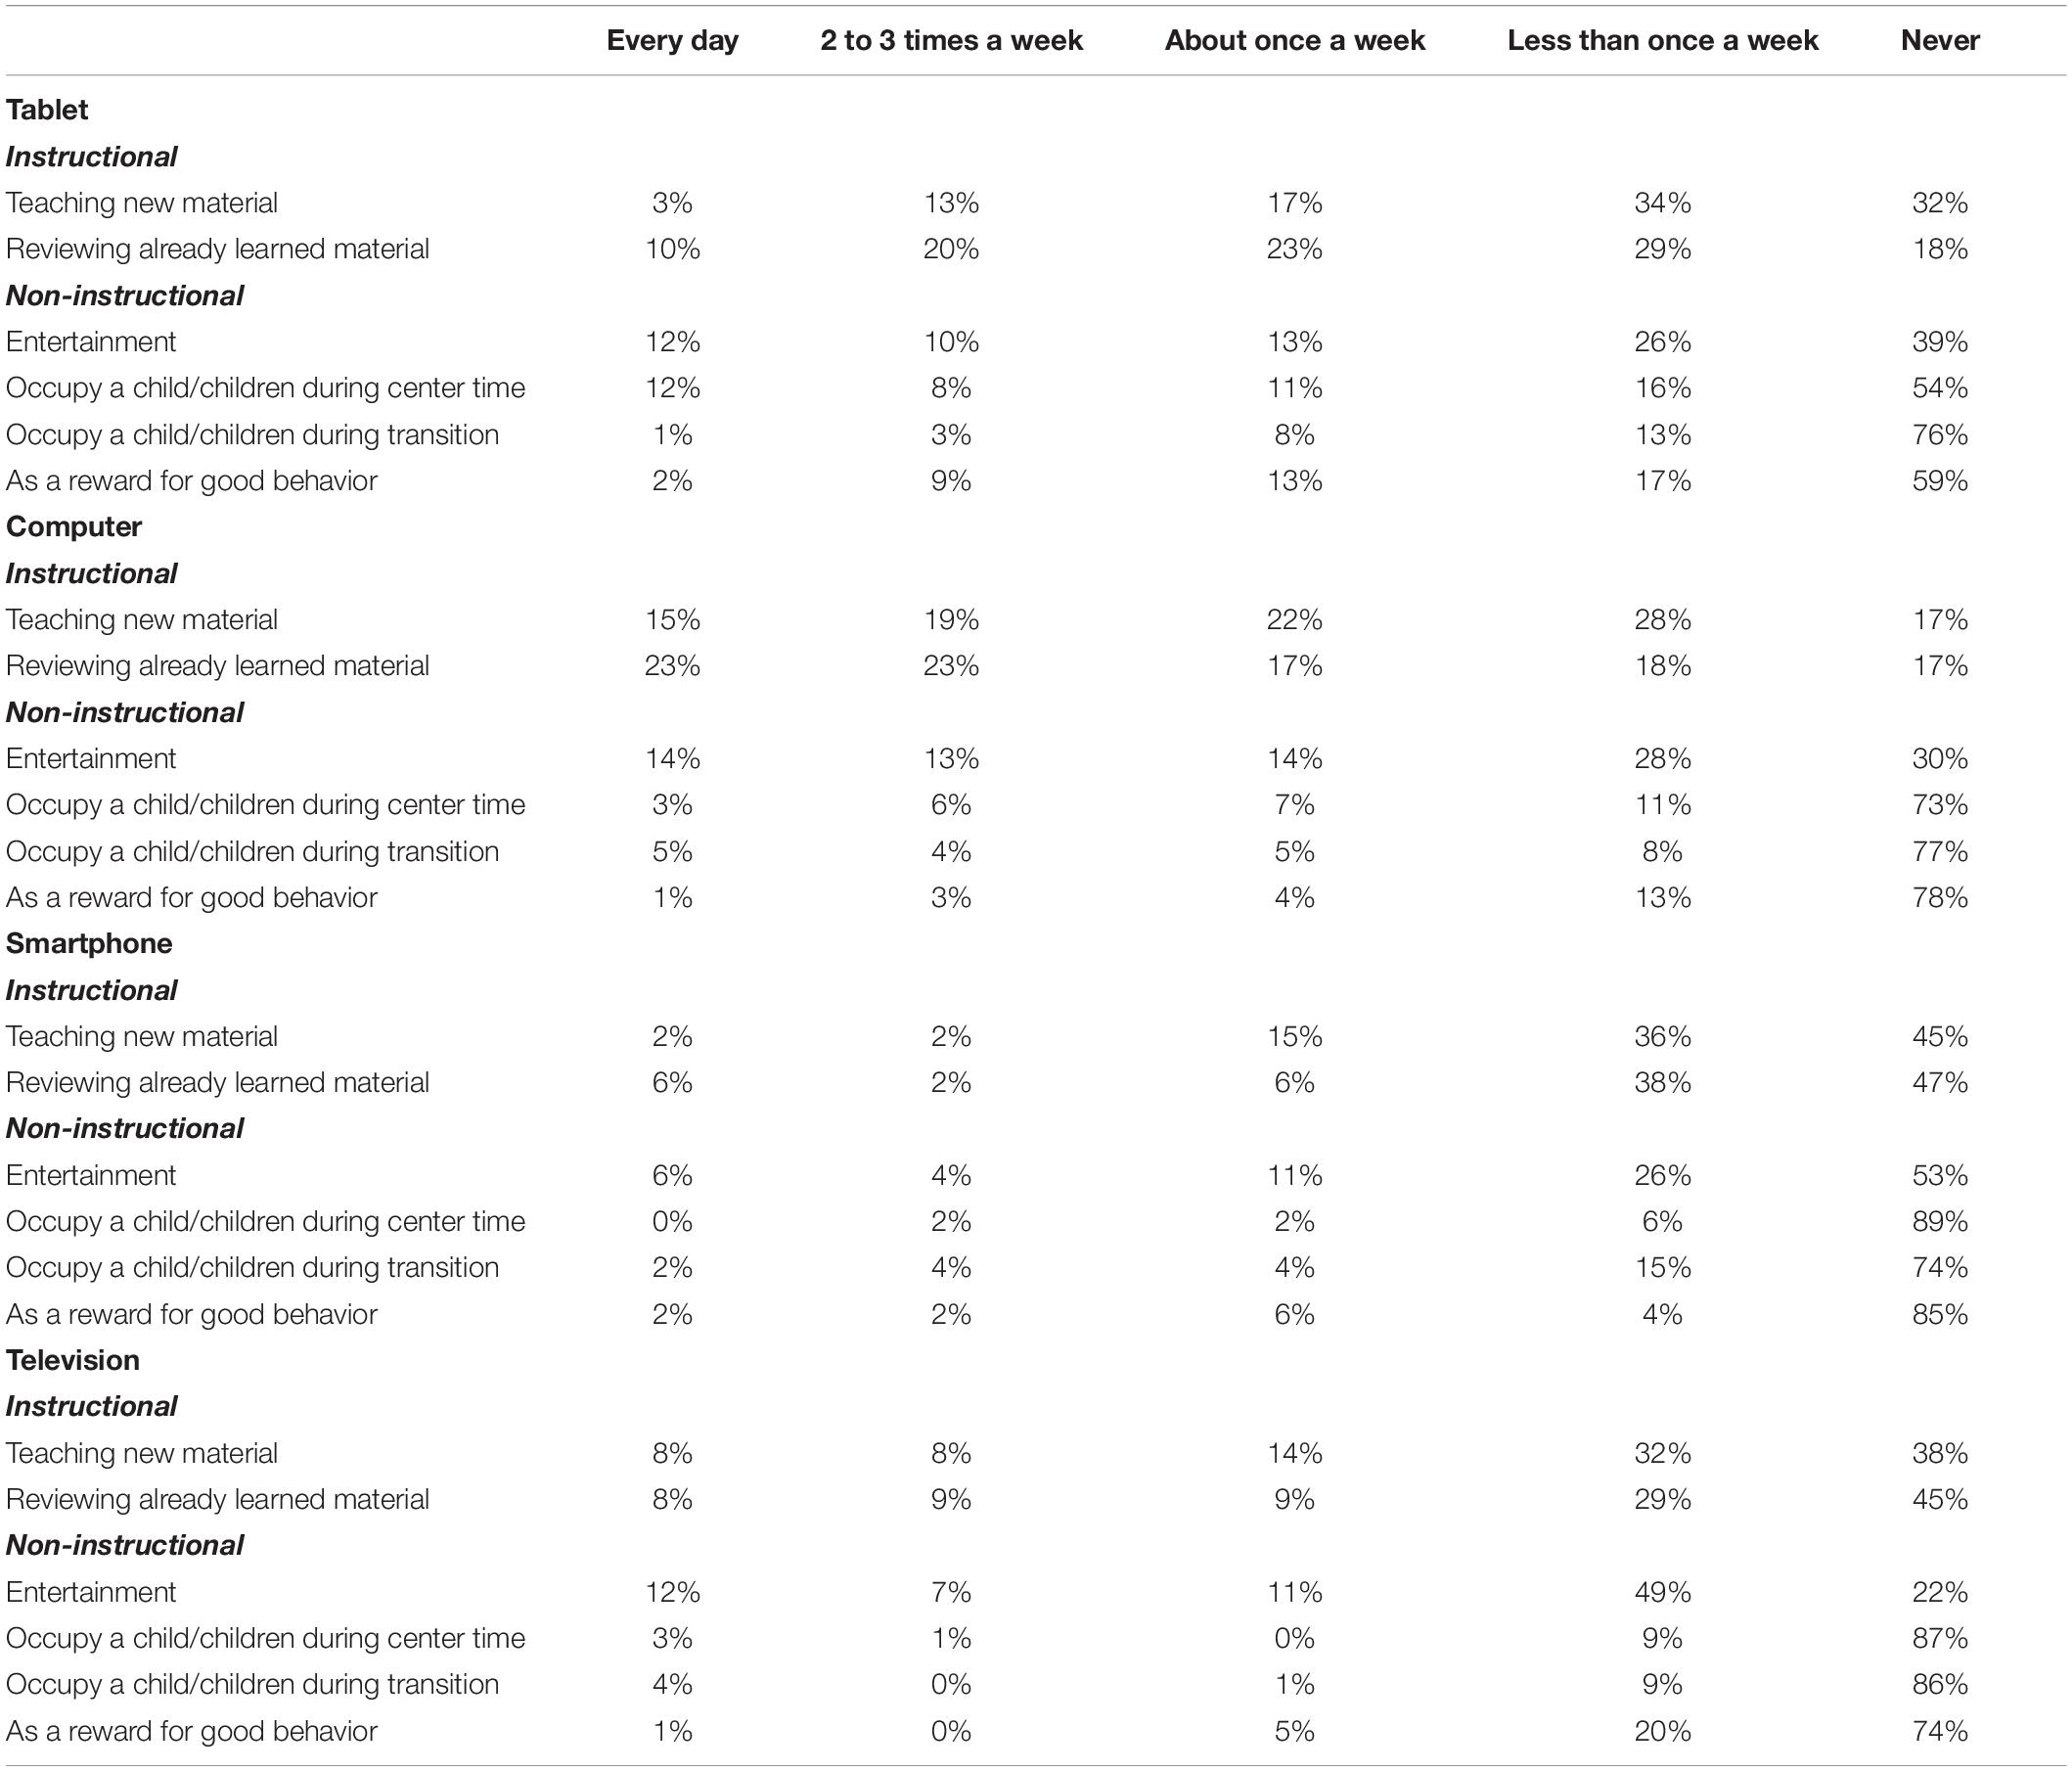
Table 2. Frequencies for purposes of teachers’ reported technology and media use.
Teacher and Program Characteristics
Several questions were included to obtain information about teacher and program characteristics that might be related to classroom technology and media use. Teachers were asked to report their highest level of education, how many years they had spent working as a lead or senior teacher, their age, whether their program was state-funded, whether their program was located in an urban, suburban, or rural setting, whether children in their classroom were in a half-day or full-day program, and how many days a week children in their classroom attended. Education was from 0 to 9 where 0 is Eighth grade or less, and 9 is a Doctoral degree. For experience, teachers entered the number of years they had been a lead teacher. For teachers’ age, teachers entered their birthdate, and their age was calculated automatically. For state-funding, teachers checked whether either of the classifications “State-funded Prekindergarten program (Targeted enrollment)” or “State-funded Prekindergarten program (Universal enrollment)” described their current program. For setting, teachers chose between urban, suburban, and rural. For half-day/full-day and days per week, we created a combined variable that accounted for children’s time in the classroom by coding half-day as 1 and full-day as 2 and multiplying by days per week, such that the variable ranged from 3 (3 half-days per week) to 10 (5 full days per week).
Results
Frequency
See Table 1 for frequencies of teachers’ reported technology and media use. Twenty percent of teachers reported using tablets daily with students in their classroom, 15% reported using tablets 2 to 3 times a week, 12% reported using tablets about once a week, 17% reported using tablets less than once a week, and 37% reported never using tablets with children in their classroom. (Note that numbers do not sum to 100 due to rounding.) For computers, 27% of teachers reported daily use, 7% reported 2 to 3 times a week, 7% reported about once a week, 9% reported less than once a week, and 50% reported never using computers with children in their classroom. Smartphones were used less frequently, with 5% reporting daily smartphone use, 3% using smartphones 2 to 3 times a week, 3% about once a week, 3% less than once a week, and 86% of teachers reporting never using smartphones with children in their classrooms. Television use was almost as infrequent, with 8% of teachers reporting television use daily, 3% reporting use 2 to 3 times a week, 6% reporting about once a week, 7% less than once a week, and 76% reporting never using television with children in their classrooms.
In subsequent sections, we only describe the purposes and contexts of media use for teachers who reported using each device in their classroom. For example, the 37% of teachers who reported never using tablets are not represented in the purpose and context data for tablets.
Purposes
See Table 2 for frequencies for all purposes for all devices. Of teachers who reported using tablets and computers in the classroom, practicing or reviewing already learned material was the most common purpose (53% reported at least once a week for tablet and 63% reported at least once a week for computer) with teaching new material also prevalent (33% at least once a week for tablet and 56% at least once a week for computer). Tablet and computer use for non-instructional purposes was less prevalently reported, but each of the non-instructional purposes was reported at least sometimes by between 22 and 70% of teachers who used tablets or computers, with entertainment the most common (61% at least sometimes for tablets and 70% at least sometimes for computers).
Of teachers who reported using smartphones in the classrooms, 55% used them to teach new material at least sometimes, and 53% used them to practice already learned material at least sometimes. Forty-seven percent of teachers reported using smartphones for entertainment at least sometimes, whereas teachers reported using smartphones for other non-instructional uses between 11–26% at least sometimes. For teachers that reported using TV in the classroom, 78% of teachers reported using TV at least sometimes for entertainment. Thirteen to 26% of teachers reported using TV for other non-instructional purposes at least sometimes. Sixty-two percent of teachers reported using TV to teach new material and 55% reported using TV to practice already learned material.
Contexts
See Table 3 for frequencies for all contexts for all devices. Among teachers who used tablets and smartphones in the classroom, teacher-supported individual instruction was most prevalent (80% at least sometimes for tablets and 66% at least sometimes for smartphones). Other types of teacher-supported contexts were also relatively prevalent, with between 58 and 78% of teachers who use tablets reporting using devices in teacher-supported pair, small group, or whole group contexts at least sometimes and between 38 and 51% of teachers who use smartphones reporting using them in these contexts at least sometimes. For non-teacher-supported contexts, individual use was again the most prevalent, with 65% of teachers who use tablets reporting using devices for non-teacher-supported individual use at least sometimes. Other non-teacher-supported contexts were relatively less prevalent, with 35 to 41% reporting using tablets in non-teacher-supported pair, small group, or whole group contexts at least sometimes. For smartphones, all non-teacher-supported contexts were less prevalent, with between 13 and 15% of teachers who use smartphones using them in non-teacher-supported contexts at least sometimes.
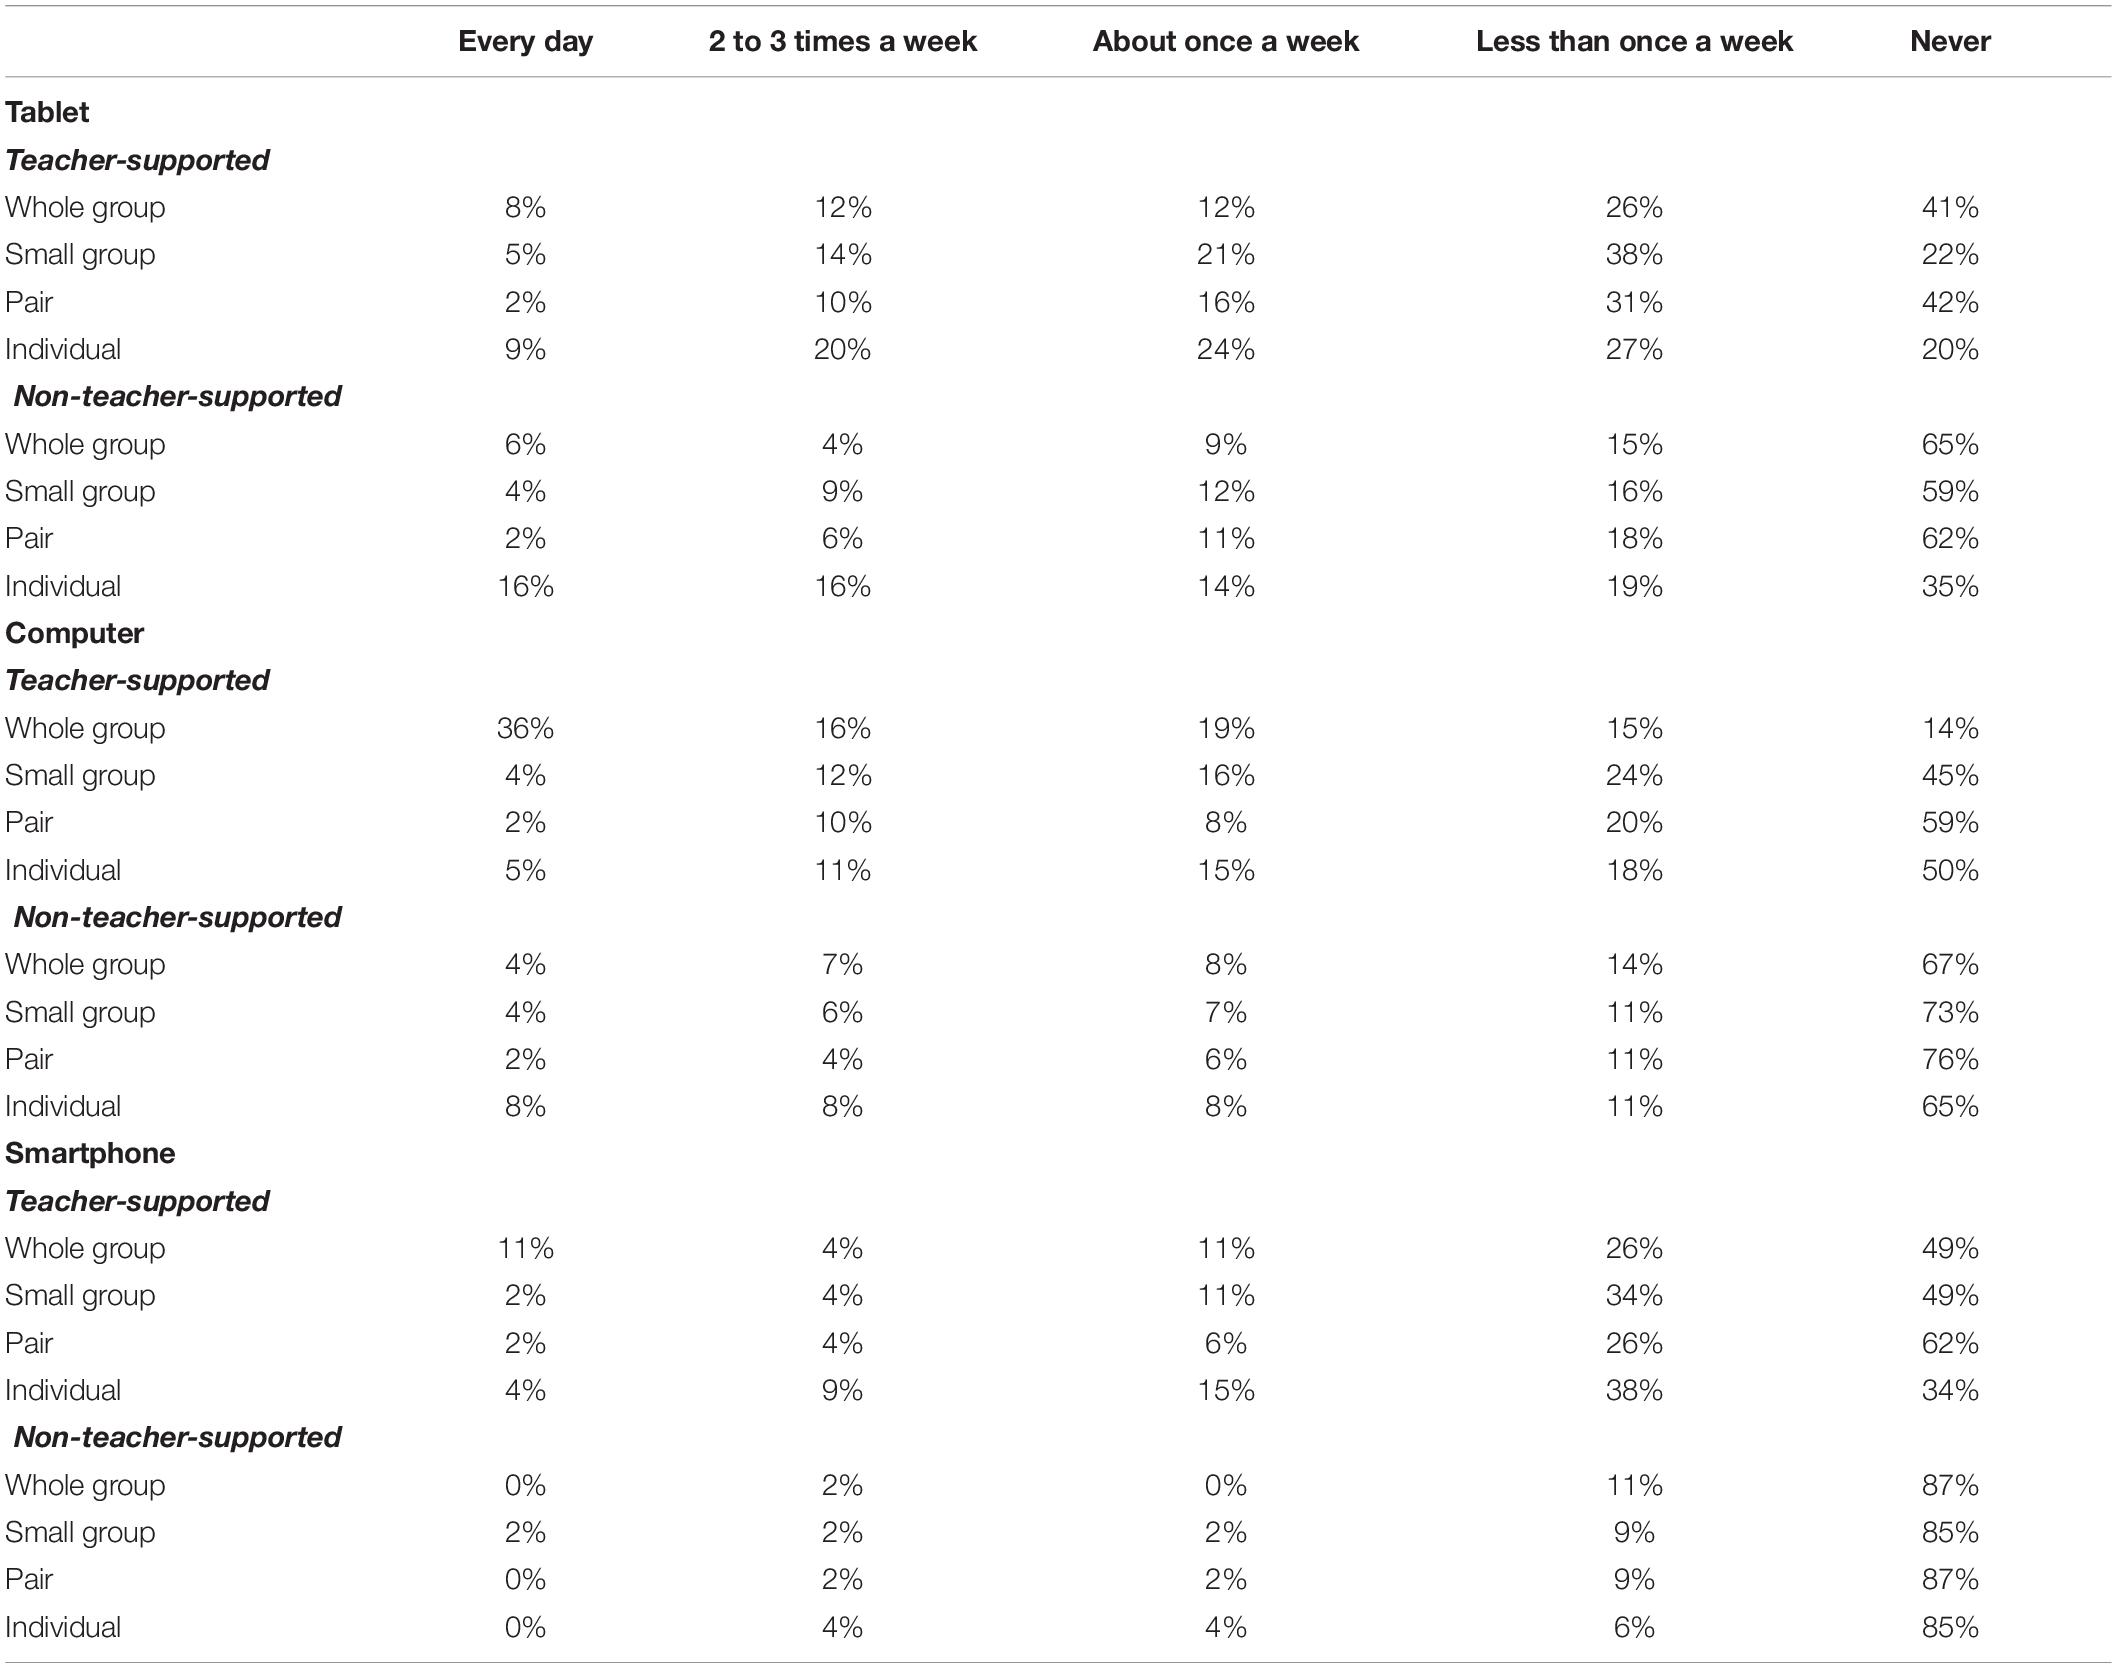
Table 3. Frequencies for contexts of teachers’ reported technology and media use.
Computers were used more frequently for teacher-supported whole group instruction (86% at least sometimes). Using computers in teacher-supported individual, pair, or small group contexts was relatively less prevalent (41 to 55% at least sometimes). Non-teacher-supported computer use was infrequently reported (24 to 35% at least sometimes).
Latent Class Analysis
For Aim 2, we completed latent class analyses (LCA) in Mplus 8 (Muthén and Muthén, 2008). Before completing the LCA, we completed data transformations for each of our variables by dichotomizing each item. For device use, responses were transformed to a score of 1 if the teachers reported ever using that device in their classrooms. If teachers reported never using the device, the response was transformed to 0.
For the purposes for which teachers reported using devices, we aggregated across all devices to create two dichotomous scores for instructional purposes and non-instructional purposes. For instructional purposes, teachers received a score of 1 if they reported ever using any device for either of the two instructional purposes (see Table 2); teachers received a score of 0 if they never reported using any device for either of the two instructional purposes. Similarly, for non-instructional purposes, teachers received a score of 1 if they reported ever using any device for any of the four non-instructional purposes (see Table 2); teachers received a score of 0 if they never reported using any device for any of the four non-instructional purposes.
Finally, a similar dichotomizing was conducted for context, aggregating across all devices to create two dichotomous scores for teacher-supported use and non-teacher-supported use. For teacher-supported use, teachers received a score of 1 if they reported ever using any device in any of the four teacher-supported contexts; teachers received a score of 0 if they never reported using any device in any of the four teacher-supported contexts (see Table 3). Similarly, for non-teacher-supported use, teachers received a score of 1 if they reported ever using any device in any of the four non-teacher-supported contexts (see Table 3); teachers received a score of 0 if they never reported using any device in any of the four non-teacher-supported contexts.
We completed LCAs for three to seven classes to find the model that best characterized class membership. The following fit criteria were used to determine the best fitting model: LogLikelihood, Bayesian Information Criteria (BIC), Akaike Information Criteria (AIC), Vuong-Lo-Mendell-Rubin (VLMR) Likelihood Ratio Test, Lo-Mendell-Rubin (LMR) Likelihood Ratio Test, Bootstrapped Likelihood Ratio Test (BLRT), entropy, the presence of a reasonable number of children assigned to each class (Nylund-Gibson and Choi, 2018), and theoretical interpretability. For BIC and AIC, lower values indicate better fit (Kline, 2011). When VLMR, LMR, and BLRT have significant p-values, the K number of classes is a better fitting model than the K-1 number of classes (Nylund et al., 2007). Entropy indicates how well individuals were assigned to a class, and values closer to 1 mean better assignment (Clark and Muthén, 2009). There should be enough respondents in each class to examine associations between classes and other variables (Jung and Wickrama, 2008), and the final model should be theoretically interpretable.
The model that was the best fit for the data based on the fit indices and theoretical interpretability was the five-class model (see Table 4 for fit indices for each of the models.) The five-class solution had relatively low BIC and AIC values compared to the other models. VLMR, LMR, and BLRT values were significant for the five-class solution (ps < 0.03), but not the 6-class solution. Entropy was high (0.862). Finally, the five-class solution had a sufficient sample size in each class and was theoretically interpretable. The five classes were: tablet and computer users (n = 115, 36.3%), tablet only users (n = 98, 30.9%), low technology users (n = 48, 15.1%), computer for teacher-supported instruction users (n = 42, 13.2%), and TV only users (n = 14, 4.4%). (see Figure 1 and Table 5).
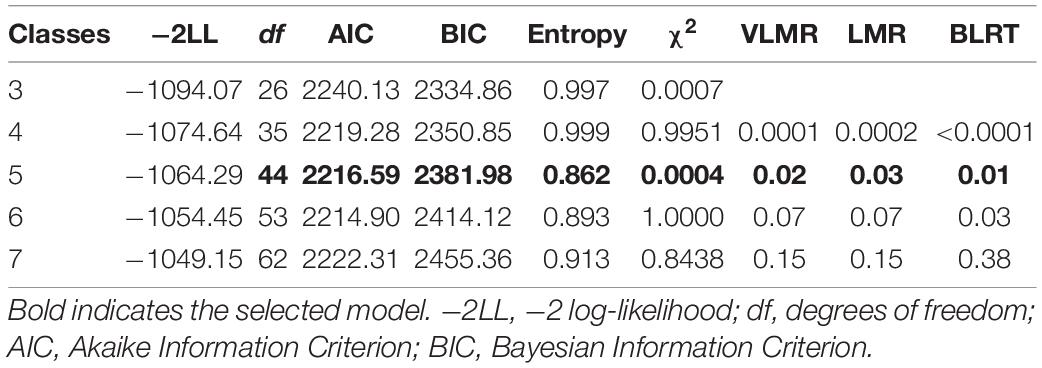
Table 4. Model fit indices for LCA.
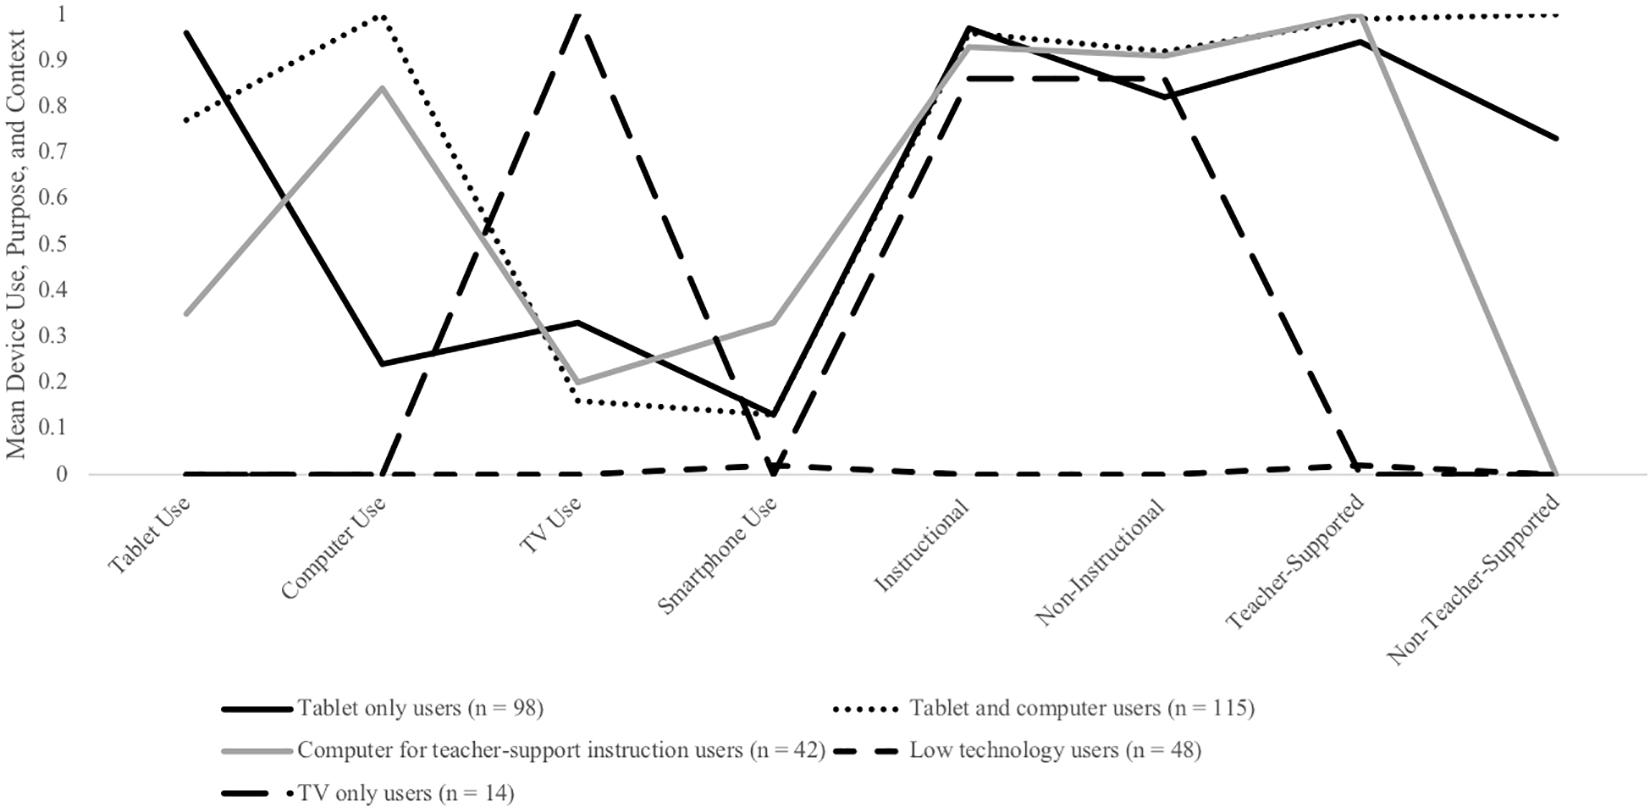
Figure 1. Mean device use, purpose, and context for the five classes identified by LCA.
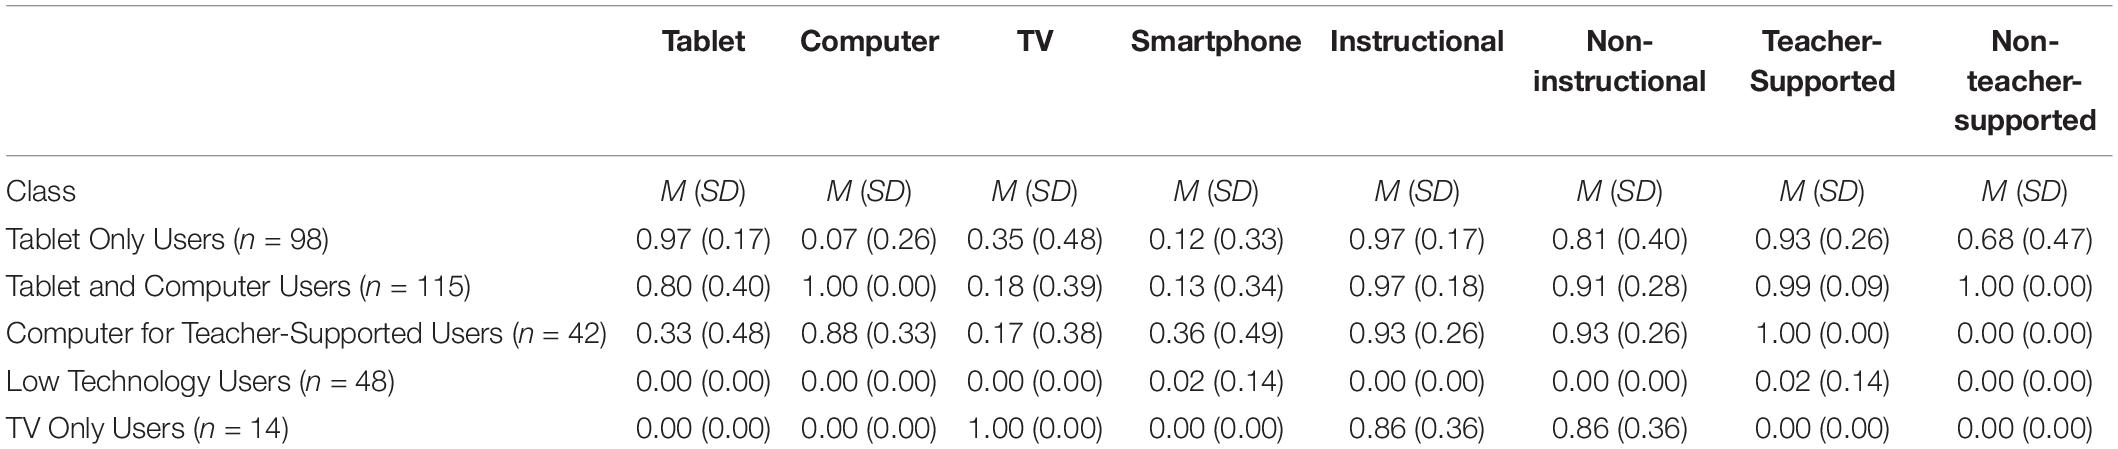
Table 5. Descriptive statistics for device use, context, and purpose by class.
After selecting the five-class model, we examined the differences in the means for each of the eight variables (tablet use, computer use, smartphone use, television use, instructional purposes, non-instructional purposes, teacher-supported contexts, and non-teacher-supported contexts) using one-way ANOVAs. There were several statistically significant differences between classes’ means for device use, context, and purpose. For tablet use, tablet only users were significantly more likely to use tablets than teachers in all other groups (ps < 0.001). Similarly, tablet and computer users were significantly more likely to use tablets than the other three groups (ps < 0.001). Furthermore, computer for teacher-supported instruction users were significantly more likely to use tablets than both low technology users or TV only users (ps < 0.012), which did not differ significantly from each other (ps = 0.593).
For computer use, tablet and computer users were significantly more likely to use computers than teachers in all other groups (ps < 0.001). Computer for teacher-supported instruction users were significantly more likely to use computers than the other three groups (ps < 0.001). Tablet only users, TV only users, and low technology users did not differ from each other (ps > 0.058).
For smartphone use, computer for teacher-supported instruction users were significantly more likely to use smartphones than teachers in all other groups (ps < 0.008). Additionally, tablet and computer users and tablet only users were significantly more likely to use smartphones than low technology users (ps < 0.043). There were not significant differences between the remaining classes (ps > 0.153).
For TV use, TV only users were significantly more likely to use a TV in their classrooms than teachers in all other groups (ps < 0.001). Additionally, tablet only users were significantly more likely to use TV than the other three groups (ps < 0.032). TV use in the tablet and computer user and computer for teacher-supported instruction user classes did not significantly differ from each other in TV use (ps = 0.819), but teachers in both classes were significantly more likely to use TV than those in the low technology users class (ps < 0.003).
For instructional purposes, low technology users were significantly less likely to use devices for instructional purposes in comparison to the other four classes (ps < 0.001). There were not significant differences between the other four classes (ps > 0.058). Similarly, low technology users were significantly less likely to use devices for non-instructional purposes in comparison to the other four classes (ps < 0.001). Tablet and computer users were more likely to report non-instructional purposes than tablet only users (p = 0.023), but there were not significant differences between the remaining classes (ps > 0.069).
For teacher-supported, low technology users and TV only users were less likely to use devices in teacher-supported contexts in comparison to the other three classes (ps < 0.001). Tablet and computer users were more likely to use devices in teacher-supported contexts than tablet only users (p = 0.016); there were no significant differences between the remaining classes (ps > 0.077). For non-teacher-supported, tablet and computer users were significantly more likely to use devices in non-teacher-supported contexts than all other classes (ps < 0.001). Tablet users were significantly more likely to use devices in non-teacher-supported contexts than the remaining three classes (ps < 0.001); the means for the other three classes were all 0.
Predictors of Classes
For Aim 3, we used logistic regression to predict class membership from six teacher and program characteristics: teacher education, teacher experience, teachers’ age, program funding, program setting, and student classroom time. We first included the six predictors in separate models to examine whether they were related to class membership independently. Teacher age, program setting, and student classroom time did not significantly predict class membership. The remaining three predictors were then included in a single logistic regression model to predict class membership. (see Table 6). Compared to teachers in centers with private funding, teachers in centers with publicly-funded childcare were more likely to be tablet and computer users than to be in any of the other classes: thirteen times more likely than to be television only users (OR = 13.33, p = 0.016), more than three times as likely than to be low technology users (OR = 3.49, p = 0.003), and almost three times more likely than to be tablet users (OR = 2.93, p = 0.001) or computer for teacher-support instruction users (OR = 2.82, p = 0.013). Having more teaching experience was related to being more likely to be a low technology user than a tablet user (OR = 1.05, p = 0.045), such that each additional year increased the likelihood of being in this class by 5%. Finally, teachers with more education were more likely to be tablet and computer users than low technology users (OR = 1.39, p = 0.024).
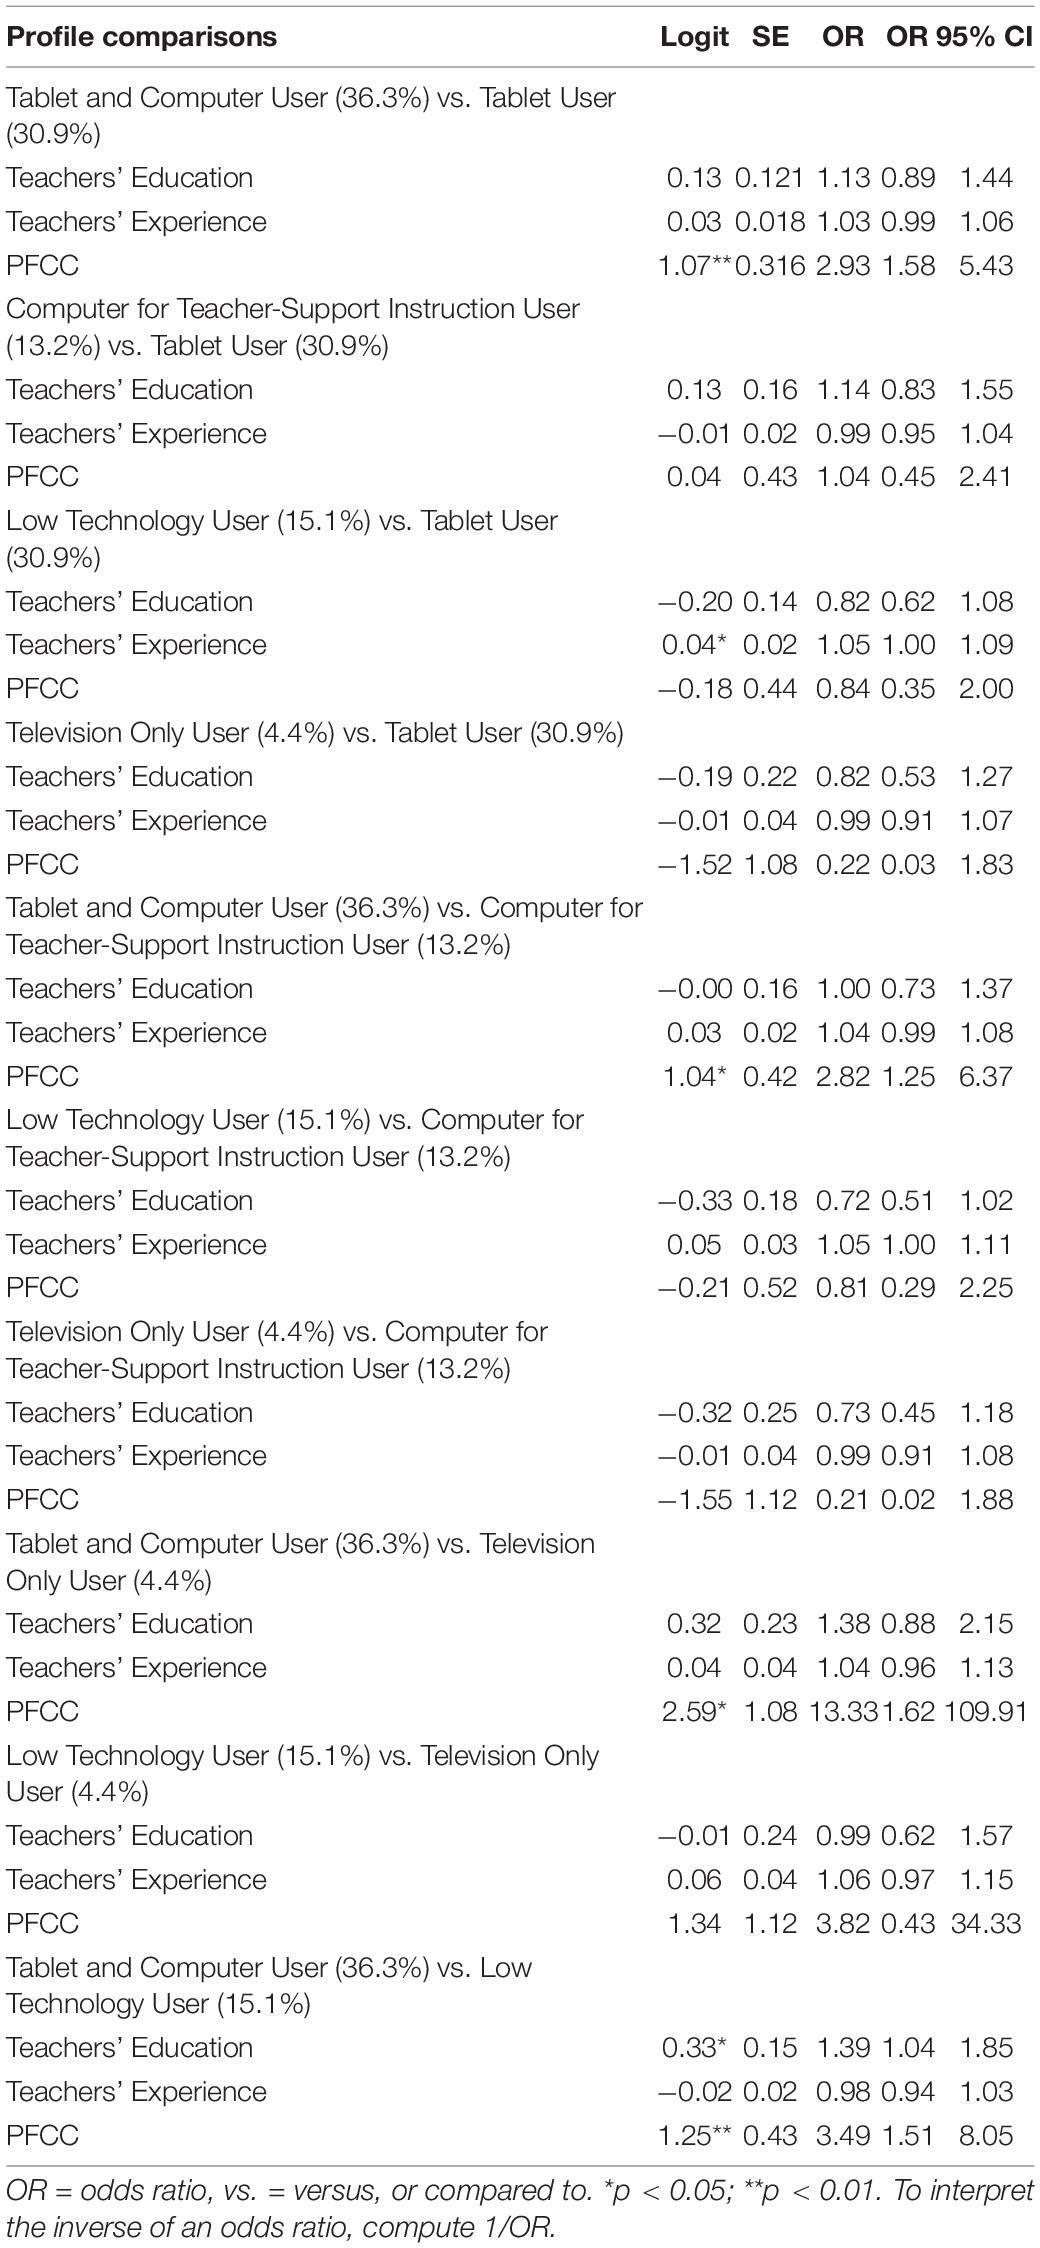
Table 6. Multinomial logistic regression analyses for teacher and program characteristics predicting membership into one of the five latent classes.
Discussion
The goals of this study were to describe the prevalence and nature (i.e., purposes and contexts) of preschool teachers’ classroom technology and media use, to examine whether distinct classes can represent such use, and to identify predictors of use. Overall, our findings suggest that technology use is prevalent in preschool settings and that most teachers are using devices in multiple contexts and for diverse purposes. Furthermore, we found that distinct classes can be identified based on both frequency of different device use and purposes of use. Finally, we determined that these classes were predicted by both program and teacher characteristics. Below we discuss our specific findings and their implications for research and practice.
In line with prior research (Pila et al., 2019), tablet and computer use were prevalent among the teachers in our sample: almost two in three teachers reported using tablets with children in their classrooms at least sometimes and one in five reported using them every day, whereas half of the teachers reported at least sometimes using computers with students in their classrooms and over a quarter reported daily computer use. Both smartphone and television use were less prevalent, but still, more than one in ten teachers reported using smartphones at least weekly, and almost one in five reported using television at least weekly. Television may be less common because it may be seen as less educational than more interactive forms of media and because many of the functions of television can now be accomplished on other devices (i.e., watching shows or movies on a computer or tablet via streaming services). Importantly, there was wide variability across respondents, such that for each device, a substantial portion of teachers reported daily use (>8%), and a substantial portion never used the device (>37%).
These prevalence data have several important implications. First, they suggest that reports of young children’s technology and media use may be substantially underestimating how much children are exposed to these devices if they rely on parent-report and do not consider use in the preschool setting. Thus, even recent suggestions of increases in use (e.g., Rideout, 2017; Goode et al., 2019) may need to be revised upwards to take into account both home and school use. Second, the prevalence of and variability within technology and media use in these data suggest that such use may have meaningful impacts on classroom practices and high-quality instruction. Such effects may not be universally negative: in one recent study (Dore et al., 2020), there was a negative quadratic relation between first graders’ home media use and language gains, such that a moderate amount of media use was related to larger language gains than low use, whereas high use was related to smaller gains. These results may reflect a too-much-of-a-good-thing effect (Pierce and Aguinis, 2013), such that a moderate level of media use may benefit language development because it introduces children to new vocabulary and ideas (Lavigne et al., 2015). In contrast, a high level may displace other language-enhancing activities in the home environment, thus leading to lower language development. A similar effect may be present in the classroom setting, such that moderate amounts of media use can be used to a positive effect, but more extreme amounts may be disruptive to learning. Linking classroom technology and media use to children’s learning outcomes will be an important direction for future research.
The current study went beyond prior reports by investigating both the purposes for which and contexts in which teachers reported using technology and media. That the more frequently used devices (tablets and computers) were most often used for instructional purposes is somewhat promising, suggesting that teachers are aiming to incorporate technology and media use into their curricular objectives, as suggested by the NAEYC policy statement (2012). However, given the wide range of quality present among educational apps (e.g., Callaghan and Reich, 2018; Meyer et al., unpublished), it is not clear that even technology and media use that is intended to be instructional is effective for promoting learning. Several rubrics have been created to help educators make decisions about which apps are likely to be effective (e.g., Papadakis et al., 2020), but none are yet in wide-use. Recently, Android’s Google Play has added a “Teacher Approved” section to its store, which includes only apps that have been rated as high-quality by a panel of teachers on a framework created by researchers and education experts (Perez, 2020). These developments represent positive movements toward a more critical examination of educational apps. However, limited evidence exists as to whether their inclusion in preschool classrooms is likely to be beneficial for learning or, conversely, is likely to replace high-quality instruction or valuable teacher and peer interactions that would otherwise be taking place. Smartphones and televisions were used relatively frequently for instructional purposes but were also used commonly for entertainment. This distinction may reflect differences in how teachers view the affordances of these devices or differences in the characteristics of teachers who use these devices, as discussed later concerning findings from our latent class analysis.
The stark differences in the contexts in which different devices were used likely reflects the affordances of each device. For example, it is not surprising that tablets and smartphones were used most often by individual children, as these devices are designed to be used by an individual, and the posture that children assume when using such devices is likely to make it challenging to share the device with others (Hiniker et al., 2018). Furthermore, most apps that children are likely to use on these devices are not designed to be used by multiple users simultaneously. For example, Vaala et al. (2015) analyzed almost 200 top literacy apps for young children and found that only two of them included design features that would facilitate co-use. However, using tablets and smartphones with pairs, small groups, and the whole group were still relatively common, suggesting an opportunity for future studies to examine how teachers use these devices in contexts with multiple children. Non-teacher-supported contexts were relatively uncommon, except for individual tablet use. Non-teacher-supported smartphone use may be uncommon in part because smartphones are likely to be teachers’ personal devices rather than classroom devices. In contrast to tablets and smartphones, the finding that computers were most likely to be used with the whole class may reflect teachers’ use of these devices to project materials onto a smartboard for the class to use together. Notably, teachers reported high levels of teacher-supported whole class computer use and lower levels of non-teacher-supported whole class use, suggesting that most teachers are using computers as part of their classroom instruction and not as often using a computer to project a video for children to consume independently.
Our results also showed that distinct classes could be established based on teachers’ technology and media use. In line with our data on the overall frequency of device use, over half of the teachers were characterized as either tablet and computer users or tablet only users. This further highlights the prevalence of these devices in preschool classrooms, and the low use of smartphones and television among these groups suggests that rather than teachers falling into categories based solely on high and low technology and media use, teachers differ in the devices that they use in the classroom. The TV only user class, although making up a small percentage of the sample, had very low use of other devices. Similarly, the low technology user class was made up of a relatively small portion of teachers who were unlikely to use any of the devices in their classrooms.
The computer for teacher-supported instruction class was the only class characterized by how teachers reported using technology and media in the classroom rather than simply by the devices used. These teachers made up a relatively small portion of the sample, and their primary distinguishing features were more prevalent computer use than any other device and the stark distinction between a high level of teacher-supported use and a very low level of non-teacher-supported use. This aligns with the finding that computers were unlikely to be used in non-teacher-supported contexts, but notably, these teachers reported moderate use of other devices but were also unlikely to use them in non-teacher-supported contexts. Interestingly, these teachers, like all classes except for the low technology use group, reported high levels of both instructional and non-instructional purposes. This finding may reflect the fact that the purposes for which teachers use technology and media in the classroom might overlap. For example, a teacher may use a computer to project a book about fish on a smartboard with the goal of teaching about animals but also think of it as a way to entertain students.
Notably, the finding that only 15% of teachers were categorized as low technology users highlights that the majority of preschool teachers reported using these devices to some extent in the classroom with their students. Although our prototypical view of a preschool classroom may include traditional activities like drawing, storybooks, and blocks, the classrooms of 2020 are likely to look quite different than the classrooms of earlier decades. This is especially true given that over 30% of our sample was characterized primarily by using tablets only, a device that was just introduced in 2010.
Finally, we found that the class to which teachers belonged was predicted by publicly-funded childcare settings, teaching experience, and teacher education. The finding that teachers in centers with publicly-funded childcare were more likely to be in the tablet and computer user class than in any other class is in line with prior research showing that student and neighborhood SES influenced teachers’ attitudes toward technology and their classroom technology and media use (Christakis et al., 2006; Blackwell et al., 2014). This finding suggests that publicly-funded childcare settings may be more likely to provide these devices and encourage this kind of technology use. Notably, it does not seem to be the case that teachers in publicly-funded childcare centers are using devices solely as part of their curriculum, as non-instructional and non-teacher-supported were both high. Given historical evidence of a digital divide in home settings such that children from low-SES backgrounds have been less likely to have access to the newest devices or high-speed internet (Livingstone and Helsper, 2007), publicly-funded childcare centers may now have opportunities to obtain technology through state-funded programs or grants intended to address this gap. It is also possible that privately funded centers are more likely to restrict device use or have teachers who use either tablets or computers, but not both. Parents whose children attend privately-funded centers may be more likely to have negative attitudes toward children’s technology and media use, leading center administrators to discourage device use in the classroom. Indeed, parents with higher education and higher income are more likely to be aware of the American Academy of Pediatrics recommendations about limiting children’s media use (Rideout, 2017), which may lead them to prefer less media in the classroom environment. Additionally, a report from Office of Communications (2016) found that United Kingdom parents from middle- and upper-socioeconomic status backgrounds are more likely to be concerned about the time their children spend with technology and media than parents from lower socioeconomic status backgrounds. Regardless of the reasons, the increased likelihood of using tablets and computers among teachers in publicly-funded childcare settings may have important implications for students’ classroom experiences.
The finding that teachers with higher education were more likely to be tablet and computer users in comparison to low technology users may suggest that teachers with higher education are more comfortable using technology in general, perhaps due to experience with technology they had in the college setting. Furthermore, these teachers may have more time or resources to find media content that they think is appropriate for their students. Lastly, the finding that teachers with more experience were more likely to be low technology users than tablets users is in line with prior research (Blackwell et al., 2014) and may suggest that teachers’ practices solidify and stay consistent over years in the profession, such that teachers who began in the classroom before tablets were prevalent are less likely to incorporate these devices into their classroom practice as they become available. Indeed, research shows that teachers’ practices improve during the first few years of teaching, but additional experience does not appear to further improve practice (Rivkin et al., 2005), suggesting that teachers may become established in their patterns and be unlikely to change their practices substantially after that point. This idea is also in line with psychological research showing that individuals become more resistant to change when they have more experience with a task (Sagie et al., 1985). Notably, teachers’ age was not a predictor of class, suggesting that it is experience in the classroom per se, rather than generational differences that account for this finding.
These findings may have important applications for stakeholders concerned about or interested in technology and media use in preschool classrooms. First, educators and administrators may be interested in these findings because classroom technology and media use may be more prevalent than they would have previously imagined. Notably, despite much focus on screen-free play in early childhood education, technology and media use may not be a negative presence in these classrooms, as teachers report frequently using devices for instructional purposes. Given the prevalence of classroom technology and media use, administrators would do well to consider adopting formal policies or philosophies to guide their teachers’ use of devices in the classroom, as well as investing in professional development to ensure that teachers have the knowledge and resources to choose appropriate technology and media to support their curricular goals (Dubé et al., unpublished). These data also suggest that administrators in publicly-funded childcare centers may want to pay special attention to professional development around technology, given that teachers in these settings were likely to use both tablets and computers. For administrators who want to incorporate technology and media into their classrooms for instructional purposes, these data suggest that they may want to focus on teachers with more experience and those with lower levels of education, as they may need more support in order to embrace new technology use in the classroom. Furthermore, administrators may want to invest in computers and tablets, rather than televisions, as interactive devices appear to be used more frequently for instructional purposes.
These findings may also have applications for parents of young children. If parents are concerned about the time that their children are spending on screens, these data suggest that it will be important for them to consider technology and media use in the classroom as part of their child’s daily screen time. Indeed, parents choosing a childcare center may want to ask about classroom technology and media use, especially in a nuanced way that distinguishes between instructional and non-instructional use. Furthermore, parents would do well to consider a conversation with their child’s teacher to ask about suggestions for educational media that could be used in the home environment to support learning across these settings.
Finally, these findings could have applications for technology and media creators. First, it would be helpful for these professionals to create more products for classroom co-use, as teachers appear to be interested in using devices, especially tablets, in teacher-supported contexts and for pair and small group use. As noted above, few apps are currently created with specific affordances for co-use, leaving an important opening for media creators. Second, given the apparent interest in using technology and media in the classroom for instructional purposes, creators should consider collaborating with researchers to test the educational effectiveness of their products. Given the dearth of research-tested media, products that could provide evidence of their benefits for children’s learning would likely be popular among early childhood educators.
Together, these findings set the foundation for future research to explore additional aspects of technology and media use in preschool classrooms. However, there are several limitations of the current study. Although we identified here purposes and contexts that are theoretically likely to be supportive of children’s learning, we did not collect any data from children and our data cannot shed light on the effectiveness of teachers’ naturalistic use of media and technology in the classroom. It will be important for future studies to examine the extent to which technology and media use overall and the nature of media use are associated with children’s learning and development.
Furthermore, the data reported here were teacher-reported, and future research would do well to examine more objective ways to assess technology and media use, including classroom observation, as self-report has limitations around both memory constraints and social desirability. Notably, the design of the survey in the current study also has some limitations. We relied on reports of frequency rather than duration because we expected that it would be challenging for teachers to accurately estimate the duration of use, especially for infrequent uses or uses that occur sporadically rather than in a planned manner. However, this choice means that we cannot estimate how long children may be spending using technology and media in preschool classrooms. In addition to classroom observation, future research might consider daily diaries and other methods for obtaining estimates of duration.
Additionally, although we captured several important teacher and program characteristics that we expected might be related to classroom technology and media use, there are likely to be other factors that influence such use. For example, we did not have data on the curriculum used in each classroom, which may either include or preclude the use of technology. Future research should examine curricula and other features of classrooms, programs, and teachers that may influence technology and media use.
Finally, although our survey may have included some national and international participants, these data likely reflect mostly early childhood educators in Ohio. The extent to which these results are generalizable beyond this group is not clear. Future research should aim to obtain more representative samples and include a more geographically diverse population, including educators outside of the United States.
These data show that technology and media use is increasingly prevalent in preschool classrooms, and future research to understand its association with children’s skill growth will be necessary for understanding the role that classroom technology and media use may play in school readiness. Given the rapid rise in technology and media for young children, it is likely that many centers do not have formal policies on their use in classrooms and that wide variability exists across teachers in both their use of technology and their preparation for using technology and media in developmentally-appropriate ways. The results of the current study demonstrate substantial variability in preschool teachers’ use of technology and media in the classroom, suggesting a potential contributing factor to differences in teachers’ effectiveness and children’s skill growth. Future research should build on these findings to investigate associations with children’s learning and draw from developmental science and education research to develop strategies to help teachers use technology to effectively support their curricular goals.
Data Availability Statement
The raw data supporting the conclusions of this article will be made available upon request, without undue reservation.
Ethics Statement
The studies involving human participants were reviewed and approved by the Institutional Review Board of The Ohio State University. The patients/participants provided their written informed consent to participate in this study.
Author Contributions
RD conceptualized the current study. Both authors jointly created materials, oversaw data collection, conducted data analyses, and drafted the work.
Funding
Funding for this project was provided by a Seed Research Funding Grant from the Crane Center for Early Childhood Research and Policy at The Ohio State University.
Conflict of Interest
The authors declare that the research was conducted in the absence of any commercial or financial relationships that could be construed as a potential conflict of interest.
Acknowledgments
We thank Jennifer Bostic and Logan Pelfrey for assistance with recruitment, Randi Bates for advisement on data analyses, Gloria Yeomans-Maldonado for calling our attention to the too-much-of-a-good-thing effect, and Caroline Gaudreau for providing valuable feedback on an earlier version of this manuscript.
References
Bierman, K. L., Domitrovich, C. E., Nix, R. L., Gest, S. D., Welsh, J. A., Greenberg, M. T., et al. (2008). Promoting academic and social-emotional school readiness: the head start REDI program. Child Dev. 79, 1802–1817. doi: 10.1111/j.1467-8624.2008.01227.x
Blackwell, C. K., Lauricella, A. R., and Wartella, E. (2014). Factors influencing digital technology use in early childhood education. Comput. Educ. 77, 82–90. doi: 10.1016/j.compedu.2014.04.013
Borzekowski, D. L. G., and Henry, H. K. (2010). The impact of Jalan Sesama on the educational and healthy development of Indonesian preschool children: an experimental study. Int. J. Behav. Dev. 35, 169–179. doi: 10.1177/0165025410380983
Callaghan, M. N., and Reich, S. M. (2018). Are educational preschool apps designed to teach? An analysis of the app market. Learn. Media Technol. 43, 280–293. doi: 10.1080/17439884.2018.1498355
Christakis, D. A., Garrison, M. M., and Zimmerman, F. J. (2006). Television viewing in child care programs: a national survey. Commun. Rep. 19, 111–120. doi: 10.1080/08934210600920705
Clark, S. L., and Muthén, B. (2009). Relating Latent Class Analysis Results to Variables not Included in the Analysis. Los Angeles, CA: University of California.
Clarke, A. T., and Kurtz-Costes, B. (1997). Television viewing, educational quality of the home environment, and school readiness. J. Educ. Res. 90, 279–285. doi: 10.1080/00220671.1997.10544584
Connor, C. M., Morrison, F. J., and Slominski, L. (2006). Preschool instruction and children’s emergent literacy growth. J. Educ. Psychol. 98, 665–689. doi: 10.1037/0022-0663.98.4.665
Couse, L. J., and Chen, D. W. (2010). A tablet computer for young children? Exploring its viability for early childhood education. J. Res. Technol. Educ. 43, 75–96. doi: 10.1080/15391523.2010.10782562
Daugherty, L., Dossani, R., Johnson, E. E., and Wright, C. (2014). Moving Beyond Screen Time: Redefining Developmentally Appropriate Technology Use in Early Education. Washington, DC: RAND Corporation.
Dore, R. A., Logan, J., Lin, T.-J., Purtell, K. M., and Justice, L. (2020). Characteristics of Children’s media use and gains in language and literacy skills. Front. Dev. Psychol. 11:2224. doi: 10.3389/fpsyg.2020.02224
Dore, R. A., Shirilla, M., Hopkins, E., Collins, M., Scott, M., Schatz, J., et al. (2019). Education in the app store: using a mobile game to support U.S. preschoolers’ vocabulary learning. J. Child. Media 13, 452–471. doi: 10.1080/17482798.2019.1650788
Dore, R. A., and Zimmermann, L. (2020). “Coviewing, scaffolding, and children’s media comprehension,” in The International Encyclopedia of Media Psychology, eds J. Van den Bulck, D. Ewoldsen, M. Mares, and E. Scharrer (Hoboken: Wiley-Blackwell).
Elliott, S. N., and Gresham, F. M. (1993). Social skills interventions for children. Behav. Modif. 17, 287–313. doi: 10.1177/01454455930173004
Gerritsen, S., Morton, S. M., and Wall, C. R. (2016). Physical activity and screen use policy and practices in childcare: results from a survey of early childhood education services in New Zealand. Austral. N.Zeal. J. Public Health 40, 319–325. doi: 10.1111/1753-6405.12529
Goode, J. A., Fomby, P., Mollborn, S., and Limburg, A. (2019). Children’s technology time in two US cohorts. Child Indic. Res. 13, 1107–1132. doi: 10.1007/s12187-019-09675-x
Hamre, B. K., and Pianta, R. C. (2007). “Learning opportunities in preschool and early elementary classrooms,” in School Readiness and the Transition to Kindergarten in the Era of Accountability, eds R. C. Pianta, M. J. Cox, and K. L. Snow (Baltimore: Paul H Brookes Publishing), 49–83.
Hiniker, A., Lee, B., Kientz, J. A., and Radesky, J. S. (2018). “Let’s play! digital and analog play between preschoolers and parents,” in Proceedings of the 2018 CHI Conference on Human Factors in Computing Systems Montreal, 1–13.
Hirsh-Pasek, K., Zosh, J. M., Golinkoff, R. M., Gray, J. H., Robb, M. B., and Kaufman, J. (2015). Putting education in “educational” apps: lessons from the science of learning. Psychol. Sci. Public Interest 16, 3–34. doi: 10.1177/1529100615569721
Huber, B., Yeates, M., Meyer, D., Fleckhammer, L., and Kaufman, J. (2018). The effects of screen media content on young children’s executive functioning. J. Exp. Child Psychol. 170, 72–85. doi: 10.1016/j.jecp.2018.01.006
Jung, T., and Wickrama, K. A. (2008). An introduction to latent class growth analysis and growth mixture modeling. Soc. Pers. Psychol. Compass 2, 302–317. doi: 10.1111/j.1751-9004.2007.00054.x
Khan, K. S., Purtell, K. M., Logan, J., Ansari, A., and Justice, L. M. (2017). Association between television and parent-child reading in the early home environment. J. Dev. Behav. Pediatr. 38, 521–527. doi: 10.1097/dbp.0000000000000465
Kline, R. B. (2011). “Convergence of structural equation modeling and multilevel modeling,” in The SAGE Handbook of Innovation in Social Research Methods, eds M. Williams & W. P. Vogt (Thousand Oaks, CA: SAGE Publications), 562–589. doi: 10.4135/9781446268261.n31
Lavigne, H. J., Hanson, K. G., and Anderson, D. R. (2015). The influence of television coviewing on parent language directed at toddlers. J. Appl. Dev. Psychol. 36, 1–10. doi: 10.1016/j.appdev.2014.11.004
Lillard, A. S., Drell, M. B., Richey, E. M., Boguszewski, K., and Smith, E. D. (2015). Further examination of the immediate impact of television on children’s executive function. Dev. Psychol. 51, 792–805. doi: 10.1037/a0039097
Livingstone, S., and Helsper, E. (2007). Gradations in digital inclusion: children, young people and the digital divide. New Media Soc. 9, 671–696. doi: 10.1177/1461444807080335
Magee, C. A., Lee, J. K., and Vella, S. A. (2014). Bidirectional relationships between sleep duration and screen time in early childhood. JAMA Pediatr. 168, 465–470. doi: 10.1001/jamapediatrics.2013.4183
McCarthy, E., Tiu, M., and Li, L. (2018). Learning math with Curious George and the Odd Squad: transmedia in the classroom. Technol. Knowl. Learn. 23, 223–246. doi: 10.1007/s10758-018-9361-4
Michael Cohen Group (2013). Effects of Interaction with Pocoyo PlaySets on Preschool (Spanish) ELL Children’s English Language Learning: A Randomized Controlled Trial. New York, NY: Michael Cohen Group.
Nathanson, A. I., and Rasmussen, E. E. (2011). TV viewing compared to book reading and toy playing reduces responsive maternal communication with toddlers and preschoolers. Hum. Commun. Res. 37, 465–487. doi: 10.1111/j.1468-2958.2011.01413.x
National Association for the Education of Young Children [NAEYC] (2012). Position Statement: Technology and Young Children. Washington, DC: National Association for the Education of Young Children.
Northwestern University (2015). Technology in the Lives of Educators and Early Childhood Programs: Trends in Access, Use, and Professional Development from 2012 to 2014. Evanston, IL: Northwestern University.
Nylund, K. L., Asparouhov, T., and Muthén, B. O. (2007). Deciding on the number of classes in latent class analysis and growth mixture modeling: a Monte Carlo simulation study. Struct. Equ. Model. Multidiscip. J. 14, 535–569. doi: 10.1080/10705510701575396
Nylund-Gibson, K., and Choi, A. Y. (2018). Ten frequently asked questions about latent class analysis. Transl. Issues Psychol. Sci. 4:440. doi: 10.1037/tps0000176
Office of Communications (2016). Children and Parents: Media Use and Attitudes Report 2016. London: Office of Communications.
Office of Communications (2017). Children and Parents: Media Use and Attitudes Report 2017. London: Office of Communications.
Pagani, L. S., Fitzpatrick, C., and Barnett, T. A. (2013). Early childhood television viewing and kindergarten entry readiness. Pediatr. Res. 74, 350–355. doi: 10.1038/pr.2013.105
Papadakis, S., Vaiopoulou, J., Kalogiannakis, M., and Stamovlasis, D. (2020). Developing and exploring an evaluation tool for educational apps (ETEA) targeting kindergarten children. Sustainability 12:4201. doi: 10.3390/su12104201
Papadakis, S., Zaranis, N., and Kalogiannakis, M. (2019). Parental involvement and attitudes towards young Greek children’s mobile usage. Int. J. Child Comput. Interact. 22:100144. doi: 10.1016/j.ijcci.2019.100144
Pasnik, S., Llorente, C., Hupert, N., and Moorthy, S. (2016). Dramatic change, persistent challenges: a five-year view of children’s educational media as resources for equity. J. Children Media 10, 229–237. doi: 10.1080/17482798.2016.1140483
Pempek, T. A., Demers, L. B., Hanson, K. G., Kirkorian, H. L., and Anderson, D. R. (2011). The impact of infant-directed videos on parent–child interaction. J. Appl. Dev. Psychol. 32, 10–19. doi: 10.1016/j.appdev.2010.10.001
Penuel, W. R., Bates, L., Gallagher, L. P., Pasnik, S., Llorente, C., Townsend, E., et al. (2012). Supplementing literacy instruction with a media-rich intervention: results of a randomized controlled trial. Early Childhood Res. Q. 27, 115–127. doi: 10.1016/j.ecresq.2011.07.002
Perez, S. (2020). Google Play adds a “Teacher Approved” section to its app store. Tech Crunch. Available online at: https://techcrunch.com/2020/04/15/google-play-adds-a-teacher-approved-section-to-its-app-store/ (accessed November 11, 2020).
Pierce, J. R., and Aguinis, H. (2013). The too-much-of-a-good-thing effect in management. J Manag. 39, 313–338.
Pila, S., Blackwell, C. K., Lauricella, A. R., and Wartella, E. (2019). Technology in the Lives of Educators and Early Childhood Programs: 2018 Survey. Evanston, IL: Northwestern University.
Portelance, D. J., Strawhacker, A. L., and Bers, M. U. (2016). Constructing the ScratchJr programming language in the early childhood classroom. Int. J. Technol. Des. Educ. 26, 489–504. doi: 10.1007/s10798-015-9325-0
Rideout, V. (2017). The Common Sense census: Media Use by Kids Age Zero to Eight. San Francisco, CA: Common Sense Media.
Rivkin, S. G., Hanushek, E. A., and Kain, J. F. (2005). Teachers, schools, and academic achievement. Econometrica 73, 417–458. doi: 10.1111/j.1468-0262.2005.00584.x
Rodrigues, D., Gama, A., Machado-Rodrigues, A. M., Nogueira, H., Silva, M. G., Rosado-Marques, V., et al. (2020). Social inequalities in traditional and emerging screen devices among Portuguese children?: a cross-sectional study. BMC Public Health 20:902.
Sagie, A., Elizur, D., and Greenbaum, C. W. (1985). Job experience, persuasion strategy and resistance to change: an experimental study. J. Occup. Behav. 6, 157–162. doi: 10.1002/job.4030060207
Schacter, J., Shih, J., Allen, C. M., DeVaul, L., Adkins, A. B., Ito, T., et al. (2016). Math shelf: a randomized trial of a prekindergarten tablet number sense curriculum. Early Educ. Dev. 27, 74–88. doi: 10.1080/10409289.2015.1057462
Stevens, R., and Penuel, W. R. (2010). “Studying and fostering learning through joint media engagement,” in Paper presented at the Principal Investigators Meeting of the National Science Foundation’s Science of Learning Centers, Arlington, VA.
Strouse, G. A., O’Doherty, K., and Troseth, G. L. (2013). Effective coviewing: preschoolers’ learning from video after a dialogic questioning intervention. Dev. Psychol. 49, 2368–2382. doi: 10.1037/a0032463
Takeuchi, B. L., and Stevens, R. (2011). The New Coviewing: Designing for Learning through Joint Media Engagement. Available online at: http://www.joanganzcooneycenter.org/wp-content/uploads/2011/12/jgc_coviewing_desktop.pdf (accessed November 11, 2020).
Vaala, S., Ly, A., and Levine, M. H. (2015). Getting a Read on the App Stores: A Market Scan and Analysis of Children’s Literacy Apps. New York, NY: Joan Ganz Cooney Center.
Vanderloo, L. M. (2014). Screen-viewing among preschoolers in childcare: a systematic review. BMC Pediatr. 14:1–16.
Walsh, J. J., Barnes, J. D., Cameron, J. D., Goldfield, G. S., Chaput, J. P., Gunnell, K. E., et al. (2018). Associations between 24 hour movement behaviours and global cognition in US children: a cross-sectional observational study. Lancet Child Adolesc. Health 2, 783–791. doi: 10.1016/S2352-4642(18)30278-5
Keywords: technology, media, tablets, preschool, early childhood education
Citation: Dore RA and Dynia JM (2020) Technology and Media Use in Preschool Classrooms: Prevalence, Purposes, and Contexts. Front. Educ. 5:600305. doi: 10.3389/feduc.2020.600305
Received: 29 August 2020; Accepted: 02 November 2020;
Published: 24 November 2020.
Edited by:
Stamatis Papadakis, University of Crete, GreeceReviewed by:
Balwant Singh, Partap College of Education, IndiaMaria Antonietta Impedovo, Aix-Marseille Université, France
Copyright © 2020 Dore and Dynia. This is an open-access article distributed under the terms of the Creative Commons Attribution License (CC BY). The use, distribution or reproduction in other forums is permitted, provided the original author(s) and the copyright owner(s) are credited and that the original publication in this journal is cited, in accordance with accepted academic practice. No use, distribution or reproduction is permitted which does not comply with these terms.
*Correspondence: Rebecca A. Dore, ZG9yZS4xM0Bvc3UuZWR1