 San Verhavert
 Antony Furlong
 Renske Bouwer
- 1Department of Training and Education Sciences, University of Antwerp, Antwerp, Belgium
- 2International Baccalaureate (IB), The Hague, Netherlands
- 3Utrecht Institute of Linguistics OTS, Utrecht University, Utrecht, Netherlands
Several studies have proven that comparative judgment (CJ) is a reliable and valid assessment method for a variety of competences, expert assessment, and peer assessment, and CJ is emerging as a possible approach to help maintain standards over time. For consecutive pairs of student works (representations) assessors are asked to judge which representation is better. It has been shown that random construction of pairs leads to very inefficient assessments, requiring a lot of pairwise comparisons to reach reliable results. Some adaptive selection algorithms using information from previous comparisons were proposed to increase the efficiency of CJ. These adaptive algorithms appear however to artificially inflate the reliability of CJ results through increasing the spread of the results. The current article proposes a new adaptive selection algorithm using a previously calibrated reference set. Using a reference set should eliminate the reliability inflation. In a real assessment, using reference sets of different reliability, and in a simulation study, it is proven that this adaptive selection algorithm is more efficient without reducing the accuracy of the results and without increasing the standard deviation of the assessment results. As a consequence, a reference-based adaptive selection algorithm produces high and correct reliability values in an efficient manner.
Introduction
Comparative judgment (CJ) is a recent, alternative form of assessment. A group of assessors are individually presented with several, consecutive pairs of works of students (hereafter called representations). For every pair, the assessors are asked which of the two representations is better considering the task or competency under assessment. Based on the pairwise judgments of the assessors, logit scores can be estimated using the Bradley–Terry–Luce (BTL) model (Bradley and Terry 1952; Luce 1959). These logit scores, also referred to as ability scores, represent the consensus view of the group of assessors about the quality of the representations in regard of the task or competency under assessment. Specifically, a logit score represents the difference in quality (in a log-transformed probability) between a particular representation and a representation of average quality for this group of representations. The strength of this method is based on the observation that in everyday life all judgments a person makes are in fact comparisons (Laming 2003). Furthermore, using comparisons recognizes tacit knowledge of teachers when they are making assessments (Kimbell 2021). When implemented as a form of peer assessment it might support learning and the transfer of tacit knowledge (Kimbell 2021).
In CJ, the process to scale representations based on the judgments comes from Thurstone’s law of comparative judgment (Thurstone 1927), which was Thurstone’s attempt to develop a new way for scaling in educational tests (Thurstone 1925). Pollitt and Murray (1995) reintroduced this method to assess the level of language proficiency. Attention for CJ has been rising steadily since and has seen an apparent surge in the last decade. It has, for example, been used for the assessment of academic writing (van Daal et al., 2017), visual arts (Newhouse 2014), graphic design (Bartholomew et al., 2019), and mathematical problem solving (Jones and Alcock 2014). CJ can also be deployed in a peer assessment both as an assessment tool and as a learning tool (e.g., Bouwer et al., 2018; Bartholomew et al., 2019; Brignell et al., 2019).
The method of CJ has also been successfully applied in the context of standard maintaining (e.g., Bramley and Gill 2010; Curcin et al., 2019) and comparability of standards (e.g., Bramley 2007; Holmes et al., 2018) in UK national assessments. For standard maintaining, in order to equate the difficulty of exams over two consecutive years, representations of 1 year are paired with those of the next year. Based on the results of this CJ exercise equal grade boundaries are determined over both years, eliminating differences in difficulty between those years. For comparability of standards, representations from two examining boards are paired in order to investigate if the assessment results are comparable across boards. While the use of CJ for standard maintaining is fairly recent, it was already used for comparability of standards from 1997 (Bramley 2007).
Pollitt and Murray (1995) and Bramley, Bell, and Pollitt (1998) recognized early on that the method of CJ is highly inefficient, needing a lot of comparisons for the results to reach an acceptable reliability level. In CJ the reliability is measured by the scale separation reliability (SSR), reflecting how accurate the ability score estimates are. The SSR can be interpreted as in how far assessors agree with each other regarding the quality of the representations (Verhavert et al., 2018). A meta-analysis showed that in order to reach a scale separation reliability (SSR) of 0.70, at least 14 comparisons per representation are needed. For an SSR of 0.90 this rises to 37 comparisons per representation (Verhavert et al., 2019). In educational practice, this often leads to a large total number of comparisons (NC) considering the regular sizes of student groups, which impedes the practical feasibility of the method. Bramley et al. (1998) have accurately summarized this problem, as follows: “The most salient difficulty from a practical point of view is the monotony of the task and the time it takes to get a sufficient number of comparisons for reliable results.” (14).
Up until 2008 (Kimbell et al., 2009; Kimbell 2021), in CJ, pairs were constructed using a semi-random selection algorithm (SSA). This algorithm prefers representations that have appeared in pairs the least number of times. It pairs those with representations they have not yet been compared with. At the request of Kimbell et al. (2021), Pollitt developed an adaptive selection algorithm (ASA) to construct pairs based on information of previous comparisons as a solution to the efficiency problem. This ASA (Pollitt 2012) is inspired by computerized adaptive testing (CAT; see also below). It pairs representations which have ability scores that are close together. For this, it used preliminary ability scores estimated based on previous comparisons within the assessment and the Fisher’s information statistic. In CJ, the Fisher’s information is highest when the difference in ability scores between the pairs is lowest. With this adaptive selection algorithm Pollitt claims that very high SSR values of 0.94 or above, can already be obtained after around 13 comparisons per representation (Newhouse 2014). This is not only a large gain in efficiency, but also presents a higher reliability compared with traditional marking.
There are, however, some concerns regarding Pollitt’s ASA and the related reliability. Bramley (2015) and Bramley and Vitello (2019) have shown that this type of adaptivity inflates the reliability of the assessment. This is probably because this type of adaptivity “capitalizes on chance” (Bramley and Vitello 2019, 45), Namely, the construction of pairs is based on information that is in itself not reliable because it only consists of a few data points (Bramley and Vitello 2019, i.e., preliminary ability score estimates based on previous judgments within the assessment). In this way, the adaptivity reduces the chance that contradictory information is collected. While the adaptivity may genuinely reduce the standard error (se) of the estimates, it artificially inflates the standard deviation (SD). Since the SSR formula is based on the difference between SD and se (see below), this means the SSR is inflated by an unknown amount and cannot be used on its own as a measure of reliability (Bramley and Vitello 2019; Crompvoets et al., 2020).
The decrease in se and increase in SD has some consequences for the use of the assessment results in practice. The se reduction means that when we are merely interested in the ranking of the students (and not the estimated value), adaptivity might not pose that much of a problem (Bramley and Vitello 2019)1. On the other hand, if we use the estimated ability values of the students as scores in high stakes assessments, the increased SD does pose a problem, namely, it means that the estimated ability values are shifted away from 0 and thus away from their true value (Bramley and Vitello 2019). In any case, when using adaptivity we can no longer rely on the SSR value to indicate how reliable, i.e., how certain, the results are.
While in CAT there is no issue of the inflation of the reliability coefficient, this is rather problematic for CJ contexts. This is because of two related, important differences between CAT and CJ. A first difference lies in the differing background of both. CAT is based on Item Response Theory (IRT) where CJ is based on the BTL-model. IRT models compare the difficulty of test items (e.g., exam questions) with the ability of students (to answer these questions). In CJ the performance of students is compared directly. As such, the BTL-model compares student abilities. Second, the item difficulty in CAT is determined before any assessments are conducted. This is done in an extensive calibration study with several hundreds of students. As such, if a student is presented with an item that has a difficulty close to the preliminary ability of that that student using, for example, Fisher information, that item difficulty is a fixed value on a pre-calibrated scale. Therefore, the eventual estimate of the ability of the student and the reliability of this estimate are not biased by the adaptivity of the selection algorithm. On the contrary, in Pollitt’s ASA for CJ, the abilities of the students in any pair are not yet fixed. As such, Pollitt’s algorithm for CJ capitalized on chance where CAT algorithms do not.
The current article investigates a new ASA to address the efficiency problems in CJ (detailed description see following section). In order to overcome the problems with Pollitt’s type of adaptivity, the ASA is more strictly based on CAT algorithms. Namely, like CAT has test items with pre-calibrated, fixed difficulty scores, the newly proposed algorithm makes use of a set of representations with pre-calibrated, fixed ability scores. This is further referred to as the reference set. New representations are initially paired with a randomly selected representation in the middle of the reference set. Based on this first comparison, a preliminary ability value is estimated for the new representations. Consecutively, the new representations are individually paired with representations of the reference set with ability scores close to the preliminary scores of the new representations based on the Fisher information statistic. The ability scores of the new representations are consecutively updated and new pairs are constructed as before. This is repeated until the preliminary estimates reach a certain reliability or the representations are compared a predetermined maximum number of times.
The idea of using a fixed reference set was suggested by Bramley (2015) and Bramley and Vitello (2019) as a solution to the SSR inflation in Pollitt’s ASA because the fixed ability scores in the reference set anchor the estimates of the new representations. The new ASA might not only have the advantage of countering SSR inflation, it might also provide advantages when using CJ for maintaining standards. Specifically, it would only be necessary to scale representations for 1 year and set grade boundaries. In all consecutive years, this reference set can be used to scale the new representations with fewer pairwise comparisons, provided that the assessment task is similar. In this way, it might even be possible to expand the scale or (gradually) replace representations of previous years with newer ones.
The Reference Set-Based Adaptive Selection Algorithm
The reference set-based adaptive selection algorithm (RSB-ASA) places new representations on a measurement scale consisting of a pre-calibrated set of representations (of the competence under assessment), called the reference set. It does this in two preparatory steps and four actual steps. For simplification, the algorithm will be described from the standpoint of a single, new representation. Mind that, in practice, multiple new representations are assessed. Furthermore, with multiple representations an assessment can theoretically be divided into rounds. One round ends when every active, new representation has gone through all steps, with active meaning involved in comparisons (see also Step 4B). For clarity, the rest of the article representations in the reference set will be indicated with the letter j and, when needed, k, and their fixed ability values with
Step A: A reference set with an acceptably high reliability is constructed. A CJ assessment using the SSA for constructing pairs is conducted in order to pre-calibrate the ability scores of the representations in the reference set. As is common, ability scores are estimated using the BTL model (Bradley and Terry 1952; Luce 1959):
with
with
with
with
with
Step B: A subset of the reference set is determined. This subset consists of representations with an ability score close to 0. An ability score of 0 is the score of an average representation in the reference set and as such the best starting point for comparing a new representation.
From here, the actual algorithm starts. Note that by definition the fixed ability values of the reference set are not re-estimated hereafter.
Step 1: A new representation i is randomly paired with a representation j from the subset determined in Step B.
Step 2: A preliminary ability score
with
Step 3: Is the predetermined value of the stopping criterion reached or exceeded for representation i? There are two types of stopping criteria, fixed criteria and variable criteria. With fixed criteria, all representations are compared an equal number of times. This comes down to setting a fixed number of comparisons per representation (NCR). With variable criteria, each representation is compared a different number of times. In the current algorithm, the accuracy of the preliminary ability estimate of representation i is used4. In CAT algorithms, generally, the standard error of estimation (se) is used as a measure of estimate accuracy. The current algorithm resorts to the reliability of the ability estimate of representation i. In the BTL-model, this gives equivalent results to the se, but is easier for practitioners to interpret. In order to measure the reliability of the ability estimate (of a single representation), the point SSRi or the estimated SSRi is calculated:
with
Returning to the question posed in Step 3: is the predetermined value of the stopping criterion reached or exceeded for representation i? If not, continue to Step 4. If yes, stop here. This representation no longer appears in pairs in this assessment. For fixed stopping criteria, this happens for all representations at once. For variable stopping criteria, this is determined for each representation separately. It is, however, possible that some representations never reach the stopping criteria. Therefore, with a variable stopping criterion, a maximal NCR must be set to prevent the algorithm from continuing forever.
Step 4: Select representation j providing the most information for representation i is. Information is measured here with the Fisher information criterion.
Step 4A: The Fisher information Iij is calculated for all representations j in the reference set, against the ability of representation i (Wright and Stone 1999):
with
Step 4B. Representation i is paired with the representation j that has the largest value for
The Current Research
The current research investigates the efficiency and accuracy of the RSB-ASA described in the previous section. Specifically, it attempts to answer the following research questions (RQ):
RQ1 Does using the RSB-ASA in a CJ assessment 1) lead to a higher efficiency, 2) while producing results with the same accuracy as the SSA?
RQ2 Does the RSB-ASA produce an inflation in standard deviation of the CJ results?
RQ3a Does the reference set reliability in the RSB-ASA influence the efficiency and the accuracy of the results?
RQ3b Does the reference set reliability in the RSB-ASA influence the standard deviation of the CJ results?
RQ4a Does the stopping criterion, fixed or variable, in the RSB-ASA influence the efficiency and the accuracy of the CJ results?
RQ4b Does the stopping criterion, fixed or variable, in the RSB-ASA influence the standard deviation of the CJ results?
This was done in two studies. In Study 1, assessors created a reference set in a CJ study using the SSA. From this reference set, a subset of representations was selected to be placed back on the reference set in the second part of this study. This provided answers to RQ1 and RQ2. Furthermore, in Study 1, the reliability of the reference set was manipulated (RQ3) and different stopping criteria were used (RQ4) when analyzing the data. For more details, see the Methods section of Study 1.
Because Study 1 involved real assessors (i.e., was not a simulation), it was not feasible to include replications, due to practical constraints. The reference set was also derived from an assessment with the same assessors who later conducted the assessment implementing the RSB-ASA. Last, the fixed stopping criterion and the maximal number of comparisons with the variable stopping criteria set in Study 1 might have been too restrictive. In order to address these shortcomings (discussed in some more detail in the Discussion section of study 1), a simulation study was conducted as Study 2.
Study 2 looked into the efficiency of the RSB-ASA and the accuracy of the results (RQ1) by comparing the results of the simulation with the RSB-ASA with those of a simulation with the SSA. Also, the standard deviation of the results of both simulations was calculated and compared with each other and with the standard deviation of the generating values (RQ2). Also here, different stopping criteria were used (RQ4). For more details, see the Methods section of Study 2.
In both studies, efficiency was conceptualized as the NCR were needed in the CJ assessment. Accuracy was conceptualized as the average difference between the resulting ability estimates of the new representations with the RSB-ASA and the, so called, true ability scores. For details, see the section on the measures in the Methods sections of each study. It is expected that reference sets with a higher reliability will result in a higher efficiency and a higher accuracy of the estimates. Using a predetermined NCR as the stopping criterion should also result in a higher accuracy of the estimates. However, it might lead to a reduction of the efficiency compared with a variable stopping criterion. It will be important here to see if the gain in accuracy weighs up against the decrease in efficiency.
Study 1
Method
Materials
As representations, 160 short essays were selected from a total of 7,557 essays. This number was chosen to keep the work for assessors doable and keep the paid work hours within budget. Furthermore, based on the experience of the authors, this number should lead to a reference set that is fine grained enough for use in the algorithm. What the optimal size of the reference set should be, goes beyond the current article. The 160 representations were selected at random by means of the select cases tool in SPSS (IBM Corp. 2016). The essays were taken from the Economics Higher Level Paper 1 (time zone 25) exam of May 2016. Specifically, they were all responses to question 1b (Q1b): “Evaluate the view that regulations are the most effective government response to the market failure of negative externalities.” This was a subpart of an optional question and was worth 15 out of a total of 50 marks. There was no word or time limit for the essay, although the total exam time was 90 min.
All pages not containing a response to Q1b were removed and when the response to this question began or finished part way through a page, any writing relating to other questions on the exam was covered from view. The essays were then anonymized and all examiner marks and comments were removed.
Participants
The reference set was created in a CJ assessment (algorithm Step A) including 15 assessors. From these 15 assessors, only 10 were available to participate in the assessments implementing the RSB-ASA. These sample sizes were chosen in order to keep the workload for assessors manageable and at the same time have a decent proportion of judgments attributed to each judge, making sure that the judgments of each assessor had a realistic weight in the end result. The latter is also the reason to reduce the number of assessors from 15 to 10, as the NCR was less. These decisions are, however, based on the experience of the authors. To our knowledge, research regarding the effect of the number of assessors on the final results of a CJ assessment are currently lacking.
The 15 assessors were all existing IB examiners, and were recruited by e-mail. Of the 15 assessors, 12 had marked the question during the May 2016 examination session and the remaining three either marked another question on this examination, or marked questions from the time zone 15 variant of the examination. The 15 assessors also included the Principal Examiner for the examination, who is responsible for setting the overall marking standard, and two “team leaders” who are considered reliable and experienced examiners and have responsibility within an examination session for leading a small team of examiners.
All assessors were paid for their work, and all signed a “Contributor’s Agreement,” which included permission to use their anonymized judging data.
Procedure
There were two phases in this study: In phase 1, the reference sets were constructed (cfr. algorithm Step A), and in phase 2, new representations were compared with the reference sets using the RSB-ASA as described above. Phase 1: The assessment used to construct the reference set (algorithm Step A) took place in 2017. It was planned to collect 30 judgments per representation, totaling in 2,400 judgments. Each assessor was therefore asked to make 160 judgments each. Pairs were constructed using the SSA selecting representations randomly, preferring those with the least NCR that have not yet been compared with each other. Assessors were given 3 weeks, between the beginning of April 2017 and the beginning of May 2017 to complete all the judgments. Because the assessors were distributed across the world and many were fitting the work around other commitments, no constraints were placed upon when the assessors were to do the judging within that 3-week window. However, the assessors were asked to attempt to make their judgments as much as possible at the same time (i.e., on set dates and times).
The first phase, the assessment with the SSA, resulted in a rank order with a rank-order SSR of 0.91 (rank-order SD = 2.12; mean parameter se = 0.56; n = 160; for detailed results, see Supplementary Table S1 in Supplementary Materials). Twenty representations were taken out of this rank order to be placed back on the reference set the assessments using the RSB-ASA, leaving 140 representations to construct the reference sets. It was opted to have an even spread of representation along the rank order. Therefore, representations at fixed ranks (4th, 12th, 20th, etc.) were selected. In this way the average logit distance between the selected representations was 0.44 (min = 0.17; max = 1.38).
In order to look into the effect of the reference set reliability in the RSB-ASA, it was decided to construct four reference sets with reference set SSR of 0.50, 0.70, 0.80, and 0.91, respectively. The reference sets were based on the judgement data from phase 1. For the three first reference sets, it was determined after how many comparisons (with each representation having an equal number of comparisons) the ability estimates reached a rank-order SSR values of 0.50, 0.70, and 0.80. At each of these rank-order SSR values, the corresponding ability estimates were recorded for all 140 representations. The fourth reference set were the estimates of the 140 representations at the end of the assessment with the SSA. Rank-order SD, mean parameter se and NCR are presented in Table 1 (for detailed results, see Supplementary Table S1 in Supplementary Materials).
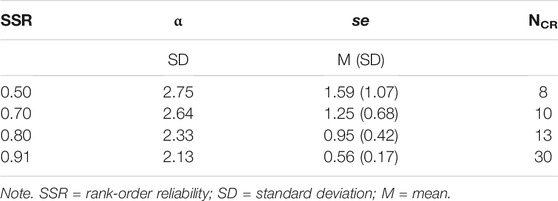
TABLE 1. For each reference set (SSR) the standard deviation of ability estimates (α, n = 140), mean and standard deviation of standard error of estimate (se, n = 140) and the number of comparisons per representation to reach this reference set (NCR).
Because there were no constraints placed on when assessors made their judgments, there was no equal distribution of the judgments of the assessors throughout the assessment. Some judgments of the assessors were clustered at the beginning of the assessment, while judgments of other assessors were clustered at the end and still others had an equal distribution throughout the assessment. Therefore, to make sure that each reference set is approximately based on an equal amount of judgments of every assessor, some reordering of the dataset had to take place before the three reference sets with smaller reference set SSRs could be determined. The reordering went as follows: The judgments were first ordered chronologically on time of completion and were then divided into groups of 80 comparisons. Finally, these groups were sorted in a random order. For a more detailed representation of how the judgments of the assessor were distributed throughout phase 1, see Figures 1, 2.
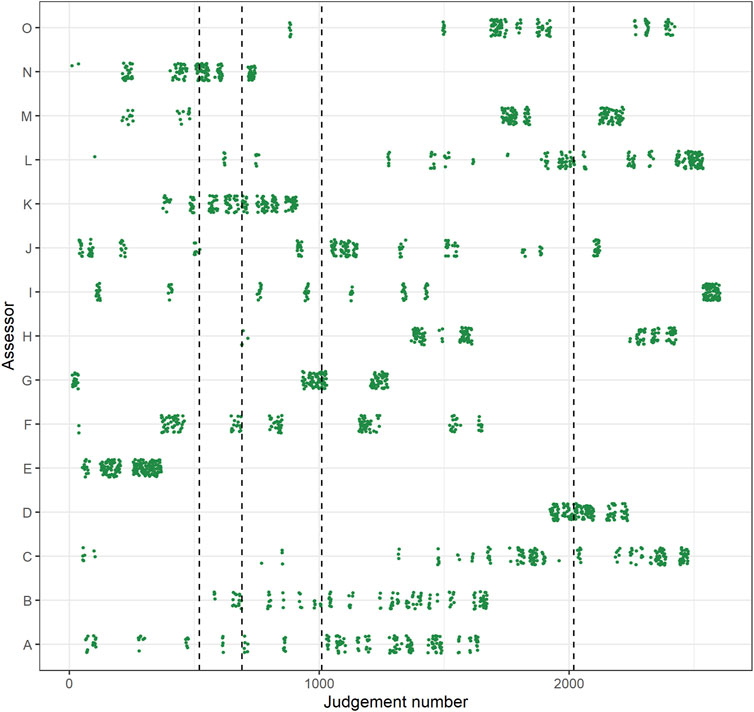
FIGURE 1. Distribution of judgments throughout the assessment in phase 1 (Judgment number; x-axis) by assessor (y-axis), before reordering. The vertical dotted lines indicate the judgment number at which the estimates reached a rank-order reliability of 0.50, 0.70, 0.80, and 90 (respectively from left to right). Note: jitter added to y-axis coordinates for clarity.
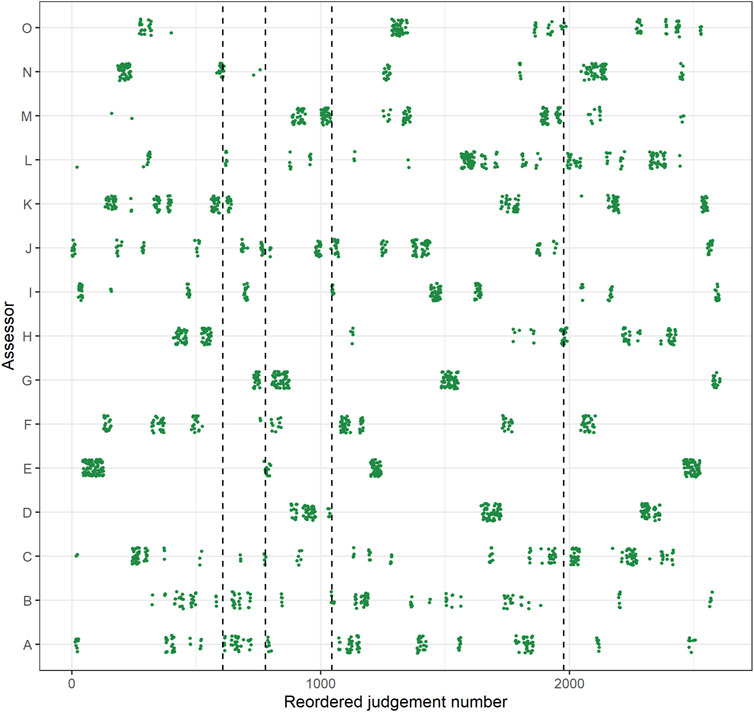
FIGURE 2. Distribution of judgments throughout the assessment in phase 1 (Judgment number; x-axis) by assessor (y-axis), after reordering. The vertical dotted lines indicate the judgement number at which the estimates reached a rank-order reliability of 0.50, 0.70, 0.80, and 90 (respectively from left to right). Note: jitter added to y-axis coordinates for clarity.
Phase 2: Four assessment sessions were organized implementing the RSB-ASA described above, one for each reference set. As each reference set consisted of the same representations and the representations to be placed back were the same across the sessions, the only difference for assessors was the pairings of the representations. However, in order to make sure that the results in any session would not be influenced too much by the judgments of a few assessors, the order of the sessions was not counterbalanced. The number of judgments was fixed on 10 judgements per representation in each session. This resulted in a total of 200 judgments per session or 20 judgments per assessor per session. The judges got 4 weeks to complete their judgments (between mid-August and mid-September 2017). Figure 3 presents how the judgments of the assessors were distributed throughout phase 2 in more detail.
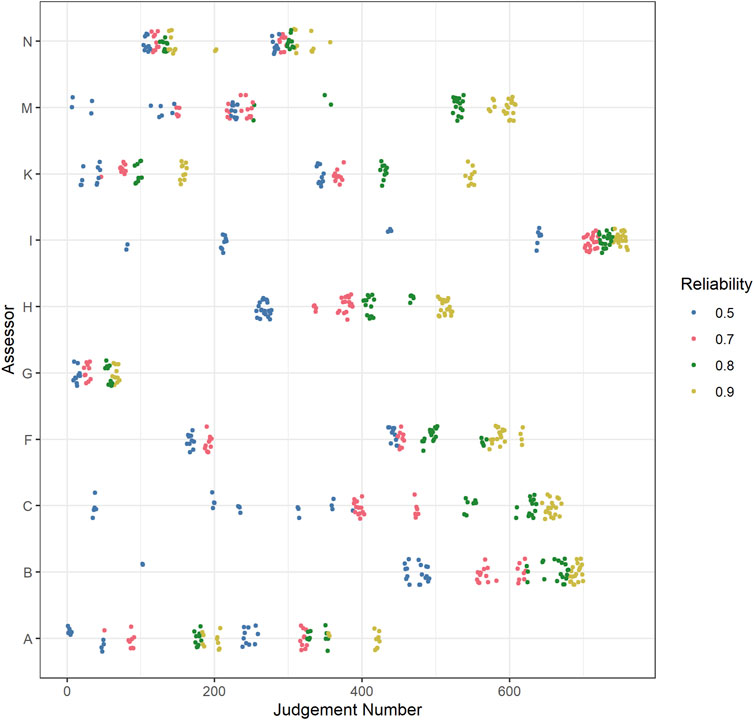
FIGURE 3. Distribution of judgments throughout the assessments in phase 2 (Judgment number; x-axis) by assessor (y-axis), per reference set reliability (colors). Note: jitter added to y-axis coordinates for clarity.
All assessments were conducted in and controlled by the D-PAC6 platform. The assessments were conducted under the supervision of AF.
Afterward, the judgment data was processed as follows. For every assessment session implementing the RSB-ASA three stopping criteria were implemented: 10 comparisons per representation (further called fixed stopping criterion) and an estimate reliability of 0.70 and 0.90 (further called, respectively, estimated SSRi 0.70 and estimated SSRi 0.90). These reliability levels were used because these are the reliability levels commonly aimed for in formative and summative assessments, respectively (Nunnally 1978; Jonsson and Svingby 2007). Thus, for all 20 representations, ability scores were estimated after 10 judgments per representation. For estimated SSRi 0.70 and estimated SSRi 0.90, the method was as follows. After every round7 the SSRi is calculated [as in formula (7); cfr. Step 3] for the preliminary ability value of each of the 20 representations (cfr. Step 2). If this SSRi equals or exceeds 0.70 or 0.90, respectively, the corresponding ability value was noted, as well as the NCR needed to obtain this value. If a representation did not reach an estimated SSRi of 0.70 or 0.90 after 10 comparisons, the ability value after 10 comparisons per representation was recorded. Ability scores were estimated using a joint maximum likelihood algorithm with an epsilon bias correction factor of 0.003 (for details, see Verhavert 2018).
Measures
For the results of every reference set and all stopping criteria, the accuracy of the noted ability scores (of the 20 representations that were placed back) was calculated by the root mean squared error (RMSE). This is the mean difference between the estimated ability score and the ability score obtained at the end of phase 1. Furthermore, standard deviation (SD) of the ability estimates in every condition in phase 2 was calculated and compared with the SD of the 20 representations at the end of phase 1. This is to see whether there might be a SD inflation in the estimates of the representations that are placed back on the scale, as is the case with ASA’s that do not use a reference set.
All analyses were conducted in R (R Core Team, 2020).
Results
From the plot showing the RMSE (Figure 4) it is clear that, in general, the RMSE values are the lowest when the stopping SSRi is 0.90 or when a fixed stopping criterion of 10 comparisons per representation is used. This indicates that the stopping SSRi 0.90 and the fixed stopping criterion lead to more accurate results compared with the stopping SSRi 0.70. A second observation is that the RMSE is smaller when the reference set SSR is larger, showing that a more reliable reference set leads to more accurate results. Furthermore, there appears no or just a small difference in RSME between reference set SSR’s 0.80 and 0.91. This observation could be explained by assessor fatigue, namely, because the assessment with the 0.91 reference set was presented last, it is possible that the assessors made more mistakes due to fatigue causing a minor drop the accuracy of the results (a higher RMSE) rather than the expected rise in accuracy (a lower RMSE). This interpretation could be verified by calculating assessor misfit, a measure for the number of mistakes an assessor makes weighted by the severity of the mistakes8. However, because of the assessment setup and the RSB-ASA, there is no longer an equal distribution of the difficulty of the comparisons9 between assessors. Therefore, the misfit values are no longer comparable. As a third observation, the difference in RMSE between either the fixed stopping criterion or the stopping SSRi of 0.90 and the stopping SSRi of 0.70 decreases when the reference set SSR becomes larger. However, these results might be an artifact of the assessment setup, namely, as the results discussed in the next paragraph show, the limit of 10 comparisons per representation might be too low in order for the representations to reach a stopping SSRi of 0.90.
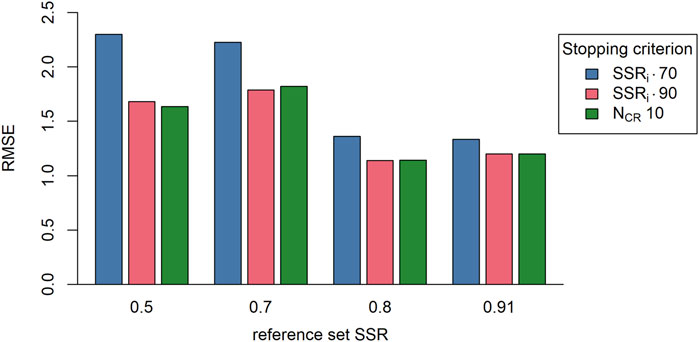
FIGURE 4. The root mean squared error (RMSE; n = 20) per reference set (SSR of reference sets) and per stopping criterion (colors; SSRi 0.70, SSRi 0.90, NCR 10). Note: SSRi, = estimate reliability; NCR, = number of comparisons per representation.
As expected, it was observed that fewer comparisons per representation are needed when estimated SSRi was used as stopping criterion than with the fixed stopping criterion (Figure 5). This is true for both the median and the mean NCR (respectively, the filled diamond and the square in Figure 5). Specifically, fewer comparisons per representation were needed to reach the estimated SSRi of 0.70, making this the most efficient stopping criterion. For the estimated SSRi of 0.90, it is observed that, overall, 11 of the 20 representations reach this SSRi level before 10 comparisons per representation, the rest never reached this value. Moreover, at the fixed stopping criterion the average estimated SSRi was 0.88 (SD = 0.02), which is lower than the stopping criterion SSRi of 0.90. This shows that 10 comparisons per representation might have been a bit too low for a fixed stopping criterion.
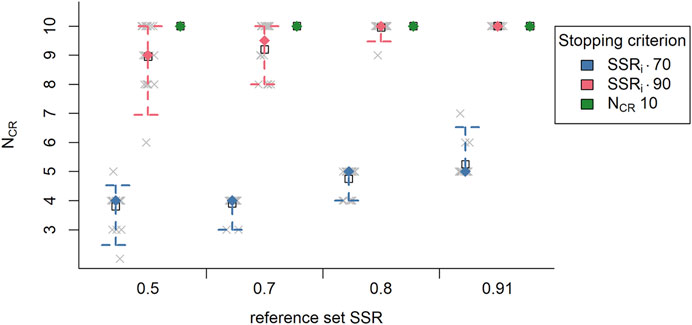
FIGURE 5. The median (n = 20; filled diamond) and average (n = 20; empty square) number of comparisons per representation (Ncr) per reference set (SSR of reference sets) and per stopping criterion (colors; SSRi 0.70, SSRi 0.90, NCR 10) with the interval covering 95% of values (n = 20; dashed bars) and the actual number of comparisons per representation (grey x). Note: SSRi = estimate reliability; NCR, = number of comparisons per representation.
Taking the total number of comparisons into account (Table 2), less comparisons are needed for the stopping criterion SSRi of 0.70 compared with the stopping criterion SSRi of 0.90 and the fixed stopping criterion, which was to be expected. This shows that the stopping criterion SSRi of 0.70 is the most efficient. Moreover, the total number of comparisons increases as the reference set SSR increases. Thus, a more accurate reference set appears to reduce the efficiency of the algorithm. There are several possible explanations (for details, see the Discussion section). Additionally, with a reference set SSR of 0.50, there still is a small difference in total number of comparisons between stopping criterion SSRi of 0.90 and the fixed stopping criterion. This difference decreases as the reference set SSR increases again pointing in the direction that 10 comparisons per representation might have been too restrictive. Finally, because of the difference between the estimated SSRi and the rank-order SSR, the NCR in Table 2 cannot be compared with those needed to reach a rank-order SSR of 0.70 and 0.90 in phase 1 (Table 1). This should be further looked into in study 2.
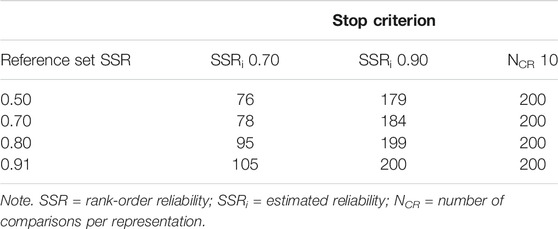
TABLE 2. Total number of comparisons per reference set (SSR) and per stopping criterion.
As a final observation, the SD of the ability estimates, of the 20 representations that were placed back on the reference set, becomes smaller as the reference set SSR becomes larger (Table 3). Contrary to our expectations, there is only a minimal, negligible difference in SD between the stopping criteria within every reference set. When the reference set SSR is 0.90, the SD of the ability estimates approaches the SD of the ability values of the selected representations obtained in phase 1, namely, 2.15. With a low reference set SSR, it can be said there is an increase in SD [ΔSD = (0.86; 1.11)]. However, with a high reference set SSR the difference in SD is almost negligible [ΔSD = (0.04; 0.12)].
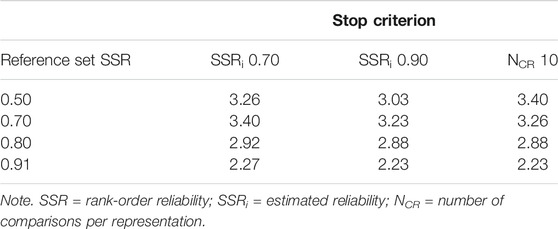
TABLE 3. The standard deviation (SD; n = 20) of the ability estimates of the selected representations per reference set SSR and stopping criterion.
Discussion
The abovementioned results tentatively show that the RSB-ASA is more efficient than the SSA used in phase 1. The largest efficiency gain can be made by using an estimated SSRi of 0.70 as a stopping criterion. There appears however a tradeoff between the efficiency and the accuracy. The stopping criterion estimated SSRi of 0.70 is less accurate than using an estimated SSRi of 0.90 as a stopping criterion or even a fixed stopping criterion of 10 comparisons per representation. There is also an effect of the accuracy of the reference set used in the adaptive algorithm. The higher the accuracy of the reference set, expressed by the reference set SSR, the higher the accuracy of the assessment results. The latter will be discussed in further detail in the general discussion.
It was also observed that a more accurate reference set led to an increase in comparisons needed to reach these accurate results. One explanation is that when the reference set values are too accurate, toward the end of the assessment, the assessors receive pairs of representations that are very difficult to distinguish. As a consequence, they might make more judgment errors. Alternatively, it can be assessor fatigue. Because the assessors receive the assessments in the same order (of reference set SSR), they might be more tired with the last assessment, thus, making more errors. In both cases, more errors mean that representations might need more comparisons in order to reach an accurate enough estimate.
It must further be remarked that this study did not contain any replications with the same or a different assessor group. Therefore, it is unsure if the above described differences are due to random error. Second, the assessment conducted to construct the reference sets (phase one in procedure) and the assessments conducted with the RSB-ASA (phase 2 in procedure) were all done by the same assessors (or a subset thereof). Therefore, the assessors might already have been familiar with the representations and the CJ method, which might have influenced the results. Third, results showed that 10 comparisons per representation might have been a bit too strict for a stopping criterion. Finally, due to the incomparability of the rank-order SSR and the estimated SSRi, it cannot be confirmed if the RSB-ASA is in fact more efficient that the SSA.
Study 2
In order to address the shortcomings discussed in the previous paragraph and confirm the findings of Study 1, and to look into the theoretical accuracy and efficiency of the RSB-ASA, a simulation study was conducted in Study 2. This allows to make a large number of (theoretical) replications under highly controlled setting, thereby reducing random errors. Assessments also start from generating values, eliminating the need to construct reference sets and making it possible to compare estimates with true values. Furthermore, Study 2 will use a higher number of comparisons per representation and it will allow a more direct comparison between the RSB-ASA and the SSA.
Method
Generating Values
For the current study, 220 ability values (i.e., the generating values) were randomly sampled. This number was chosen in order to have a reference set that is fine grained enough to use in the algorithm. Again, further research will be needed in order to look into the effect of the size of the reference set. The generating values were sampled from a normal distribution, using the norm function from the stats package in R (R Core Team 2020), with a mean of 0 and SD of 2.12, which was equal to the rank order from Study 1. In general, because of restrictions in the estimation procedures (Bradley, 1976; Molenaar, 1995; Verhavert 2018), CJ assessments result in ability estimates that average to 0. Therefore, the sampled ability values were transformed to average 0. The resulting SD was 2.13. From these generating values, 20 ability values were selected as the theoretical abilities of so-called new representations. First, we selected two representations that have a high probability of winning or losing all comparisons. For this, the third highest ability value and the third lowest ability value were selected. The remaining 18 ability values were selected so that the distance in logits between consecutive new representations is approximately equal. The average distance between consecutive ability values was 0.53 (SD = 0.06). The selected ability values had an SD of 3.15. All ability values that were not selected were used as the reference set. Because the abilities were sampled, it was not possible to use reference sets of different SSR levels. The generating values can be found in Supplementary Table S2 in the additional materials.
Simulation Study
Two CJ assessments were simulated. In the first, the RSB-ASA was used to construct the pairs. In the second, pairs were constructed using the SSA. As a reminder, this algorithm prefers representations with the least NCR that have not yet been compared with each other. The second CJ assessment was simulated in order to compare the results of an assessment implementing the RSB-ASA with the results of an assessment with a random selection algorithm, which is considered as a benchmark for CJ assessments.
In the assessment using the RSB-ASA, the same three stopping criteria were used as in study 1, namely the fixed stopping criterion, an estimated SSRi of 0.70 and an estimated SSRi of 0.90. However, the fixed stopping criterion was increased to 20 comparisons per representation. The preliminary estimate of the ability scores and the NCR of the selected representations were recorded per stopping criterion.
In the assessment using the SSA, it is less straightforward to implement the same stopping criteria as with the RSB-ASA because of two reasons. First, it has been shown that CJ assessments with the SSA only reach a reliability of 0.90 after around 37 comparisons per representation (Verhavert et al., 2019). Stopping after 20 comparisons per representation will lead to unreliable results. Second, calculating the estimated SSRi is not common for the SSA. Normally, the reliability is calculated over all representations, using the rank-order SSR as in formulas (6, 7). This might, however, give a biased result in comparison with the RSB-ASA. Therefore, two sets of stopping criteria were used. The first set served to increase the comparability of the results with those of the SSA. This set thus consisted of the estimated SSRi of 0.70, estimated SSRi of 0.90, and NCR of 20. The second set reflected more common practice using the SSA. It consisted of the rank-order SSR of 0.70, rank-order SSR of 0.90 and NCR of 37. The latter stopping criterion resulted in 4,070 comparisons in total. Preliminary (or intermediate) estimates of the ability scores and the NCR of the selected representations were recorded for every stopping criterion in both sets.
Both simulations were repeated 1,000 times. The simulation was conducted in and controlled by R (R Core Team, 2020).
Measures
As a measure of accuracy, the RMSE of the estimates of the 20 selected representations was calculated against the generating values in every replication for every stopping criterion in the RSB-ASA and the SSA. Ability scores were estimated using a joint maximum likelihood algorithm with an epsilon bias correction of 0.003 (for details, see Verhavert 2018). The RMSEs are discussed in the Results section and are presented in the figures, which are averaged over the replications. To measure the efficiency of the RSB-ASA and the SSA, for every replication, the median NCR was registered when either the estimated SSRi of 0.70 and 0.90 or the rank-order SSR of 0.70 and 0.90 was reached. Also here, the NCR discussed in the results were average over replications. Furthermore, to check for a possible inflation of the SDs, the SD of the ability estimates of the selected representations were calculated per stopping criterion in both the RSB-ASA and the SSA in every replication. Also, the discussed SD values are averaged over replications.
Results
As in Study 1, it is observed that the RMSE is the lowest for the fixed stopping criterion (here, 20 comparisons per representation) and the estimated SSRi of 0.90. Study 2 shows that this is independent of selection algorithm (Figure 6A). Contrary to Study 1, within the RSB-ASA, the fixed stopping criterion led to a lower RMSE than the stopping criterion estimated SSRi of 0.90, showing that a fixed stopping criterion produces the most accurate results. However, the difference in RMSE is merely 0.11. Within the SSA, both stopping criteria have equal RMSEs. Additionally, the RSB-ASA results in a lower RMSE than the SSA (average difference = 0.24; Figure 6A). This is, however, only the case when the stopping criteria of the RSB-ASA are used (i.e., an estimated SSRi or 20 comparisons per representation). When a rank-order SSR or a fixed stopping criterion of 37 comparisons per representation is used (more common with the SSA), there is no difference in RMSE between the RSB-ASA (Figure 6A) and the SSA (Figure 6B). Comparing the left set of bars in Figure 6A with the set of bars in Figure 6B shows that the apparent differences between the fixed stopping criteria (NCR 20 and NCR 37) or between the rank-order SSR and the estimated SSRi are not significant; the average value falls within each other’s 95% CI.
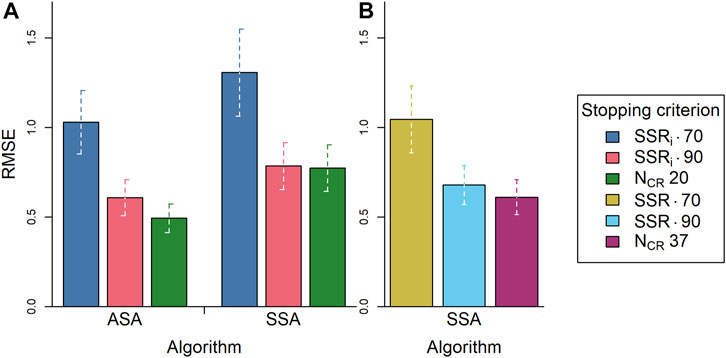
FIGURE 6. The root mean squared error (RMSE; n = 20) averaged over simulation repetitions (n = 1,000) per algorithm (ASA, SSA) and per stopping criterion [colors; (A) SSRi 0.70, SSRi 0.90, NCR 20; (B) SSR 0.70, SSR 0.90, NCR 37] with 95% confidence intervals (n = 1,000). Note: Panel B contains only SSA data. ASA = adaptive selection algorithm; SSA = semi-random selection algorithm; SSRi = estimated reliability; NCR = number of comparisons per representation; SSR = rank-order reliability.
Figure 7A shows that there is no difference in SD of the ability estimates between stopping criteria within algorithms. The SSA does, however, lead to a slightly lower SD overall than the RSB-ASA. There is no difference between this SD and the SD of the generating values of the selected representations (3.15 as mentioned above; dashed line in Figure 7) except for the stopping criterion estimated SSRi of 0.70 with the SSA, which is lower. With more common stopping criteria for the SSA (rank-order SSR of 0.70 or 0.90 or 37 comparisons per representation; Figure 7B) the SDs of the ability estimates are much smaller. The stopping criterion rank-order SSR of 0.70 with the SSA leads to an SD of ability estimates that is a bit larger than the other two common stopping criteria. This SD is still not as large as with the estimated SSRi or NCR is 10 stopping criteria. It thus appears that the stopping criteria more common for the SSA, cause the results to shift toward the mean.
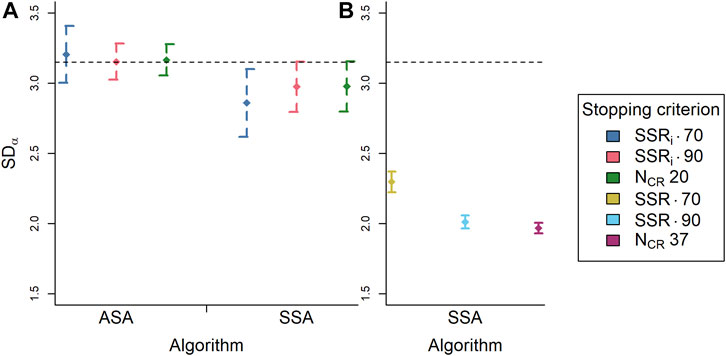
FIGURE 7. The standard deviation of the ability estimates (n = 20) averaged over simulation repetitions (n = 1,000) per algorithm (ASA, SSA) and per stopping criterion [colors; (A) SSRi 0.70, SSRi 0.90, NCR 20; (B) SSR 0.70, SSR 0.90, NCR 37] with 95% confidence intervals (n = 1,000) and the standard deviation of the generating ability values of the selected representations (n = 20). Note: Panel (B) contains only SSA data. ASA = adaptive selection algorithm; SSA = semi-random selection algorithm; SSRi = estimated reliability; NCR = number of comparisons per representation; SSR = rank-order reliability; dashed line = SD of generating values to be placed back (n = 20).
Figures 8A, B show that with both the SSA and the RSB-ASA the stopping criteria estimated SSRi and rank-order SSR of 0.70 need the least NCR on average. With the RSB-ASA, it appears that the stopping criterion estimated SSRi of 0.90 on average needs seven comparisons less than the stopping criterion NCR is 20. Besides, the stopping criterion estimated SSRi of 0.90 needs more than 10 comparisons per representation, showing that the fixed stopping criterion in Study 1 was too low. Furthermore, with the SSA, the stopping criterion estimated SSRi of 0.90 needs 20 comparisons per representation, which is higher than with the RSB-ASA. This again shows that the RSB-ASA is more efficient. In addition, looking at common stopping criteria for the SSA (rank-order SSR of 0.70 or 0.90 or NCR is 37), the SSA needs more NCR compared with when the RSB-ASA is used. However, because of the incomparability of the estimated SSRi and the rank-order SSR, no firm conclusions can be drawn from this comparison. In the SSA, there is a difference in NCR between the stopping criteria rank-order SSR of 0.90 and NCR of 37. This shows that the fixed stopping criterion common for the SSA could have been lower.
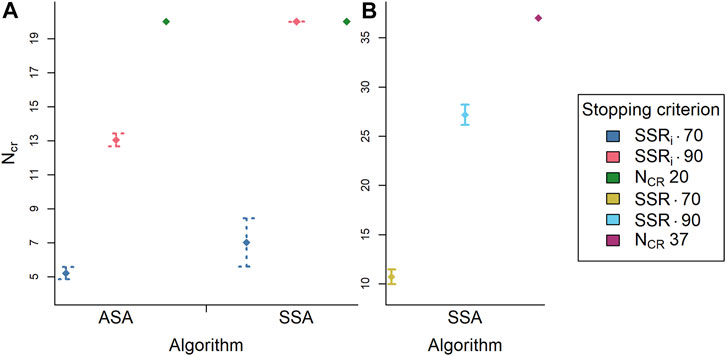
FIGURE 8. The median number of comparisons per representation (NCR; n = 20) averaged over simulation repetitions (n = 1,000) per algorithm (ASA, SSA) and per stopping criterion [colors; (A) SSRi 0.70, SSRi 0.90, NCR 20; (B) SSR 0.70, SSR 0.90, NCR 37] with 95% confidence intervals (n = 1,000). Note: Panel (B) contains only SSA data. ASA = adaptive selection algorithm; SSA = semi-random selection algorithm; SSRi = estimated reliability; NCR = number of comparisons per representation; SSR = rank-order reliability.
It was further observed that at 20 comparisons per representation the RSB-ASA reaches an average estimated SSRi of 0.93 (SD = 0.005). In comparison, the SSA reached an average estimated SSRi of 0.77 (SD = 0.05) at 20 comparisons per representation. This shows that the RSB-ASA results are more reliable. In addition, at 37 comparisons per representation, the SSA reached an average estimated SSRi of 0.88 (SD = 0.17), which is also lower than the average estimated SSRi with the RSB-ASA at 20 comparisons per representation. When the SSA reached a rank-order SSR of 0.70 and of 0.90, the estimated SSRi averaged 0.52 (SD = 0.13) and 0.84 (SD = 0.03), respectively. Based on the estimated SSRi, the estimates are less reliable compared with what we would expect based on the rank-order SSR. This seems contradictory because one would intuitively expect that the average estimated SSRi should approach or approximate the rank-order SSR. However, these two reliability measures are not directly comparable. This will be further elaborated in the discussion.
Discussion
The results of Study 2 confirm that the RSB-ASA produces more accurate results than the SSA when the stopping criteria for the RSB-ASA are used with both algorithms, even with a fixed stopping criterion of 20 comparisons per representation, which was higher than in Study 1. However, the stopping criteria for the RSB-ASA (i.e., estimated SSRi and 20 comparisons per representation) are not common practice for the SSA. When the stopping criteria common for the SSA (i.e., rank-order SSR and 37 comparisons per representation) were used, the results with the SSA were as accurate as those with the RSB-ASA. Furthermore, the RSB-ASA is also shown to be more efficient than the SSA, independent of the stopping criteria used, confirming the results of Study 1. Also, the stopping criterion estimated SSRi of 0.70 is the most efficient, independent of algorithm. In combination with the results on the accuracy of the estimates, this illustrates an efficiency-accuracy tradeoff. It needs to be kept in mind that these results leave aside the initial effort of calibrating the reference set.
It was also checked if the RSB-ASA causes an inflation of the SD, which might influence the usability of the estimated ability values. Although the results with the RSB-ASA are as accurate as those with the SSA when common stopping criteria are used for both algorithms, the RSB-ASA results in a higher spread of the estimates (as shown by a higher SD) compared with the SSA. When the results are compared with the SD of the generating values the RSB-ASA does not produce a higher spread of the results. An explanation for these apparently conflicting observations might be that the simulation study uses a perfect assessor. In other words, one whose judgments are exactly in accordance with the Bradley–Terry model. With the SSA and more comparisons per representation, this might cause the estimates to shift toward the mean. This effect should be further investigated.
A third large observation is that, dependent on the reliability measure (i.e., estimated SSRi and rank-order SSR), the estimates seem less reliable. This can be explained in two ways, both based in the way both reliability measures are calculated. First, the estimated SSRi was calculated using the SD of the so-called reference set. The rank-order SSR uses the SD of all representations (i.e. both the reference set and the new representation). This might lead to different results. A second explanation is that representations at the extremes of a rank order win or lose all their comparisons. This leads to a lack of information. It is unknown, respectively, how high or how low the actual ability score is. This results in a very inaccurate estimate, expressed in a high se value. This problem is commonly known as the separation problem in logistic regression (Kessels, Jones, and Goos 2013). The formula of the estimated SSRi, as calculated in (3, 4), only takes the se into account of one ability estimate, whereas the rank-order SSR, as calculated in (6, 7), takes the average se into account over all ability estimates. Therefore, the estimated SSRi for the extreme representations will be very small, thus lowering the average reported in Study 2.
General Discussion
The current research addresses the efficiency problem of CJ assessments when a (semi-) random pair selection algorithm is used. Therefore, a newly developed adaptive pair selection algorithm was proposed and tested. This algorithm, inspired by computerized adaptive testing and based on a suggestion by Bramley (2015), Bramley and Vitello (2019), made use of a calibrated reference set of representations which functioned as a measuring scale for new representations. In a real-life assessment (Study 1) and a computer simulation (Study 2), it was examined if the adaptive algorithm was more efficient and more accurate in its parameter retrieval compared with a semi-random algorithm.
Overall, both studies show that in comparison with a semi-random selection algorithm, the reference set based adaptive selection algorithm produces more accurate results. The reference set-based adaptive selection algorithm is also more efficient than the semi-random selection algorithm, as it requires fewer comparisons (per representation) to reach a comparable level of reliability. Independent of the selection algorithm, the stopping criterion estimated SSRi of 0.70 proves to be the most efficient (as measured by the number of comparisons per representation), whereas a fixed stopping criterion (10, 20, or 37 comparisons per representation) leads to the most accurate results (as measured by the RMSE). This shows that there is an efficiency–accuracy tradeoff. Based on the results of Study 2, it is advisable to use the estimated SSRi of 0.90 as a stopping criterion. The consideration can be made that a difference in RMSE of 0.11 is worth an increase of seven comparisons per representation. This does, however, depend on the number of representations and the number of assessors available. Each practitioner needs to decide this for themselves. Finally, on the basis of Study 1, it can tentatively be concluded that it is recommended to use a reference set that is as accurate as possible.
It should be remarked, however, that in the adaptive algorithm the reliability is calculated for single estimates and not for a rank order. In Study 2, it was observed that for the semi-random selection algorithm on average, the estimated SSRi is lower than the rank-order SSR. As already mentioned, these two reliability measures are, however, not completely comparable, namely, the formula for the estimated SSRi uses the SD of the ability estimates in the reference set whereas the rank-order SSR uses the SD of all representations (also the new representations). These observations do not detract from the conclusion that the reference set based adaptive selection algorithm is more efficient and accurate than the semi-random selection algorithm.
There is also an effect of the accuracy of the reference set used in the adaptive algorithm. Study 1 shows that the higher the accuracy of the reference set, expressed by the rank-order SSR of the reference set, the higher the accuracy of the assessment results. However, from a reference set SSR of 0.80 on there appears to be no further gain in accuracy of the assessment results. Additionally, the difference in accuracy between the stopping criterion estimated SSRi of 0.70 and the other two stopping criteria (SSRi = 0.90 and NCR = 10) decreases. This might be explained by the study setup. Because the order of the assessments was not counterbalanced between assessors, they might have been more tired when they reached the last session (with reference set SSR of 0.91). As a consequence, they might have made more mistakes. The adaptive algorithm does not allow to check if this is the case. In a semi-random algorithm, one could use the misfit statistics to see if an assessor made more errors in one assessment than in another10 or if they made more mistakes than other assessors. Misfit statistics suppose that an assessor receives pairs of representations covering a broad range of ability differences11 and that this range is approximately equal over assessors. This cannot be guaranteed with the adaptive algorithm described. In sum, it can be stated that with the current adaptive algorithm, a reference set with a reliability of at least 0.80 should be used.
Bramley and Vitello (2019) noted that adaptivity increases the spread of ability estimates. This means that adaptivity shifts ability estimates away from their true values. This is a problem when the ability estimates are used in a high stake assessment12. To check if the reference set based adaptive selection algorithm described in the current article suffers from the same issue, the standard deviation of the selected representations was calculated in the real assessment and for the generating values and the estimates in every replication of the simulation. The simulation study showed, contrary to Study 1, that there was no increase in standard deviation of the estimates in the reference set based adaptive selection algorithm compared with the generating values. This is probably because a reference set of representations with previously calibrated, and thus fixed, ability values are used. This helps to counter the missing information that adaptivity induces in other algorithms. However, it was observed that the standard deviation in the reference set based adaptive selection algorithm was higher than that in the semi-random selection algorithm when the more common stopping criteria (rank-order SSR and number of comparisons is 37) were used. This might be because in the simulation study a perfect assessor is used. Thus, collecting more comparisons might lead to a shift toward the mean for the results. Future research should look into this effect.
Some further remarks should be made regarding some limitations of this study and how these could be addressed by future research. First, it is recommended to use a reference set that is as accurate as possible (as expressed by its rank-order SSR). However, because the order of the reference sets in Study 1 was not counterbalanced, it cannot be conclusively shown that the reference set reliability should either be 0.80, 0.90, or as high as possible. This should be confirmed in future research.
Second, the first study is only a single observation. Thus, it cannot be excluded that random errors influence the results. It might be informative to see what the range in accuracy and efficiency is when such an assessment is replicated over time (within assessor groups) and over assessor groups. This should further strengthen the tentative conclusions. By extension, it might be interesting to see how the results with the semi-random selection algorithm replicate over time and assessor groups. As far as we know, an extensive replication study of CJ assessment has not been conducted yet.
Third, the reference set reliability was not included in the simulation study in order to keep things feasible. Therefore, the results regarding the reference set reliability in Study 1 were not replicated here. A simulation study where reference sets of different reliability are constructed and used in the simulation with the reference set based adaptive selection algorithm might confirm the observations in Study 1 and check if the adaptive algorithm would benefit from an extended calibration study as is common in CAT.
Finally, some questions can be raised on what a sufficient number of representations in the reference set could be. Therefore, it is possible to look for inspiration in CAT because the reference set in the reference set based adaptive selection algorithm can be considered a resembling the test items in CAT. Therefore, in the number of representations in the reference set should be high enough in order to have a broad enough ability range and ability values close enough to each other to reach accurate results. On the other hand, the number of representations should be low enough that, when creating (or calibrating) the reference set, the work is still feasible for the assessors. The current research did not focus, however, on what this means in regard of specific numbers. Future research might thus look into how the number of representations in the reference set influence the performance of the reference set based adaptive selection algorithm. This can be done by comparing reference sets of different sizes and/or different ability ranges.
Disregarding these limitations, the adaptive algorithm as described in the current article shows it is more efficient compared with random pair construction. If users are willing to do an initial investment, the reference set could be used for multiple assessments in the future. It might even provide possibilities for standardized CJ assessments. This does, however, support on the assumption that CJ can be used to compare performances on different tasks as long as these tasks assess the same competency, because repeating the same assessment task year after year might encourage cheating and teaching to the test. To our knowledge, this assumption has not yet been investigated. Besides, exercises for standard maintaining across consecutive years in national assessment that are using CJ might also benefit from this adaptive algorithm. As already mentioned in the introduction, only one scale from a specific assessment year would be needed. This means a gain in time and effort in the next years. In both applications, however, techniques for updating and maintaining the reference set should be devised and tested.
Data Availability Statement
The dataset analyzed in Study 1 cannot be made public, due to privacy restrictions in the “Contributors agreement” and related IB policy at the time of data collection. The data generated in Study 2 would produce very large files that are difficult to transfer. Because of IP restrictions, no working R code can be provided for the simulation. The results of every replication and the R code for the graphs and tables are freely available via the Zenodo repository: https://doi.org/10.5281/zenodo.5537019.
Ethics Statement
The studies involving human participants were reviewed and approved by the International Baccaloreate, Legal and Compliance department. Written informed consent to participate in this study was provided by the participants’ legal guardian/next of kin.
Author Contributions
SV, AF, and RB contributed to the conception and design of Study 1. AF conducted Study 1, including recruiting and coaching assessors, selecting representations, and creating reference sets. SV provided technical support and set up all assessments from Study 1. SV designed and ran Study 2, developed the adaptive algorithm and conducted all analyses for Study 1 and 2. SV wrote the first draft of the manuscript. AF wrote sections of the manuscript. All authors contributed to manuscript revisions, read, and approved the submitted version.
Funding
This research was co-funded by a larger project (D-PAC) funded by the Flanders Innovation and Entrepreneurship and the Research Foundation (grant number 130043) and by the International Baccalaureate.
Conflict of Interest
The authors declare that the research was conducted in the absence of any commercial or financial relationships that could be construed as a potential conflict of interest.
Publisher’s Note
All claims expressed in this article are solely those of the authors and do not necessarily represent those of their affiliated organizations, or those of the publisher, the editors, and the reviewers. Any product that may be evaluated in this article, or claim that may be made by its manufacturer, is not guaranteed nor endorsed by the publisher.
Acknowledgments
The authors want to thank the assessors of Study 1 for their time an effort.
Supplementary Material
The Supplementary Material for this article can be found online at: https://www.frontiersin.org/articles/10.3389/feduc.2021.785919/full#supplementary-material
Footnotes
1However, because of an inflated reliability coefficient the danger does exists that one places more confidence in the results than is warranted. It is always desirable to aim for results that are as close to the true ranking and rank order as possible.
2The rank-order SSR is commonly just referred to as the SSR. However, in this article we refer to it as the rank-order SSR in order to disambiguate it from the point or estimated SSR used further in this section.
3Notwithstanding that the (preliminary) ability values of the new representations i are estimated for all representations at once, it is possible to estimate the ability value of every representation i separately. This is possible because the ability values of the representations j in the reference set are fixed.
4Other variable stopping criteria are possible, like estimate stability and information gain (the difference between the maximum information value for this representation in this round and the maximum information value for this representation in the previous round). These other stopping criteria are topics for further research.
5In some subjects, the IB produces two different versions of an exam, with different variants going to different countries (with different time zones) in order to mitigate academic honesty risks.
6Currently named Comproved; https://comproved.com/en/.
7A round is defined as the moment where every representation has been in a pair an equal amount of times. With 20 representations this is after 10 comparisons, 20, 30, …
8The further apart representations in a pair are with regard to estimated ability score, the more severe the mistake.
9A comparison is more difficult when the representations in the pair lie closer together with regard to estimated ability score.
10Taken that across the assessments the representations are of the same quality and the assessors are comparable.
11Difference in true ability of the two representations in a pair.
12A high stakes assessment is an assessment where the results are used to make important decisions for the person under assessment, e.g., a pass-fail decision.
References
Bartholomew, S. R., Zhang, L., Bravo, E. G., and Strimel, G. J. (2019). A Tool for Formative Assessment and Learning in a Graphics Design Course: Adaptive Comparative Judgement. Des. J. 22 (1), 73–95. doi:10.1080/14606925.2018.1560876
Bouwer, R., Lesterhuis, M., Bonne, P., and De Maeyer, S. (2018). Applying Criteria to Examples or Learning by Comparison: Effects on Students’ Evaluative Judgment and Performance in Writing. Front. Educ. 3, 86. doi:10.3389/feduc.2018.00086
Bradley, R. A. (1976). A Biometrics Invited Paper. Science, Statistics, and Paired Comparisons. Biometrics 32 (2), 213–239. doi:10.2307/2529494
Bradley, R. A., and Terry, M. E. (1952). Rank Analysis of Incomplete Block Designs: I. The Method of Paired Comparisons. Biometrika 39 (3–4), 324–345. doi:10.1093/biomet/39.3-4.324
Bramley, T., Bell, J. F., and Pollitt, A. (1998). Assessing Changes in Standards over Time Using Thurstone Paired Comparisons. Educ. Res. Perspect. 25 (2), 1–24.
Bramley, T., and Gill, T. (2010). Evaluating the Rank‐ordering Method for Standard Maintaining. Res. Pap. Educ. 25 (3), 293–317. doi:10.1080/02671522.2010.498147
Bramley, T. (2015). “Investigating the Reliability of Adaptive Comparative Judgment,” in Cambridge Assessment Research Report (Cambridge, UK: Cambridge Assessment). Available at: www.cambridgeassessment.org.uk/Images/232694-investigating-the-reliability-of-adaptive-comparative-judgment.pdf.
Bramley, T. (2007). “Paired Comparison Methods,” in Techniques for Monitoring the Comparability of Examination Standards. Editors P. Newton, J.-A. Baird, H. Goldstein, H. Patrick, and P. Tymms (London, U.K: Qualifications and Curriculum Authority), 246–300.
Bramley, T., and Vitello, S. (2019). The Effect of Adaptivity on the Reliability Coefficient in Adaptive Comparative Judgement. Assess. Educ. Principles, Pol. Pract. 26, 43–58. doi:10.1080/0969594X.2017.1418734
Brignell, C., Wicks, T., Tomas, C., and Halls, J. (2019). The Impact of Peer Assessment on Mathematics Students’ Understanding of Marking Criteria and Their Ability to Self-Regulate Learning. MSOR Connections 18 (1), 46–55. doi:10.21100/msor.v18i1.1019
Crompvoets, E. A. V., Béguin, A. A., and Sijtsma, K. (2020). Adaptive Pairwise Comparison for Educational Measurement. J. Educ. Behav. Stat. 45 (3), 316–338. doi:10.3102/1076998619890589
Curcin, M., Howard, E., Sully, K., and Black, B. (2019). “Improving Awarding: 2018/2019 Pilots,” in Research Repport Ofqual 19/6575. Research and Analysis (Coventry, U.K: Ofqual). Available at: https://www.gov.uk/government/publications/improving-awarding-20182019-pilots.
Holmes, S. D., Meadows, M., Stockford, I., and He, Q. (2018). Investigating the Comparability of Examination Difficulty Using Comparative Judgement and Rasch Modelling. Int. J. Test. 18 (4), 366–391. doi:10.1080/15305058.2018.1486316
Jones, I., and Alcock, L. (2014). Peer Assessment without Assessment Criteria. Stud. Higher Educ. 39 (10), 1774–1787. doi:10.1080/03075079.2013.821974
Jonsson, A., and Svingby, G. (2007). The Use of Scoring Rubrics: Reliability, Validity and Educational Consequences. Educ. Res. Rev. 2 (2), 130–144. doi:10.1016/j.edurev.2007.05.002
Kessels, R., Jones, B., and Goos, P. (2013). “An Argument for Preferring Firth Bias-Adjusted Estimates in Aggregate and Individual-Level Discrete Choice Modeling,” in Research Report 2013 (Antwerp, Belgium: University of Antwerp, Faculty of Applied Economics). Working Papers.
Kimbell, R. (2021). Examining the Reliability of Adaptive Comparative Judgement (ACJ) as an Assessment Tool in Educational Settings. Int. J. Techn. Des. Educ. Online First. doi:10.1007/s10798-021-09654-w
Kimbell, R., Wheeler, T., Stables, K., Shepard, T., Martin, F., Davies, D., et al. (2009). E-scape Portfolio Assessment Phase 3 Report. London, U.K: Goldsmiths, University of London.
Laming, D. (2003). Human Judgment: The Eye of the Beholder. 1st ed. London, U.K: Cengage Learning EMEA.
Molenaar, I. W. (1995). “3. Estimation of Item Parameters,” in Rasch Models: Foundations, Recent Developments, and Applications. Editors G. H. Fischer, and I. W. Molenaar (New York, NY: Springer-Verlag), 39–51.
Newhouse, C. P. (2014). Using Digital Representations of Practical Production Work for Summative Assessment. Assess. Educ. Principles, Pol. Pract. 21 (2), 205–220. doi:10.1080/0969594X.2013.868341
Pollitt, A., and Murray, N. L. (1995). “What Raters Really Pay Attention to,” in Studies in Language Testing 3: Performance Testing, Cognition and Assessment. Editors M. Milanovic, and N. Saville (Cambridge, U.K: Cambridge University Press), 74–91.
Pollitt, A. (2012). The Method of Adaptive Comparative Judgement. Assess. Educ. Principles, Pol. Pract. 19 (3), 281–300. doi:10.1080/0969594X.2012.665354
R Core Team (2020). R: A Language and Environment for Statistical Computing. version 4.0.3. Vienna, Austria: R Foundation for Statistical Computing. Available at: www.R-project.org.
Thurstone, L. L. (1927). A Law of Comparative Judgment. Psychol. Rev. 34 (4), 273–286. doi:10.1037/h0070288
Thurstone, L. L. (1925). A Method of Scaling Psychological and Educational Tests. J. Educ. Psychol. 16 (7). doi:10.1037/h0073357
van Daal, T., Lesterhuis, M., Coertjens, L., van de Kamp, M.-T., Donche, V., and De Maeyer, S. (2017). The Complexity of Assessing Student Work Using Comparative Judgment: The Moderating Role of Decision Accuracy. Front. Educ. 2. doi:10.3389/feduc.2017.00044
Verhavert, S. (2018). “Chapter 2 Estimating the Bradley-Terry-Luce Model in R,” in Beyond a Mere Rank Order: The Method, the Reliability and the Efficiency of Comparative Judgment. Available at: https://repository.uantwerpen.be/docman/irua/c24160/155690.pdf.
Verhavert, S., Bouwer, R., Donche, V., and De Maeyer, S. (2019). A Meta-Analysis on the Reliability of Comparative Judgement. Assess. Educ. 26 (5), 1–22. doi:10.1080/0969594x.2019.1602027
Verhavert, S., De Maeyer, S., Donche, V., and Coertjens, L. (2018). Scale Separation Reliability: What Does it Mean in the Context of Comparative Judgment. Appl. Psychol. Meas. 42 (6), 428–445. doi:10.1177/0146621617748321
Keywords: comparative judgment, assessment, adaptive selection algorithm, adaptive, efficiency, reliability, accuracy, reference set
Citation: Verhavert S, Furlong A and Bouwer R (2022) The Accuracy and Efficiency of a Reference-Based Adaptive Selection Algorithm for Comparative Judgment. Front. Educ. 6:785919. doi: 10.3389/feduc.2021.785919
Received: 29 September 2021; Accepted: 14 December 2021;
Published: 09 February 2022.
Edited by:
Anders Jönsson, Kristianstad University, SwedenReviewed by:
Jeffrey Buckley, Athlone Institute of Technology, IrelandTom Bramley, Cambridge Assessment, United Kingdom
Copyright © 2022 Verhavert, Furlong and Bouwer. This is an open-access article distributed under the terms of the Creative Commons Attribution License (CC BY). The use, distribution or reproduction in other forums is permitted, provided the original author(s) and the copyright owner(s) are credited and that the original publication in this journal is cited, in accordance with accepted academic practice. No use, distribution or reproduction is permitted which does not comply with these terms.
*Correspondence: San Verhavert, c2FuLnZlcmhhdmVydEB1YW50d2VycGVuLmJl