 Leonora Kaldaras
 Kevin C. Haudek
- 1CREATE for STEM Research Institute, Michigan State University, East Lansing, MI, United States
- 2Department of Biochemistry and Molecular Biology, CREATE for STEM Research Institute, Michigan State University, East Lansing, MI, United States
Introduction: The Framework for K-12 Science Education promotes supporting the development of knowledge application skills along previously validated learning progressions (LPs). Effective assessment of knowledge application requires LP-aligned constructed-response (CR) assessments. But these assessments are time-consuming and expensive to score and provide feedback for. As part of artificial intelligence, machine learning (ML) presents an invaluable tool for conducting validation studies and providing immediate feedback. To fully evaluate the validity of machine-based scores, it is important to investigate human-machine score consistency beyond observed scores. Importantly, no formal studies have explored the nature of disagreements between human and machine-assigned scores as related to LP levels.
Methods: We used quantitative and qualitative approaches to investigate the nature of disagreements among human and scores generated by two approaches to machine learning using a previously validated assessment instrument aligned to LP for scientific argumentation.
Results: We applied quantitative approaches, including agreement measures, confirmatory factor analysis, and generalizability studies, to identify items that represent threats to validity for different machine scoring approaches. This analysis allowed us to determine specific elements of argumentation practice at each level of the LP that are associated with a higher percentage of misscores by each of the scoring approaches. We further used qualitative analysis of the items identified by quantitative methods to examine the consistency between the misscores, the scoring rubrics, and student responses. We found that rubrics that require interpretation by human coders and items which target more sophisticated argumentation practice present the greatest threats to the validity of machine scores.
Discussion: We use this information to construct a fine-grained validity argument for machine scores, which is an important piece because it provides insights for improving the design of LP-aligned assessments and artificial intelligence-enabled scoring of those assessments.
Introduction
The performance expectations described in the Next Generation Science Standards (NGSS) emphasize assessing a student’s ability to apply their knowledge instead of simply reciting back memorized information. The assessments capable of capturing this type of understanding are called performance-based assessments (National Research Council, 2014) because they require students to engage in authentic scientific practices like explanation, modeling, or argumentation and use relevant science ideas to explain phenomena and solve problems. These assessments focus on measuring knowledge application, which cannot be easily done using the traditional recall-based item format types (Krajcik, 2021). To accurately measure deep learning reflected in knowledge application ability, constructed-response (CR) assessments are needed (Krajcik, 2021; Kaldaras et al., 2021a). However, CR assessments are time-consuming and expensive to score and provide feedback for (Zhai et al., 2020b; Krajcik, 2021). Employing artificial intelligence (AI) and machine learning (ML) for scoring open-ended assessments represents a promising way of tackling the issue of effectively scoring and providing accurate and timely feedback to teachers and students (Zhai et al., 2020b).
Machine learning approaches have recently shown tremendous success in scoring short CR items in various STEM disciplines (e.g., Nehm et al., 2012; Liu et al., 2016; Noyes et al., 2020) with reliability close to that of human scoring. Additionally, ML-based scoring has been shown to be reliable and consistent with human scoring when measuring progression toward deeper understanding as reflected in learning progression-based assessments (Jescovitch et al., 2020). This feature is especially promising because the emphasis on developing and validating learning progressions (LPs) is central to the vision put forth by the Framework for K-12 Science Education (the Framework) and NGSS. Specifically, the Framework emphasizes a developmental approach to STEM learning, which states that building deep understanding requires time and appropriate scaffolding (National Research Council, 2012; NGSS Lead States, 2013; National Academies of Sciences, Engineering, and Medicine, 2019). The developmental approach is reflected in the idea of a LP that both the Framework and NGSS view as a cornerstone for developing coherent curriculum, assessment, and instructional approaches (National Research Council, 2012; NGSS Lead States, 2013). Learning progressions are defined as “successfully more sophisticated ways of reasoning within a content domain” (Smith et al., 2006). However, while the Framework and NGSS outline possible theoretical LPs, the design and validation of LPs have largely been outside the scope of both documents (National Research Council, 2012; Kaldaras, 2020).
Designing machine-based scoring approaches which employ AI methods for performance-based assessments aligned to LPs presents an invaluable tool for conducting quick and efficient validation studies and the possibility of assessing knowledge-in-use (Krajcik, 2021). Historically, human-based scores have been used as the gold standard against which the validity of machine-based scores has been evaluated and are used to both train and evaluate machine scoring (Clauser et al., 2002; Yang et al., 2002; Williamson et al., 2012; Rupp, 2018). However, to fully evaluate the validity of machine-based scores, it is important to investigate the consistency between human and computer scores beyond simple agreement on observed scores (Williamson et al., 2012; Rupp, 2018). Importantly, no formal studies have been done on investigating the nature of disagreements between human and machine-assigned scores as related to LP levels. This is an important piece of validity evidence to consider because even for well-functioning ML-based automatic scoring models, a certain percentage of cases where machine and human scores show disagreement always exists. We argue that understanding the types and aspects of NGSS constructs that ML algorithms struggle to score is vital both for improving ML and further AI approaches used for scoring LP-aligned performance assessments and ensuring that the intended use of machine scores is on par with the degree of accuracy of student performance they can offer.
In this work, we will use quantitative and qualitative approaches to investigate the nature of disagreements among the human and two types of machine-based scores using a previously validated LP for scientific argumentation and assessment instrument (Wilson et al., in press). We will identify items with a significant percentage of disagreements using quantitative methods, and then conduct a qualitative analysis of misscores to determine which aspects of the construct of scientific argumentation tend to be misscored and how these misscores relate to the LP. We use this information to construct a fine-grained validity argument for machine scores.
Literature review
Validation of machine-based scores
Recent studies have produced high agreement between human and machine scores as related to LP levels focusing both on human-machine agreement among observed scores (Anderson et al., 2018; Jescovitch et al., 2020), and latent ability level agreements obtained using item response theory (Wilson et al., in press). Past studies also looked at the validity of machine-assigned scores for science assessments, although not directly aligned to an LP (Liu et al., 2016; Mao et al., 2018).
There are various validity measures, including the agreement on observed and latent ability levels that need to be considered when making inferences based on machine-assigned scores. These measures have been broadly described in several detailed reviews (Bennett and Bejar, 1997; Clauser et al., 2002; Yang et al., 2002; Bejar, 2011; Williamson et al., 2012; Rupp, 2018; Zhai et al., 2021). All these reviews highlight a common issue of validity pertain to factors which are unique to the machine scoring process as opposed to the human scoring process. In this regard, it is important to recognize that earlier approaches to machine scoring utilized methods that required direct programming of certain rules or functions that were derived from expert ratings of assessment items (Clauser et al., 2002; Yang et al., 2002). With advances in technology, these approaches are being replaced with different types of ML algorithms which do not require rules to be directly programmed, but instead rely on various statistical techniques (e.g., classification algorithms) for producing machine scores (Rupp, 2018). The scoring tool used in this study falls into the latter category.
The automated text scoring tool applied in this study has been described before (Jurka et al., 2013), and uses several common ML algorithms to produce scores using a supervised ensemble ML approach (Jescovitch et al., 2020). This ML-based scoring approach falls into a “black box” category as described by Rupp (2018), which means that the relationship between the input and the final prediction is not directly interpretable. The implication for the resultant scores is that it is often impossible to directly explain why certain scores were assigned. However, this can be a common shortcoming of both rule-based and ML-based algorithms, to different degrees (Rupp, 2018). We will present a series of methods pertaining to the development and validation stages of automated scoring that aim to ensure the machine scores represent the construct of interest to the best degree possible.
Developing rubrics for LP-aligned performance assessment for ML scoring
One of the main challenges in applying ML approaches to score LP-aligned performance assessments is developing rubrics that can both accurately capture the complex constructs measured by the assessments and yield high inter-rater reliability (IRR) between human and machine scores. Generally, holistic rubrics are used to assign a score to a given response, which, in turn, is aligned to a specific LP level (Wilson, 2009; Kaldaras et al., 2021a, 2021b). Holistic rubrics in this context mean polytomous rubrics intended to assess the overall quality of a response with a single score (Tomas et al., 2019). For holistic rubrics aligned to LPs, each level in the rubric is designed to capture a distinctive set of knowledge application skills within the LP. In contrast, a number of automatic scoring applications rely on analytic rubrics for scoring student responses (Liu et al., 2014; Moharreri et al., 2014; Sieke et al., 2019). Analytic rubrics are a series of binary or dichotomous rubrics that identify the presence or absence of construct relevant ideas in student responses. Scores generated by both holistic (Anderson et al., 2018;) and analytic approaches (Sieke et al., 2019; Wang et al., 2021) have been used to produce well-functioning ML models for short, science CR items.
A key study comparing analytic and holistic approaches to human coding for LP-aligned assessments found that training sets based on analytically coded responses showed equal or better ML model performance as compared to using holistic scores in training sets (Jescovitch et al., 2019, 2020). However, this study did not examine construct validity beyond looking at agreement indexes nor examine the nature of disagreements between human and machine scores. Another study deconstructed holistic rubrics into a series of analytic rubrics for middle school science assessment items, which were recombined into a single holistic score, which then was used to train the computer. The Spearman’s rank correlation for human-computer agreement showed moderate to high agreement levels (Mao et al., 2018). However, this study did not examine differences between holistic and analytic coding approaches with the model results only reported at the holistic level. In this work, we will explore the validity of both holistic and analytic ML-based scores as related to the LP levels.
Theoretical framework
We adopt the most current definition of validity as the unitary concept reflecting the degree to which all the accumulated evidence supports the intended interpretation of test scores for the proposed use (American Educational Research Association, 2018). The test scores used in this study were obtained for LP-aligned assessments, and the intended interpretation was to use the scores formatively to evaluate LP-level placement for individual students. The LP was focused on describing an increasingly sophisticated understanding of scientific argumentation consistent with NGSS. The intended use of scores generated by the machine and human was to evaluate student ability to develop scientific arguments as reflected in LP-level placement. The validity argument developed in this study focuses on validity of machine scores and consistency between human and machine scores as related to LP levels.
Yang et al. (2002) describe three approaches to validating machine-based scores which include: (1) relationships among scores generated by different scoring approaches; (2) relationship between test scores and external measures and (3) approaches focusing on the scoring process. This work will use approaches 1 and 3, specifically focusing on comparing machine scores to human scores on various argumentation elements along the LP levels.
LPs represent complex cognitive psychological frameworks that require complex validity arguments to support the framework (Clauser et al., 2002; Zhai et al., 2020a). Additionally, validating complex constructs combining scientific practices and content is a challenge in practice (Kaldaras et al., 2021b). This study provides an opportunity to tackle these issues because prior validation work was done for the LP-aligned assessment instrument (Osborne et al., 2016; Wilson et al., in press).
In this study, we build on this previous work by focusing specifically on the validity of machine-based scores to different elements of the argumentation construct. Table 1 shows the elements of the argumentation construct targeted at every sub-level of the LP. In general, the structure of the argument is shown as C-W-E, where “C” is a claim, “W” is a warrant, and “E” is evidence. Briefly, level 0 is characterized by the ability to construct and identify claim and evidence, level 1 by the ability to identify and construct a warrant to relate claim and evidence which results in a complete argument, and level 2 by constructing a full comparative argument (see Table 1 for more detail). To achieve higher levels, a series of developmental steps reflecting the ability to integrate the argumentation elements into a broader argument needs to occur.
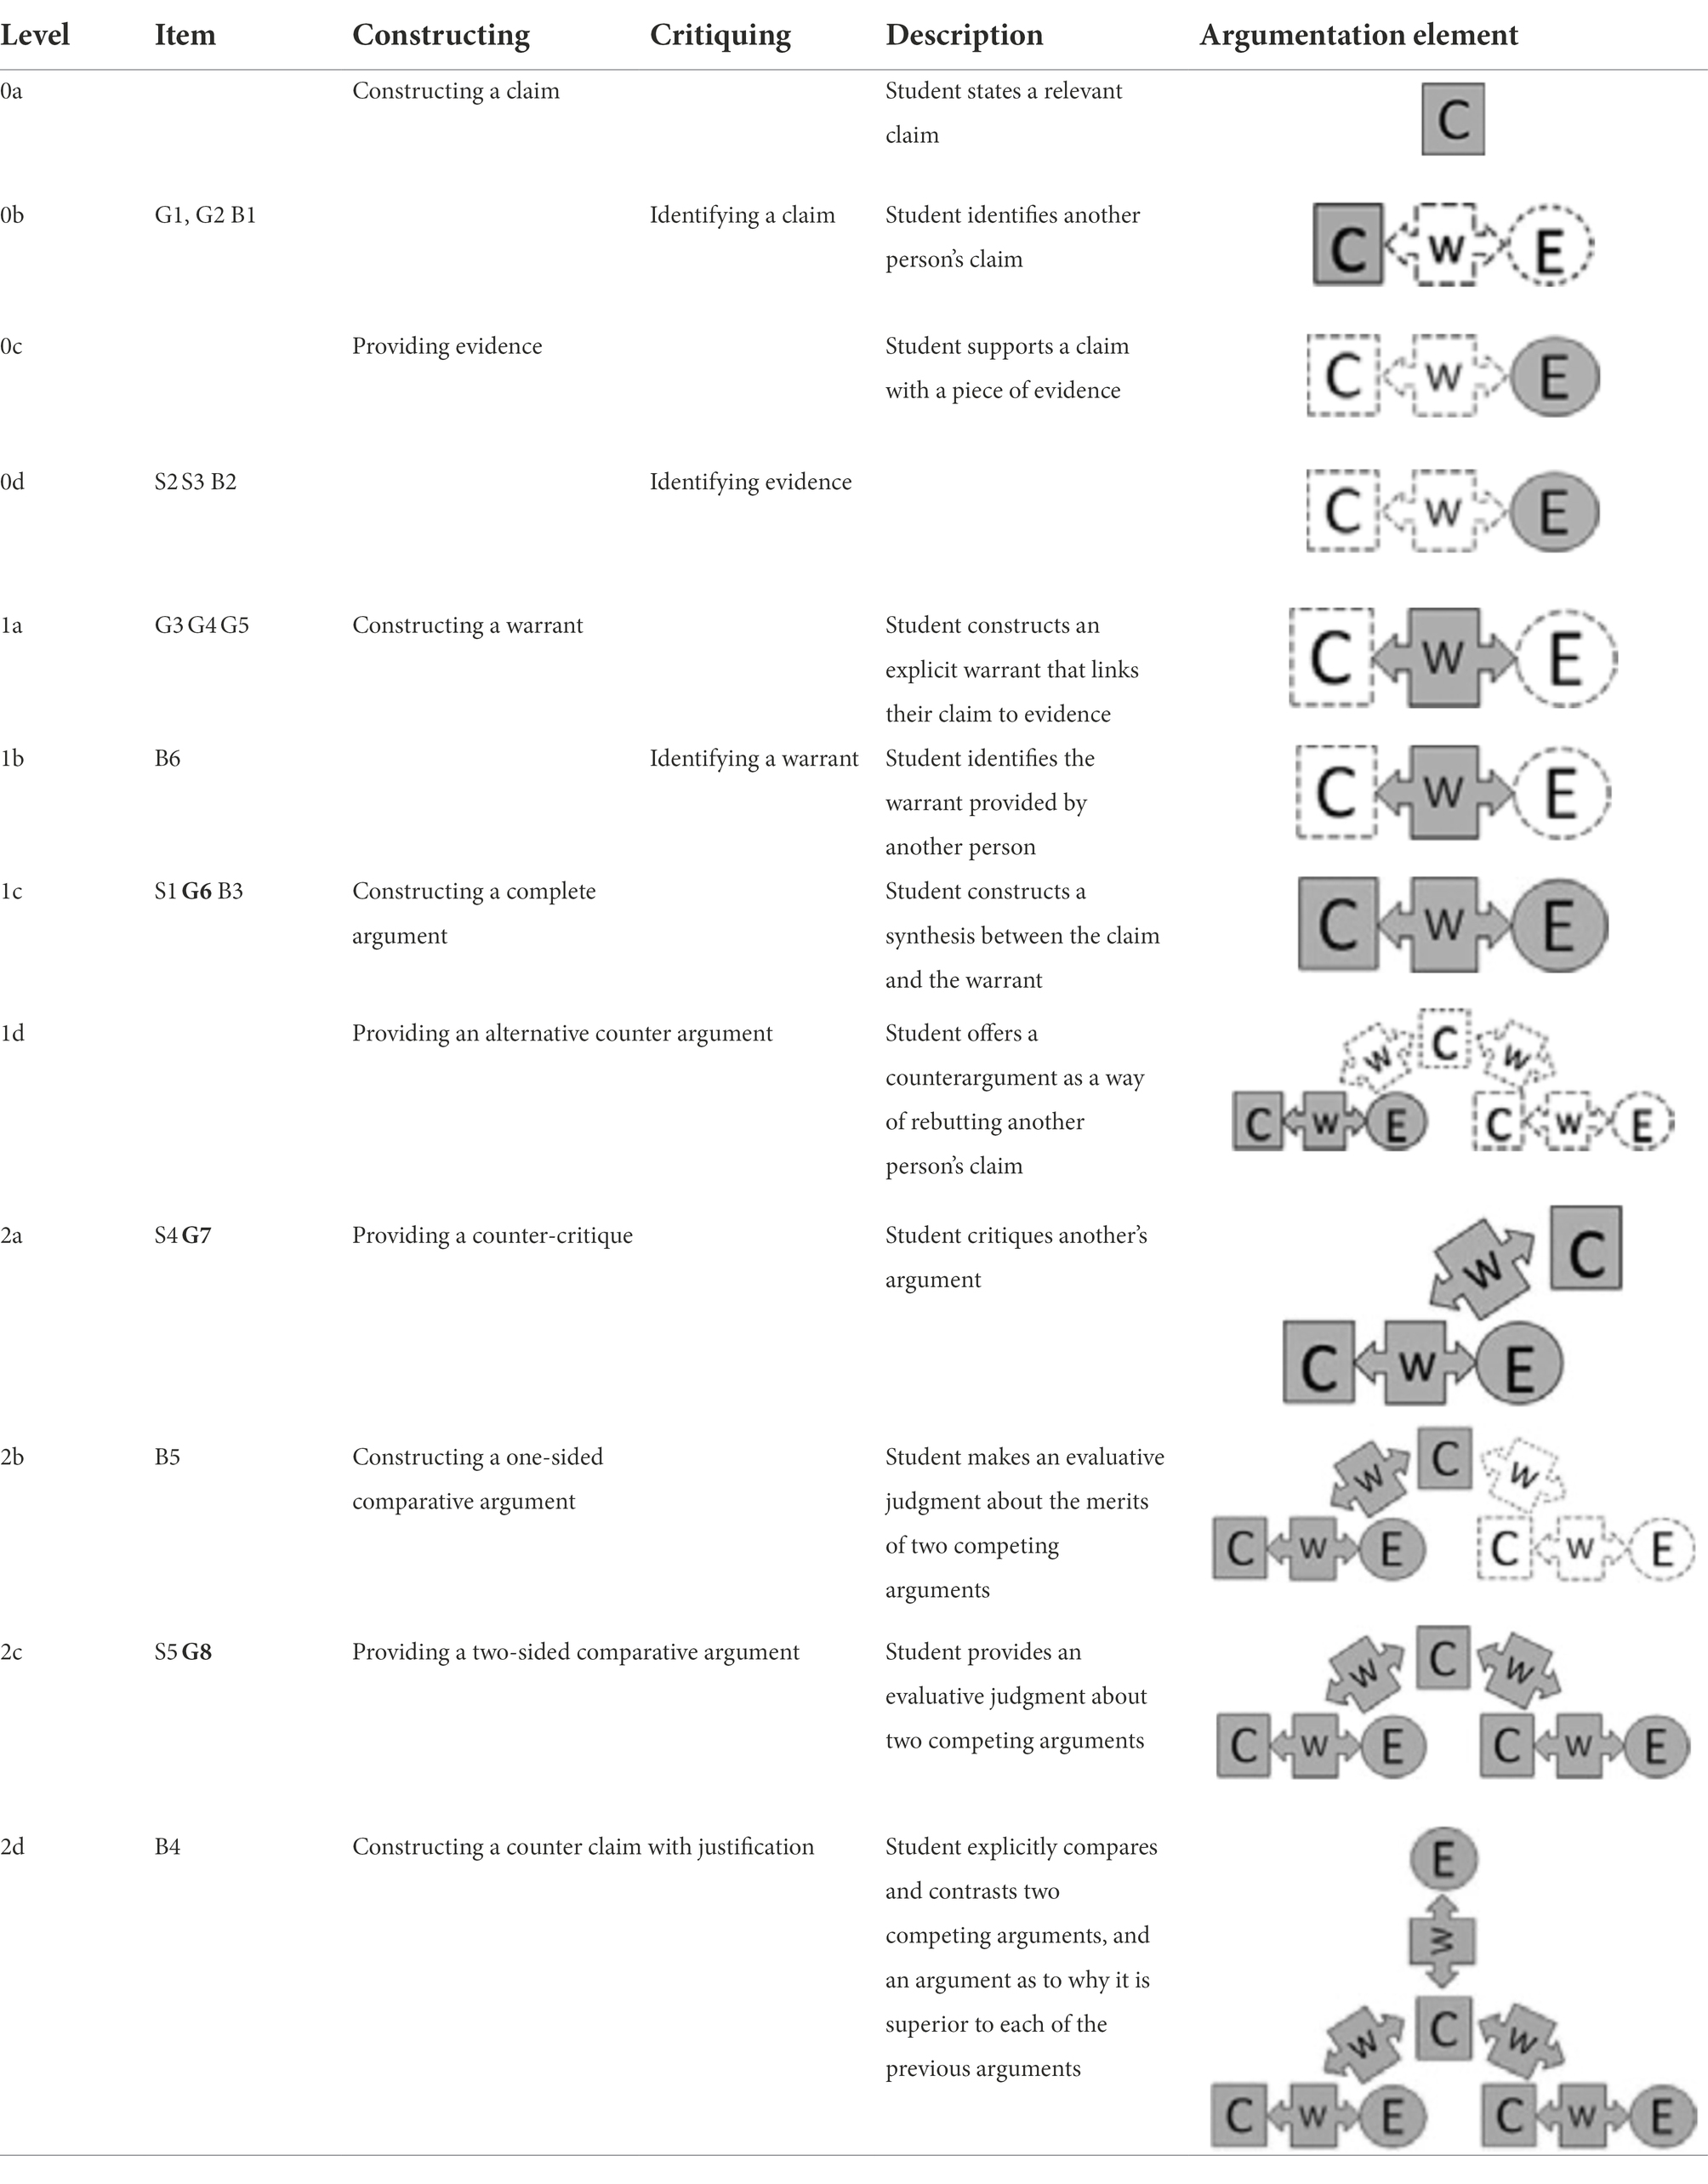
Table 1. Scientific argumentation construct map (after Osborne et al., 2016).
The focus of the current study is to examine machine-assigned scores of each of the specific argumentation elements and to evaluate the consistency between human and machine scores. The consistency will first be evaluated at the observed score level using agreement measures and generalizability among the scoring approaches, then at the true score level using confirmatory factor analysis, which will provide both internal latent structure validity evidence (American Educational Research Association, 2018) and scoring process validity evidence (Yang et al., 2002). The nature of disagreements between human and machine scores will also be evaluated qualitatively, which will contribute to the scoring process-based validity of machine scores (Yang et al., 2002).
Prior work
Validity of ML-based scores
As part of developing the ML models for the LP-aligned items, the research team evaluated the appropriateness of the ML algorithms and went through the necessary iterative process of exploring and optimizing model performance for each of the 19 assessment items (Wilson et al., in press). Additionally, the research team aligned scoring rubrics with LP levels and checked the rubric logic. Further for each item, we examined subsets of responses at each LP level to ensure the observed responses relate to the LP levels and that different levels of the rubric captured the different qualities of arguments. Therefore, we followed the necessary feature development steps (Rupp, 2018) to ensure that the construct of argumentation is captured by ML algorithms as accurately as possible. Based on this work, we argue that this aspect of the validity argument has been addressed in prior studies sufficiently.
Assessment instrument
Previous work has presented an LP for scientific argumentation in the context of the structure of matter (Osborne et al., 2016). Additionally, as part of previous work, high-quality performance-based, CR assessments were designed following a principled assessment design cycle (Urban-Lurain et al., 2015) to probe various LP levels (Wilson et al., in press). The final instrument contained 19 items, focusing on 3 different topics: Sugar, Bacteria, and Gases, all probing argumentation at different LP levels (see Table 1 for LP, items, and argumentation elements). The LP contains three broad levels of scientific argumentation (0–2), and each level contains four sub-levels (a–d); however, the items do not target every sub-level of the LP. This is because the focus of the instrument was to measure proficiency using performance tasks. Therefore, the developers aimed for all items to be authentic in presenting phenomena-based scenarios in which students would have to use multiple elements of argumentation practice.
Previous research provides evidence for the LP using both human and machine scores on a performance-based assessment, CR instrument. Specifically, the previous study has shown that machine scores generated using supervised ML algorithms for students’ written arguments have substantial to high agreement with observed human scores for all 19 items in the assessment instrument (Wilson et al., in press). Additionally, this previous study has demonstrated the validity of items as related to broad LP levels (i.e., Levels 0, 1, and 2) using only the highest response category for each item. As a result, valuable evidence for the validity of broad LP levels was presented. However, information related to the validity of machine scores was largely outside the scope of the previous study. In the current work, we now develop a validity argument for machine-based scores on different elements of argumentation practice generated using two machine scoring approaches: holistic and analytic. As part of previous work, analytic rubrics were used that focused on argumentation elements in the context of the item. However, analytic scores were not meaningful in the context of assigning responses to LP levels. Therefore, the researchers decided to recombine the analytic scores to yield a single holistic score for each response (Wilson et al., in press). Therefore, the rubric used for human scoring was completely analytic, but the generation of machine scores was done using two different ways by:
1. Training the computer on all analytic scores, which yielded machine analytic scores (MA) assigned to different elements of argumentation in responses. These scores were combined for each response to yield a single holistic score for a response to a given item.
2. Combining human scores on the analytic rubric elements and training the computer to predict a single holistic score for each item, which yielded a machine holistic (MH) score.
Research questions
Previously, researchers analyzed two types of machine-based scores (MA and MH) to determine whether there is a difference between these two approaches in terms of human-computer agreement for assigning LP-aligned scores on performance assessments. This work found that MA scores result in equivalent or slightly better machine-human agreement in assigning holistic scores for all items (Wilson et al., in press). However, previous work did not examine the nature of disagreements among MA, MH, and human scoring approaches by analyzing the argumentation elements at every level of the LP and the overall argumentation construct validity, which is the focus of this study. For the current study we address:
1. Are the three approaches (HH, MA, MH) consistent for assigning true and observed scores to student responses across all items and rubric levels within an item?
2. What is the nature of the misscores for MA and MH approaches and how do misscores associate with elements of argumentation at different learning progression levels?
Materials and methods
Item development and scoring
Short CR items used in this study were developed as part of a project focused on using ML automated scoring to assess middle school students’ scientific argumentation ability (Haudek et al., 2019; Wilson et al., in press). All items were aligned to the LP for scientific argumentation shown in Table 1 and reported earlier (Osborne et al., 2016). As mentioned above, the LP was designed to specifically describe competency with scientific argumentation, one of the NGSS scientific practices. In addition to measuring students’ competency with scientific argumentation, items probe specific disciplinary core ideas (DCIs) and crosscutting concepts (CCC) as outlined in NGSS. We collected responses from a total of 932 participating students in science classes from grades 5 to 8 (22 students in grade 5; 166 students in grade 6; 148 students in grade 7; 514 students in grade 8; 82 students undetermined grade level), although not all students answered all 19 items. We used all available responses for each item during machine learning model development to build a set of ML models, with models being unique to each item. We used the subset of responses from students that answered all 19 items for machine scoring validation. Each item probed one of the LP sub-levels, including a specific set of argumentation elements (Table 1). Coding rubrics for items were aligned to the LP and rubrics at the same sub-level were developed concurrently by researchers to ensure each rubric contained the appropriate elements of argumentation and incorporated necessary context of the items. Further, the coding rubrics incorporated key disciplinary ideas and cross-cutting concepts relevant to the topic of each item (Sugar, Bacteria, and Gases) for middle school science. Each rubric had a different number of possible levels to identify different qualities of student performances in the argumentation task. During coding of student responses, some rubrics were revised (e.g., redefining criteria to incorporate specific phrase usage) to address emergent issues during coding.
Example item and coding rubric
An example of an item (Sugar 5) developed to probe LP sub-level 2C is provided below.
At the end of the class, Laura and Mary argued:
Laura: “Some of the sugar left the water because when you mix sugar in water a chemical reaction causes some of the sugar to evaporate. This is why you cannot see the sugar after you mix it in the water: It is not there.”
Mary: “Because matter cannot be created or destroyed, the weight of the glass before and after mixing does not change. You cannot see the sugar after you mix it in the water because the sugar broke up in tiny pieces that you cannot see.”
Compare the two arguments and explain why one is stronger and why the other one is weaker.
Item Sugar 5 presents arguments constructed by two fictitious characters after they observed that sugar disappeared after being added to a glass of water. This item aligns to NGSS standards for middle school science. The assessment item focuses on the DCI of Structure and Properties of Matter and Chemical Reactions, the CCC of Patterns, and focuses on the SEP of constructing argument from evidence (as do all the items designed to probe the LP in this study). The item is part of the Sugar testlet, and requires Claim (C), Evidence (E), and Warrant (W) elements associated with evaluating two competing arguments. For this study, the warrant element of the argumentation practice always contains a reasoning aspect, and for some items may also contain an element of argument critique.
The analytic rubric used by human coders to score the responses is shown in Table 2. For this item, the warrant was conceived to consist of a reason supporting the student’s claim and a critique of the other character’s argument. Note that multiple student-supplied claims and reasoning were considered appropriate for this item. Each argumentation element was coded as present in or absent from the student answer (score of 0 or 1, respectively). To obtain holistic scores that relate to performance at the LP level, the dichotomous scores were combined following rules specific for each item to yield a single holistic score. Table 3 shows how components were combined to yield a holistic score for item Sugar 5. Note that since multiple claims and reasoning were identified in the analytic rubric, these components were sometimes redundant in the holistic score level. For example, for a holistic score of 3, a student could use either type of valid reasoning, but was not required to use both.
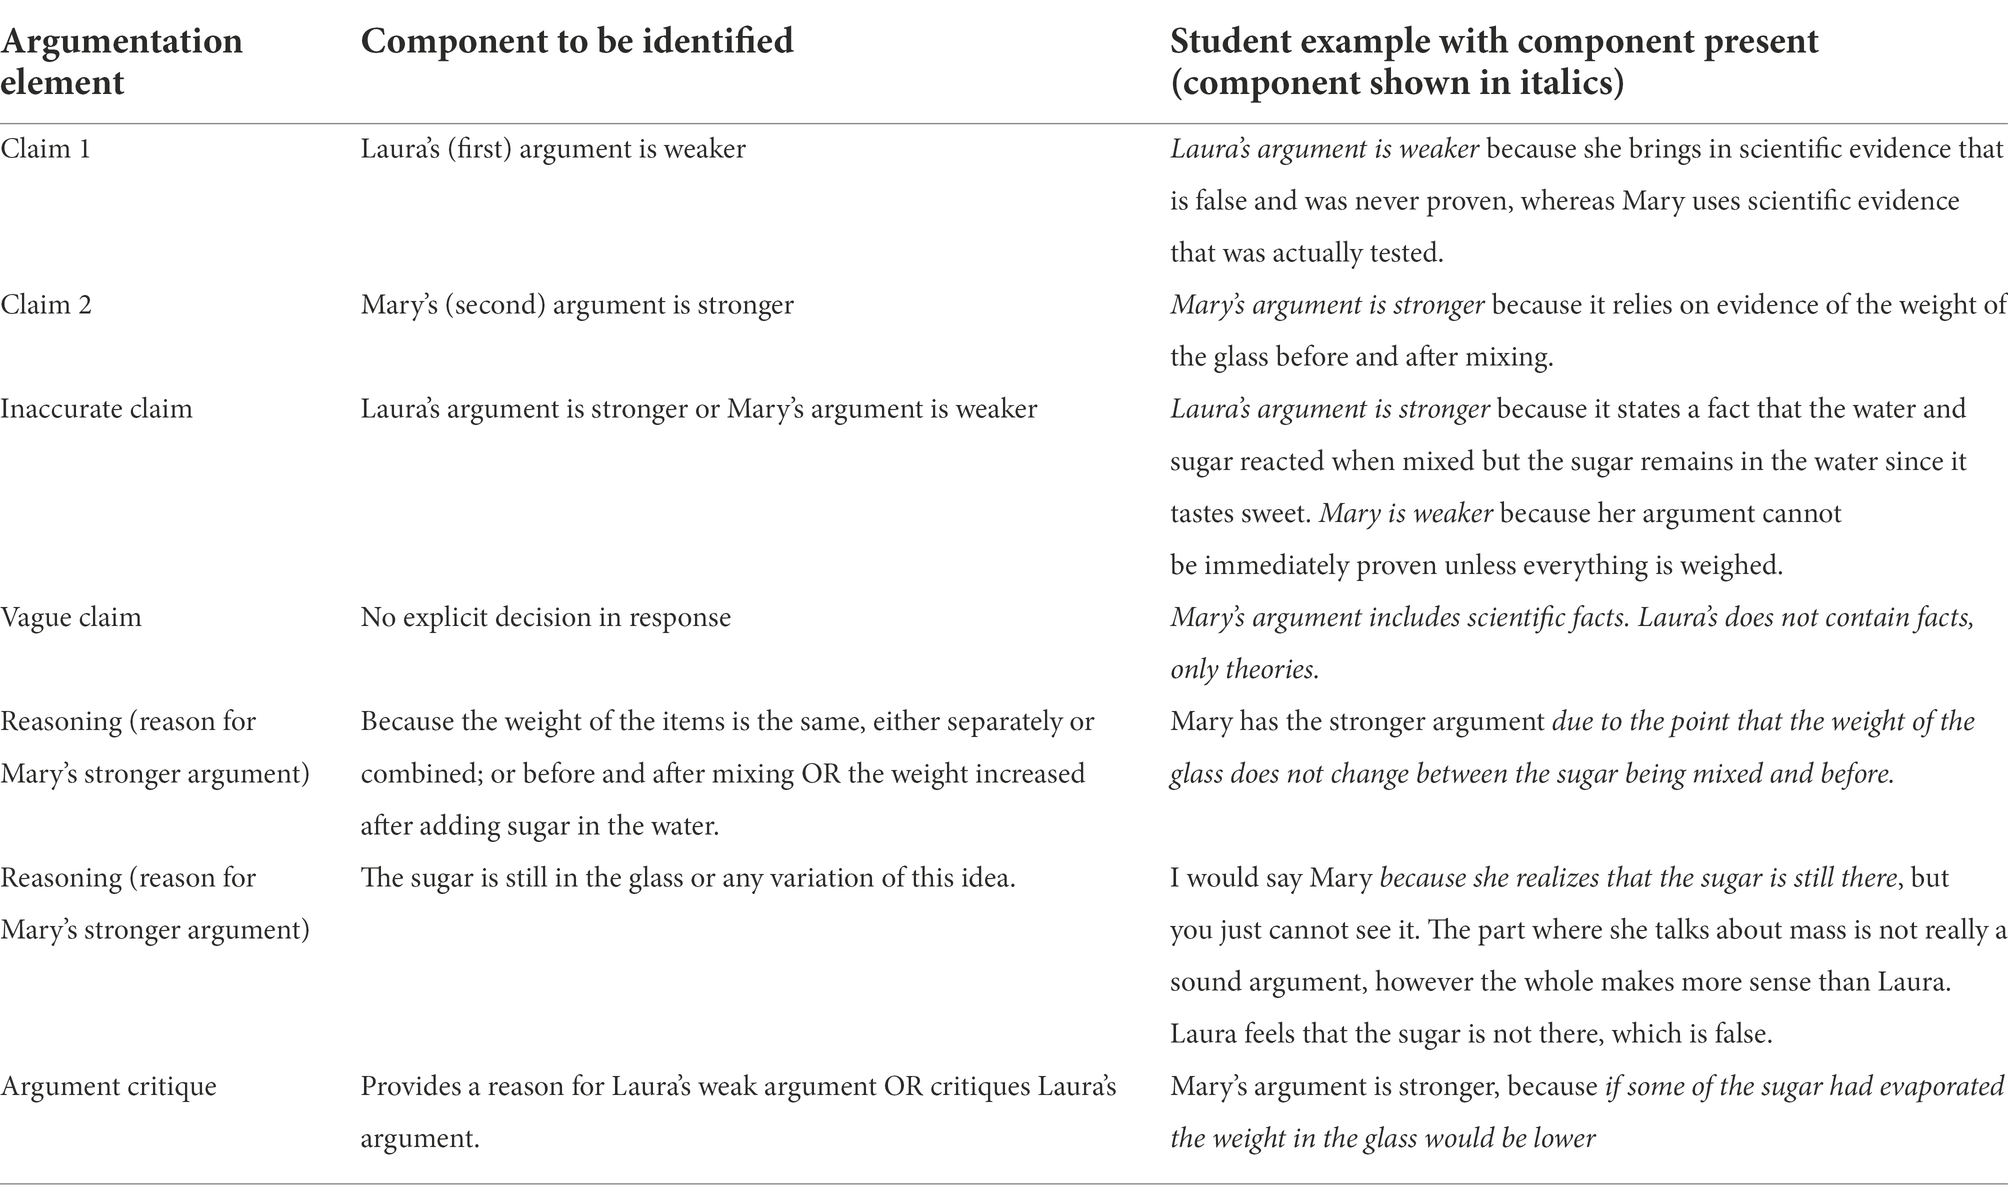
Table 2. Coding rubric for item sugar 5.
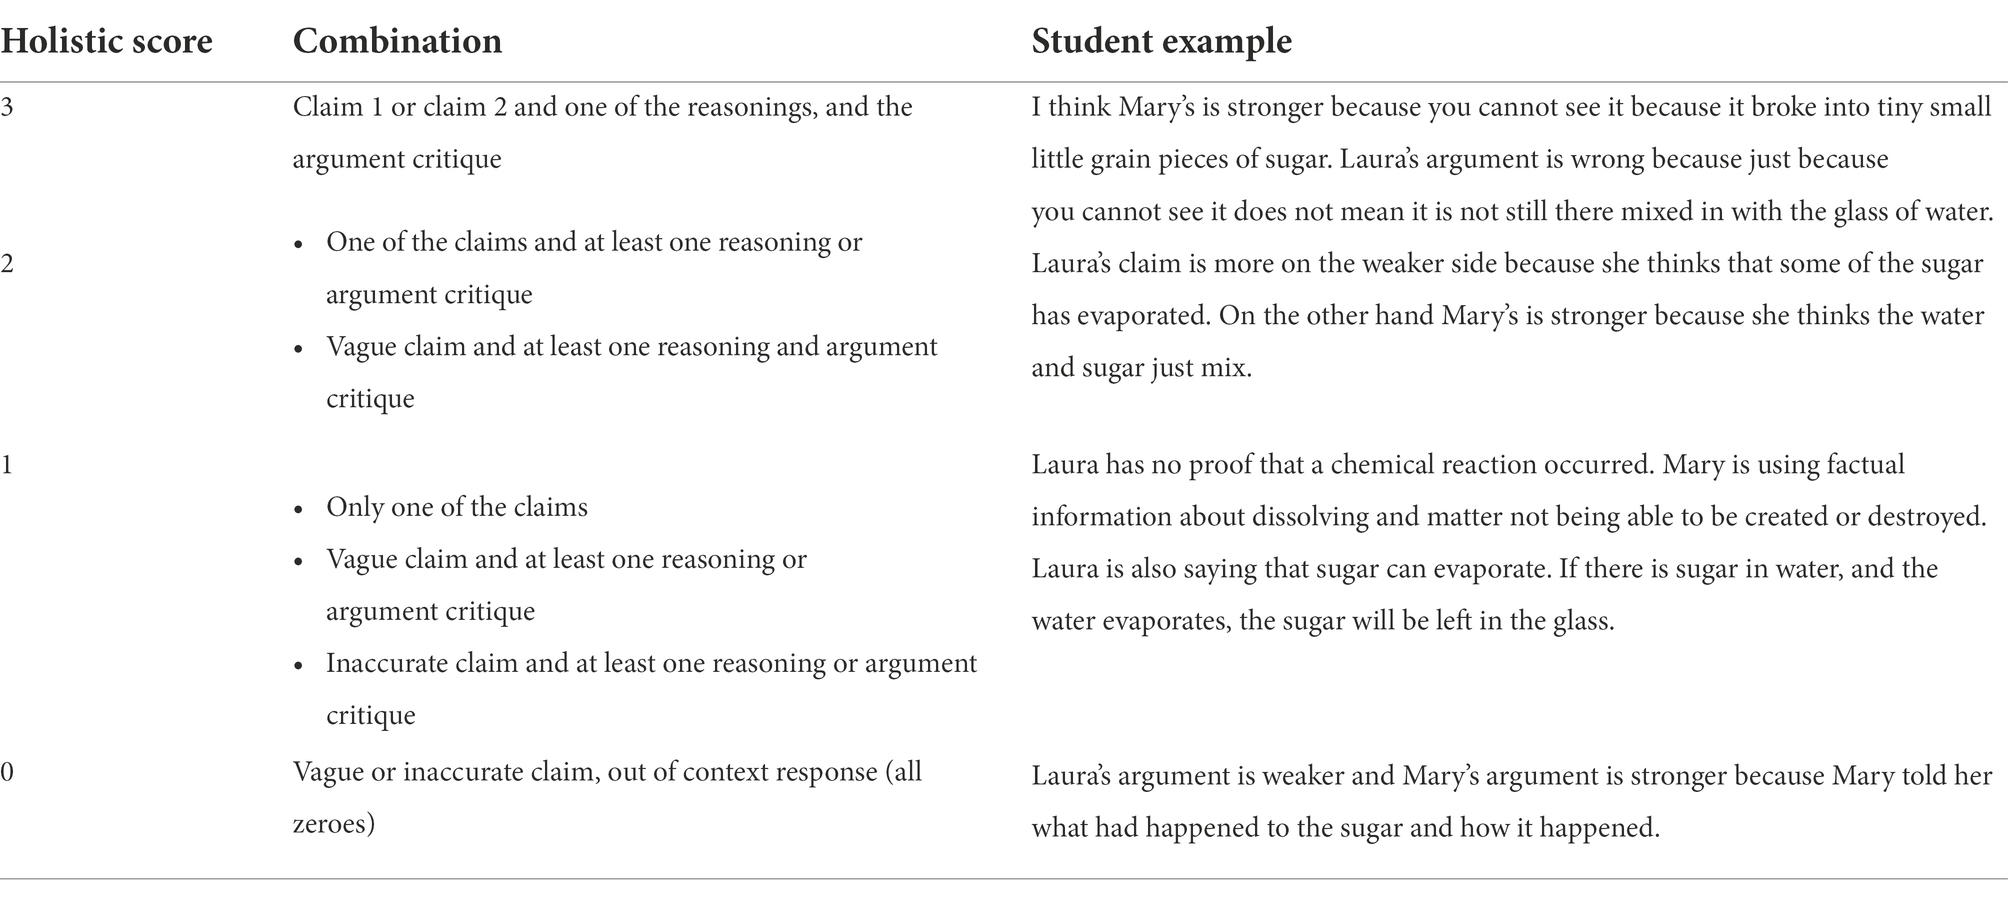
Table 3. Holistic scores for item S5 by the combination of components.
Machine learning model development
Machine learning model development was performed separately on each item using both holistic and analytic scoring approaches using the Constructed-Response Classifier tool (CRC; Jescovitch et al., 2020). In short, the CRC tool is based on RTextTools (Jurka et al., 2013) for text processing using a bag-of-words classification approach to natural language processing and allows some feature engineering. The extracted text features are then used as inputs for a series of eight machine learning classification algorithms. The CRC employs an ensemble model method which utilizes multiple classification algorithms to make a prediction for each response, for each rubric (Sieke et al., 2019). The machine-predicted scores are then compared to the human-assigned score in a cross-validation approach for each item to evaluate performance. The number of human-scored responses in the training set varied by item (Table 4). The IRR among human scorers was determined prior to machine scoring and followed an iterative procedure until a Cohen’s kappa or Krippendorff’s alpha of 0.8 was achieved for all items or until three rounds of training and discussion were completed. The detailed coder training procedure and reliability is described earlier (Wilson et al., in press).
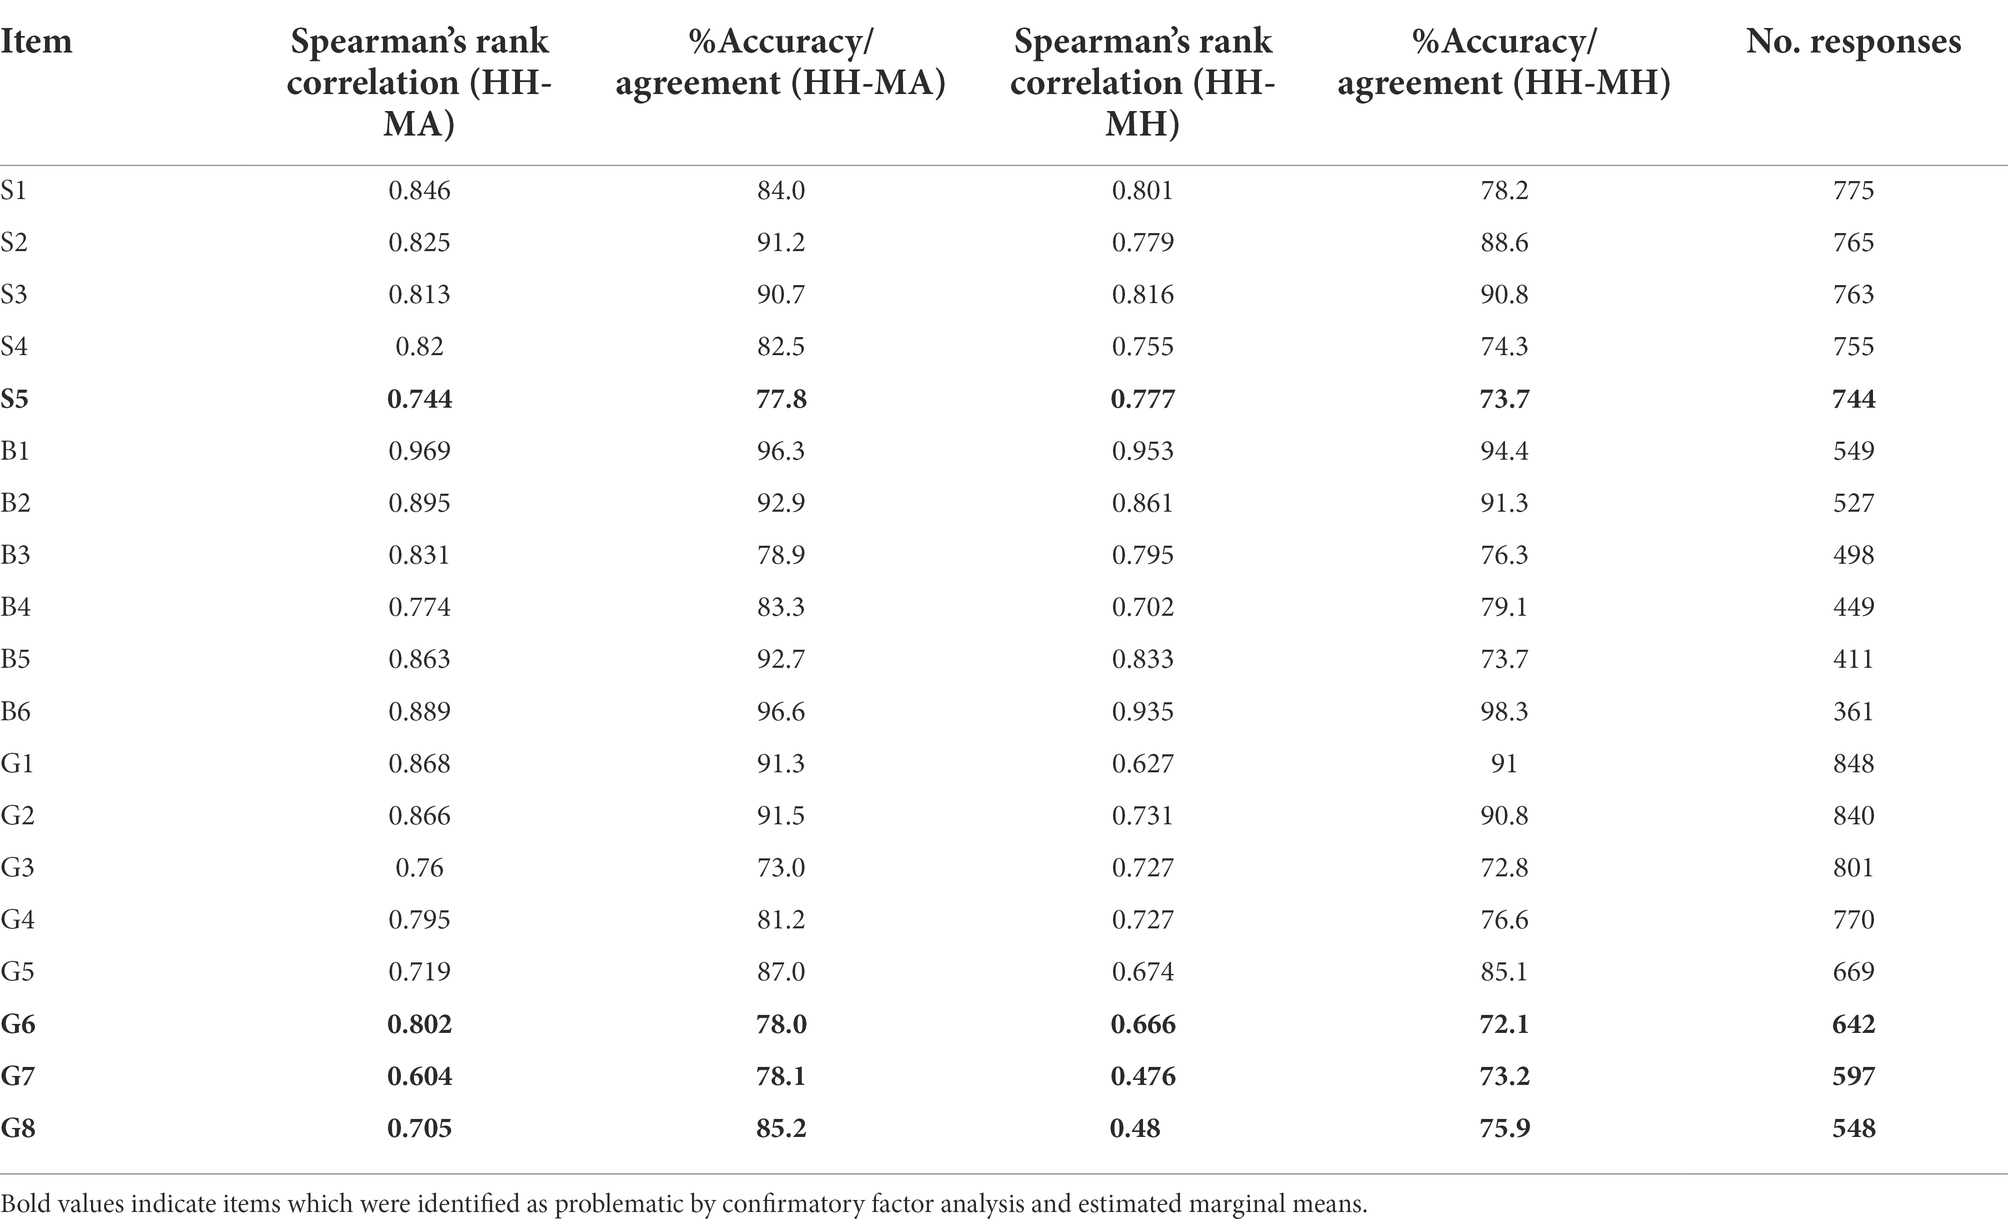
Table 4. Correlation and agreement measures.
The MA-predicted scores were derived from a ML model trained using the human scores obtained using the analytic rubric, with the resulting MA score for each of the relevant argumentation components. The MH-predicted score was derived from a ML model trained using the human scores obtained using a holistic code, resulting from a combination of component analytic scores. As a result, two types of machine scores were predicted for each response to every item. This process is illustrated in Figure 1.
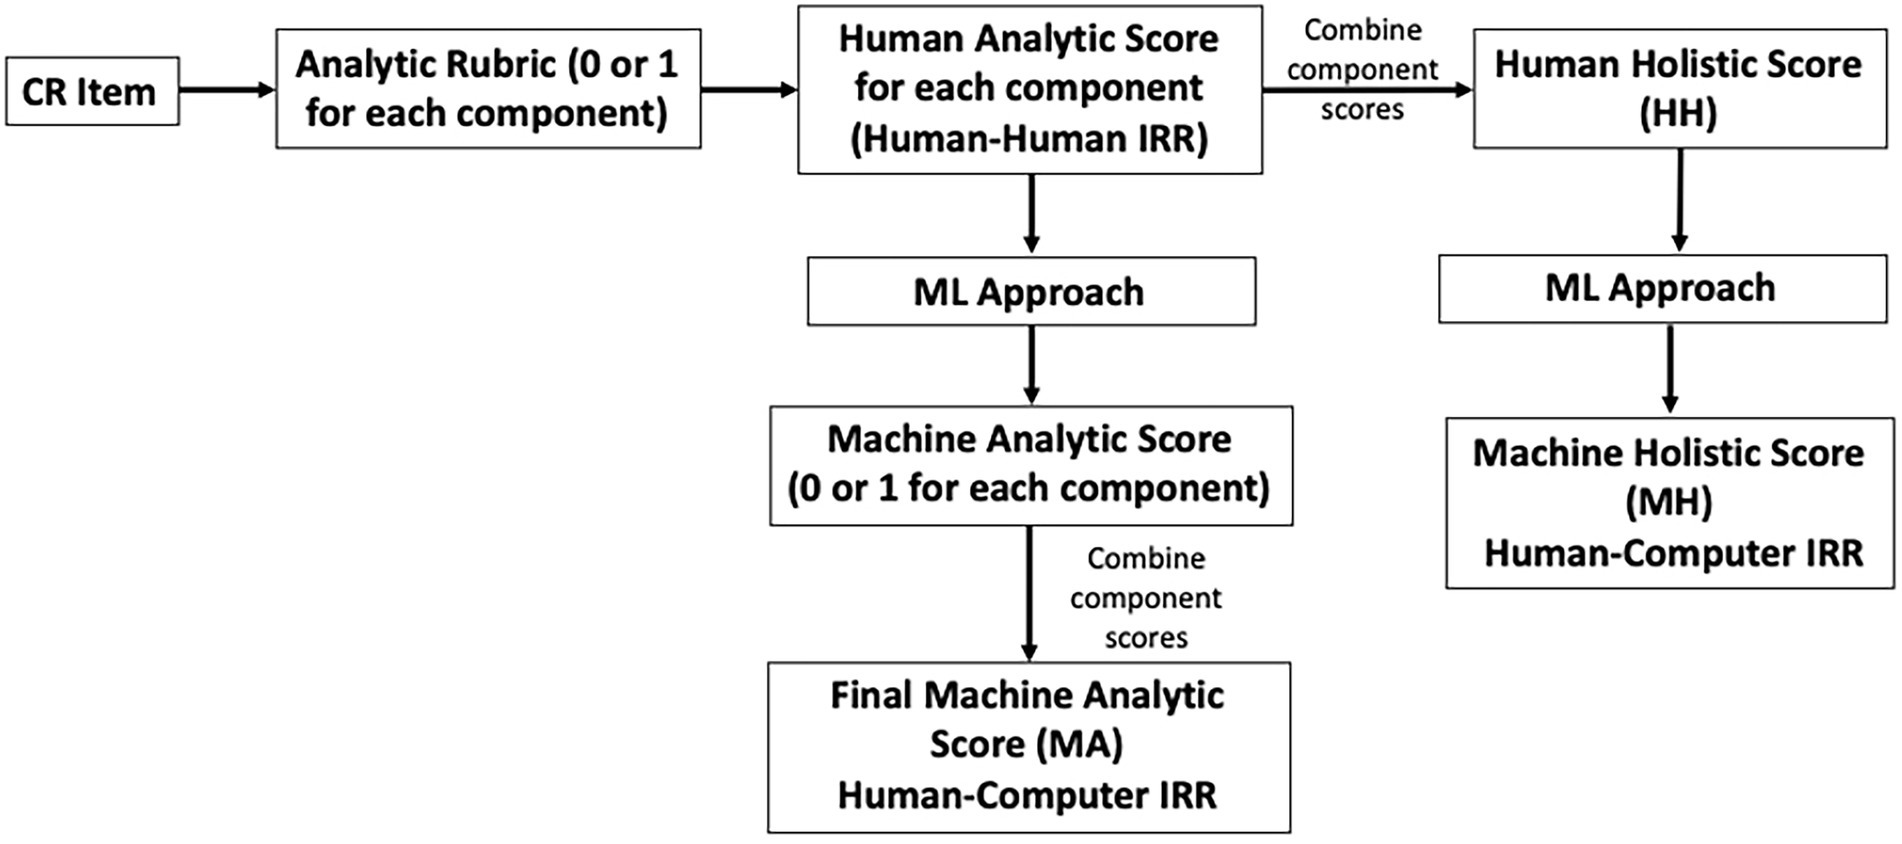
Figure 1. Scoring process for obtaining human holistic (HH), machine analytic (MA), and machine holistic (MH) scores.
Machine scoring validation
We will look at various agreement measures obtained by comparing human and machine-based observed scores assigned by the MA, MH, and human scoring approaches using percent agreement and Spearman’s rank correlation (Yang et al., 2002). Further, we will use observed scores to conduct generalizability analysis which will help gauge the degree to which decisions based on machine scores are reliable and trustworthy, which is one of the main goals of developing a validity argument for machine-based scores (Clauser et al., 1999, 2000; Raykov and Marcoulides, 2011). Generalizability helps assess the contributions of various sources of variability in observed scores for generalizing the decisions based on these scores (Raykov and Marcoulides, 2006; Raykov and Marcoulides, 2011).
The facets of interest in this study are the assignment of scores to a response via various scoring approaches (HH, MA, and MH) and the items. In this study, we use the final consensus scores as values for human scores (HH) on each item for every examinee (Wilson et al., in press). Since each student took all 19 items are also considered a facet in this study, therefore yielding a two-facet design (Raykov and Marcoulides, 2006). The focus of the study is to determine if we can generalize to the potentially infinite number of scores that one could obtain from all-possible scoring approaches on all the items. We will use a random effect analysis of variance (RE ANOVA) because it accounts for the fact that the level of the factor (i.e., scoring approach and item) represents a random sample from several all-possible scoring approaches and items to which we want to generalize (Raykov and Marcoulides, 2006). In the RE ANOVA, we will test the null hypothesis that there is no variability across scoring approaches (HH, MA, and MH) and across 19 items on the test. If the hypothesis is retained, this indicates that there is no variability due to the scoring approach or due to item in the population, and therefore, we can generalize over the three scoring approaches over all the items. We will carry out a two-facet design RE ANOVA (Raykov and Marcoulides, 2006), where the facets will be the scoring approach and the items, which will help determine if we can generalize over the three scoring approaches and over the 19 items on the test.
In addition to the consistency between observed scores, it is important to investigate the consistency across the MH, MA, and human scoring methods at the true score level (Yang et al., 2002). A true score in this context can be defined as an expected score estimated by averaging scores from a large number of trained scorers (Yang et al., 2002). In the context of this study, a true score is a latent (unobserved) score on the latent dimension defined by the LP for scientific argumentation. In this study, we will use confirmatory factor analysis (CFA) to evaluate consistency across the three scoring approaches in terms of true score assignment. CFA analysis allows us to examine whether the correlations between observed scores support the hypothesis that all test items relate strongly to the single construct of interest, argumentation (Raykov and Marcoulides, 2011). For this study, we will examine if the correlations between observed scores from the three scoring approaches (HH, MA, and MH) relate strongly to the construct of argumentation. Additionally, we will examine item threshold parameters that show the location of each scoring category on the latent dimension for argumentation. Note that each item probes a specific LP sub-level (Table 1). Each scoring rubric consists of several categories (typically 0–2 or 0–3) reflecting the degree of proficiency in using the corresponding scientific argumentation elements in their responses (for example, see Table 3). We will investigate if the three scoring approaches are consistent in assigning similar latent trait levels (factor scores) to each scoring category by examining the proximity on the latent trait continuum (factor score) of each of the thresholds. Since each scoring category relies on specific argumentation elements, lack of consistency would indicate potential disagreements in the scoring of specific argumentation elements.
Next, we will present a detailed qualitative analysis of responses misscored by machine scoring approaches (Clauser et al., 1997; Williamson et al., 1999) for any identified problematic items. As part of the qualitative analysis of MA misscores we will identify the elements of argumentation construct that tend to be misscored by MA approach, which will help identify the potential threats to validity of MA scores. Further, as part of qualitative analysis of MH misscores, we will conduct correspondence analysis (Greenacre, 2016). This analysis allows us to investigate if there are associations between occurrence of certain words or phrases and scoring categories. This analysis is especially helpful for investigating misscores in the MH scoring approach since the single holistic score produced does not allow for easy interpretation of the nature of misscores. Therefore, the correspondence analysis allows us to evaluate the relationship between words and phrases used in student answers and the resulting holistic score assigned by the machine.
Data analysis
Correlation and agreement measures
Spearman’s rank correlation and percent agreement were computed for each item across HH and MA approaches as well as HH and MH approaches using SPSS software (IBM Corp, 2019).
Generalizability analysis using random effects ANOVA
Random effects ANOVA (RE ANOVA) allows us to answer the question of whether we can generalize over the three scoring approaches and over the 19 items on the test. We conducted RE ANOVA with two factors using SPSS (IBM Corp, 2019). The scoring approach and the item variables were specified as random. The items that displayed a significant effect for the scoring approach were examined to identify over which scoring approaches we could not generalize. This was determined by identifying the items for which the confidence intervals of estimated marginal means of the score assigned by each scoring approach did not overlap.
Confirmatory factor analysis
The assessment instrument consisting of 19 items measuring 3 different contexts was developed to access the latent construct of argumentation. To ensure that theoretical unidimensionality is supported by student response data, one-dimensional (1D) confirmatory factor analysis (CFA) was performed using all items separately for each of the scoring approaches (HH, MA, and MH). For each of the scoring approaches, the final sum score (shown in Figure 1 under the corresponding code: HH, MA, and MH) was used to perform CFA.
Each item had 2, 3, or 4 response categories ranging from scores 0–1, 0–2, or 0–3, respectively, depending on the specific scoring criteria contained in the rubrics. Threshold parameters resulting from CFA model estimation for HH, MA, and MH were further examined to gauge the degree of consistency for predicting threshold location on the latent continuum, also called factor score level. The underlying assumption for comparing thresholds produced on HH, MA, and MH scores was that if MA and MH scores were in total agreement with HH scores, the CFA model parameters and thresholds would be the same for the three estimated models.
Items had 1, 2, or 3 thresholds depending on the number of scoring categories in the rubric. CFA analysis was performed on a listwise deleted data sample (N = 243 after deletion) using standard procedures in the lavaan package for R (Rosseel, 2012). The authors chose to use listwise deletion for CFA modeling instead of one of the missing data substitution approaches to avoid possible issues related to substituting missing data for machine-generated scores since there is no research available on this. For each item, threshold location and the associated confidence intervals (CIs) pertaining to 1 standard error were examined. If the CIs for the three scoring approaches for a given threshold did not overlap, it suggests that the given threshold is located in different regions of the latent continuum for those scoring approaches whose CIs do not overlap, which suggests differences in latent score assignment. Examining thresholds by this method allowed us to identify items and thresholds that showed inconsistencies in latent score assignment across specific scoring approaches and for specific thresholds.
Qualitative analysis of misscores between HH and MA and HH and MH
We used the methods described above to identify items that did not exhibit consistency in score assignment across the three scoring approaches (HH, MA, and MH). For the items that were identified, we carried out a detailed qualitative analysis of misscores between the human-assigned scores and each of the two assigned scores by the machine scoring approaches. For the analysis of MA-HH misscores, we examined the types, number, and direction of misscores for each of the analytic rubric bins pertaining to specific argumentation elements. By direction of misscores we mean whether a given argumentation element was misscored into the higher or lower scoring category, and how it affected the final sum score assignment. For the analysis of MH-HH misscores, we did not have the detailed misscore information at the level of individual categories, so we focused the analysis on evaluating the number and direction of misscores for the overall sum scores. Additionally, we conducted text and correspondence analysis using WordStat (Provalis Research, 2018) to see if there were any specific phrases associated with each of the scoring categories and all combinations of misscores. We used the Chi-square value test to evaluate whether correlation between occurrence of individual terms or phrases in student responses (length 3–5 words) and scoring categories is statistically significant (Davi et al., 2005).
Results
Correlation and agreement measures between human and machine scores
Table 4 shows Spearman’s rank correlation and percent agreement measures between human and machine scores. To distinguish between the agreement measure pertaining to the qualitative analysis discussed below, we refer to this agreement measure between machine and human scores as accuracy. Overall, both Spearman’s correlation coefficient and accuracy tend to be lower between HH and MH scoring approaches across all items, but by examining individual items, we identified for HH and MA scoring approaches, the problematic items could be S5 and G7 because these items have low Spearman’s correlation and low accuracy measures. Similarly, we found for HH and MH scoring approaches, the problematic items could be G6 and G7 because they have one of the lowest Spearman’s correlation and accuracy measures. Additionally, the lowest Spearman’s rank correlation for both HH-MA and HH-MH combinations is for items G7 and G8. By comparing correlation and accuracy, we identify potentially problematic items for computer scoring as S5, G6, G7, and G8.
Generalizability analysis using RE ANOVA
Appendix Table A1 shows p-values for RE ANOVA with the scoring approach and item as random effects. Both facets (scoring type and item) have p < 0.05, indicating that one cannot generalize over the scoring approach or the item. This finding is not surprising since the differences in scoring approach will depend on individual items (since all the items are different). To further investigate which items and scoring approach contribute to the observed variance, we looked at the estimated marginal means for each scoring approach and the corresponding confidence intervals (CIs) for each item (see Figure 2). The items for which the CIs of the means did not overlap for at least one approach were items S5, G6, G7, and G8. Specifically, Figure 2 shows that the CIs of the score means for MH-MA for S5 and HH-MA for G6-G8 overlap indicating that the variance in the observed score in the population is not significant for those pairs of scoring approaches. Therefore, scores can be generalized over those scoring approaches for these items. For item S5 the confidence intervals of the score means for HH-MH and HH-MA do not overlap indicating that scores cannot be generalized over those scoring approaches. As can be seen in Figure 2, HH has a higher marginal score mean for that item. In other words, the two machine scoring approaches showed greater agreement with each other, than either approach did individually when compared to human scores. Similarly, for items, G6-G8 MH is the approach contributing to the observed score variance as indicated by lower marginal score mean for that approach for both items (Figure 2).
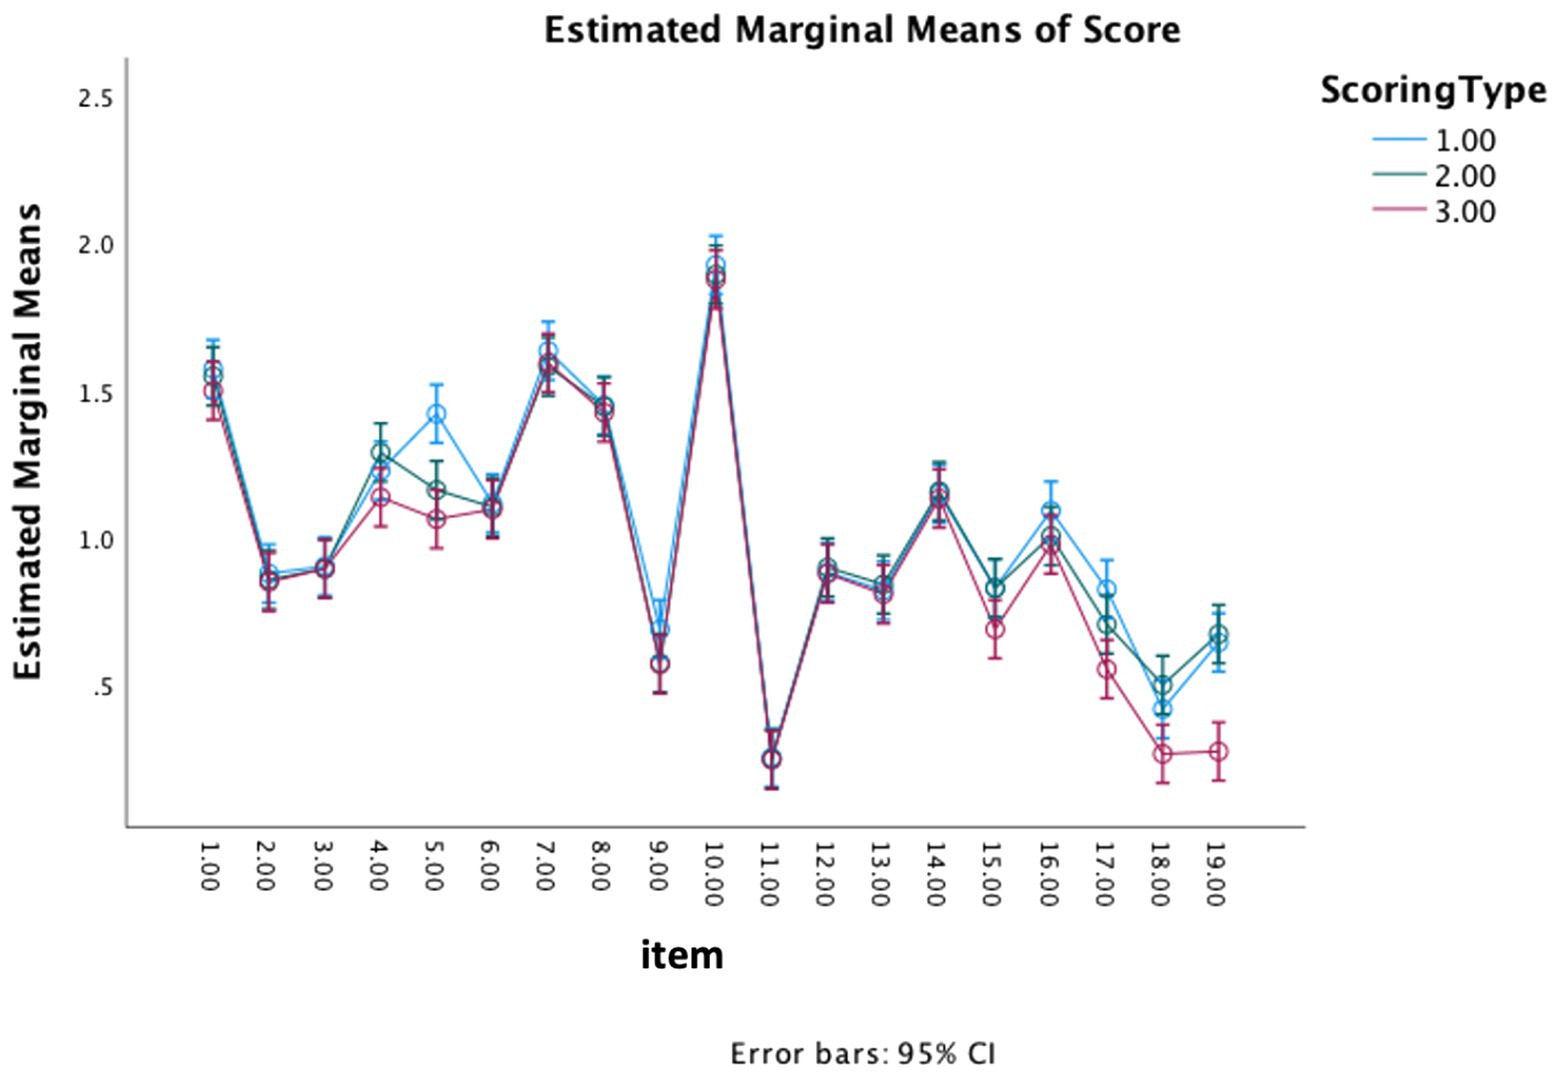
Figure 2. Estimated marginal means and the corresponding confidence intervals for each scoring approach for each item. Scoring type: 1—human holistic; 2—machine analytic; 3—machine holistic. Itemnew: 1–5 is S1–S5 (sugar testlet); 6–11 is B1–B6 (Bacteria testlet); 12–19 is G1–G8 (Gases testlet).
Confirmatory factor analysis
We performed a 1D CFA to confirm the unidimensionality of the assessment instrument probing different levels of student understanding of the argumentation construct. The results of CFA are shown in Appendix Table A2. Overall, the model fit is good for all three scoring approaches (HH, MA, MH) as judged by the chi-square value of p > 0.05, RMSEA < 0.05, and CFI/TLI > 0.95 (Kline, 2015). Therefore, the unidimensionality hypothesis is confirmed for all three scoring approaches, and we can put trust into the threshold estimation parameters.
CFA threshold location examination
We further examined thresholds for each item response category across the three CFA models estimated for HH, MA, and MH scores. A threshold is the expected value of the latent trait (factor score), which in this study is the ability to construct and evaluate arguments, at which a student transitions from the lower to the higher adjacent response category value, for example from score category 0 to 1, or from score category1 to 2 for a given test item. Figures 3–5 below show thresholds and 68% confidence intervals (CI; 1 standard error in each direction) for each scoring approach for score categories 1, 2, and 3, respectively, for all 19 items. Note that not all items have a scoring category of 3, so Figure 4 contains fewer data points. The X-axis displays items for each of the three contexts: sugar dissolving in water (S1-S5), bacterial growth (B1–B6), and kinetic theory of gases (G1–G8). The Y-axis represents the latent trait continuum (factor score) and shows the level of the latent trait (factor score) for each of the thresholds. As shown in Figure 2, CIs at threshold 1 for the three scoring approaches overlap for all items except for items S5, G4, and G6–G8. For items for which threshold CIs do not overlap, it suggests one scoring approach may have been easier or harsher when assigning scores. Similarly, Figure 3 shows that CIs for threshold 2 for the three scoring approaches overlap for all items except for S5, B4, G6, and G8. Finally, Figure 4 shows the CIs for threshold 3 for the three scoring approaches overlap for all items except for S1, S4, and S5. Note that S5 shows differences for all three thresholds, and items G6 and G8 show differences for thresholds 1 and 2 (they have no threshold 3).
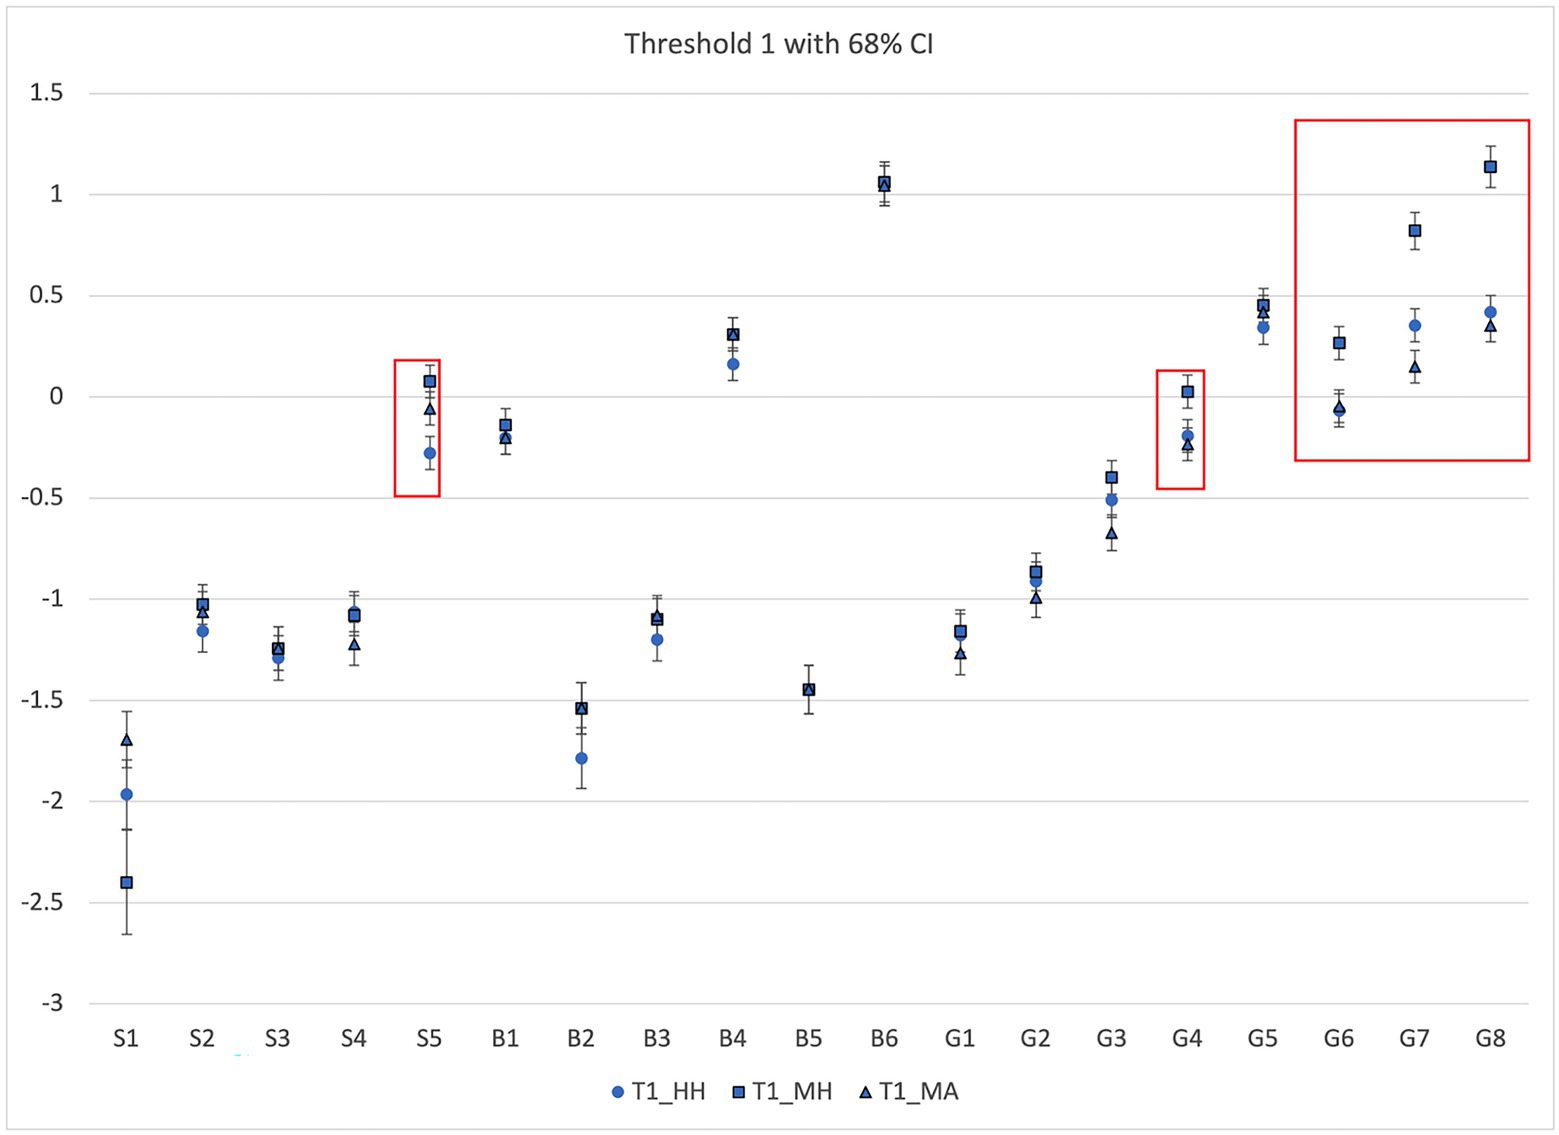
Figure 3. CFA Threshold 1 with 68% CI for the HH, MA, and MH scoring approaches.
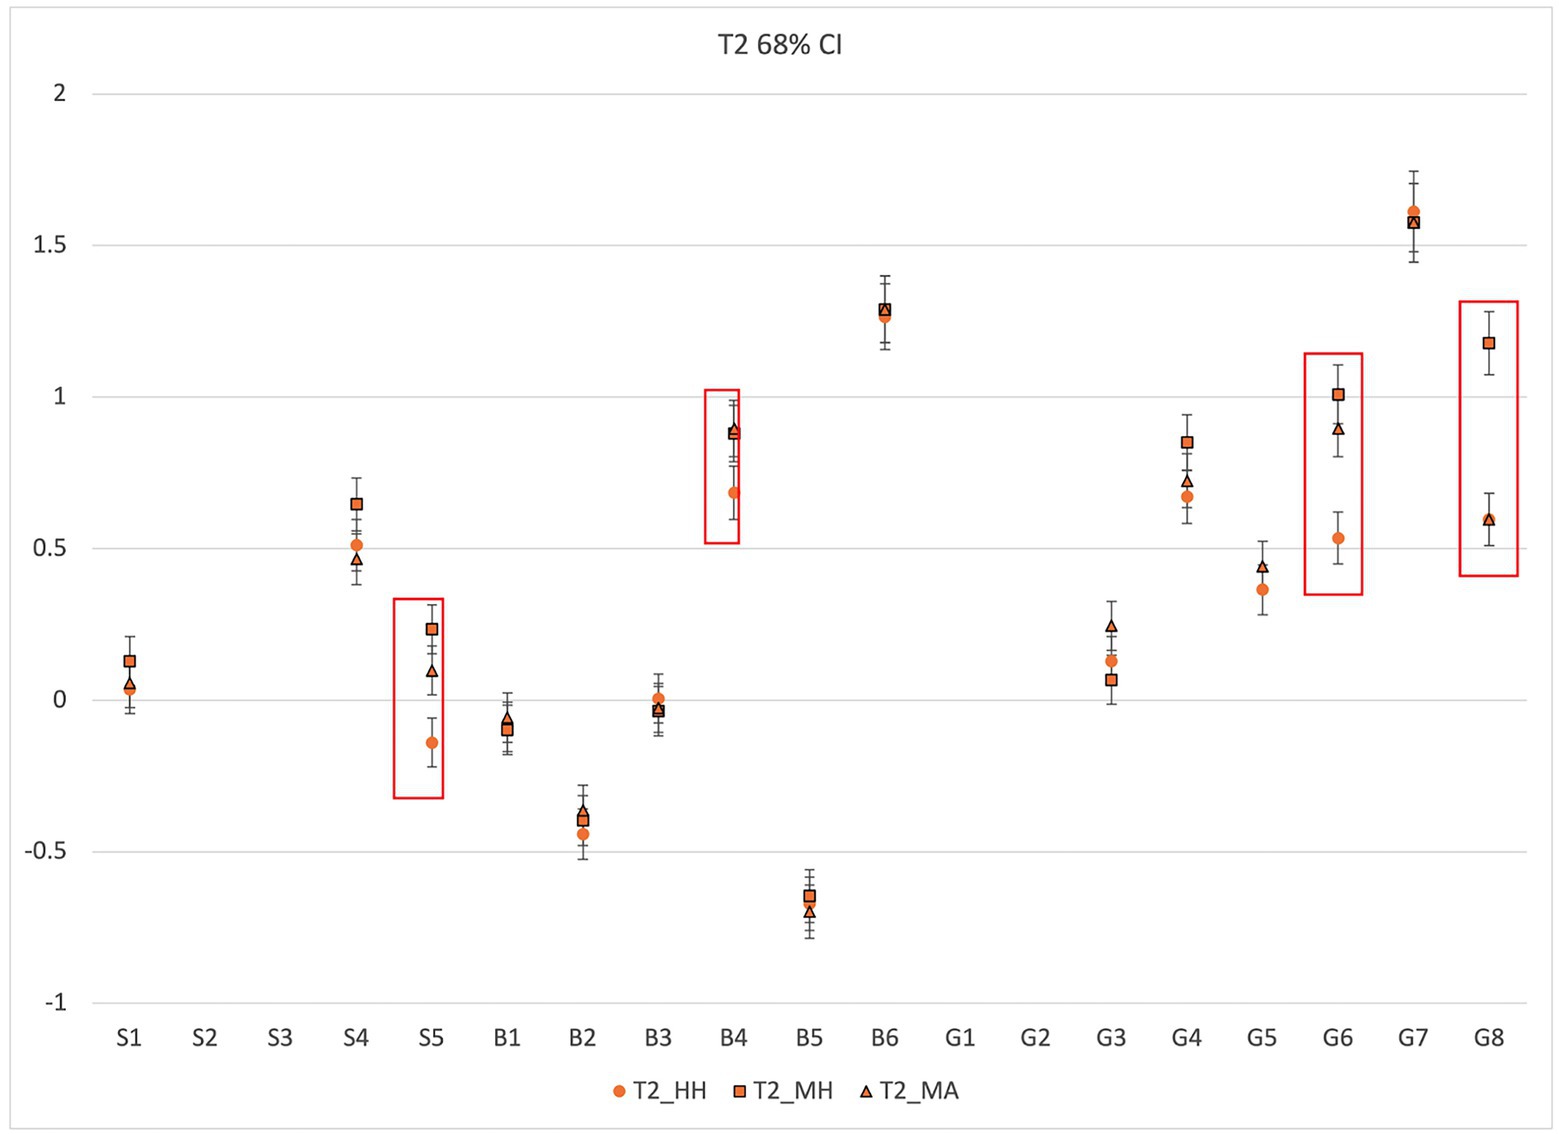
Figure 4. CFA threshold 2 with 68% CI for the HH, MA, and MH scoring approaches.
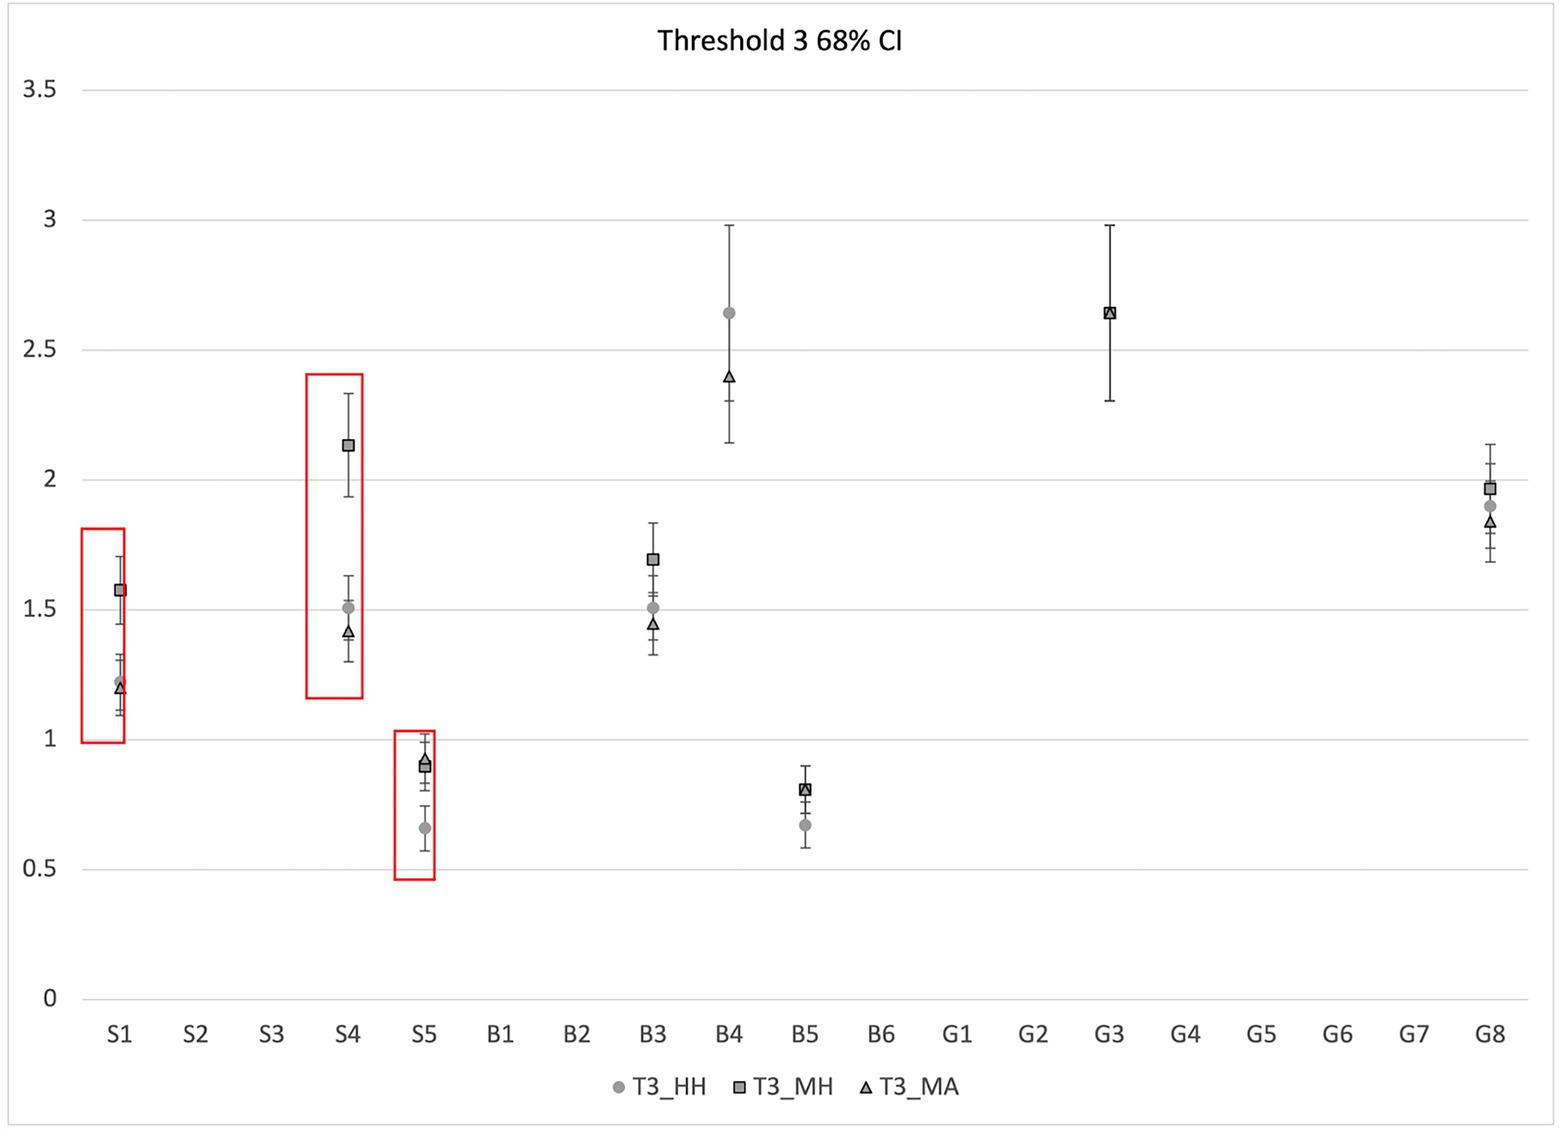
Figure 5. CFA threshold 3 with 68% CI for the HH, MA, and MH scoring approaches.
We further used the results of RE ANOVA and threshold location to pinpoint the items that show inconsistencies across the scoring approaches. The results from RE ANOVA and threshold analysis show that for G6, G7 and G8, the MH scoring approach is the one contributing to the variance in observed score based on lower estimated marginal score means for MH shown in Figure 2 and higher location of most thresholds for MH on the latent trait continuum (factor score) for these items (Figures 3, 4). These results indicate that the MH approach is likely to be a harsher “scorer” because most MH thresholds for items G6-G7 tend to be located at higher latent trait levels than corresponding thresholds for HH and MA. Therefore, we expect lower observed scores by MH, which is consistent with lower estimated marginal mean scores for MH as shown in Figure 2. Similarly, for item S5, the human scoring (or HH approach) seems to be contributing to the variance in the observed score based on RE ANOVA (Figure 2). This approach could be viewed as an “easier” scorer because all the HH thresholds are located at a lower factor level compared to those for MH and MA, and it has a higher estimated marginal mean score (Figure 2). Since the HH is used as the scoring standard, it is likely that both MA and MH approaches are scoring inconsistently compared to HH for S5.
Qualitative analysis of misscores between human and machine scores
Overview of misscores for each score category for item S5
We examine misscores by computer approaches for each response category of item S5. Figure 6 shows the number of responses for each score category, as assigned by the human score, in the pie chart. For this item, Score 0 had the largest number of responses, with a similar number of responses in Score 2 and Score 3 categories. Score 1 category was by far the most infrequent holistic score. The number of responses in agreement across HH, MA, and MH, as well as misscores for each of the score categories, are shown in the bar chart panels; one for each threshold. These bar charts show the frequency of misscores in the machine analytic approach (MA) and misscores only in the machine holistic approach (MH). Note that MA category misscores contain responses misscored in at least one MA rubric component, regardless of whether they were misscored by MH, whereas the MH category contains only MH misscores.
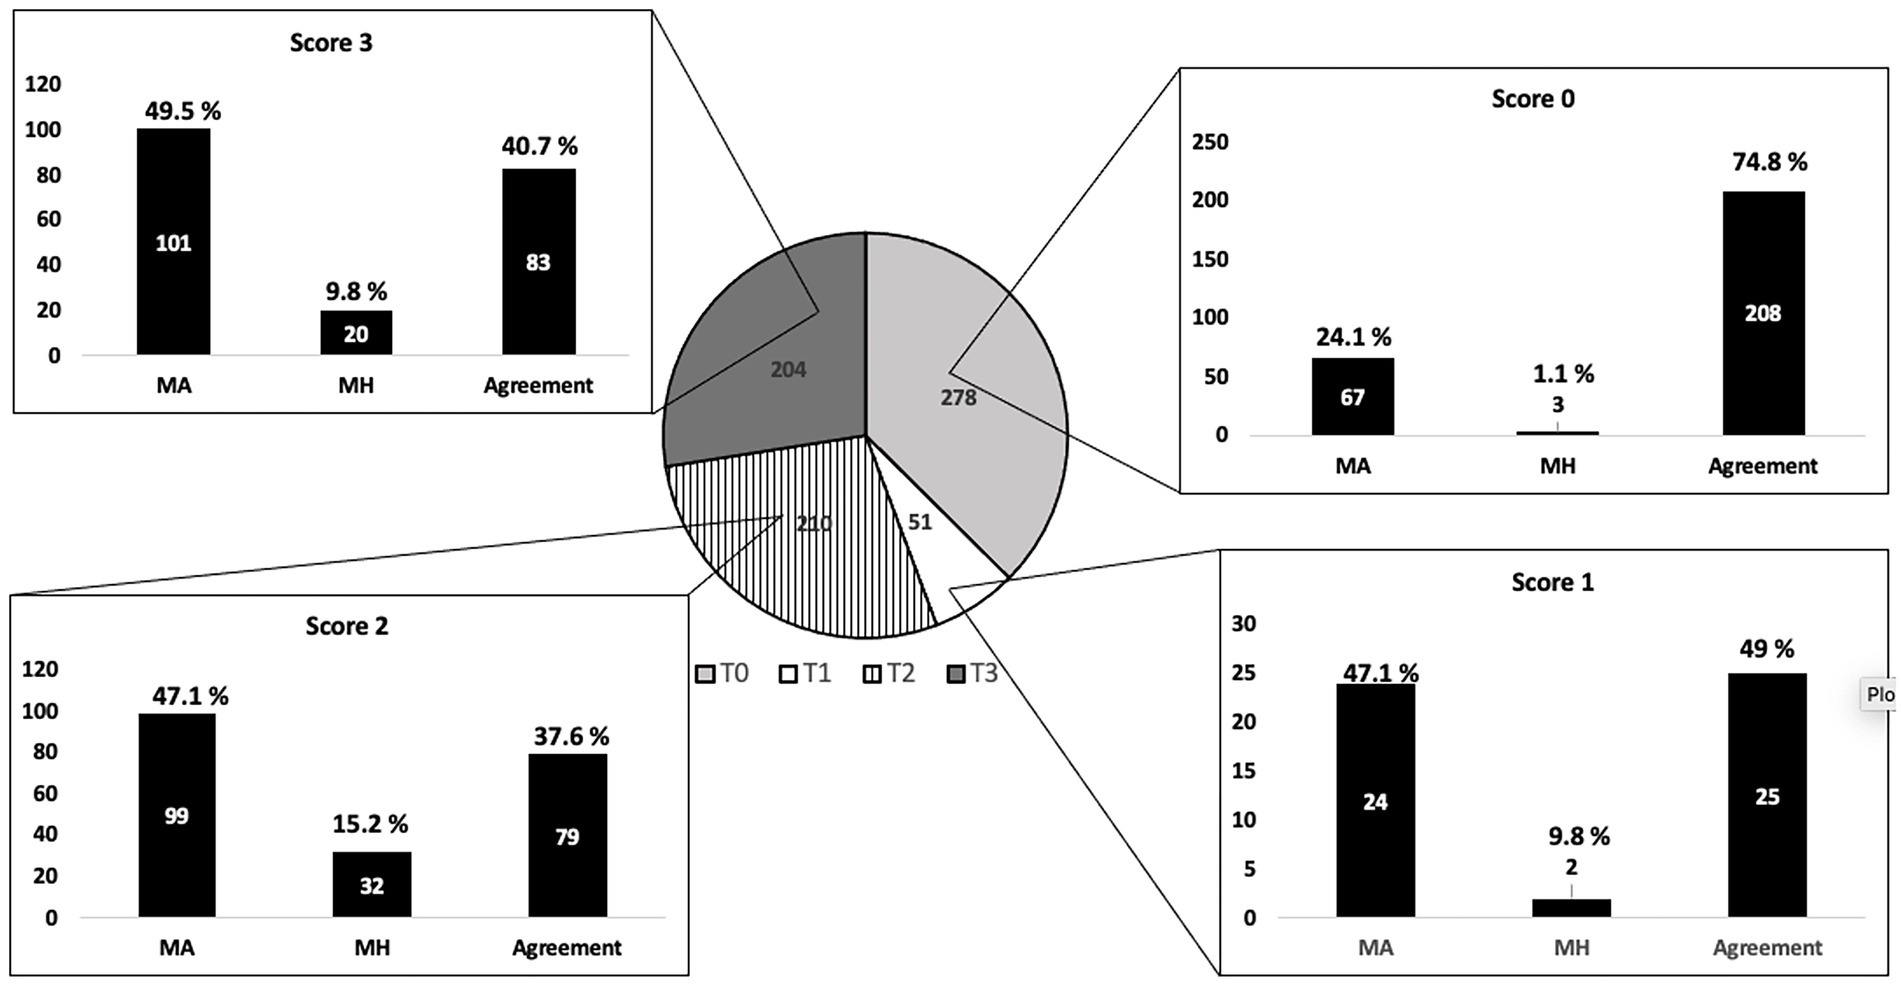
Figure 6. Agreement and types of misscores across machine approaches by score category for item S5.
Overall, there is a significant percentage of responses for which all three scoring approaches assigned the same score (category “agreement” in each bar chart) for all scoring categories. A relatively small misscore percentage was related to misscores by the MH approach exclusively (see “MH” for each score category). Finally, slightly less than 50% of misscores in each score category were due to misscores in the MA approach (see category “MA”).
Misscores in MA scoring approach for item S5
We further take a closer look at the misscores by MA approach for each scoring category (the portion of the bar graphs in Figure 6 titled “MA”) and rubric component. Note that rubric components represent different elements of argumentation practice and that some responses may have been misscored for more than one component. Therefore, the total number of responses misscored in each scoring category may not match the number of misscores in a given component. Table 5 below shows the percent of MA misscores by component in the rubric for every scoring category of item Sugar 5. More than three-quarters of the misscores for Score 0 and Score 1 are associated with one of the claim components (~76% for T0 and ~80% for T1). As seen from the bar chart in Figure 6, for the Score 0 category most of the misscored components (~73%) did not actually affect the final holistic score assigned to a response by the MA approach. The rest of the responses in this score category (~27%) were assigned a higher final score due to a misscore in a component, which was driven by MA assigning a score of 1 to one of the “reasoning” or “argument critique” categories.
Further, as shown in the bar chart in Figure 7, for the Score 1 category more than half of misscored cases (~54%) did not affect the final score assignment. About 38% of cases were scored into the higher category by MA. We found that for these cases higher category assignment was driven by misscores in the category “Vague Claim” in favor of one of the other “Claim” components. Specifically, as can be seen from the scoring rubric (see Table 2), responses that contain “vague claim” category and at least one “reasoning” or “argument critique” are assigned a score of 1; this was consistently recognized and assigned by human scorers. However, in all cases assigned a higher score in this response category, the MA approach assigned a score of zero to the category “vague claim,” and instead assigned a score of 1 to one of the “claim” categories, leading to an overall holistic score of 2 for these responses. Therefore, because the MA approach seems to fail to consistently recognize the category “vague claim,” the number of cases scored to a higher final score was significant for this scoring category. A possible explanation for the MA misscores might be that the “vague claim” category reflects responses that do not clearly state which character’s argument is better, and therefore the computer cannot distinguish certain characters in the response. It is also important to point out that Score 1 and Score 2 categories are located close to each other on the latent trait continuum (near value 0 as shown in Figures 3, 4), suggesting that the two scoring categories are not very distinguishable in terms of latent trait levels. Therefore, these categories are not distinguishable both psychometrically and in terms of accuracy of MA scoring, suggesting a possible need for item or scoring rubric revisions.
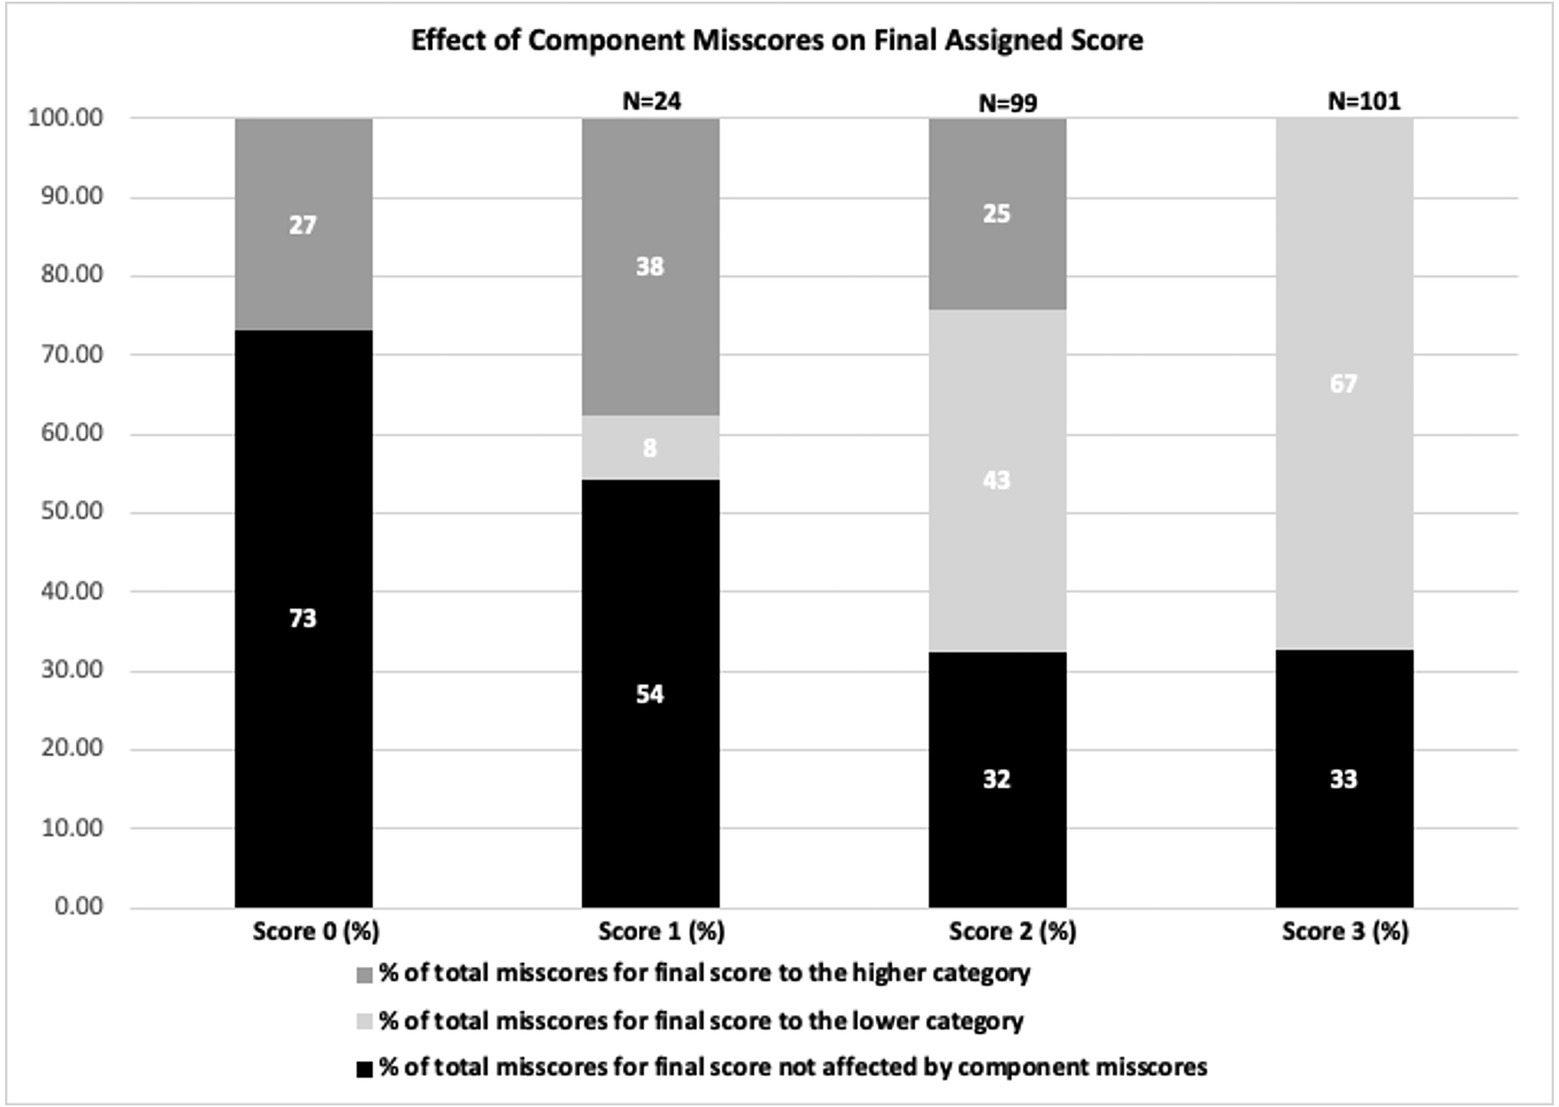
Figure 7. Effect of MA component misscores on final assigned score for S5.
Further, for Score 2 and Score 3 more than 60% of misscores occurred for the “Reasoning” and “Argument Critique” elements (~68% for Score 2 and ~70% for Score 3 in Table 5). These argumentation elements are associated with higher LP levels, and these score categories are higher on the latent trait continuum, respectively. As can be seen from Figure 7, for both Score 2 and Score 3, a significant percentage of cases were misscored into a lower score (~43% and ~67%, respectively), which is consistent with Score 2 and Score 3 for MA scoring being located higher on the latent trait continuum (see Figures 4, 5). That is, the MA approach appeared as a more severe rather than humans for these categories. Most of the misscores into the lower score happen due to the MA approach assigning a score of zero to one of the “Reasoning” or “Argument Critique” elements when the human assigned a one (see Appendix Table A3 for detailed analysis of misscores in this scoring category. Similar analysis was performed for all identified problematic items for each threshold). Therefore, argumentation elements at higher-level cognitive ability seem hard for the machine to recognize.
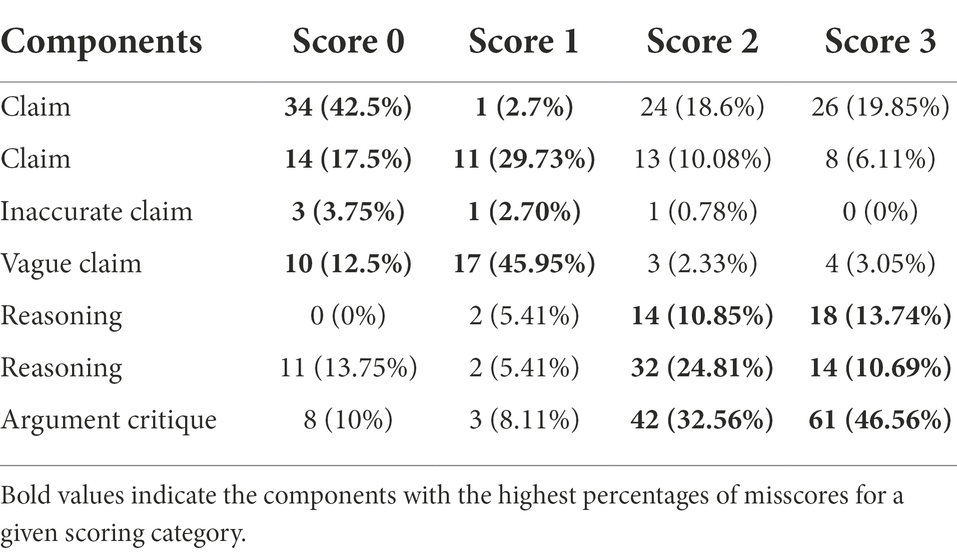
Table 5. Misscores by component of MA rubric for item S5.
Gases testlet (items G6, G7, G8)
We further describe items G6, G7, and G8, which were identified by RE ANOVA and CFA analysis to have significant disagreements across scoring approaches. All three items belong to the Gases testlet and are introduced to students in a consecutive fashion. As can be seen from the location of items of the latent trait continuum shown in Figures 3–5, each subsequent item is located higher on the latent trait scale than the previous one. This is not surprising as each of the three items measures increasingly more sophisticated proficiency levels for argumentation from the LP. Specifically, item G6 requires students to use one type of evidence and two types of reasoning (particle level and model-based). Further, items G7 and G8 ask to identify multiple claim/evidence/reasoning combinations. We further discuss each item.
Scoring rubric for item G6
The Gases testlet focuses on arguments constructed by two fictitious students after they observed changes in a sensor signal after gas particles were added to a chamber. The students are arguing about what happened to the gas molecules to cause the observed signal from the sensor. The first argument is constructed prior to a fictional teacher sharing additional information with the students, and the second argument is constructed after that. Item G6 asks respondents to explain how one of the fictitious students can use the additional information provided by the teacher in their argument. Item G6 is shown in Appendix Figure A1 with the analytic rubric provided in Appendix Table A4. Appendix Table A5 shows how components were combined to yield a holistic score for item G6.
Overview of misscores for each score category for item G6
We began our analysis of misscores by looking at each score category. Figure 8 shows the number of responses for each score category in the pie chart diagram by human score. For this item, score 0 had the largest number of responses 325, with 145 and 172 responses in Score 1 and Score 2 categories, respectively. The interpretation of the pie chart and each bar graph is similar to the S5 item. Overall, there is a significant percentage of responses for which all three scoring approaches assigned the same score (category “agreement”) for all three scoring categories. A relatively small percentage of misscores was associated with misscores by the MH for Score 0 (2.5%). On the contrary, for Score 1 and Score 2 categories, the percentage of misscores by the MH were higher (26.2% and ~17% respectively). Finally, roughly one-third of misscores in each scoring category were due to misscores by the MA. In general, compared to item S5, item G6 had fewer MA and more MH misscores across the scoring categories.
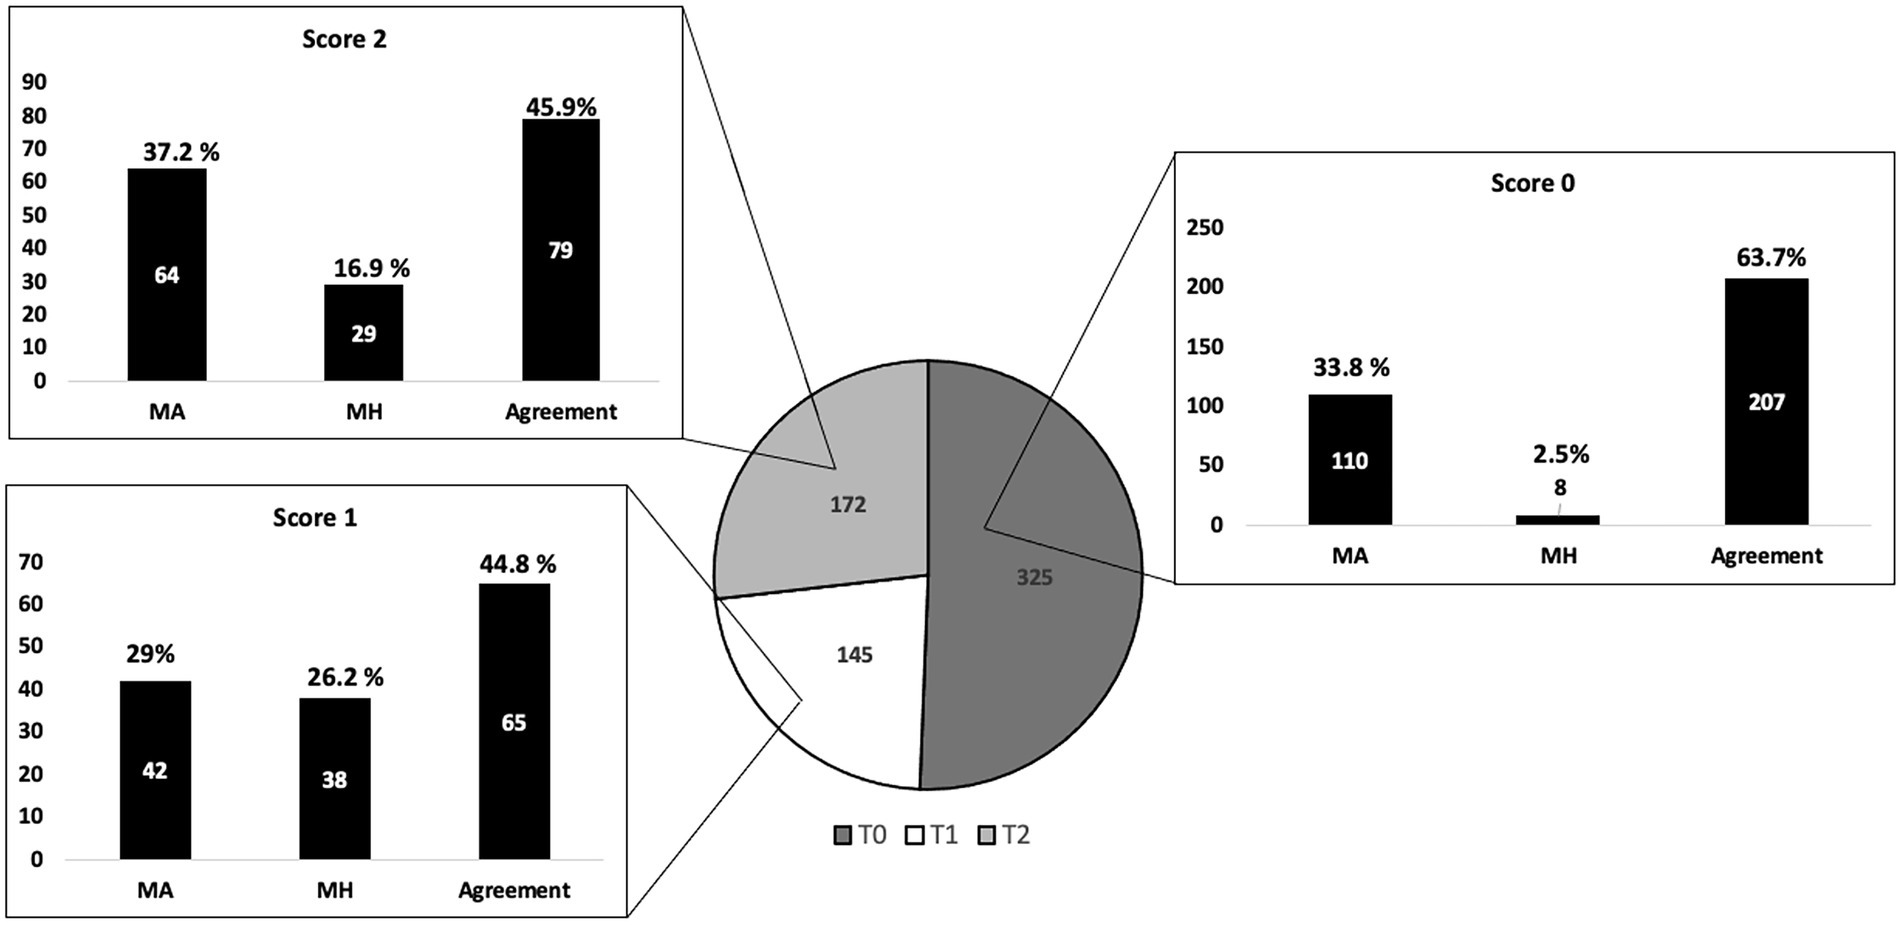
Figure 8. Agreement and types of misscores across machine approaches by score category for item G6.
Misscores in MA scoring approach for item G6
We further discuss which components of the scoring rubric contributed most to the observed MA misscores. Table 6 below shows percent of misscores by component in the MA rubric for every scoring category of item G6. For this item, more than 85% of misscores in each scoring category were due to misscores in one of the Reasoning components. Further, the majority of misscores in the Score 2 category are due to misscores in the model-based reasoning component (~77%), whereas in the Score 0 and Score 1 categories, the majority of misscores are in one of the particle-level reasoning components (~66% for Score 0 and ~54% for Score 1).
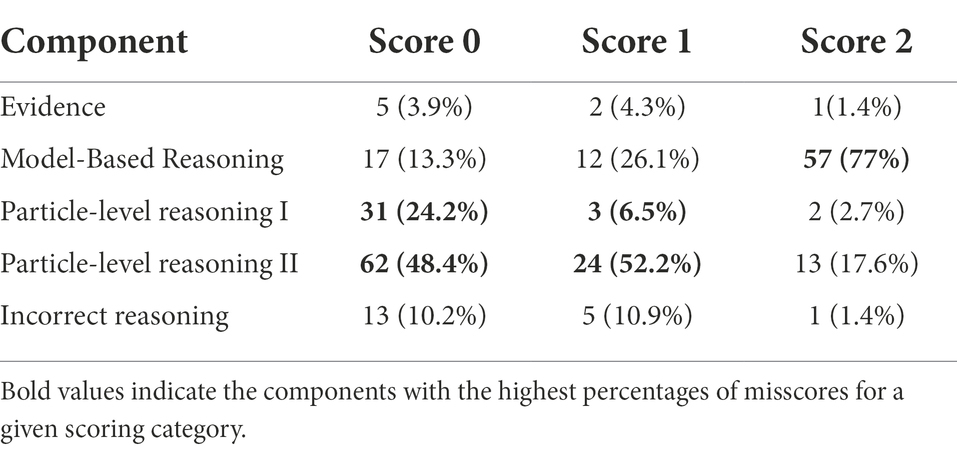
Table 6. Misscores by component of MA rubric for item G6.
As shown in the bar chart for the Score 0 category in Figure 9, the majority of misscores (~66%) did not affect the final score assigned for this category. The majority of misscores that were scored into the higher category happened due to misscores in one of the particle-level reasoning components noted above, where the MA approach assigned a 1 for one of those categories when a human scorer assigned a 0. This might be because scoring those components involves a significant degree of interpretation of the student answer by the scorer. For example, the rubric for the component Particle-level reasoning II, which is misscored the most for Score 0 and Score 1 categories, requires coders to identify if the response indicates that particles are moving around in different directions. Student responses that would fall into this category use similar words and word combinations, but the meaning is not always the same. For example, the following response was assigned a score of zero by human coders for the particle-level reasoning II component because it does not use the ideas of motion to describe how particles make the balloon bigger: “Particles is all around the container like balloon and makes the balloon bigger.” The MA scoring algorithm assigned a score of 1 for the same category to this response because it used similar words to those present in other responses that were scored into category 1 by humans, except for the word denoting motion. Another example was also assigned a score of zero by humans because it did not mention particles and reflected a macro-level understanding: “When you blow air into a balloon, the balloon grows bigger in all directions. So why would not that be the same for this case.” Similarly, the MA scoring assigned a score of 1 to the same category of this response because it contains phrases like “in all directions,” which are likely phrases present in the training set of responses assigned a score of 1 by humans. However, the response lacks the critical idea of particles.
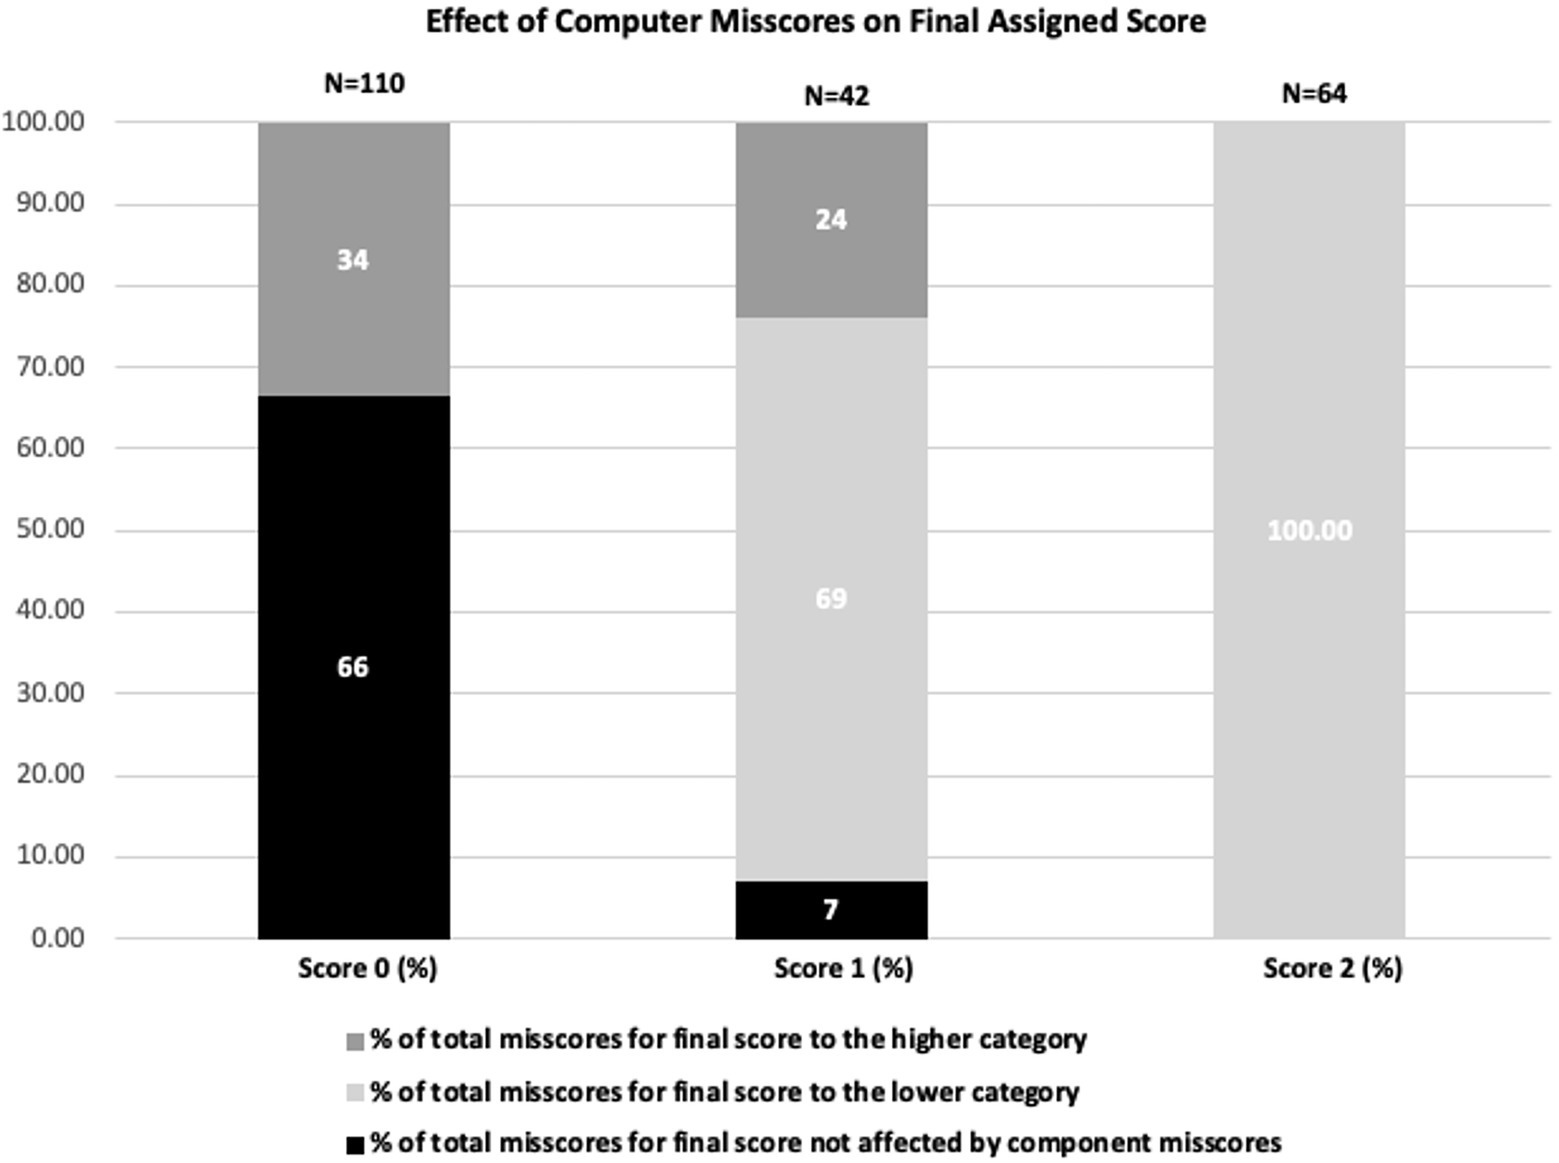
Figure 9. Effect of MA component misscores on final assigned score for G6.
The above analysis suggests that machine misscores tend to happen more often for components that require going beyond evaluating presence or absence of certain words and word combinations, and require interpretation, which the machine cannot do. Further, according to the rubric, both particle-level reasonings need to be present to be assigned a score of 1 (see Appendix Table A5). Therefore, it is not surprising that misscores in one of the particle-level reasoning components affect this scoring category the most. Similarly, for being assigned score category 3, model-based reasoning must be present along with both particle-level reasoning components (see Appendix Table A5). The scoring rubric for item G6 (Appendix Table A4) shows the model-based reasoning component rubric also requires a significant degree of interpretation on the scorer’s part. As shown in the Score 3 bar chart in Figure 8, all the misscores in this category were scored into lower levels due to humans assigning a score of 1 to the model-based reasoning category, and a computer assigning a score of 0. This category relies on the scorer to correctly interpret that what is going on in the box is the same as what is going on in the balloon. For example, the following response was assigned a score of 0 for the model-based reasoning component by the machine, and a score of 1 for the same component by human: “When you blow air into a balloon, the balloon grows bigger in all directions. So why would not that be the same for this case.” This response does convey the ideas of similar processes in the box and in the balloon, but only a human scorer can deduce that from the last sentence, where it is not clear what “that “and “this case” mean. Therefore, across all scoring categories for this item, misscores are due to the scoring rubric criteria allowing some degree of interpretation. This allows a scorer to interpret the answer, but does not rely on the presence of specific words or phrases, which makes it harder for the machine to score accurately.
Overview of misscores for items G7 and G8
We performed similar analyses for the other items identified as problematic (G7 and G8; see Supplementary Material for specifics of item, rubric, and results). Briefly, for G7, we found the category most likely to be misscored targets reasoning about particle motion and particle location. For G8, we found the categories most likely to be misscored are the identification of insufficient evidence and reasoning about particle motion. These all relate to components associated with higher argumentation competency.
Misscores in MH scoring approach
We conducted correspondence analysis using extracted terms and scoring categories and examined Chi-square p values to see if there were any specific words or phrases associated with each of the scoring categories (0, 1, and 2 or 0, 1, 2, and 3 depending on the item) and combinations of misscores for each of the four problematic items. Specifically, the misscores were characterized into the following categories: false positives (FP) where a human assigned a score that was lower than that assigned by the machine, false negatives where a human assigned a score higher than that assigned by the machine. The FP scores included: FP01 (human score = 0, machine score = 1), and similarly FP02, FP03, FP12, FP13, and FP23. The FN scores included: FN10 (human score = 1, machine score = 0), and similarly FN21, FN20, FN32, FN31, FN30. Finally, consensus scores for each score category indicated that there was agreement across the three scoring approaches: T0 (true zero indicating agreement in score category 0 across HH, MA, MH), and similarly T1, T2, and T3. Statistically significant Chi-square p values (<0.05) indicate that the phrase is associated with specific score categories or misscore types if the occurrence of those phrases in a given category is higher than in others. As an example of our findings, statistically significant Chi-square p values for the cross-tabulation analysis for item G8 are shown in Appendix Table A12. While some phrases identified by the software have statistically significant Chi-square p values, none have significant percent occurrence in any of the score/misscore categories. This suggests that while these are phrases that are potentially unique to the categories, they probably do not occur often enough to be the reason for all misscores. There were more phrases identified, but they all had no significant p-value (>0.05), suggesting that those phrases occur similarly between the score/misscore categories. We observed similar patterns of phrases and Chi-square results for the other three items.
Discussion
In this work, we present a fine-grained validity argument for machine-based scores by examining agreement between observed and true scores generated by human scorers and two approaches to ML scoring. We examined validity evidence pertaining to observed score agreement for science argumentation items, including percent agreement, Spearman’s rank correlation coefficients, and generalizability analysis using RE ANOVA. Additionally, we examined true score consistency using CFA approaches and evaluated threshold proximity for each response category across all 19 test items. We also conducted qualitative analysis of misscores for the items identified to be problematic by the combination of previously described approaches. We will further describe how these results contribute to understanding of validity issues and the validation process of automatically scored short text responses for LP-aligned NGSS-based performance assessments.
First, all these approaches separately pointed to four items that did not exhibit high agreement between HH, MH, and MA scores. This suggests that we have a high degree of confidence both in the fact that the items identified are in fact problematic, and in the set of methods that we used to identify the items. In relation to RQ1 of the study, this analysis suggests that the three scoring approaches (HH, MA, MH) are consistent in assigning true and observed scores to student responses across all items except for S5, G6, G7, and G8. We will further discuss the specific threats for validity of machine scores that we identified for these items.
To the authors’ knowledge, this work presents the first example of successfully applying quantitative and qualitative methods for identifying items that exhibit potential threats to the validity of machine scores on LP-aligned NGSS-based performance assessments. This approach is consistent with the current view on validity as a unitary concept that incorporates multiple evidence sources supporting the intended interpretation of test scores for a specific purpose (American Educational Research Association, 2018). In this study, we developed a fine-grained validity argument which relies on comparing observed and true scores among the three scoring approaches (HH, MA, and MH). In this work, we provide validity evidence consistent with two approaches to validating machine scores described by Yang et al. (2002). First, we evaluate relationships among the observed scores generated by the three scoring approaches (Yang et al., 2002). Second, we evaluate consistency among the true scores assigned by the three scoring approaches and conduct qualitative analysis of misscores, both of which focus on the scoring process (Yang et al., 2002). Evaluating consistency among the true score assignments by MH, MA, and HH by comparing threshold proximity using CFA allows us to gauge whether the latent factor measured by MA and MH is the same as that scored by human scorers (HH). Additionally, threshold proximity analysis allows us to identify specific response categories for each of the problematic items. This level of precision in identifying the source of a validity threat allows us to examine relevant scoring rubric components, which makes the validation process more efficient and grounded in compelling psychometric evidence. Further, qualitative analysis of misscores among HH, MA, and MH helps provide additional evidence that the factor measured by the machine is the same as that measured by the human scorer. In short, evaluating consistency of the observed and true score assignment among the three scoring approaches using methods described above allows us to identify specific items and rubric levels within an item that exhibit potential threats to validity by a given automatic scoring approach.
In the context of validity of NGSS-based LP-aligned items, this approach represents a powerful way to identify not only specific items, but also specific rubric categories that exhibit potential threats to validity with respect to a LP and NGSS alignment. The practical usefulness of this approach can hardly be under-estimated. LPs can provide a roadmap that can align curriculum, instruction, and assessment but can only serve this role if we can trust in the evaluation of student performance with respect to LP level. This, in turn, is achieved by accurate scoring of student performance on LP-aligned assessments. As demonstrated here, the items and rubrics are designed to be aligned to specific LP levels for the argumentation construct on one hand, and for specific aspects of NGSS on the other hand. The process of improving ML-based scoring accuracy with respect to LP and NGSS is an iterative process, and requires accurate information on where the automatic scoring approaches fall short and how these failures relate to the LP levels and elements of NGSS. The gold standard, of course, would be involving assessment developers and researchers to evaluate the misscores with respect to LP levels and NGSS performance expectations. This approach is very time-consuming, costly, and therefore not feasible at scale. The method presented here, on the other hand, offers a fast, cheap, and accurate approach for diagnosing potential threats to validity at the fine-grained level (i.e., not only specific items, by specific item response categories and the associated scoring rubric categories). We believe that this approach offers unique advantages to streamlining the development of LP-aligned, NGSS-based performance assessment machine scoring approaches.
For three out of four items identified to be problematic through this analysis (G6, G7, and G8), the MA and HH scoring approaches are generalizable, suggesting that MA scores are close to human scores for those three items (Table 6). In contrast, HH-MH and MH-MA scoring approaches seem to not be generalizable for those items, suggesting that there is less consistency in score assignment for those pairs of scores. Both conclusions suggest that MA scoring approach is more consistent with HH than MH. The MH scoring approach also seems to be a harsher scorer, as judged by higher placement of MH thresholds as compared to MA and HH for threshold 1 for items G6-G8 (Figure 3), and threshold 2 for items G6 and G8 (Figure 4). These findings are also consistent with previous research suggesting that analytic scoring approach corresponds better with human scores as compared to holistic scores (Jescovitch et al., 2020; Wang et al., 2021), and that MH scoring approach appears to be a harsher scorer when it comes to evaluating argumentation ability at the broad LP level (Wilson et al., in press). This demonstrates that the machine score validation approach allows us to identify specific items and rubric levels within an item that exhibit potential threats to validity by a given automatic scoring approach (in this case, MH scoring approach). These results further suggest that while analytic scoring rubrics are initially time-consuming to develop and apply, machine-assigned scores derived from these rubrics seem to be potentially more valid measures for student performance as related to human standard. In contrast, for three out of four problematic items identified in this analysis, MH scores seem to be the main contributor for the inconsistencies identified, suggesting that MH scoring approach generates scores that are less valid h when compared to human standard.
Importantly, item S5 does not follow the same pattern for the consistency among the three scoring approaches. For this item, MA and MH scoring approaches are generalizable, and HH-MA and HH-MH combinations are not generalizable (see Figure 2). Examination of threshold location suggests that for all three thresholds, MA and MH scoring approaches overlap, and are located slightly above the HH thresholds (see Figures 3–5). However, notice that thresholds 1 and 2 (Figures 3, 4, respectively) are located in approximately the same region of the latent trait continuum (between 0 and −0.5 on the y-axis). Therefore, these two thresholds are not well separated as judged by the human score standard, suggesting that student responses associated with score categories 1 and 2 are not very distinguishable in terms of the latent trait level for this item. This suggests that the validity issue stems from the item and the rubric itself. Therefore, the rubric needs revision to ensure better separation between the adjacent thresholds before any useful conclusions can be made regarding the validity of machine scores for those thresholds.
A closer examination of the scoring rubric for item S5 (see Table 2) reveals one of three acceptable scenarios for a response to get a score of 1 is “vague claim and at least one reasoning OR argument critique,” which is very similar to an acceptable scenario for a response to get a score of 2: “vague claim and at least one reasoning AND argument critique.” It is likely that this similarity causes the thresholds for these categories to be located very close on the latent trait continuum (Figures 3, 4). Therefore, a possible modification of the scoring rubric would be combining in the following way: “Vague claim and at least one reasoning AND/OR argument critique,” and assigning it to score category of 2, since it demonstrates more sophisticated argumentation practice than all other scenarios associated with score category 1. This might result in lowering score 1 to the lower end of the latent trait continuum, better separating between the two thresholds. This demonstrates that the machine score validation approach allows us to distinguish between fundamental validity threats originating from the way specific items and rubrics were constructed as compared to threats associated with machine scoring.
We will now discuss findings related to RQ 2 by first considering the results of misscore analysis between HH and MA. Generally, the results of MA misscore analysis show two trends. The first trend suggests that the misscores tend to happen for the argumentation components that require going beyond evaluating presence or absence of certain words and word combinations, and require interpretation, which the machine struggles to do. For example, a computer might not be able to recognize when a student is providing evidence for a specific character on the assessment item if they are not specifically stating the character’s name or using only general terms (see analysis for item G7, or the category “vague claim” misscore analysis for item S5).
The second trend suggests that the misscores tend to happen for the argumentation elements associated with higher-level cognitive ability (higher LP level), such as reasoning and argument critique, which seem to be harder for machine to recognize. Specifically, three of the four problematic items identified in this study (G7, S5, G8) are associated with level 2 in the underlying LP, which is the highest LP level (Osborne et al., 2016). As seen in Table 1, item G7 probes level 2a associated with ability to critique another argument, and items G8 and S5 are associated with level 2c corresponding to the ability to construct evaluative judgment about two arguments. Therefore, for all three items, the element of argument critique corresponding to either one argument (G8 item) or comparing two arguments (items G7 and S5) is one of the key abilities required to achieve a given LP sub-level. The qualitative analysis of misscores for the three items reveals that evidence and reasoning, which are used in support of argument critique at level 2 of the LP, tend to be the most misscored components.
Further misscores for item G6 reflect the trends associated both with challenges to interpret and to score higher-level cognitive ability components. Specifically, while item G6 is associated with lower LP level (level 1c in Table 1), the majority of misscores also occurred for one of the reasoning components, which involves answer interpretation by the scorers.
As described above, we conducted quantitative analysis of misscores between MH and HH scoring approaches for each of the problematic items by scoring category (see Figures 7, 8; Appendix Figures A3, A6), and the correspondence text analysis for MH and HH scores. The quantitative analysis indicates that the MH scoring approach tends to have fewer misscores across items and scoring categories, but each of the misscores affects the final score assignment. In contrast, not all MA misscores affect the final score assignment across items and scoring categories (see Figures 7, 9; Appendix Figures A4, A6). This is because some rubric categories in the MA approach are redundant in the combinations to assign a final score. For example, in the MA rubrics, there are a number of different valid claims students can use to be placed into a “claim” category, but only one valid claim is necessary for a given score category (for example, Table 2). This inherent property of the developed analytic rubric categories seems to contribute to increased validity of MA approach by reducing the effect of individual component misscores on the final assigned score. These results suggest that MA approach potentially reduces validity threats as compared to MH, provided the analytic rubrics allow for redundancy of critical categories.
Further, examination of MH misscores using correspondence text analysis did not reveal any relevant patterns associated with occurrence of certain phrases and words with specific types of misscores. Since MA and MH use similar text processing and classification algorithms for score generation, this finding suggests that the misscores by both MA and MH approaches were not associated with presence or absence of certain words but likely the overall structure of the argument and the way ideas were used in a sentence. Since most of the misscores by MA scoring approach are associated with higher-level components of argumentation practice, this suggests that the machine learning approach we employed was limited in capturing the exact meaning of words and phrases used as indicators of those argumentation components in our data set in the same way as human scorers do.
Further, misscores in MH approach do not seem to be easily interpretable because the ML ensemble used in this study is largely a black box that does not allow easy insights into possible misscores or how specific features may contribute to outputs of specific algorithms. One possible way to address this issue is to use results from a more “transparent” scoring approach (e.g., a regression algorithm) to look at specific features and weightings used in that approach (Rupp, 2018). However, the results of alternative or single algorithm approaches may not be very useful for interpreting misscores generated by ensemble scoring mechanisms and constructing validity arguments from such “transparent” approaches can still be challenging (Rupp, 2018). Instead, we believe the correspondence analysis is a reasonable approach to find potential patterns in the text of misscores based on the ensemble outcome variable (i.e., MH prediction). However, these patterns would still need to be interpreted in context of the assessment task and rubric.
In short, both quantitative analysis and correspondence analysis of MH misscores are less efficient than the misscore analysis afforded by the MA scoring approach, which allows for exact pinpointing of aspects of argumentation practice that were misscored. MH approach also does not provide an easy way to judge reasons for the misscores in a way that MA approach does by affording diagnosis down to the argumentation component level for each item. Therefore, this analysis brings forward a drawback of MH approach and supports using MA approach, which allows us to see the relevant misscored components, and therefore provides tools for improving the item and rubric quality and the ML-based scoring accuracy via model tuning.
Conclusion
We believe that the validation approach presented here can be successfully used for validating machine-based scores in a wide range of science disciplinary contexts where CR assessment items are involved, which is essential for adopting wide use of machine scoring techniques in education. The above analysis suggests that the MA scoring approach provides several advantages over the MH approach in terms of providing an easier way to diagnose the nature of the misscores by allowing us to pinpoint the exact analytic scoring category that has the most misscores as compared to human standard. This feature of MA scores is very important for being able to conduct quick and efficient validation studies because it allows identifying specific elements of the scoring rubric that are being misscored by the machine without having to infer about the nature of the misscores, as is the case with MH scores. Further, this allows a more focused error analysis of misscores since analytic categories are aligned to a single idea as opposed to general performance levels and therefore, enables quicker iterations over the processes of human coding, rubric revisions, and ML model development.
Study limitations and future research
In this study, we focused on conducting post-hoc analysis and did not have the opportunity to iterate and revise the items or rubrics to see if suggested modifications address the issues identified. Future studies should aim to investigate the effect of modifications suggested here on the resulting correspondence between human and machine scores. Additionally, while the ensemble and holistic scoring approach used in this study represent a black box that is not easily interpretable, other approaches to holistic scoring may allow for a more nuanced view of misscores. In the future, it would be informative to investigate human and machine score agreement for LP-aligned NGSS assessments with machine scoring methods that use different approaches in order to determine which ones are more effective in scoring such assessments. Finally, automatic scoring models for all items did not perform equally well, and not all models hit all thresholds for good model performance. Finally, although some individual bins have a small number of students which may have affected computer scoring accuracy of the specific bin, we believe that our findings, when taken together, provide evidence that the complex components of argumentation were in fact a challenge for the machine to score accurately.
Data availability statement
The raw data supporting the conclusions of this article will be made available by the authors, without undue reservation.
Author contributions
LK conducted all the data analyses and writing of the manuscript. KH provided feedback on both data analysis and writing. All authors contributed to the article and approved the submitted version.
Funding
This material is based upon work supported by the National Science Foundation under Grant No. 1561159.
Conflict of interest
The authors declare that the research was conducted in the absence of any commercial or financial relationships that could be construed as a potential conflict of interest.
Publisher’s note
All claims expressed in this article are solely those of the authors and do not necessarily represent those of their affiliated organizations, or those of the publisher, the editors and the reviewers. Any product that may be evaluated in this article, or claim that may be made by its manufacturer, is not guaranteed or endorsed by the publisher.
Supplementary material
The Supplementary material for this article can be found online at: https://www.frontiersin.org/articles/10.3389/feduc.2022.968289/full#supplementary-material
References
American Educational Research Association (2018). Standards for educational and psychological testing. Washington, DC: American Educational Research Association.
Anderson, C. W., De Los Santos, E. X., Bodbyl, S., Covitt, B. A., Edwards, K. D., Hancock, J. B., et al. (2018). Designing educational systems to support enactment of the next generation science standards. J. Res. Sci. Teach. 55, 1026–1052. doi: 10.1002/tea.21484
Bejar, I. I. (2011). A validity-based approach to quality control and assurance of automated scoring. Assess. Educ. 18, 319–341. doi: 10.1080/0969594X.2011.555329
Bennett, R. E., and Bejar, I. I. (1997). Validity and automad scoring: It’s not only the scoring. Educ. Meas. Issues Pract. 17, 9–17. doi: 10.1111/j.1745-3992.1998.tb00631.x
Clauser, B. E., Harik, P., and Clyman, S. G. (2000). The generalizability of scores for a performance assessment scored with a computer-automated scoring system. J. Educ. Meas. 37, 245–261. doi: 10.1111/j.1745-3984.2000.tb01085.x
Clauser, B. E., Kane, M. T., and Swanson, D. B. (2002). Validity issues for performance-based tests scored with computer-automated scoring systems. Appl. Meas. Educ. 15, 413–432. doi: 10.1207/S15324818AME1504_05
Clauser, B. E., Margolis, M. J., Clyman, S. G., and Ross, L. P. (1997). Development of automated scoring algorithms for complex performance assessments: a comparison of two approaches. J. Educ. Meas. 34, 141–161. doi: 10.1111/j.1745-3984.1997.tb00511.x
Clauser, B. E., Swanson, D. B., and Clyman, S. G. (1999). A comparison of the generalizability of scores produced by expert raters and automated scoring systems. Appl. Meas. Educ. 12, 281–299. doi: 10.1207/S15324818AME1203_4
Davi, A., Haughton, D., Nasr, N., Shah, G., Skaletsky, M., and Spack, R. (2005). A review of two text-mining packages: SAS text mining and word stat. Am. Stat. 59, 89–103. doi: 10.1198/000313005X22987
Greenacre, M. (2016). Correspondence analysis in practice. 3rd Edn. Boca Raton, FL: Chapman and Hall/CRC.
Haudek, K. C., Santiago, M., Wilson, C. D., Stuhlsatz, M., Donovan, B., Buck-Bracey, Z., et al. (2019). “Using automated analysis to assess middle school students.” in Compentence with scientific argumentation. NCME annual conference (Toronto, ON: National Council on Measurement in Education).
Jescovitch, L. N., Scott, E. E., Cerchiara, J. A., Doherty, J. H., Wenderoth, M. P., Merrill, J. E., et al. (2019). Deconstruction of holistic rubrics into analytic rubrics for large-scale assessments of students’ reasoning of complex science concepts. Pract. Assess. Res. Eval. 24:7.
Jescovitch, L. N., Scott, E. E., Cerchiara, J. A., Merrill, J., Urban-Lurain, M., Doherty, J. H., et al. (2020). Comparison of machine learning performance using analytic and holistic coding approaches across constructed response assessments aligned to a science learning progression. J. Sci. Educ. Technol. 30, 1–18. doi: 10.1007/s10956-020-09858-0
Jurka, T. P., Collingwood, L., Boydstun, A. E., and Grossman, E. (2013). RTextTools: a supervised learning package for text classification. RJournal 5, 6–12. doi: 10.32614/RJ-2013-001
Kaldaras, L. (2020). Developing and validating NGSS-aligned 3D learning progression for electrical interactions in the context of 9th grade physical science curriculum. Michigan State University.
Kaldaras, L., Akaeze, H., and Krajcik, J. (2021a). Developing and validating next generation science standards-aligned learning progression to track three-dimensional learning of electrical interactions in high school physical science. J. Res. Sci. Teach. 58, 589–618. doi: 10.1002/tea.21672
Kaldaras, L., Akaeze, H., and Krajcik, J. (2021b). A methodology for determining and validating Flatent factor dimensionality of complex multi-factor science constructs measuring knowledge-in-use. Educ. Assess. 26, 241–263. doi: 10.1080/10627197.2021.1971966
Kline, R. B. (2015). Principles and practice of structural equation modeling. New York, NY: Guilford publications.
Krajcik, J. S. (2021). Commentary—applying machine learning in science assessment: opportunity and challenges. J. Sci. Educ. Technol. 30, 313–318. doi: 10.1007/s10956-021-09902-7
Liu, O. L., Brew, C., Blackmore, J., Gerard, L., Madhok, J., and Linn, M. C. (2014). Automated scoring of constructed-response science items: prospects and obstacles. Educ. Meas. Issues Pract. 33, 19–28. doi: 10.1111/emip.12028
Liu, O. L., Rios, J. A., Heilman, M., Gerard, L., and Linn, M. C. (2016). Validation of automated scoring of science assessments. J. Res. Sci. Teach. 53, 215–233. doi: 10.1002/tea.21299
Mao, L., Liu, O. L., Roohr, K., Belur, V., Mulholland, M., Lee, H. S., et al. (2018). Validation of automated scoring for a formative assessment that employs scientific argumentation. Educ. Assess. 23, 121–138. doi: 10.1080/10627197.2018.1427570
Moharreri, K., Ha, M., and Nehm, R. H. (2014). Evo grader: an online formative assessment tool for automatically evaluating written evolutionary explanations. Evolution 7, 1–14. doi: 10.1186/s12052-014-0015-2
National Academies of Sciences, Engineering, and Medicine (2019). Science and engineering for grades 6–12: Investigation and design at the center. Washington, DC: National Academies Press.
National Research Council (2012). A framework for K-12 science education: Practices, crosscutting concepts, and core ideas. Washington, DC: National Academies Press.
National Research Council. (2014). Developing assessments for the next generation science standards. Washington, DC.
Nehm, R. H., Ha, M., and Mayfield, E. (2012). Transforming biology assessment with machine learning: automated scoring of written evolutionary explanations. J. Sci. Educ. Technol. 21, 183–196. doi: 10.1007/s10956-011-9300-9
NGSS Lead States. (2013). Next generation science standards: For states, by States. Washington, DC: The National Academies Press.
Noyes, K., McKay, R. L., Neumann, M., Haudek, K. C., and Cooper, M. M. (2020). Developing computer resources to automate analysis of students’ explanations of London dispersion forces. J. Chem. Educ. 97, 3923–3936. doi: 10.1021/acs.jchemed.0c00445
Osborne, J. F., Henderson, B., MacPherson, A., Szu, E., Wild, A., and Shi-Ying, Y. (2016). The development and validation of a learning progression for argumentation in science. J. Res. Sci. Teach. 53, 821–846. doi: 10.1002/tea.21316
Raykov, T., and Marcoulides, G. A. (2006). Estimation of generalizability coefficients via a structural equation modeling approach to scale reliability evaluation. Int. J. Test. 6, 81–95. doi: 10.1207/s15327574ijt0601_5
Raykov, T., and Marcoulides, G. A. (2011). Introduction to psychometric theory. Oxfordshire: Routledge.
Rosseel, Y. (2012). Lavaan: an R package for structural equation modeling. J. Stat. Softw. 48, 1–36.
Rupp, A. A. (2018). Designing, evaluating, and deploying automated scoring systems with validity in mind: methodological design decisions. Appl. Meas. Educ. 31, 191–214. doi: 10.1080/08957347.2018.1464448
Sieke, S. A., McIntosh, B. B., Steele, M. M., and Knight, J. K. (2019). Characterizing students’ ideas about the effects of a mutation in a noncoding region of DNA. CBE—Life Sci. Educ. 18:ar18. doi: 10.1187/cbe.18-09-0173
Smith, C. L., Wiser, M., Anderson, C. W., and Krajcik, J. (2006). Implications of research on Children’s learning for standards and assessment: a proposed learning progression for matter and the atomic-molecular theory. Measure. Interdisciplin. Res. Pers. 4, 1–98, doi: 10.1080/15366367.2006.9678570
Tomas, C., Whitt, E., Lavelle-Hill, R., and Severn, K. (2019). Modeling holistic Marks with analytic rubrics. Front. Educ. 4:89. doi: 10.3389/feduc.2019.00089
Urban-Lurain, M., Cooper, M. M., Haudek, K. C., Kaplan, J. J., Knight, J. K., Lemons, P. P., et al. (2015). Expanding a national network for automated analysis of constructed response assessments to reveal student thinking in STEM. ASEE Comput. Educ. J. 6:65
Wang, C., Liu, X., Wang, L., Sun, Y., and Zhang, H. (2021). Automated scoring of Chinese grades 7–9 students’ competence in interpreting and arguing from evidence. J. Sci. Educ. Technol. 30, 269–282. doi: 10.1007/s10956-020-09859-z
Williamson, D. M., Bejar, I. I., and Hone, A. S. (1999). Mental model comparison of automated and human scoring. J. Educ. Meas. 36, 158–184. doi: 10.1111/j.1745-3984.1999.tb00552.x
Williamson, D. M., Xi, X., and Breyer, F. J. (2012). A framework for evaluation and use of automated scoring. Educ. Meas. Issues Pract. 31, 2–13. doi: 10.1111/j.1745-3992.2011.00223.x
Wilson, M. (2009). Measuring progressions: assessment structures underlying a learning progression. J. Res. Sci. Teach. 46, 716–730. doi: 10.1002/tea.20318
Wilson, C., Haudek, K. C., Osborne, J., Stuhlsatz, M., Cheuk, T., Donovan, B., et al. (in press). Using automated analysis to assess middle school students’ competence with scientific argumentation. J. Res. Sci. Teach.
Yang, Y., Buckendahl, C. W., Juszkiewicz, P. J., and Bhola, D. S. (2002). A review of strategies for validating computer-automated scoring. Appl. Meas. Educ. 15, 391–412. doi: 10.1207/S15324818AME1504_04
Zhai, X., Haudek, K. C., Stuhlsatz, M. A., and Wilson, C. (2020a). Evaluation of construct-irrelevant variance yielded by machine and human scoring of a science teacher PCK constructed response assessment. Stud. Educ. Eval. 67:100916. doi: 10.1016/j.stueduc.2020.100916
Zhai, X., Krajcik, J., and Pellegrino, J. W. (2021). On the validity of machine learning-based next generation science assessments: a validity inferential network. J. Sci. Educ. Technol. 30, 298–312. doi: 10.1007/s10956-020-09879-9
Keywords: machine learning, NGSS, validity, learning progression, argumentation
Citation: Kaldaras L and Haudek KC (2022) Validation of automated scoring for learning progression-aligned Next Generation Science Standards performance assessments. Front. Educ. 7:968289. doi: 10.3389/feduc.2022.968289
Edited by:
Knut Neumann, IPN–Leibniz-Institute for Science and Mathematics Education, GermanyReviewed by:
Sascha Bernholt, University of Kiel, GermanyHye Sun You, The University of Iowa, United States
Copyright © 2022 Kaldaras and Haudek. This is an open-access article distributed under the terms of the Creative Commons Attribution License (CC BY). The use, distribution or reproduction in other forums is permitted, provided the original author(s) and the copyright owner(s) are credited and that the original publication in this journal is cited, in accordance with accepted academic practice. No use, distribution or reproduction is permitted which does not comply with these terms.
*Correspondence: Leonora Kaldaras, a2FsZGFyYXNAbXN1LmVkdQ==