 Kamila Misiejuk
 Ingunn Johanne Ness2
 Robert Gray
 Barbara Wasson
- 1Department of Information Science and Media Studies, University of Bergen, Bergen, Norway
- 2Centre for the Science of Learning and Technology (SLATE), University of Bergen, Bergen, Norway
- 3Department of Education, University of Bergen, Bergen, Norway
The switch to emergency remote teaching during the COVID-19 pandemic became for many university instructors a necessity to familiarise themselves with the institution’s online learning management system (LMS). This switch to online teaching made learning activities, course design patterns, and pedagogical approaches more visible than during face-to-face teaching. Furthermore, the process of translating physical learning activities to the digital space was challenging and needed institutional and leadership support. This paper presents an analysis of the changes made to the learning designs of 102 courses in a university’s LMS before, during, and after the pandemic. Using descriptive statistics and Epistemic Network Analysis we used LMS data to explore the use of LMS features revealing not only the overall university trends, but also faculty differences. In addition, we compared the learning activities as described in course descriptions with the actual learning activities designed in the LMS. Our findings show that although the switch to emergency remote teaching forced many instructors to change the learning designs of their courses, some instructors reverted to their pre-pandemic learning designs after the pandemic, while other instructors did not change their learning design during the pandemic at all. In addition, we identified a positive trend of an increased use of activity features in the learning management system. Finally, we reflected on the importance of the university leadership supporting the digital transformation.
1. Introduction
As a consequence of the COVID-19 pandemic, university instructors suddenly found themselves forced to use technology to deliver their courses. The switch to online learning made learning activities, course design patterns, and pedagogical approaches more visible than they are during face-to-face teaching. This, therefore, offered a unique opportunity to gain insights into the course learning designs that were implemented at different faculties and for different groups of students at the University of Bergen (UiB), Norway. Further, the learning designs show how UiB’s digital teaching tools were actually used. For such tools to be used, however, they had to be made available to instructors and students, and like most universities around the world, UiB was not fully prepared to move all of its teaching online in an instant (Adedoyin and Soykan, 2020; Johnson et al., 2020; Cone et al., 2022). Therefore, the role of the leadership during the pandemic was crucial. The university leadership developed different strategic measures to deal with various needs across the organisation to support the digital transformation. There was an urgent demand both for new technological tools and for support structures for instructors to learn how to use these tools.
For such tools to be used well, however, requires learning design. Learning design captures the plans that instructors have for their teaching related to intended learning outcomes, activities, assessments, and resources that students and teachers undertake in the context of a unit of learning (Conole, 2013). In this paper, we present an analysis of the changes in the learning designs of 102 university courses over three Fall semesters (‘19, ‘20, ‘21) in the institutional LMS, Canvas. Fall semester 2019 (F19) was the last semester before the outbreak of the COVID-19 pandemic in Spring 2020; Fall semester 2020 (F20) was a fully digital semester during the pandemic; and Fall semester 2021 (F21) was the semester when the pandemic restrictions were lifted. Descriptive statistics and Epistemic Network Analysis were used to answer the following research questions:
1. How are different courses structured in Canvas over three Fall semesters (F19, F20, F21)?
2. How are courses structured in different disciplines over three Fall semesters (F19, F20, F21)?
3. Which learning activities described on the university course sites are implemented over three Fall semesters (F19, F20, F21)?
The research presented in this paper was carried out under the It Takes a Community: The Digital Transformation of UiB (DigiTrans)1 project led by the Centre for the Science of Learning and Technology (SLATE). DigiTrans explored four themes: (1) Organisation, Leadership & Innovation, (2) Adaptation to Online Teaching & Learning, (3) Learning Design in Online Courses, and (4) Digital Student Behaviour. The four themes are interdependent and together captured the complexity of this innovative process in which the university found itself, and provided us with a unique picture of the digital transformation at the UiB during the extreme challenges of the COVID-19 situation. The results presented in this paper draw on research from themes 1 and 4.
2. Background
2.1. Emergency remote teaching in Norwegian higher education
The Norwegian government responded to the global COVID-19 pandemic with a general lockdown from the 12th of March 2020. Students and instructors at the UiB had to switch to fully online teaching and learning in a matter of hours. For the next year and a half, the teaching situation fluctuated between fully online, on campus, and hybrid solutions. Late in spring 2020, the UiB leadership announced that teaching could be conducted in person (on campus) in situations that allowed for social distancing (e.g., limited class sizes in larger rooms); however, a large outbreak during orientation week in August moved almost all teaching back to fully online until the 8th of February 2021, when the university again opened up for face-to-face teaching in small groups of up to 20 people.2 Fall semester 2021 was a combination of online and face-to-face teaching.3 Most pandemic restrictions in Norway were lifted on the 25th of September 2021, i.e., in the middle of the Fall semester 2021.4
In contrast to the implementation of online learning and teaching before the COVID-19 pandemic, the sudden transition in face of crisis is referred to as emergency remote teaching (Hodges et al., 2020). Commonly, designing effective online education would imply a careful design of instruction, however, the sudden lockdown did not allow instructors to spend much time on their online course design (Alqahtani and Rajkhan, 2020). In addition, the university’s leadership continually promised a return to the physical classroom as soon as possible, which may have dissuaded instructors from moving from emergency remote teaching to more thoughtful and intentional online teaching and learning strategies.
Norwegian studies found that student perception of emergency remote teaching in Norwegian Higher Education was dependent on discipline (Egelandsdal and Hansen, 2020a). Information technology students were positive about the transition to online learning Sørum et al., 2021, while medical students showed dissatisfaction with the university offer in clinical education (Helland et al., 2022). Gray and Lazareva (2021) interviewed 12 students in an introductory mechanics course and found that emergency remote teaching had some benefits, such as learning flexibility, but students reported less study effort. Also, they reported that they missed the social contacts and needed more structure to study. Similarly, the results of a mathematics student survey by Radmer and Goodchild (2021) showed that students missed the physical presence at the university and face-to-face learning. Further, student mental health had a negative influence on their learning. On the other hand, university instructors in Norway expressed a largely positive experience of transition to emergency remote teaching (Hjelsvold et al., 2020), but they also reported some pandemic-related challenges, such as making convenient choices, using pre-recorded lectures rather than more advanced methods, as well as a lack of digital competence and infrastructure/technological constraints (Damşa et al., 2021). Further, some instructors noticed that institutional resources were not the main source of support in the transition to emergency remote teaching (Damşa et al., 2021).
2.2. Learning design in learning management systems
A Learning Management Systems (LMS) is defined as “a web-based software application that is designed to handle learning content, student interaction, assessment tools and reports of learning progress and student activities” (Kasim and Khalid, 2016, p. 55). LMS are commonly adopted for formal learning and are predominantly used as repositories for reading and resources, such as pre-recorded lectures, and to facilitate communication between the instructor and students (Mpungose and Khoza, 2020). An LMS can also be used as a place to submit homework, to engage with quizzes or peer feedback, and to conduct group discussions (Fathema et al., 2015; Gray and Lazareva, 2021). An LMS can facilitate synchronous, asynchronous, and hybrid course delivery types (Sulun, 2018). LMS usability issues and lack of training are some of the main reasons why instructors do not adopt LMS in their teaching, or adopt them in a limited capacity (Chen et al., 2021). Most studies on the COVID-19 pandemic and LMSs focus on student or instructor perceptions, usually measured through surveys or interviews (e.g., Hjelsvold et al., 2020; Helland et al., 2022), rather than the analysis of the LMS data. The present study fills this gap.
Online learning designs may follow different types of pedagogies, such as transmitive (learning through information delivery), dialogic (student discourse to support learning), constructionist (learning through artefact development) and co-constructive (combination of dialogic pedagogy and artefact development) (Bower et al., 2009). Before COVID-19, only a few empirical papers examined different learning designs in LMSs. The most comprehensive study was conducted by Rienties and Toetenel (2016) where they not only mapped 189 modules in a fully online University LMS (Moodle), but also linked 151 modules with student activity data. Moreover, the analysis was complemented by data from a survey measuring student satisfaction, learning performance data, academic retention, and institutional analytics data, such as course level, discipline, class size. Rienties et al. (2017) reviewed 10 years of work on aligning learning design with learning analytics at the Open University UK, and found that in some of their studies revealed that “learning design decisions made by OU teachers seem to have a direct and indirect impact on how students are working online and offline, which in part also influenced their satisfaction and learning outcomes“(p. 147) and that “how teachers mix learning design activities substantially impacts what students do on a weekly basis, whereby between 40–69% of variance of VLE engagement is predicted by learning design and its module characteristics” (p. 147).
Another interesting study was conducted by Whitelock-Wainwright et al. (2020), where data from a sample of 6,040 courses--collected over 4 years included 2,077 unique course offerings from 10 faculties--were analysed. Learning design data from face-to-face (timetabling data) and online learning (LMS activities) were coded, compared and analysed using Epistemic Network Analysis (a data analysis and visualisation method that models connections between codes) to find differences between faculties. In particular, the results gave them insights, at the faculty level, into changing patterns in the usage of online and campus resources over the 4 years revealing the “evolving trends of pedagogical approaches in different disciplines, the needs for curriculum redesign, the capacity of learning resources, and the maturity of skills in utilising existing resources among both teachers and students” (Whitelock-Wainwright et al. (2020), p. 587). Finally, a white paper by Whitmer et al. (2016) determined 5 course archetypes based on an analysis of 70 k courses in Blackboard LMS from 927 institutions: supplemental (content-focused, an additional to physical teaching), complementary (announcement-focused, a way for the instructors to communicate with the students), social (facilitating peer-to-peer interactions), evaluative (focused on assessment), and holistic (balanced in terms of assessment, content, interactions).
The authors are not aware of any empirical studies focused on LMS learning design in the context of COVID-19 pandemic, nor in using learning analytics to compare changes in individual course learning designs over time.
2.3. Innovation and university leadership
The UiB leadership had to come up with new strategies and measures to support the digital transformation during the COVID-19 pandemic. A central feature of any crisis is the urgency in managing it and also the ability to recognize the innovative potential that follows crises. Innovation is about creating, developing and implementing a new product or process. In schools and other educational institutions, innovation will often refer to change that aims to improve practice (Skogen, 2004). However, there are many barriers to innovation.
One barrier is related to the size and complexity of the organisation and is often characterised by “silo thinking.” This means that there is little communication across professions as well as between different levels in the organisation. Thus, new practices are not shared across the organisation. This challenge was addressed at the UiB during the pandemic through the establishment of a group called the Frontrunners, which comprised representatives from the university leadership, and staff from the Program for University Pedagogy (UPed), the UiB Learning Lab, as well as a selected group of instructors from each of the university’s seven faculties who were identified as having advanced digital skills. The aim was that this group would share and develop ideas and practices in regular online meetings, and then that those ideas and practices would be shared out in the faculties to help colleagues with less advanced digital skills. The group also served as a university-wide resource group and as a sounding board for plans and initiatives developed by university leadership. Research shows that creativity and innovation is stimulated through interdisciplinary collaboration where different perspectives can meet and new ideas can be developed, as in the Frontrunners. According to Ness (2017) leaders for innovation processes facilitate these processes through relational leadership strategies with an emphasis on dialogue and this was also seen in how the UiB leadership supported the staff through for instance setting up the Frontrunners group.
Furthermore, various technical and technological barriers make it difficult to innovate. There may be a lack of technological capacity and technological competence (Koch and Hauknes, 2005; Koch et al., 2006). This was also a challenge that was addressed by the UiB leadership. The university had implemented an online LMS in 2015, but a suitable new digital infrastructure to support fully online teaching and learning including tools such as Zoom conferencing and Kaltura lecture recording and video delivery, had to be implemented on very short notice. All of this, including support to ensure that all of these systems were both available and reliable was provided and managed by UiB’s IT department (Kandal-Wright, 2020). In particular, Zoom proved to be a popular tool worldwide during the pandemic, as it was seen as closest to recreating physical learning in the digital space (Turnbull et al., 2021). To support the instructors, in concert with national and Nordic alliances, UiB invested not only in the software licences for Zoom, but also in the infrastructure for streaming and recording lectures (Ervik, 2021) using Kaltura. Further, the UiB Learning Lab (established in 2017 to promote and assist in the development of digital teaching, assessment and dissemination) and UPed (which provides pedagogical development for university teaching staff), offered online resources, webinars5 and individual consultations for instructors about the transition to digital teaching and provided additional materials about the use of digital tools to help instructors to develop their digital competencies. In addition, a group of resource persons was trained to assist the instructors at their own faculties in the transformation of teaching and assessment (Kandal-Wright, 2020).
3. Materials and methods
3.1. Canvas
Canvas is a cloud-based, open-source LMS developed in 2011 (Fernández et al., 2017) that provides “a suite of services according to need along with a number of third-party applications offered free of charge” instead of the one-size-fits-all LMS platform model that was popular at the time of Canvas’s creation (Marachi and Quill, 2020, p. 419). A free, self-hosted version of Canvas was piloted at the UiB in Fall 2015 as a replacement to the previous platform, Mi Side6 and adopted in 2016. Nowadays, UiB uses a free open-source version of Canvas, so not all functionalities of a purchased version are available. The platform is used as “the hub for digital teaching and learning at UiB”7 with three external tools integrated: Kaltura (screen and video recording), Zoom (real-time teaching), and Video Note (recording and streaming of physical teaching). Both Kaltura and Zoom were purchased after March 12th, 2020, when the pandemic closed down Norway, and the classrooms at UiB had equipment for recording and streaming installed and eventually the steamed files could be made available through Video Note. The Pedagogical Recommendations for Hybrid teaching and learning6 for UiB employees recommend using the course description as a starting point to design their courses in Canvas.
3.2. Sample
The data in this study was collected from two sources: (1) course plan pages on the university website, and (2) course sites in Canvas. University course pages include publicly available information, such as ECTS credits, teaching semester, and course outcomes. Canvas course pages can only be fully accessed by students participating in a particular course, or by university employees and students with special access privileges.
A selection of courses that were offered in Fall semesters 2019 (F19), 2020 (F20) and 2021 (F21) were analysed to compare changes in their learning design in Canvas before, during and after the COVID-19 pandemic. The course selection process took place after F20 and again after F21, and included courses that fulfilled the following criteria:
1. Bachelor study programme descriptions available on the university website that recommended taking the course in the 3rd semester of a Bachelor degree (see Figure 1).
2. The description of a course at the university course pages listed 10 or 15 ECTS credits and that a course was offered in a Fall semester.
3. A course had a Canvas site for all three semesters.

Figure 1. Archeology degree program (red box indicates the recommended courses for semester 3).
Our final dataset consists of 102 courses, providing 306 LMS learning designs. The courses in our sample represent 6 out of 7 UiB faculties and 26 departments. The Law Faculty was not included as none of their courses matched our inclusion criteria. In our dataset, 53 courses have 10 ECTS, while 49 courses are worth 15 ECTS credits (see Table 1). Most courses were conducted at the Faculty of Humanities (HUM, n = 50), Faculty of Mathematics and Natural Sciences (MNS, n = 19) and Faculty of Social Sciences (SC, n = 17). Only 7 courses from the Faculty of Medicine (MED), 5 courses from the Faculty of Psychology (PSY) and 4 courses from the Faculty of Fine Art, Music and Design (AMD) were included in our dataset.
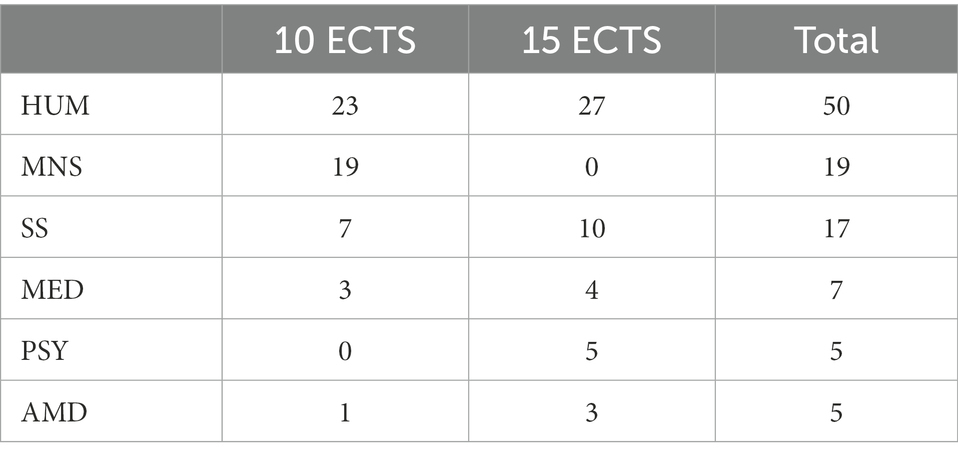
Table 1. Frequency of courses by faculty and ECTS credits.
3.3. Data
Canvas provides instructors with a number of features that they can use to design their course, which we refer to as features. The UiB installation of Canvas, provides instructors with 31 features. Figure 2 provides a student view on a Canvas course where some of the features are listed down the left-hand side of the page. The list of features included in our dataset are listed in Table 2.
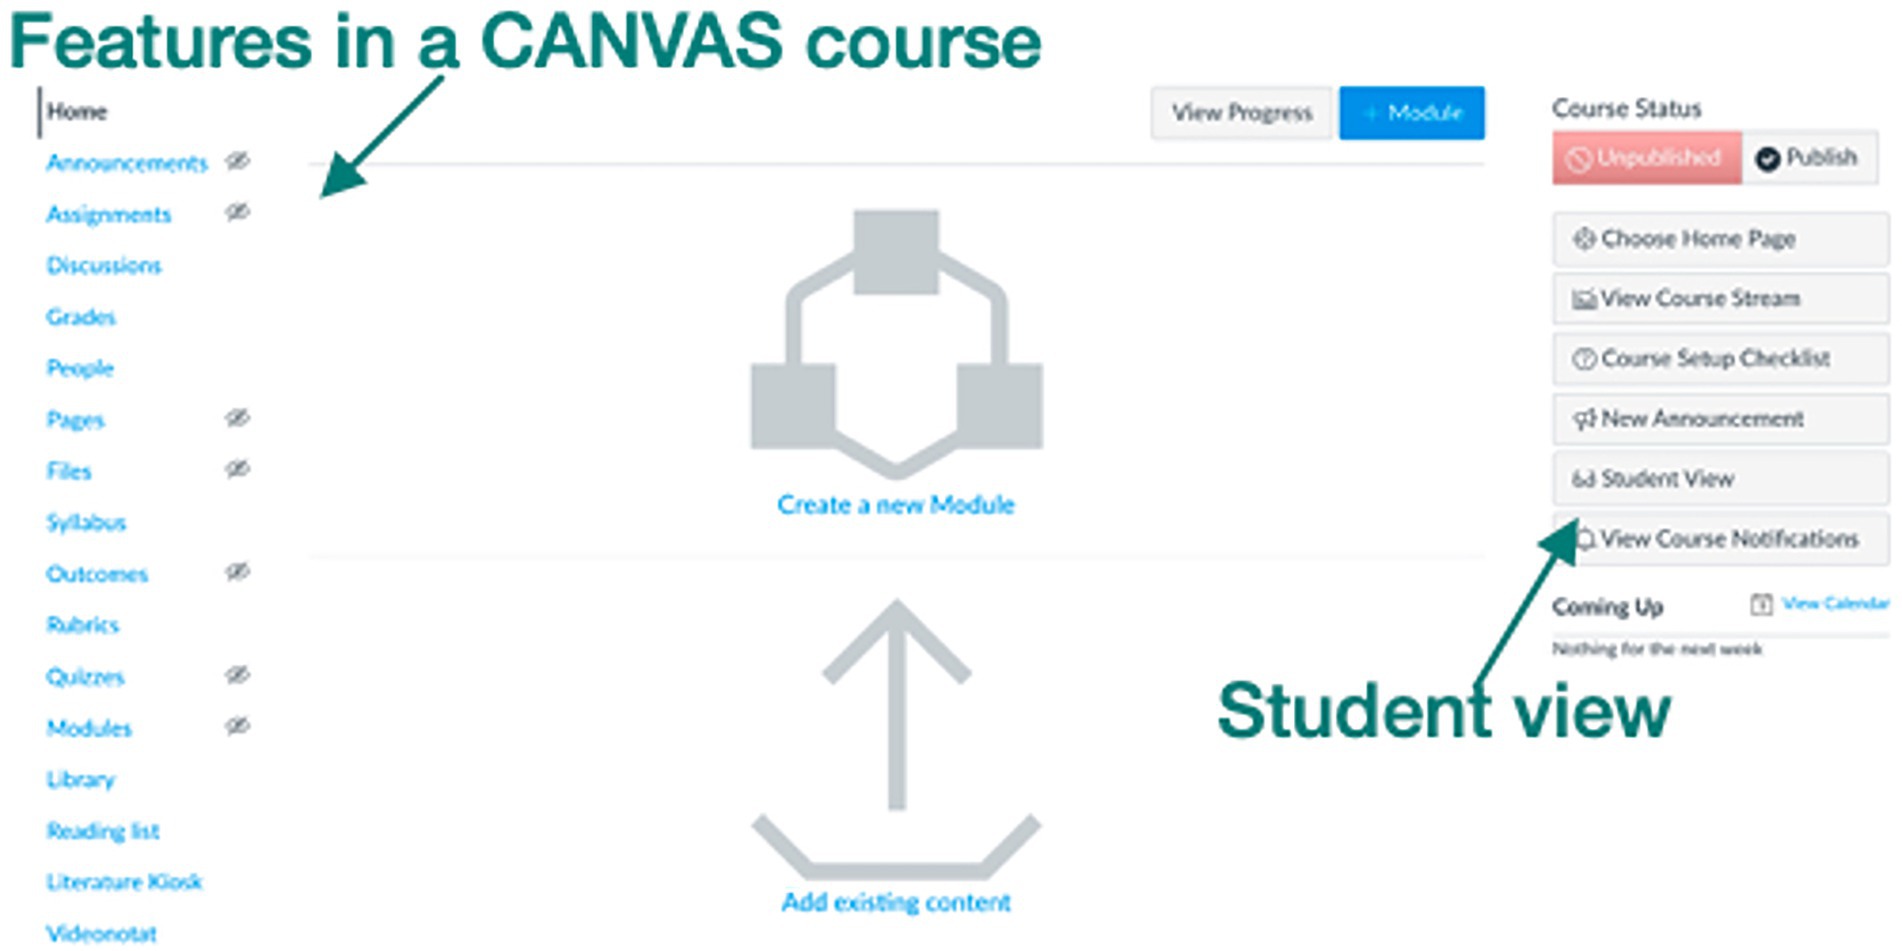
Figure 2. Screenshot of the teacher view in Canvas with the list of features.
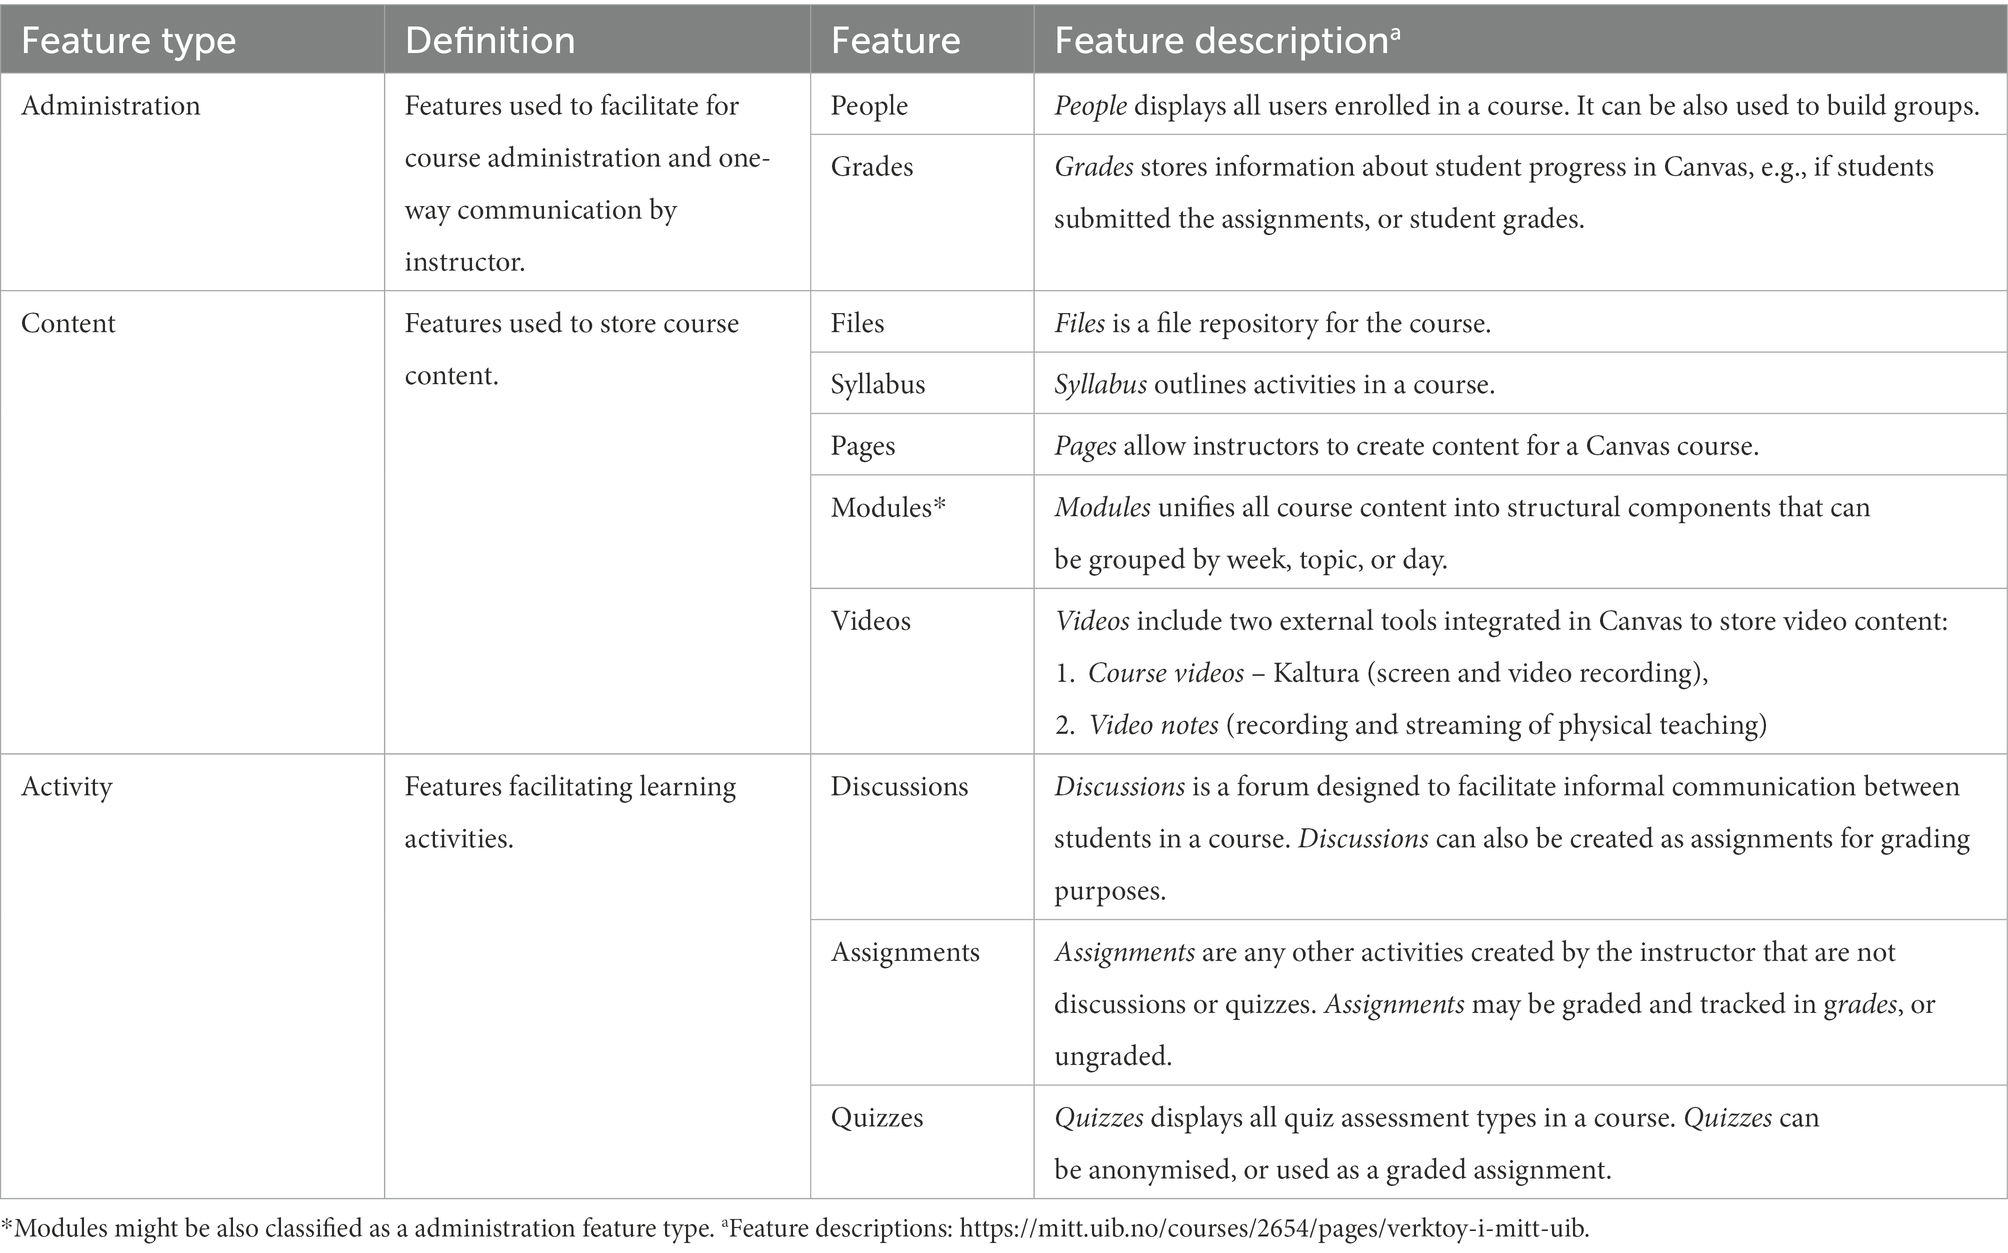
Table 2. Features in Canvas.
The Canvas data was collected manually by mapping the use of individual Canvas features on a two-point scale: “1”: feature, and “0”: no feature. Some features were included in the learning design of a course, however, they were not used during the semester. For example, a discussions feature may be in the list of features in the Canvas course site, but if there were no discussions threads (see Figure 3), the discussions feature was coded as “0” for this course. To simplify the coding, we merged video notes and course videos into one category, videos. If a video was posted either in video notes or course videos then videos was coded as “1” and “0” if the video feature was listed but there was no content.
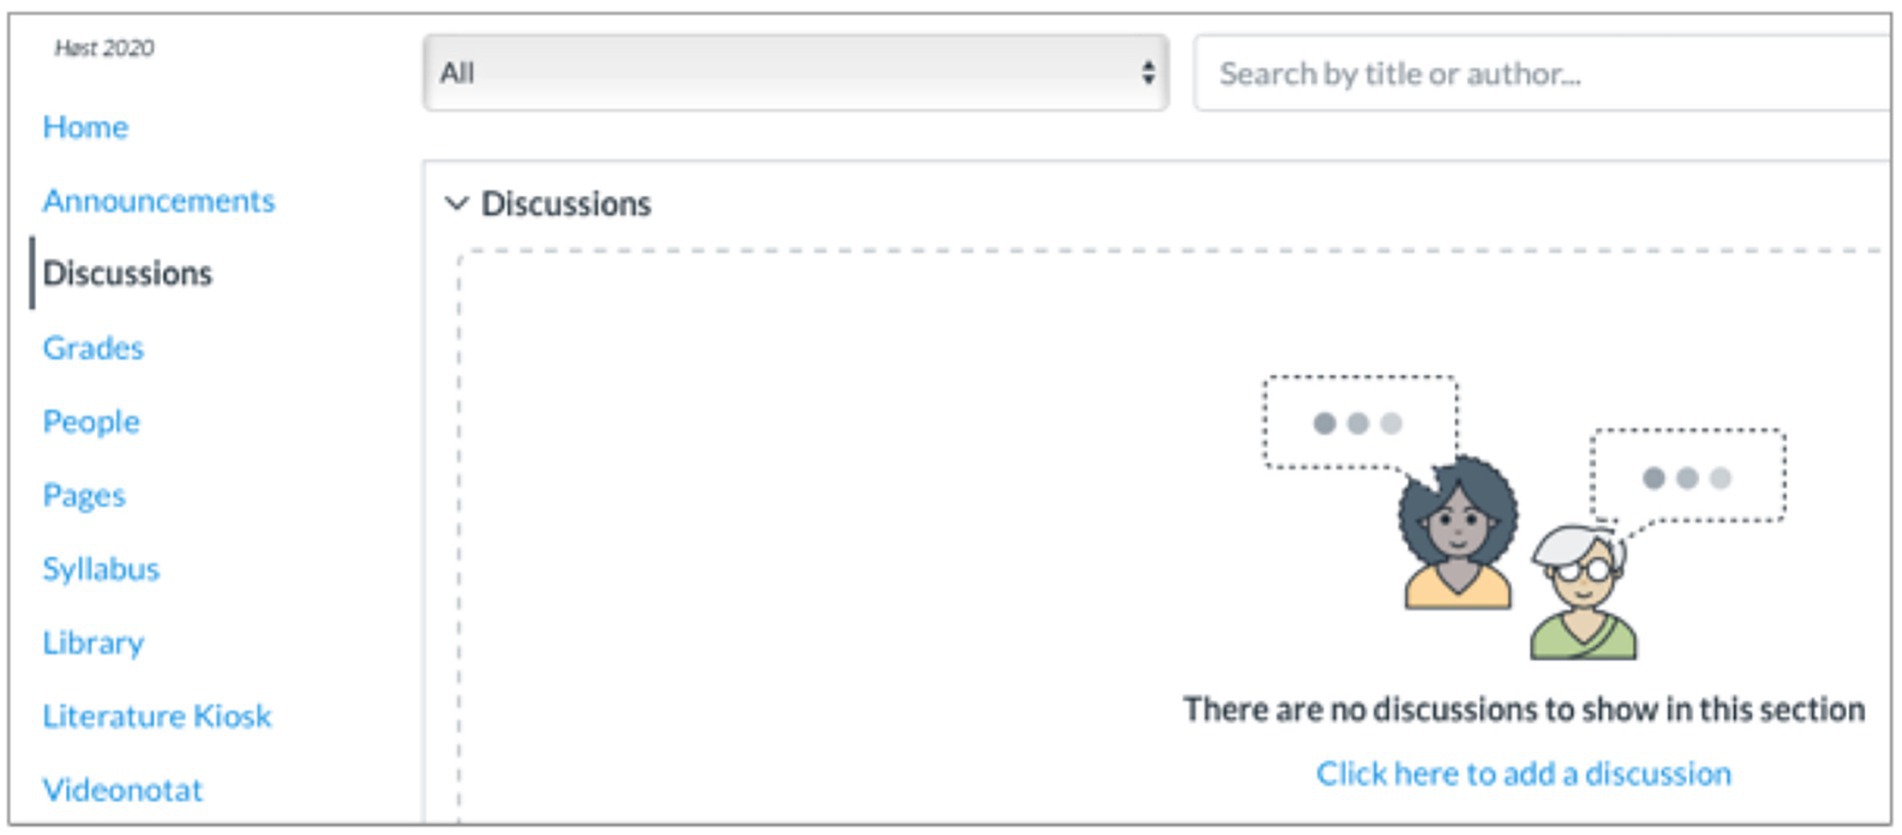
Figure 3. Screenshot of the discussions feature with no threads in Canvas.
To prepare the dataset to answer the first and the second questions, the individual features were divided into three categories: content, administration, and activity adapted from the LMS Activity Categorisation8 (Whitelock-Wainwright et al., 2020, p. 582).
To determine the extent to which a particular feature type was used (low or high) in the learning design of a course, we used the following formula:
A proportion of features higher than 0.5 was coded as high and below 0.5 as low. For example, a course could have a learning design high in administration features, low in content features, and high in activity features. Also, we established a high implementation rate, which indicated that a feature was implemented at least 60% of courses overall or at a specific faculty, depending on the research question.
To answer the third research question about which learning activities are used, learning activities from course descriptions were matched with Canvas activity features (discussions, assignments, quizzes; see Table 2). Each course at UiB has a standard course description page, found on the UiB website. We mapped eight learning activities in Teaching and Learning Methods or Compulsory Assignments and Attendance sections of course descriptions: assignments (n = 72), clinical service (n = 1), discussion (n = 9), group work (n = 7), peer feedback (n = 3), presentation (n = 20), self-study (n = 6), and test (n = 4). Learning activities from the course descriptions that could not be matched with Canvas activity features (e.g., clinical service or self-study), or were not specific enough to unambiguously be translated to learning activities in Canvas (e.g., group work or presentation) were excluded from the analysis. As depicted in Table 3, the final list of learning activities matched discussion from the course descriptions with Canvas activity feature discussions, while Canvas activity features assignments and quizzes were matched with written assignment, homework, or assignments from course descriptions.
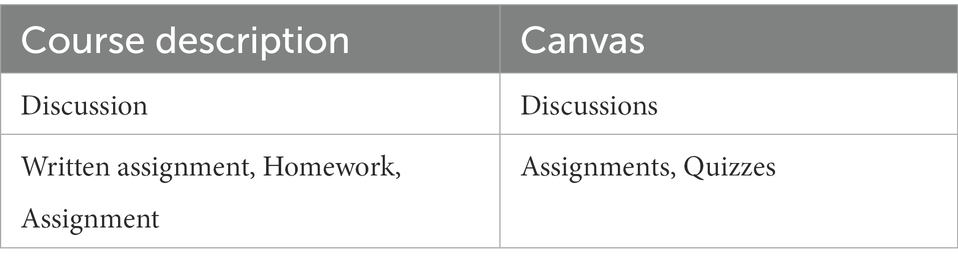
Table 3. Learning activities listed in course descriptions matched with Canvas activity features.
3.4. Epistemic Network Analysis
Epistemic Network Analysis (ENA) is a method that models the co-occurrence of codes within a line or a set of related lines using the singular value decomposition to identify statistically significant differences between groups (Shaffer et al., 2016). This method is used predominantly within the field of learning sciences, but has also been applied in the health sciences, and other disciplines (Kaliisa et al., 2021). The use of the individual features in our study is binary coded and, as such, suitable for an ENA analysis. An important advantage of ENA is the ability to compare different groups with each other. Further, ENA supports development of temporal trajectories to model the connection changes over time (Brohinsky et al., 2021). We also mapped the ENA projection space by labelling the x and y axes of the ENA graph using the course archetypes discovered by Whitmer et al. (2016) to interpret the visualisations:
• supplemental (LMS as a repository, an additional to physical teaching; high use of administrative features such as files),
• complementary (LMS as a one-way communication tool for instructors; high use of content features such as pages or syllabus).
• social (LMS facilitating high student engagement; high use of administrative features, such as people, or content features, such as discussions).
• evaluative (LMS focused on assessment; high use of activity features such as using assignments quizzes, or administrative features, such as grades).
The co-occurrences of the individual features were counted for a course offering in a semester. In this study, ENA was used to answer research question 1, where we examined the overall changes in the Canvas learning designs across the semesters. Our comparison groups were the three semesters (F19, F20, F21) and the unit of analysis was the individual courses in each semester. The changes in the position of network means in the ENA space were used to examine the development of learning designs over time. In addition, we compared the co-occurrence of individual features between the semesters. ENA was also used to examine research question 2, where we explored the differences in Canvas learning designs in different disciplines. The groups projected into the ENA space were the faculties in our sample, and the units of analysis was individual course offerings segmented by the three semesters. The analysis was focused on the differences in trajectories of faculty network means over the semesters and the overall course archetypes of the faculty courses.
4. Analysis
4.1. How different courses are structured in Canvas in F19, F20 and F21?
To answer the first research questions about how courses were structured, we examined the occurrence frequency of the individual Canvas features across the semesters and their implementation. Further, the averages of the feature types and the total number of features per course were calculated. In addition, three ENA networks were developed to visualise and analyse the changes in the learning designs across the semesters. Finally, the most common learning designs in each semester were identified.
Six Canvas features followed a pattern of an increased use from F19 to F20 and then a drop in F21 (see Table 4). The highest differences in use over the semesters can be seen in the use of the people and videos features, followed by the discussions, quizzes and pages features. Two features, grades and modules, were used by increasingly more courses each semester. The use of files and syllabus decreased in F20 and stagnated in F21. Surprisingly, the use of quizzes decreased in F20 in comparison to F19 and increased again in F21. Overall, the files, syllabus and pages features were implemented in over 60% courses in our sample over the three semesters. People and videos features had high implementation only in F20, while quizzes feature had high implementation only in F21.
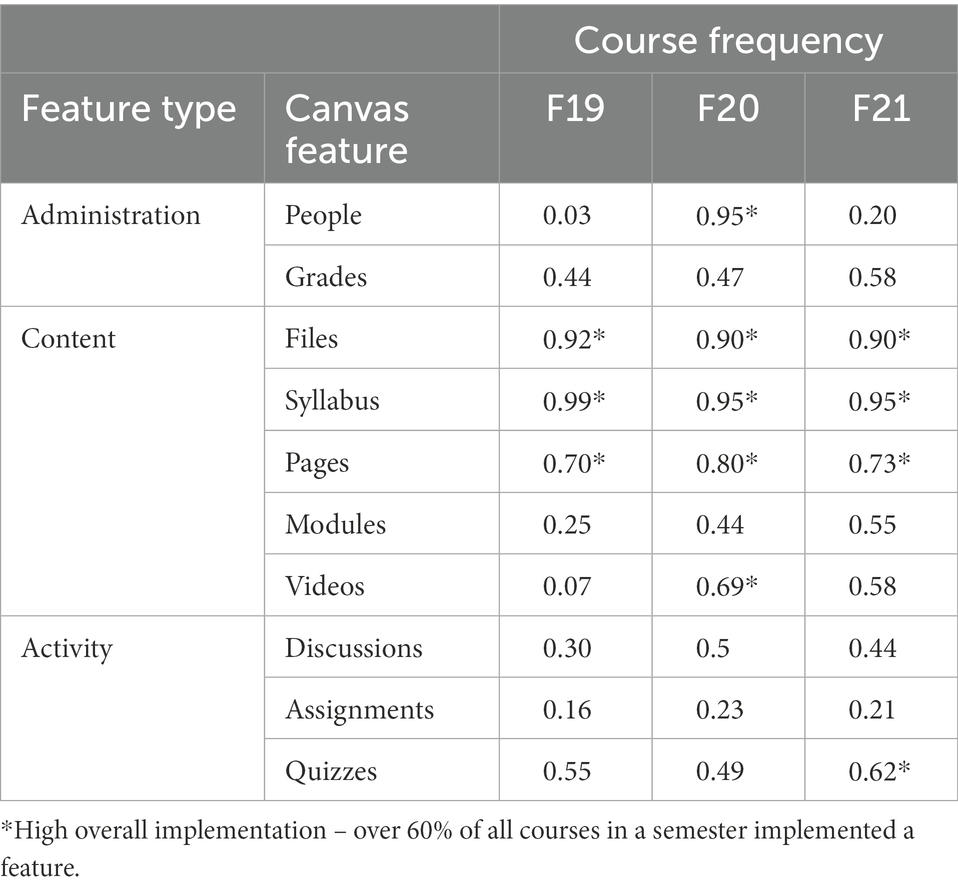
Table 4. Implementation rates of features per semester.
The mean number of administrative features per course in F19 was 0.78 (SD = 0.48). This number increased to 1.8 in F20 (SD = 0.51) and dropped to 1.06 in F21 (SD = 0.42). The use of content features per course increased from 2.93 in F19 (SD = 0.85) to 3.77 in F20 (SD = 0.89), and then slightly decreased to 3.71 in F21 (SD = 0.92). The use of activity features per course increased every semester from 1.01 in F19 (SD = 0.98) to 1.22 in F20 (SD = 1.001), and, finally, to 1.26 in F21 (SD = 1.01). The mean total number of features per course increased from 4.73 in F19 (SD = 1.73) to 6.79 in F20 (SD = 1.84), and then slightly dropped to 6.03 in F21 (SD = 1.62).
Figure 4 shows these results of the ENA analysis. Figure 4A depicts the individual features as codes projected onto the ENA space and the network means with confidence intervals for each semester. Three ENA models were developed: Model 1 comparing F19 and F20 (see Figure 4B), Model 2 comparing F20 and F21 (see Figure 4C), and Model 3 comparing F19 and F21 (see Figure 4D). Two sample t tests assuming unequal variance showed that all semesters were statistically significantly different from each other both along the X axis and Y axis with the exception of F19 and F21 that were not statistically significantly different along the Y axis (see Table 5). The model had co-registration correlations of 0.99 (Pearson) and 0.98 (Spearman) for the first dimension and co-registration correlations of 0.95 (Pearson) and 0.97 (Spearman) for the second. These measures indicate that there is a strong goodness of fit between the visualisation and the original model.
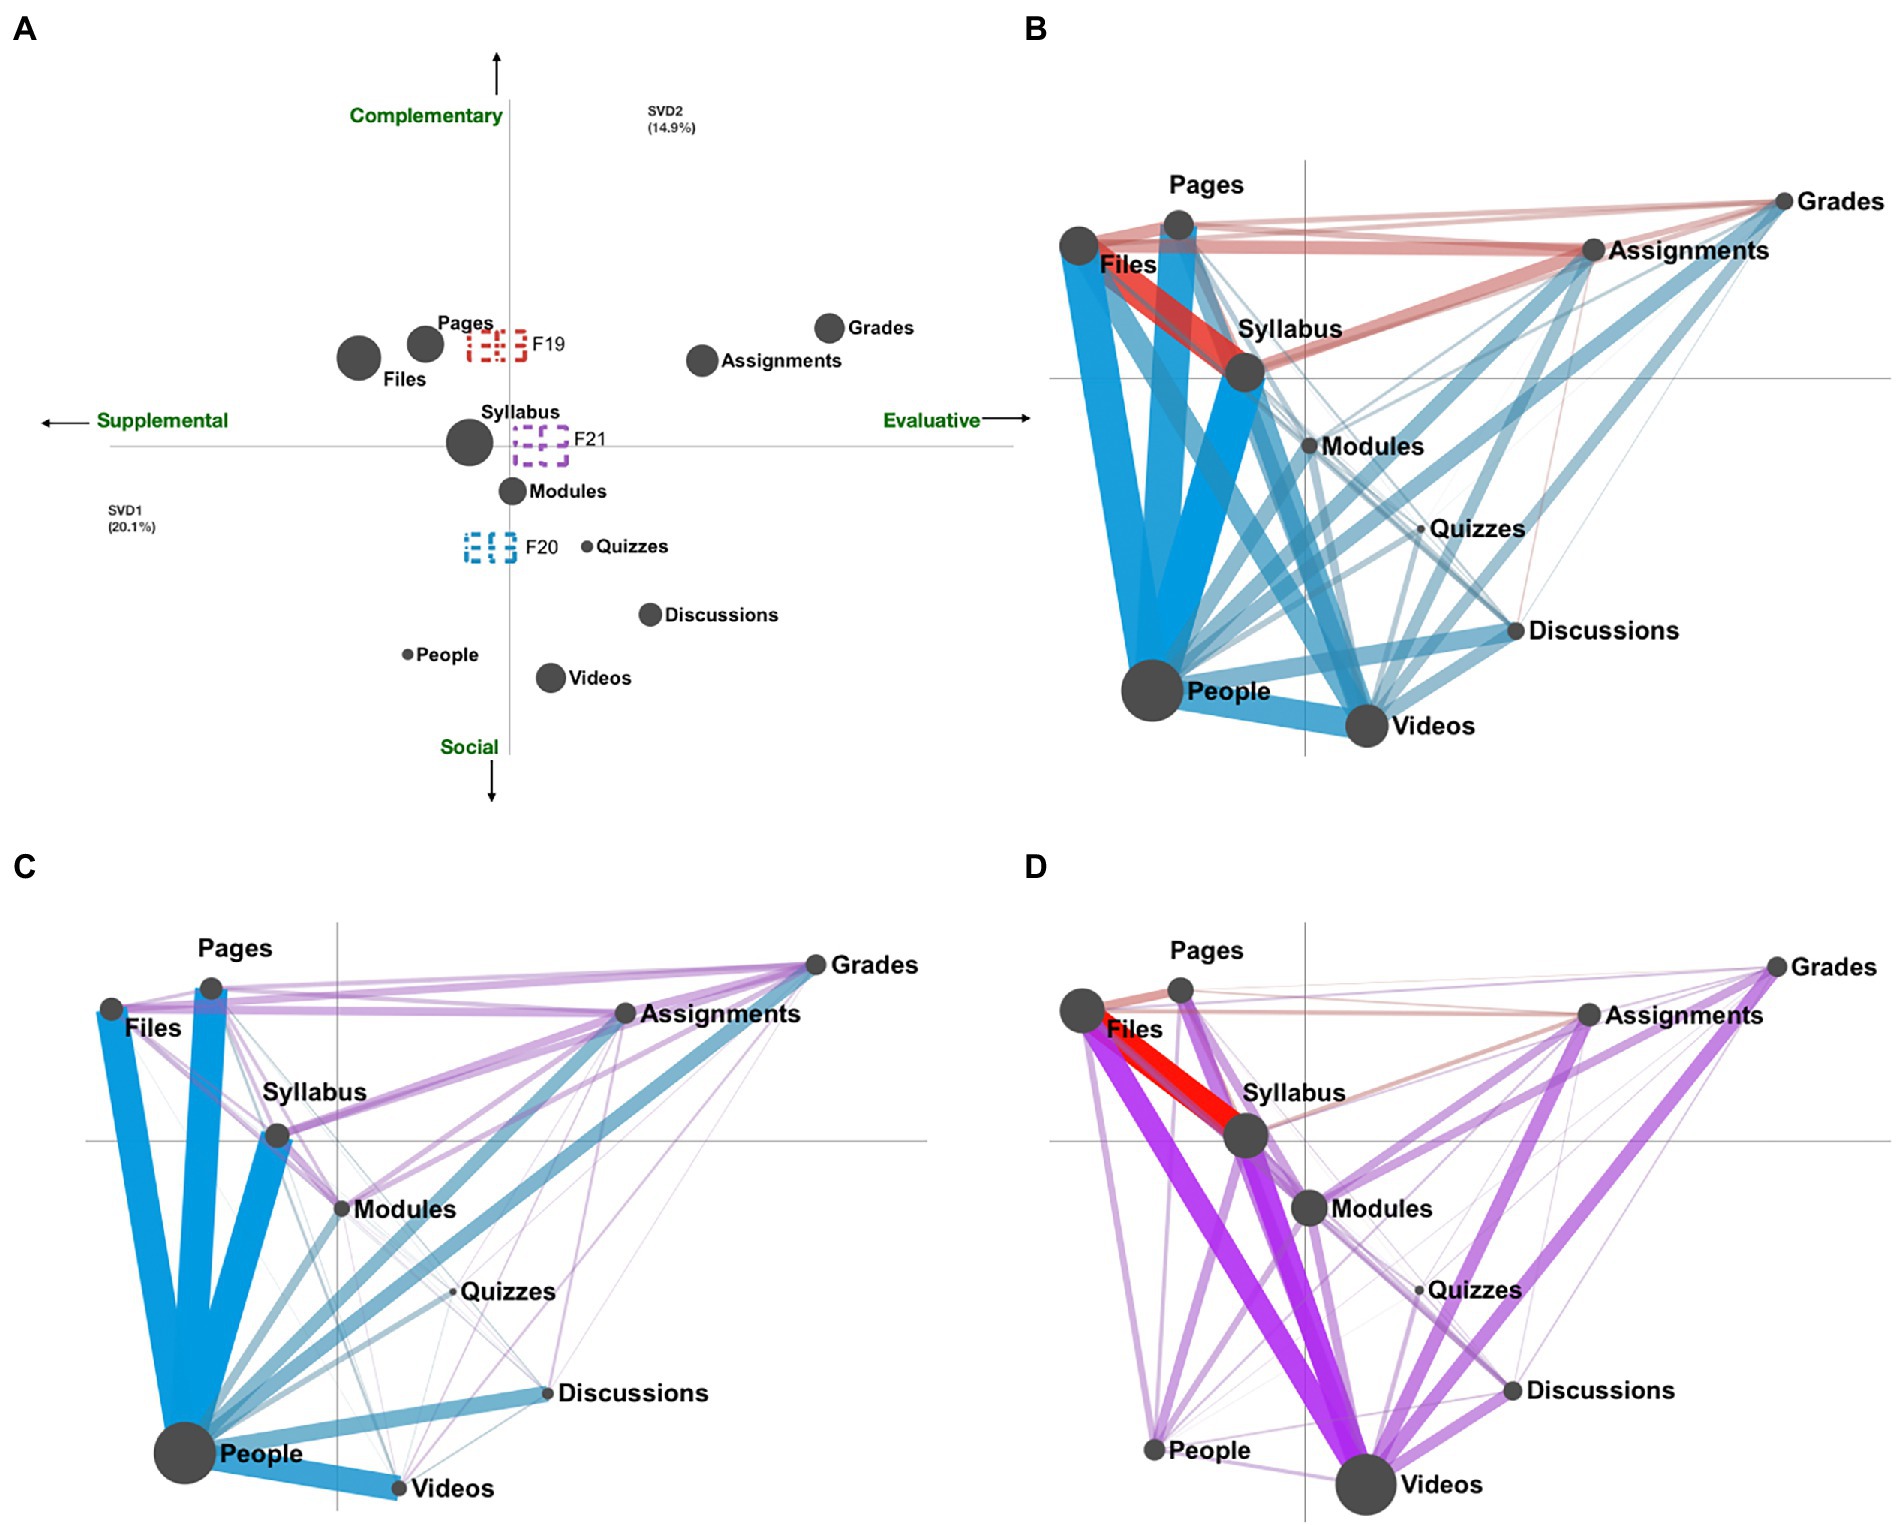
Figure 4. (A) ENA graph of the network means of the learning designs in three semesters (red: F19, blue: F20, purple: F21) with the mapping of the course types along the x and y axes; (B) Model 1: Comparison network of learning designs in F19 (red) and F20 (blue); (C) Model 2: Comparison network of learning designs in F20 (blue) and F21 (purple); (D) Model 3: Comparison network of learning designs in F19 (red) and F21 (purple).
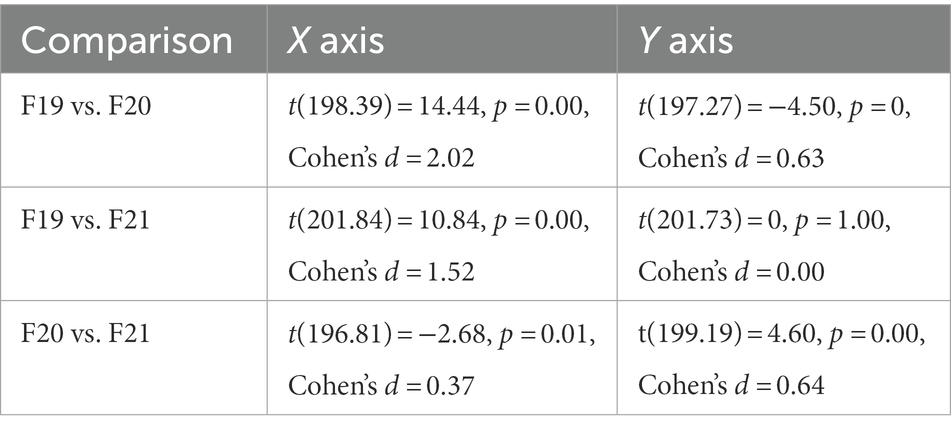
Table 5. Comparison networks’ statistics.
The strength of a connection in an ENA model (width of the connecting lines) indicates the frequency of a co-occurrence of features, i.e., which features are used together in the same learning design. The strongest connections in Model 1 (see Figure 4B) were among the following variables: files, syllabus and assignment, with the strongest connection between files and syllabus for F19. The network for F20 is dominated by the people feature that connects strongly with all other features. In Model 2 (see Figure 4C) the domination of the people feature is still strong for F20. The strongest connections for F21 in this model are between the following variables: grades, assignments, files and syllabus. The strongest connection in Model 1 for F19 (files-syllabus) was replaced with a weak connection for F21 in Model 2. However, in Model 3 (see Figure 4D) the connection is still dominated by F19. While people feature is the central code for F20 network, videos feature is the central code for F21 network, when compared with F20 in Model 3.
Four quadrants were mapped using the course archetypes (supplemental, complementary, social, and evaluative) depending on the Canvas features projected on a quadrant space (see Figure 4A). The position of the network means indicates the general trends of course learning designs across the semesters. F19 courses were complementary and supplemental to the face-to-face teaching. F20 courses moved towards being more social, while still supplemental to the traditional ways of teaching. F21 courses were structured more towards student evaluation, while balancing their complementary and supplemental learning designs.
The frequency of course types show noticeable differences in Canvas course learning designs over the semesters (see Table 6). The number of courses with high activity features doubled between F19 (n = 33) and F20 (n = 60) and remained stable in F21 (n = 61). A similar trend, although smaller in size, could be observed for the increased frequency of courses using high content features over the semesters: 77 courses in F19, 92 courses in F20 and 93 courses in F21. However, already in F19, around 75% of all courses in our sample used high content features, which indicates a high overall implementation rate. The most popular learning designs both in F19 and F21 were low in administration and activity features and high in content features, or low in administration features and high in both content and activity features. In F20 the most popular learning designs were high in both administration and content features and either low or high in activity features.
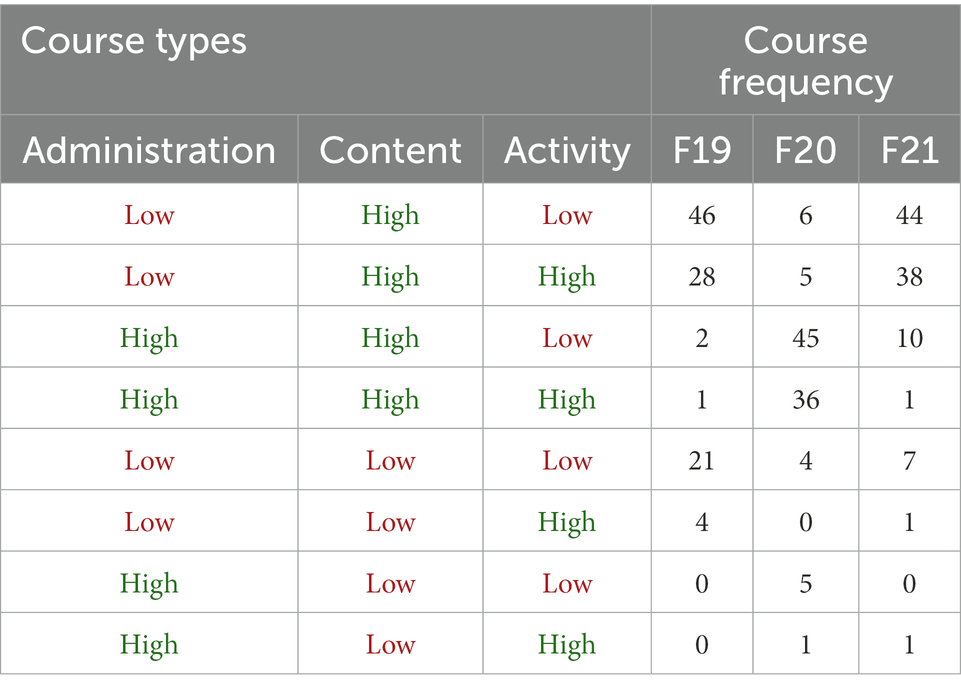
Table 6. Frequency of course types by semester.
To explore the differences in learning designs across the semesters in more detail, we examined how courses changed their learning designs between the semesters using the level of feature type use. Most courses changed their Canvas learning design between F19 and F20 (n = 70, 68%), and between F20 and F21 (n = 72, 71%). Interestingly, only 58 courses had a different learning design in F19 and F21 (57%). A closer analysis showed that out of 44 courses had the same learning design in both F19 and F21, the learning design of 24 courses was changed between F19 and F20, and then changed again between F20 and F21 to revert back to the F19 design (24% of all courses), while the learning designs of 20 courses just did not change at all over the three semesters (20% of all courses).
4.2. How are courses structured in different disciplines over three fall semesters (‘19, ‘20, ‘21)?
To answer the second research question, we started with descriptive statistics of the occurrence of each of the individual Canvas features and its overall implementation across the semesters at every faculty. Next, the average use of feature types and the total number of features used per course and how that changed by faculty and semester were examined. Also, we calculated how many courses actually changed their learning design across the semesters. To compare the changes in Canvas learning designs, we developed an ENA model segmenting the data by faculty to visualise and explore the disciplinary differences in learning designs. In particular, two comparison networks showing the faculties with the biggest differences in learning designs were developed. Finally, we mapped the most common learning designs in each semester for every faculty.
Table 7 shows a proportion of all courses at a faculty that adopted a feature in their Canvas learning designs and marks their overall implementation at a faculty. The use of grades feature had the highest increase by 62.5% at the Faculty of Mathematics and Natural Sciences (MNS), followed by the Faculty of Social Sciences (SS) with 30.77% and Faculty of Humanities (HUM) with 31.58%. None of the courses at the Faculty of Fine Art, Music and Design (AMD) in our sample used the grades feature over the three semesters, while the remaining faculties used this feature at similar levels over the semesters. The grades feature was implemented at over 60% of courses at the MNS, the SS, and the Faculty of Psychology (PSY) in F21. The people feature was used only by two courses at the Faculty of Medicine (MED) and one course at the MNS in F19. This changed dramatically in F20, where all courses at all faculties used this feature apart from the HUM with 90% implementation rate. In F21, no courses at the SS used people, only 20% of all courses at HUM, 16% at MNS, and few courses at other faculties. Only AMD had a high overall implementation of people in F21.
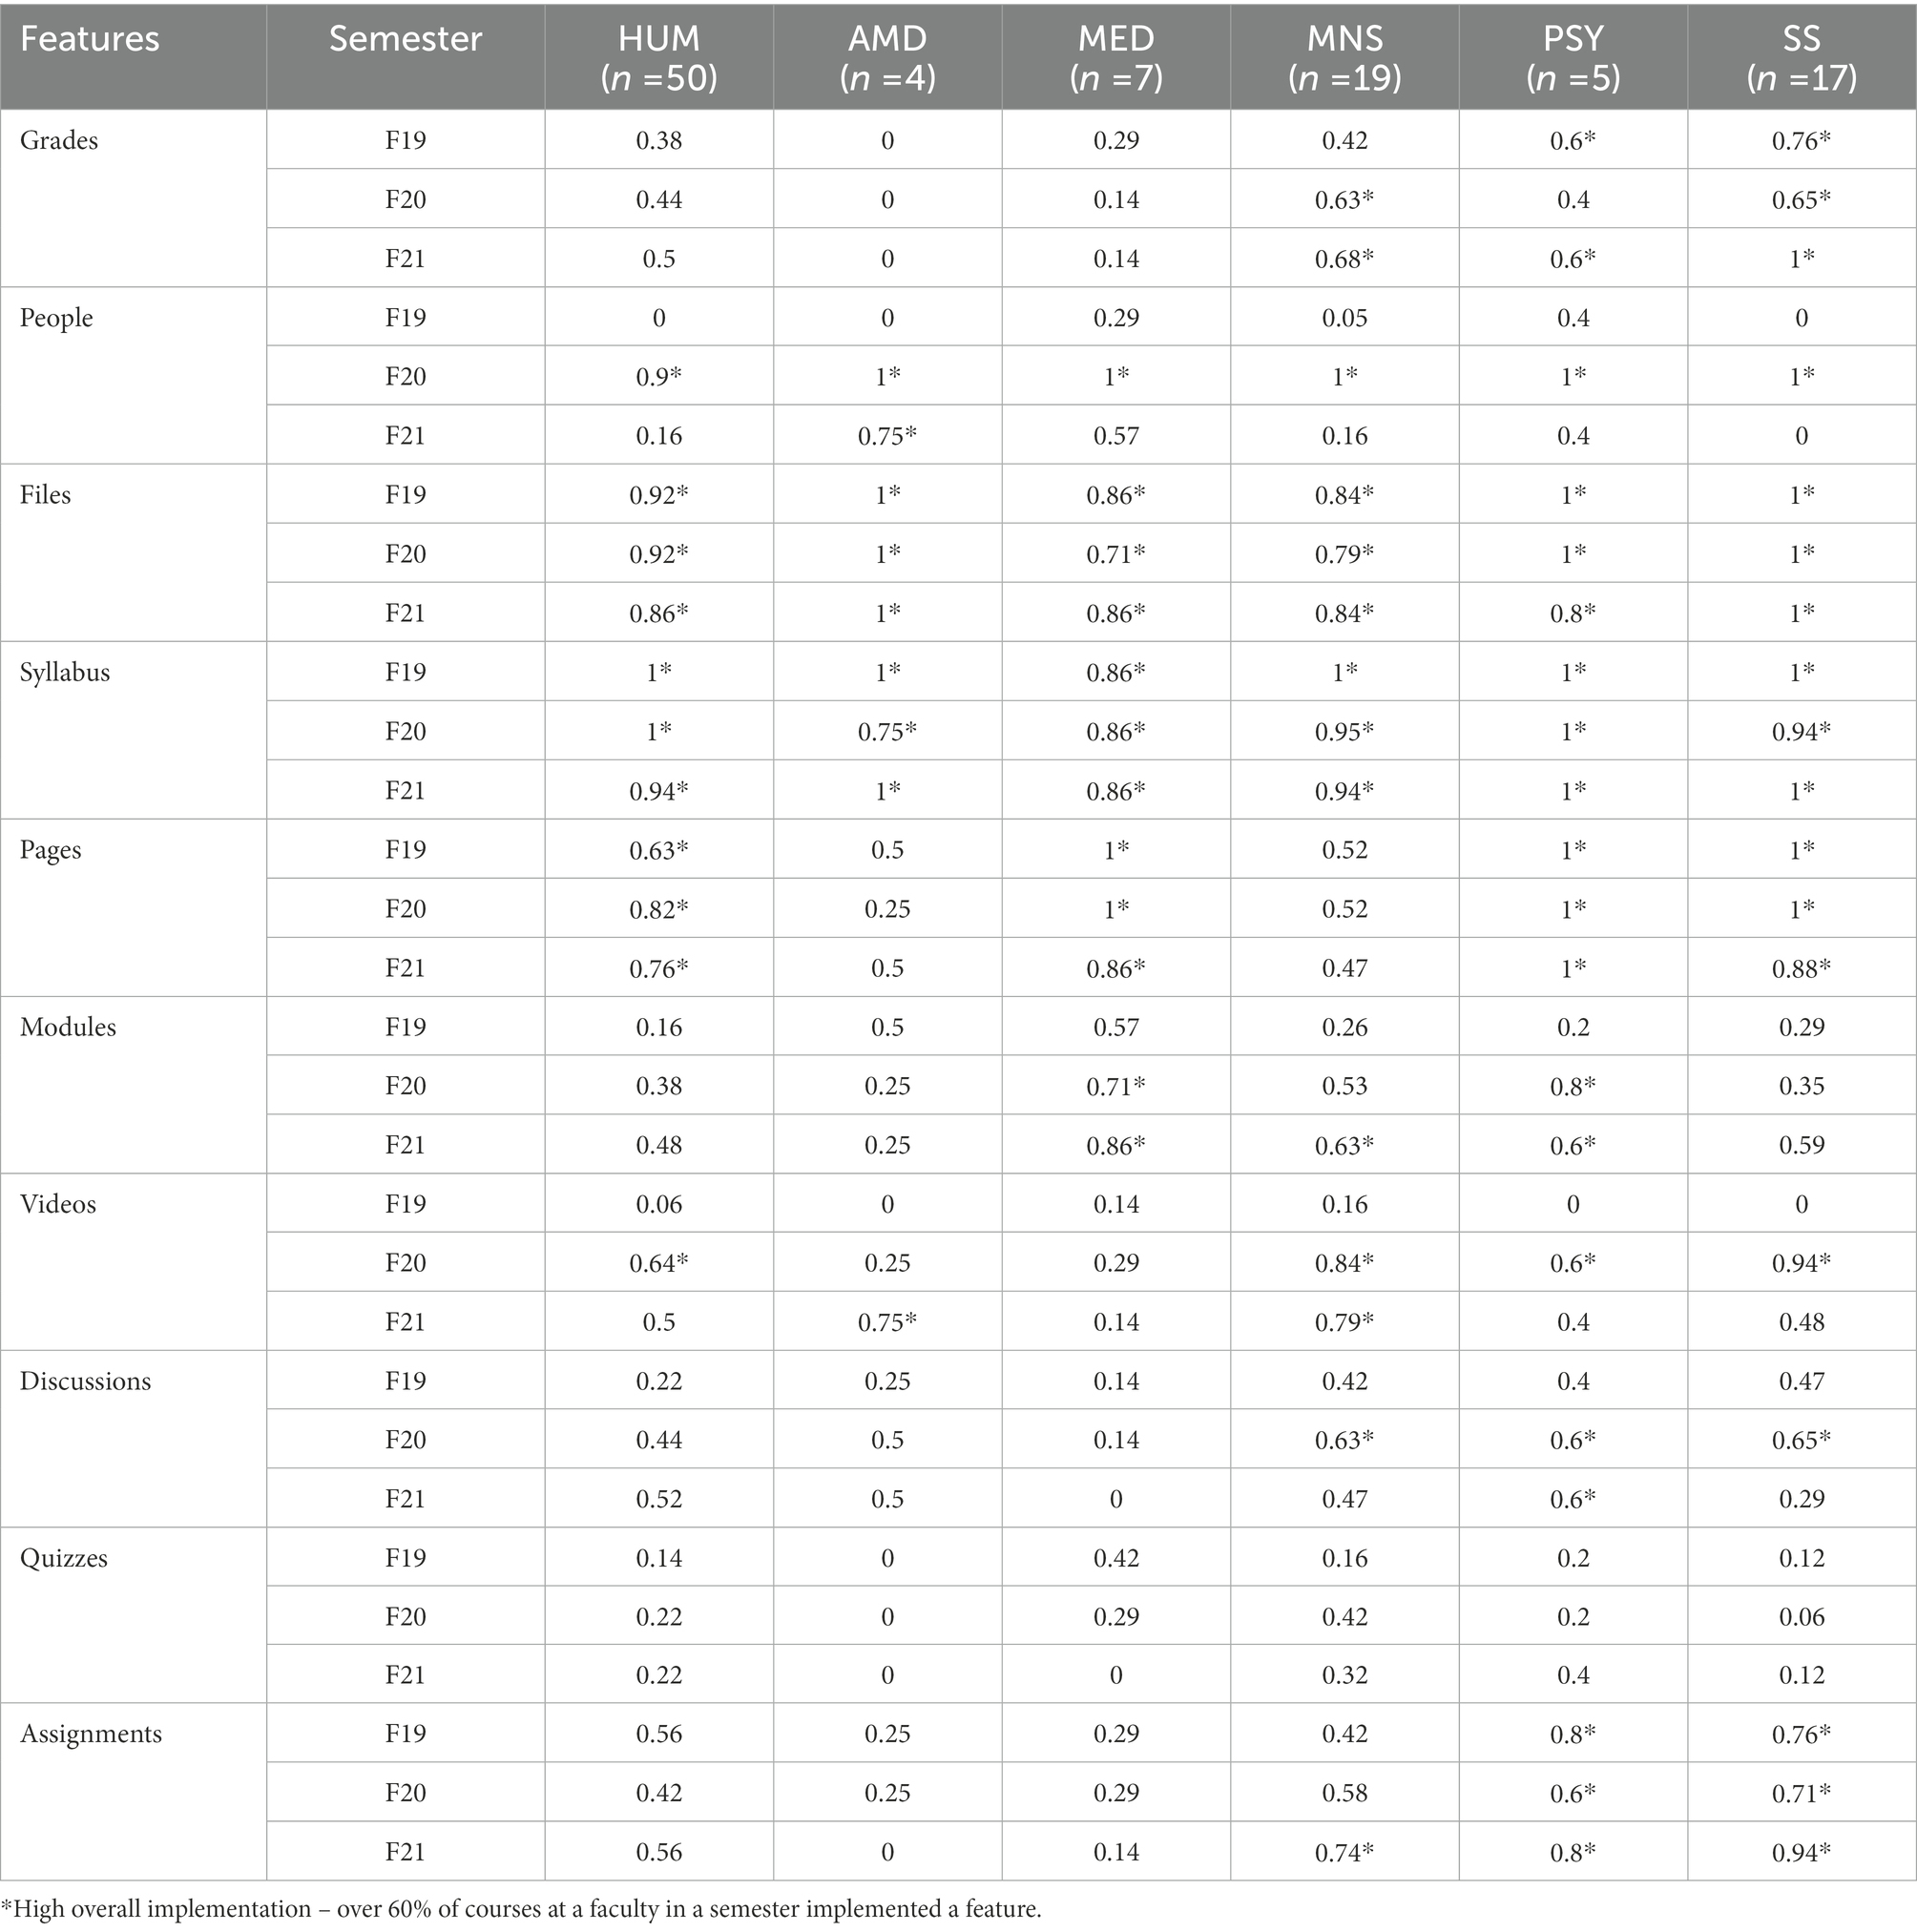
Table 7. Implementation rates of features per semester and faculty.
Syllabus and files are two of the most popular features among the courses at all faculties and were used by almost all courses at all faculties with few exceptions over the three semesters. The use of pages feature peaked in F20 and dropped slightly in F21 for all faculties except PSY, where all courses used this feature in all three semesters, and AMD, where 2 courses used it both in F19 and F21, and only one course in F20. The pages feature had a high overall implementation at all faculties over the three semesters except AMD and MNS, where the implementation never increased above 60% of all faculty courses in our sample. The use of the modules feature increased every semester at all faculties except the PSY, where it increased in F20 and dropped in F21, and AMD, where it dropped in F20 and stagnated in F21. Still, the high overall implementation of modules was found at no faculties in F19, at MED and PSY in F20 and in F21, and at MNS in F21.
In F19, the videos feature was used by a few courses at a few faculties (HUM, MED, and MNS). In F20, most courses at all faculties used this feature with exception of the AMD and MED, where only a minority of courses used videos in F20. In F21, the use of videos decreased at all faculties except the AMD, where its use increased to a high overall implementation. Only at the MNS were videos also implemented at over 60% of the courses in F21.
Most courses at all faculties did not use the discussions in F19. Though its use increased in F20 to a high overall implementation rate at PSY, MNS and SS, it remained relatively low in F21 with high overall implementation only at the PSY. None of the courses used the quizzes feature at AMD over the three semesters, while its use dropped to 0% at MED from 43% in F19. Quizzes were implemented in over 60% of the courses at no faculty during the three semesters. Surprisingly, the use of assignments dropped or remained stagnant in F20 for all faculties. The use of assignments increased at all faculties in F21 except AMD, where it dropped to 0 courses, and MED, where only one course used it. Assignments had an overall high implementation at PSY and SS over the three semesters, and at MNS in F21.
Figure 5A shows the network means with confidence intervals projected onto the ENA space. The graph was rotated by the means of two furthest faculties SS and AMD to visualise maximum variance explained between the two groups. The overlapping confidence intervals among the faculty networks indicate a lack of statistically significant differences between the groups. There is a strong goodness of fit between the visualisation and the original model, as indicated by co-registration correlations of 0.99 (Pearson) and 0.99 (Spearman) for the first dimension and co-registration correlations of 0.97 (Pearson) and 0.97 (Spearman) for the second.
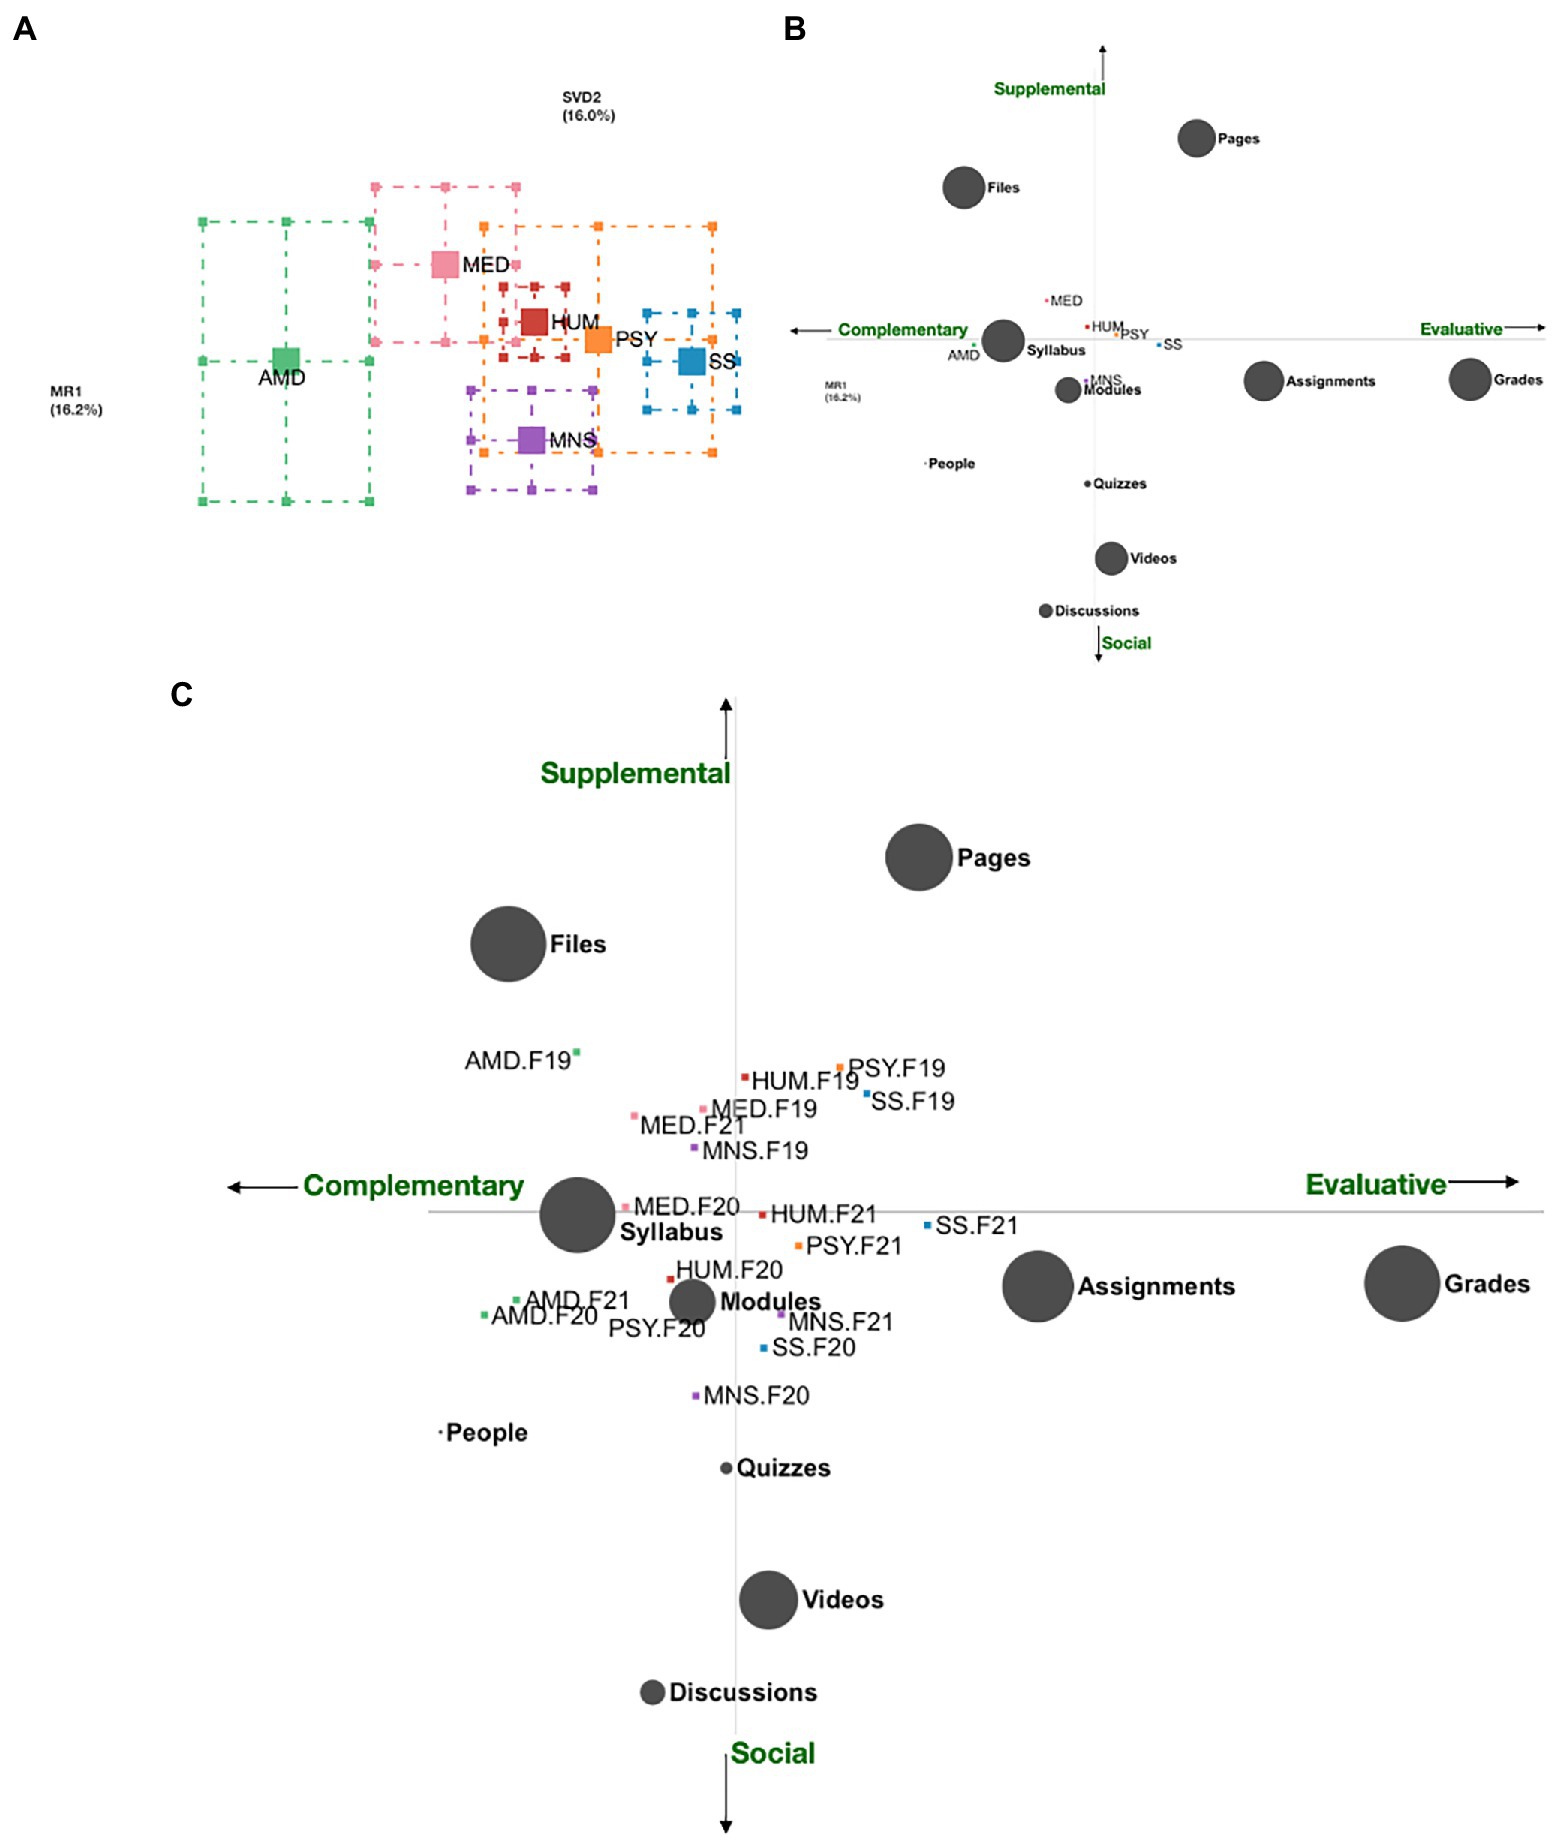
Figure 5. (A) Faculty network means with confidence intervals projected to the ENA space (green: AMD, pink: MED, red: HUM, purple: MNS, orange: PSY, blue: SS); (B) ENA network means of faculty learning designs with the mapping of the course types along the x and y axes (green: AMD, pink: MED, red: HUM, purple: MNS, orange: PSY, blue: SS); (C) ENA network means of faculty learning designs by semester with the mapping of the course types along the x and y axes (green: AMD, pink: MED, red: HUM, purple: MNS, orange: PSY, blue: SS).
Four quadrants were mapped using the course archetypes (supplemental, complementary, social, and evaluative) depending on the Canvas features projected on a quadrant space (see Figure 5B). The position of the network means indicates the general trends of course learning designs at each faculty across the semesters. Only courses at MED remained supplemental complementary across all the semesters. The Canvas design in F19 at AMD was supplemental complementary and it shifted to social complementary in F20 and F21, while at the SS it changed from supplemental evaluative in F19 to evaluative social in F20 and F21. Both courses at PSY and HUM moved from supplemental evaluative in F19 to social complementary in F20, and to evaluative social in F21. The Canvas learning design at MNS started as supplemental complementary in F19, changed to social complementary in F20, and finally, to evaluative social in F21.
For better readability, the confidence intervals were removed from Figure 5C that depicts the overall learning designs at a faculty across the three semesters by the position of the faculty network mean. Over the three semesters, the use of the Canvas was complimentary and social for AMD and MNS. MED and HUM designed supplemental and complementary courses. The courses at PSY were evaluative and supplemental, while at SS evaluative and social.
All faculties used the highest number of administration features in F20 (see Table 8). The highest number of content features was used in F20 by all faculties, except AMD, which peaked in F19, MNS, which peaked in F21, and SV, which used the same number of content features in F20 and F21 (both of which were higher than in F19). The highest number of activity features per course was used at MED in F19, at HUM and PSY in F20, and at all other faculties in F21. The highest overall number of features used per course was highest in F20 for all faculties except he AMD that peaked in F21.
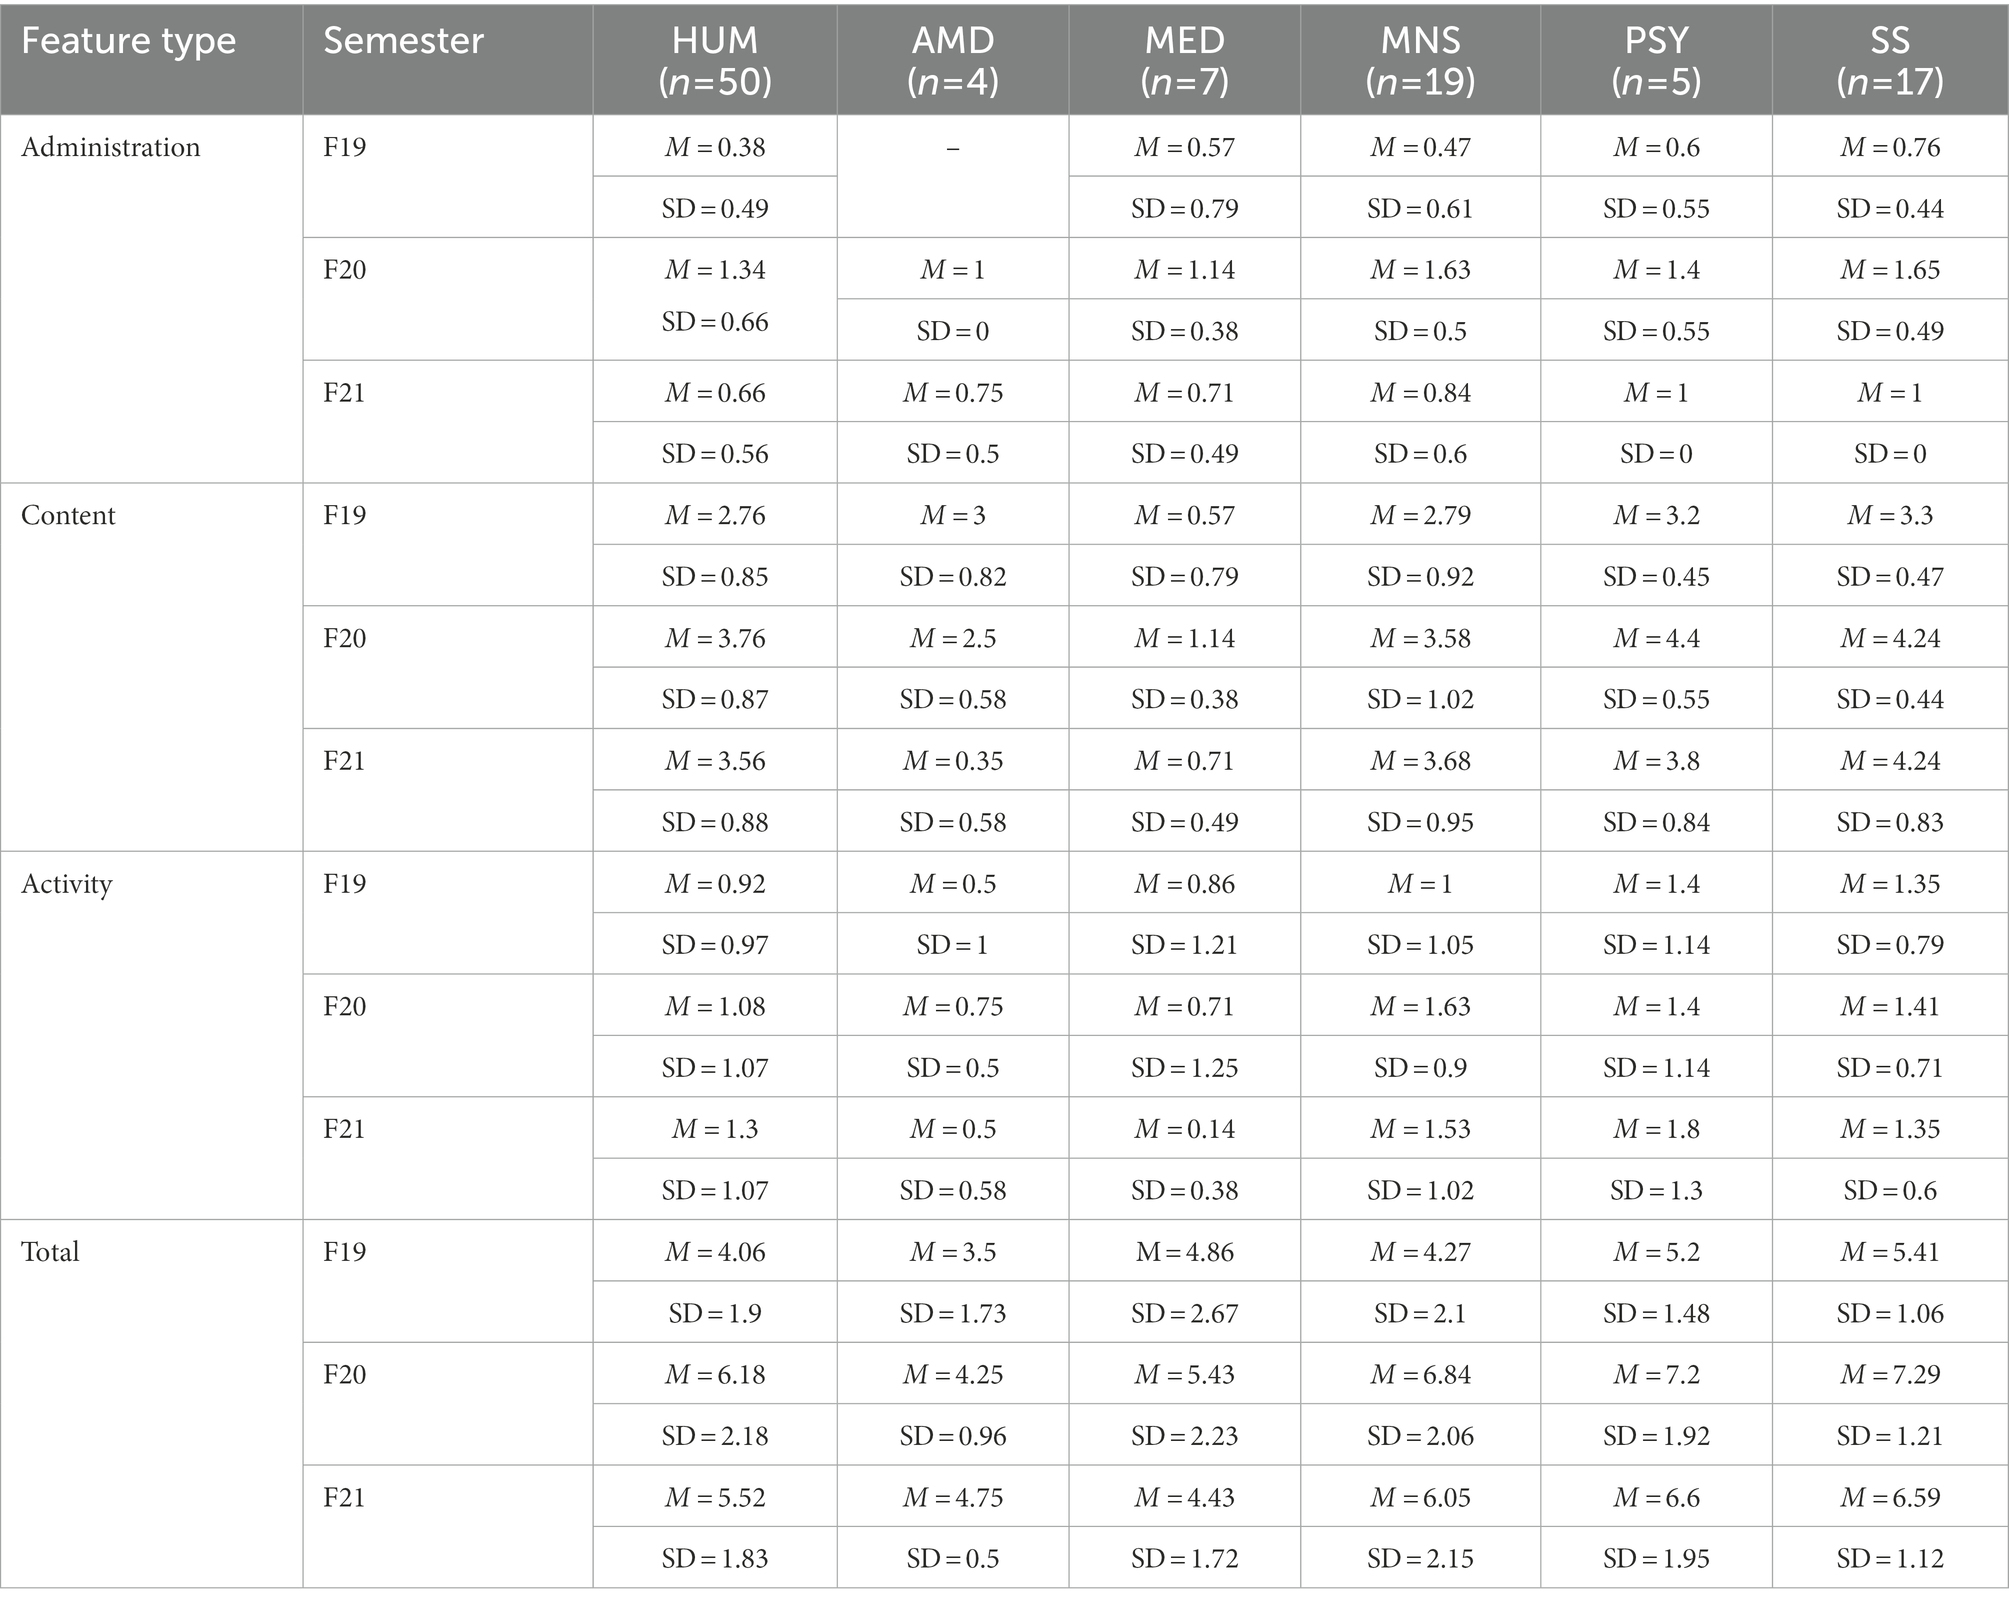
Table 8. Descriptive statistics of feature types by semester and faculty.
Low in administration and activity features and high in content features was the most popular course type at AMD and at MED over three semesters, as well as at HUM and the PSY in F19 and F20, and in F19 and at SS in F21 (see Table 9). Low in administration and high in content and activity features was the most popular learning design at HUM and PSY in F21. A learning design high in all features was the most popular in F20 at MNS and SS.
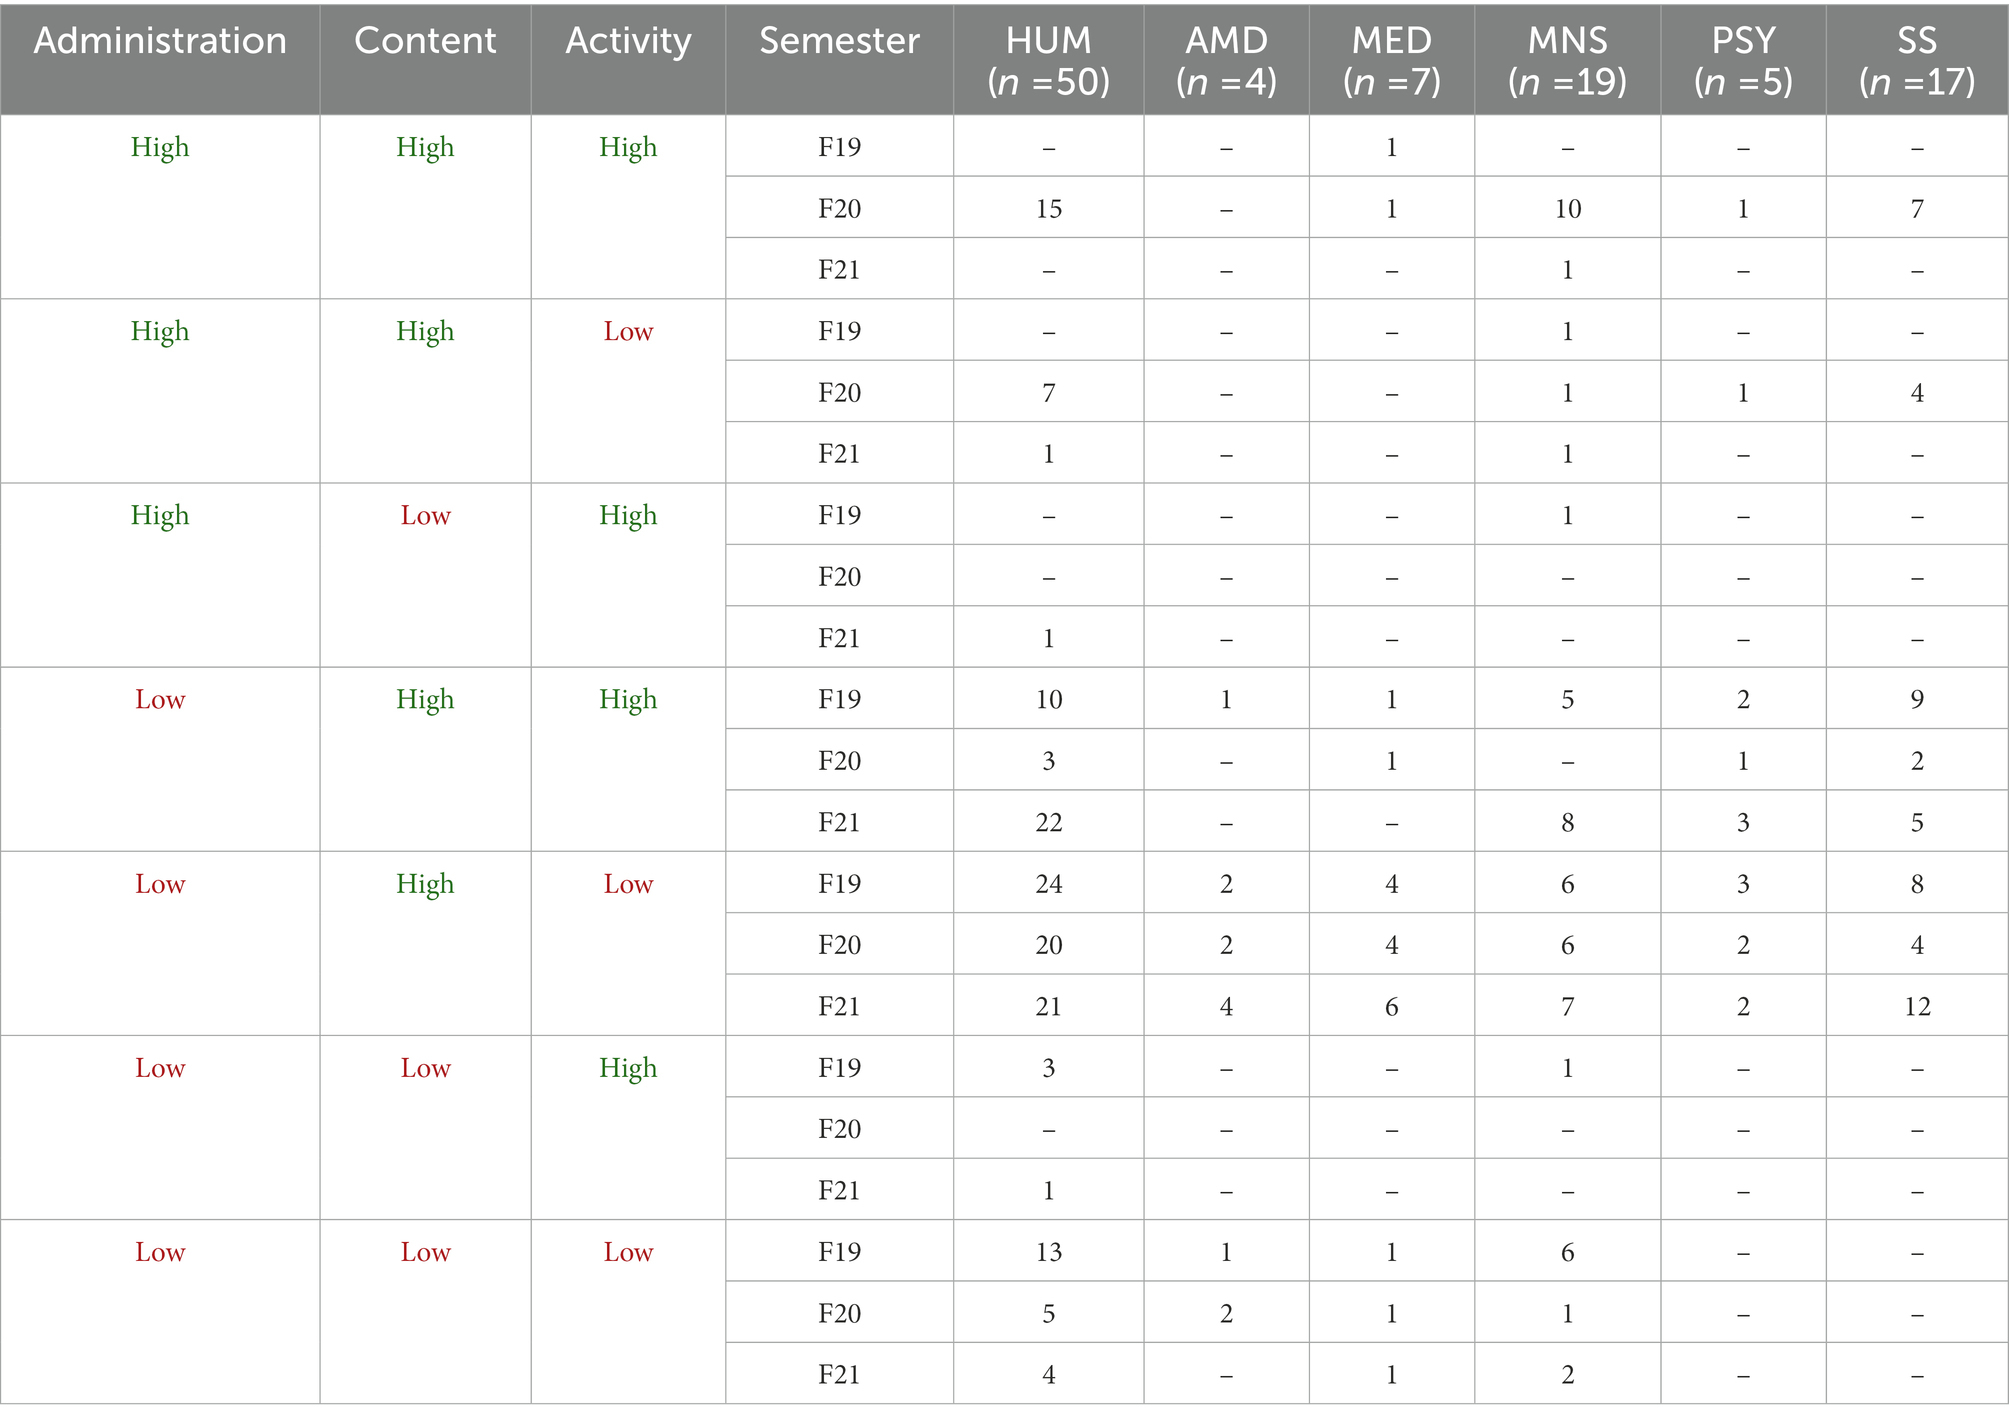
Table 9. Frequency of course types by semester and faculty.
The learning design types were compared regarding the changes between the semesters. MED had the highest proportion of courses, whose learning design type was not changed across the three semesters (n = 3, 42%), followed by AMD (n = 1, 25%), the HUM (n = 12, 24%), PSY (n = 1, 20%), and SS (n = 3, 18%). Learning design of any course at MNS remained the same across the semesters. Further, we found that MNS had the highest proportion of courses that were changed between F19 and F20, between F20 and F21, or between all three semesters and their F21 learning design was different from their F19 learning design (n = 41, 74%), followed by HUM (n = 31, 62%), AMD (n = 2, 50%), SS (n = 8, 47%), PSY (n = 1, 20%), and MED (n = 2, 29%). Finally, we examined the proportion of courses, where learning design changed between F19 and F20, and again between F20 and F21, but the F21 learning design is the same as the F19 learning design, which indicated that the course instructor reverted to the pre-pandemic learning design. PSY has the highest proportion of such courses (n = 3, 60%), followed by the SS (n = 6, 35%), MED (n = 1, 29%), MNS (n = 5, 26%), AMD (n = 1, 25%), and HUM (n = 7, 14%).
4.3. Which learning activities described on the UiB course description sites are implemented over three fall semesters (‘19, ‘20, ‘21)?
As shown in Table 10, only 9 course descriptions mentioned discussions. This is in strong contrast to the use of the discussions feature in Canvas, which increased from 31 courses in F19 to 51 in F20, and then dropped to 45 in F21. Assignments are mentioned in 72 course descriptions, however, its use as a Canvas feature dropped from 59 courses in F19 to 56 in F20, and then increased to 66 in F21. The breakdown of the use of discussions and assignments by faculty shows that of the 9 courses that mention discussions in their course descriptions, six courses are at the HUM, and one course at MED, PSY and SS. Assignments are mentioned in at least 50% of all course descriptions at all faculties, except MED.
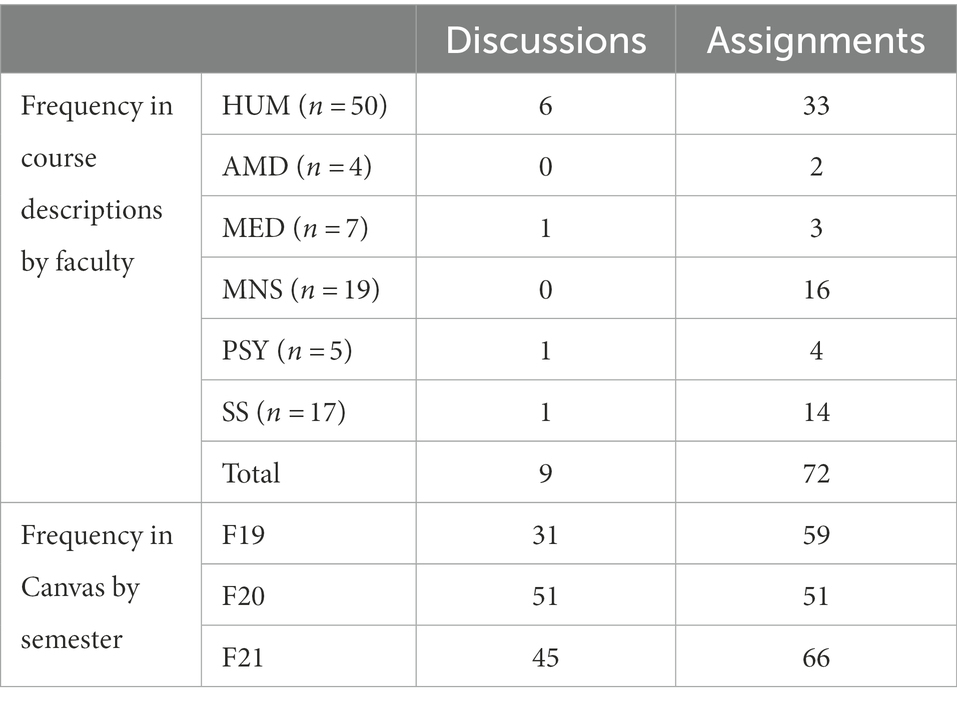
Table 10. The frequency of use of the discussions and assignments in Canvas and in course descriptions.
As can be seen in Table 11, out of all courses that had discussion in their course description, only 2 courses used this feature in all three semesters (indicated by the green Yes for F19, F20 and F21), 5 courses did not use it in any semester, while one course used it in F20 and F21, and one only in F21. For assignments, 39 courses had assignment in their course description and used the feature in Canvas every semester, while 7 courses did not use it in any semester, 10 courses used it in one of the three semesters, and 14 courses used it in two out of three semesters.
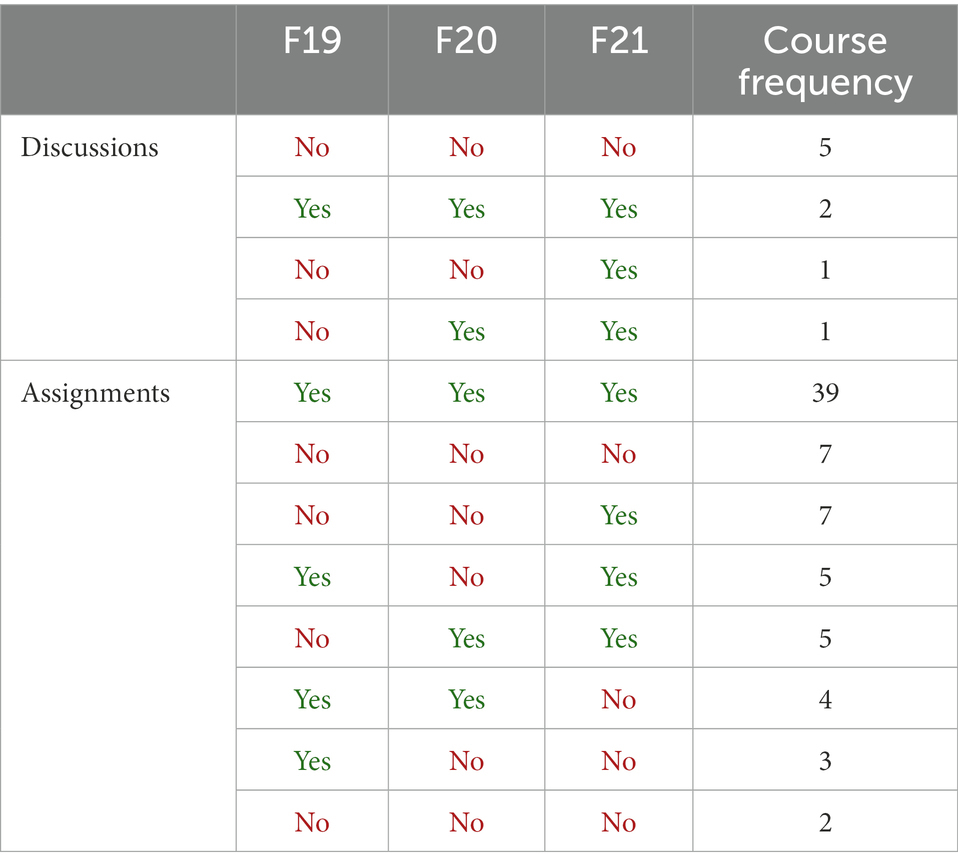
Table 11. The patterns of use of discussions and assignments features in Canvas for courses that mention discussions and assignments in their course descriptions per semesters.
5. Results
5.1. Differences in Canvas learning design before, during and after COVID-19
There were significant differences in how the Canvas courses were structured in each semester. In the pre-COVID semester (F19), the LMS was used as complementary and supplementary to face-to-face teaching as a files repository and to facilitate one-way communication between the instructor and the students. The use of activity features was low, and in general, only a few Canvas features were used per course. The COVID semester (F20) shifted the design of many courses towards not only more content and activity features, but also the administration features. In particular, the people and videos features peaked in their overall implementation. An average course used two more features in F20 than in F19. The courses were still supplemental to the “actual teaching,” which typically happened synchronously, in Zoom or in person when possible, but became more social, in that students were encouraged to engage more in the digital course environment than in the previous semester. The learning designs in F21 retained some of the changes made between F19 and F20, however, 24% of the courses reverted back to their pre-COVID learning designs, and the overall use of features decreased slightly. At the same time, the use of activity features increased in F21 in comparison to F20, although the use of content and administration features declined. The courses were also structured to facilitate more student assessment. Finally, 20% of all courses in our sample did not change their learning designs at all across the semesters.
5.2. Disciplinary differences in Canvas learning design before, during and after COVID-19
The learning designs of courses in Canvas at the Faculty of Humanities (HF) used the most content and administration features in F20. The overall high implementation of people and videos features in F20 contributed to this. When it comes to activity features, the overall implementation of individual features was below 60% in all courses at the faculty, however, the overall number of activity features was highest in F21. Notably, the use of discussions increased every year. In F20, courses used a high number of all features on average. Although this number dropped in F21, it was still higher than pre-pandemic. One-fourth of the courses did not change their learning design across the semesters, while 14% of courses reverted back to their pre-pandemic course design. The most popular learning design moved from low in administration and activity features and high in content features in F19 and F20 to low in administration features and high in content and activity features in F21.
At the Faculty of Fine Art, Music and Design (AMD), no administration features were used in F19 in any courses in our sample. The highest number of administration and activity features was in F20 and F21. An interesting trend could be found for the content features that peaked in F19 and decreased the other two semesters, though the use of videos increased every year to over 60% of the courses in F21. At the same time, the total number of features was the highest in F21. The AMD was the only faculty where the people feature had a high overall implementation in F21. No course used quizzes in any of the semesters, and the use of assignments dropped to 0 in F21. The most popular learning design was low in administration and activity features and high in content features over the semesters. Two courses changed their learning design every year, while 1 course did not change their learning design at all across the three semesters, and one course reverted to the F19 learning design in F21.
The courses at the Faculty of Medicine (MED) used the highest number of administration and content features in F20. The mean total number of features also was the highest in F20, and MED is the only faculty in our sample where the average total number of features was higher pre-pandemic (F19) than in the post-pandemic (F21) semester. The use of activity features on average was highest in F19 and then decreased every year. Almost all content features except videos had a high overall implementation over the semesters. The use of discussions and quizzes was low over the semesters, and dropped to 0 courses in F21. Three courses did not change their learning designs at all across the semesters, while one course reverted back to their F19 design in F21. The most popular learning design over the semesters was consistently low in administration and activity features and high in content features.
The average number of administration and activity features and the total number of features per course at the Faculty of Mathematics and Natural Sciences (MNS) was highest in F20, while the number of content features was highest in F21. Modules and assignments reached an overall high implementation in F21. The most popular learning design in F19 and F21 was low in administration and activity features and high in content features, while in F21 it was high in all types of features. MNS had the highest percentage of courses that changed their learning design between the semesters, there were no courses that did not change their learning design between the semesters at least once, and 26% of MNS courses reverted back to their F19 learning design in F21.
The Faculty of Psychology (PSY) had the highest total mean number of features as well as administration and content features in F20, while the average for activity features was the highest in F21. PSY had a high overall implementation rate for discussions and assignments over the semesters. The most popular learning design in F19 and F20 was low in administration and activity features and high in content features, but this changed to low in administration and high in activity and content features in F21. Three PSY courses reverted back to their F19 learning in F21, while one course did not change their learning design at all across the semesters.
At the Faculty of Social Sciences (SS), the average number of all feature types peaked in F20, as did the mean number of features per course. Both videos and discussions had an overall high implementation in F20 that dropped the following year, while assignments were already implemented at a high rate at SS and only increased during the F20 and F21. The most popular learning design changed from low in administration and activity features and high in content features to high in all feature types in F20, but then reverted back in F21. Three courses at SS did not change their learning design across the semesters, while 35% of courses reverted back to their pre-pandemic learning design in F21.
Overall, there are some significant differences among the faculties and their Canvas learning designs. On the one hand, learning designs of the courses were more evaluative at PSY and SS, while courses at other faculties were more complementary. On the other hand, AMD, MNS and SS had more social learning design for their courses, while the courses at the other faculties were more supplemental.
5.3. The implementation of learning activities into Canvas learning designs before, during and after COVID-19
Out of all the learning activities mapped in course descriptions, we were only able to match discussions and assignments with Canvas features. The discussions feature was rarely used in the course descriptions (n = 9) and only two of those courses used the discussions feature in Canvas consistently. Five courses never used discussions over the three semesters, which would suggest that the original plan was to have discussions in the classroom and that these courses did not effectively switch that to online discussions during the pandemic (although they may have accomplished it using breakout rooms or some other strategy in Zoom). On the other hand, assignments were used in all three semesters in around 54% of the courses that mentioned assignments in their course descriptions, while 33% of courses would use it in some of the semesters.
6. Discussion
The main goal of this paper was to report on results of research that examined how the Canvas learning designs at UiB changed over three semesters: pre-during, and post-pandemic. We focused on both general university trends as well as changes at every faculty. Moreover, we attempted to match learning activities described in course descriptions with the use of Canvas features.
Our findings show that the COVID-19 pandemic forced many instructors to change the learning designs of their courses. The use of the administrative features and content features increased more than the activity features between the Fall semester 2019 and 2020. This corresponds to the results of the student survey at the UiB in the Spring semester 2020, where students reported that digital teaching consisted mostly of delivering assignments (70%), recording of lectures (66%), and feedback from the instructors (59%), rather than discussions in the lectures (36%) or peer feedback (25%) (Egelandsdal and Hansen, 2020a). Due to the rapid nature of changes in the first pandemic year, many instructors may not have had time to design the activities in Canvas. This finding confirms previous research that indicated the difficulties of going beyond recorded lectures in online education, especially in pandemic circumstances (Whalley et al., 2021). Another explanation might be that UiB uses the limited open source version of Canvas that may not fully facilitate all learning activities available in a full version, or that the instructors may not have the skills to develop learning activities in Canvas due to usability issues or lack of competence. Another survey showed that the instructors mostly valued Canvas for the ability to share information and to communicate with the students, and were least satisfied with more activities-oriented features, such as the ability for students to communicate with each other and peer feedback (Egelandsdal and Hansen, 2020b). If instructors were not satisfied with Canvas, they may have used other tools, which were not captured in our dataset. Moreover, the full version of Canvas has a chat function, but the limited Canvas version does not. Mpungose and Khoza (2020) noticed that the lack of a direct link between LMS and social media platforms or lack of chat functions in an LMS may hinder informal learning and discussion among students. Finally, there is a question of whether some types of activities actually can be “translated” to digital spaces, especially in the case of the Arts and Medicine.
A positive trend of an increased use of activity features in Canvas was found in our study. This may indicate that some instructors gained new skills and started to integrate more online learning activities into their learning designs. In the Spring 2020 semester, instructors reported discussions in lectures and assignments to be two of the best learning activities for student learning (Egelandsdal and Hansen, 2020b). An extensive survey by Siegel et al. (2021) encompassing 173 responders from 20 countries found that the pandemic forced many instructors to pre-record their lectures, a task perceived as labour-intensive and avoided before the pandemic. However, having pre-recorded lectures helped instructors engage in more active learning activities during classes (Siegel et al., 2021) and students liked being able to replay lectures at their own pace (Egelandsdal and Hansen, 2020a).
Our data shows that the emergency remote teaching during COVID-19 pandemic forced instructors at different faculties to take advantage of the LMS functionalities in different ways, yet did not provide needed functionality for all types of activities. During the pandemic most faculties increased their use of features and redesigned most of their courses. Two big changes happened in terms of the learning design post-COVID: (1) a shift towards social rather than supplemental learning design, except MED, (2) a shift towards evaluative rather than complementary learning design, except MED and AMD. Previous research found that instructors from soft-applied disciplines, such as social science, fine arts, communication and humanities, used the LMS significantly more than from the other disciplines (Fathema and Akanda, 2020). Whitelock-Wainwright et al. (2020) found that non-STEM disciplines, such as Arts, conducted more online learning activities than the STEM disciplines. The perception of barriers in the use of educational technology is significantly influenced by the academic discipline, although the findings about disciplines perceived more barriers are not conclusive (Mercader and Gairín, 2020). Continuance commitment to e-learning systems, i.e., instructors commitment to use a technology beyond the initial adoption stage, is an important but an under researched issue (San-Martín et al., 2020). Our findings also showed that many courses reverted back to their pre-pandemic learning designs in 2021; although the instructors continued to use Canvas, they reverted to using less features.
While analysing data for the third research question dealing with matching learning activities and Canvas features, the difficulty of this task became very clear. There are many ways to facilitate the same activity, and it is challenging to identify these variations in the data. For example, student discussions might be facilitated through a discussion forum in Canvas, another social platform, or in breakout rooms in Zoom. The fact that this activity was not visible in our dataset does not mean that it was not facilitated at all. At the same time, our analysis may indicate that some courses may be misaligned regarding the learning design and learning goals, however, this finding should be considered with caution due to the low sample size for used features. It should be noted that we did not have access to Zoom data or other information about how the courses were carried out and due to the large number of courses it was not possible to do empirical work such as interviews or observations which might have given more insight into how activities actually were arranged.
Previous research has shown that instructors valued the educational quality of a LMS more than its technical quality or information quality (San-Martín et al., 2020). Although perceived usefulness and satisfaction with the digital technologies are significant factors motivating instructors to continue its use (Mtebe and Gallagher, 2022), sustaining technology adoption and innovation in higher education is challenging and needs institutional support from the leadership. Previous research found it to be more significant than instructors’ perceived self-efficacy (San-Martín et al., 2020). Moreover, instructors’ satisfaction with digital tools decreased with the use, which may have been motivated by the inadequate institutional support and the lack of skills (Mtebe and Gallagher, 2022). Digital technologies have opened up the field of education in many ways which would have been unimaginable before the pandemic. Already in 2016, digitalisation was declared a strategic goal for UiB.9 This process entails not only the digital infrastructure, but also a variety of support mechanisms for instructors. COVID-19 accelerated the process and the UiB leaders needed to support the digital transformation and the innovative initiatives among the instructors. This also implied overcoming innovation barriers and establishing arenas for collaboration across university levels and institutes. Knowledge sharing, for instance in the Frontrunner group, was proven to be important according to findings in the [PROJECT] study at UiB. This was a way to hinder “silo-thinking” in the organisation. Also a new digital infrastructure to support online teaching and learning, was provided. The Learning Lab provided new training videos in pedagogy and technology (e.g., Zoom, Kaltura) as a support for the transition to online teaching.
The limitations of this study are that the sample size was limited by our selection criteria, which resulted in some faculties not being represented (Faculty of Law) or partially represented (e.g., Faculty of Fine Art, Music and Design, AMD). In addition, the focus on Canvas data (which is the data we had access to; privacy issues prevent access to Zoom and other types of data) does not show the whole spectrum of the digital learning activities in the courses that we have analysed.
There are few empirical studies examining the learning designs using the LMS data. This study explored different learning designs using the LMS data and examined aspects, such as learning design changes over time in individual courses, which is an under researched topic in the literature. Furthermore, as this study was conducted during the Covid-19 pandemic, it highlighted the effect of emergency remote teaching on LMS learning designs and what has happened to the learning designs during the switch to face-to-face learning. This study provided a unique longitudinal view of the changes. Finally, this study framed the granular findings about the learning designs in the context of the university leadership actions to capture the complexity of online teaching at higher education institutions during the pandemic.
In future work, we want to enhance the analysis by adding data not only on either use or non-use of certain features, but also on the extent of its use by examining, for example, the number of discussion threads. This will enable a more in-depth analysis of the learning design of UiB courses. We also will look at the student activity data (the student’s clickstream data generated while using Canvas) to see what other insights this might give us. Furthermore, it would be interesting to continue examining how the learning designs in the upcoming Fall semester, a fully post-COVID semester, in order to compare which changes will be permanent.
Data availability statement
The raw data supporting the conclusions of this article will be made available by the authors, without undue reservation.
Author contributions
KM and BW contributed to conception and design of the study. KM collected and analysed the data. KM wrote the first draft of the manuscript. KM, IN, BW, and RG wrote sections of the manuscript. All authors contributed to manuscript revision, read, and approved the submitted version.
Funding
This research was supported by a PhD research grant and DigiTrans project grant (100054) from the University of Bergen, Norway.
Conflict of interest
The authors declare that the research was conducted in the absence of any commercial or financial relationships that could be construed as a potential conflict of interest.
Publisher’s note
All claims expressed in this article are solely those of the authors and do not necessarily represent those of their affiliated organizations, or those of the publisher, the editors and the reviewers. Any product that may be evaluated in this article, or claim that may be made by its manufacturer, is not guaranteed or endorsed by the publisher.
Footnotes
1. ^https://slate.uib.no/projects/it-takes-a-community-the-digital-transformation-of-uib
2. ^Åpner for undervisning i mindre grupper (2021, February 02): https://pahoyden.no/korona/apner-for-undervisning-i-mindre-grupper/106126.
3. ^Koronatiltak ved semesterstart (2021, August 16): https://www.uib.no/aktuelt/146803/koronatiltak-ved-semesterstart.
4. ^News from Norwegian Ministries about the Coronavirus disease COVID-19: https://www.regjeringen.no/en/topics/koronavirus-covid-19/timeline-for-news-from-norwegian-ministries-about-the-coronavirus-disease-covid-19/id2692402/.
5. ^Få hjelp til å komme i gang digitalt (2020, April 24): https://www.uib.no/læringslab/135379/få-hjelp-til-å-komme-i-gang-digitalt.
6. ^Piloter klare for å ta i bruk ny læringsplattform (August 11, 2015): https://www.uib.no/diguib/89635/piloter-klare-å-ta-i-bruk-ny-læringsplattform.
7. ^Hybrid Teaching and Learning Autumn 2020: https://mitt.uib.no/courses/25566/pages/hybrid-teaching-and-learning-autumn-2020.
8. ^Assessment and engagement were grouped into activity for our analysis.
9. ^University of Bergen. (2016). Digitalisation that shapes society. Strategy 2016-2022. Available at: https://ekstern.filer.uib.no/ledelse/digitaliseringsstrategi_2016-22_ENG.pdf.
References
Adedoyin, O. B., and Soykan, E. (2020). Covid-19 pandemic and online learning: the challenges and opportunities. Interact. Learn. Environ., 1–13. doi: 10.1080/10494820.2020.1813180
Alqahtani, A. Y., and Rajkhan, A. A. (2020). E-Learning Critical Success Factors during the COVID-19 Pandemic: A Comprehensive Analysis of E-Learning Managerial Perspectives. Education Sciences 10:216. doi: 10.3390/educsci10090216
Bower, M., Hedberg, J., and Kuswara, A. (2009). “Conceptualising Web 2.0 enabled learning designs. Same places, different spaces” in Proceedings of the Ascilite Auckland 2009, Auckland, 1153–1162.
Brohinsky, J., Marquart, C., Wang, J., Ruis, A. R., and Shaffer, D. W. (2021). Trajectories in epistemic network analysis. In Proceedings of the International Conference on Quantitative Ethnography (ICQE’21) (pp. 106–121). Springer, Cham.
Chen, W., Sanderson, N. C., Nichshyk, A., Bong, W. K., and Kessel, S. (2021). Usability of Learning Management Systems for Instructors – The Case of Canvas. Lecture Notes in Computer Science 210–223. doi: 10.1007/978-3-030-77889-7_14
Cone, L., Brøgger, K., Berghmans, M., Decuypere, M., Förschler, A., Grimaldi, E., et al. (2022). Pandemic acceleration: Covid-19 and the emergency digitalization of European education. Eur. Educ. Res. J. 21, 845–868. doi: 10.1177/14749041211041793
Damşa, C., Langford, M., Uehara, D., and Scherer, R. (2021). Teachers’ agency and online education in times of crisis. Comput. Hum. Behav. 121:106793. doi: 10.1016/j.chb.2021.106793
Egelandsdal, K., and Hansen, C. J. S. (2020a). Digi Trans kortrapport: Studentenes opplevelse av studiesituasjonen etter nedstengingen av UiB grunnet COVID-19. SLATE Research Report 2020-1, Bergen, Norway: Centre for the Science of Learning & Technology (SLATE)
Egelandsdal, K., and Hansen, C. J. S. (2020b). Digi Trans kortrapport: Undervisernes opplevelse av studiesituasjonen etter nedstengingen av UiB grunnet COVID-19. SLATE Research Report 2020-2, Bergen, Norway: Centre for the Science of Learning & Technology (SLATE)
Ervik, T. S. (2021). Pandemiåret på UiB. På Høyden. Available at: https://pahoyden.no/korona-pandemi-rektoratet/pandemiaret-pa-uib/107465
Fathema, N., and Akanda, M. H. (2020). Effects of instructors’ academic disciplines and prior experience with learning management systems: A study about the use of Canvas. Australasian Journal of Educational Technology 113–125. doi: 10.14742/ajet.5660
Fathema, N., Shannon, D., and Ross, M. (2015). Expanding the technology acceptance model (TAM) to examine faculty use of learning management systems (LMSs) in higher education institutions. J. Online Learn. Teach. 11, 210–232.
Fernández, A. R., González, F. S., Merino, P. J. M., and Kloos, C. D. (2017). A data collection experience with canvas LMS as a learning platform. In Proceedings of the LASI-SPAIN 2017 (pp. 109–123).
Gray, R., and Lazareva, A. (2021). “When the past and future collide: digital technologies and assessment in Norwegian higher education” in Assessment Theory, Policy, and Practice in Higher Education: Integrating Feedback into Student Learning. eds. S. A. Hillen, P. Wolcott, C. Schaffer, A. Lazareva, and R. Gray (Berlin: Waxmann), 39–58.
Helland, H. K., Tylleskär, T., Kvernenes, M., and Reikvam, H. (2022). An abrupt transition to digital teaching—Norwegian medical students and their experiences of learning output during the initial phase of the COVID-19 lockdown. Healthcare 10, 1–11. doi: 10.3390/healthcare10010170
Hjelsvold, R., Nykvist, S. S., Lorås, M., Bahmani, A., and Krokan, A. (2020). Educators’ experiences online: how COVID-19 encouraged pedagogical change in CS education. Norsk IKT Konferanse for Forskning og Utdanning 4, 1–12.
Hodges, C., Moore, S., Lockee, B., Trust, T., and Bond, A. (2020). The Difference between Emergency Remote Learning and Online Learning. Available at: https://er.educause.edu/articles/2020/3/the-difference-between-emergency-remote-teaching-and-online-learning (Accessed April 26, 2022).
Johnson, N., Veletsianos, G., and Seaman, J. (2020). US faculty and administrators’ experiences and approaches in the early weeks of the COVID-19 pandemic. Online Learn. 24, 6–21. doi: 10.24059/olj.v24i2.2285
Kaliisa, R., Misiejuk, K., Irgens, G. A., and Misfeldt, M. (2021). Scoping the emerging field of quantitative ethnography: opportunities, challenges and future directions. In Proceedings of the International Conference on Quantitative Ethnography (ICQE’21) (pp. 3–17). Cham Springer International Publishing.
Kasim, N. N. M., and Khalid, F. (2016). Choosing the right learning management system (LMS) for the higher education institution context: a systematic review. Int. J. Emerg. Technol. Learn. 11
Koch, P., Cunningham, P., Schwabsky, N., and Hauknes, J. (2006). Innovation in the Public Sector – Summary and Policy Recommendations. Public Report No. D24. NIFU STEP, Oslo.
Koch, P., and Hauknes, J. (2005). On Innovation in the Public Sector. Public Report No. D20. NIFU STEP, Oslo.
Marachi, R., and Quill, L. (2020). The case of Canvas: Longitudinal datafication through learning management systems. Teaching in Higher Education 25, 418–434. doi: 10.1080/13562517.2020.1739641
Mercader, C., and Gairín, J. (2020). University teachers’ perception of barriers to the use of digital technologies: The importance of the academic discipline. Int. J. Educ. Technol. High. Educ. 17, 1–14. doi: 10.1186/s41239-020-0182-x
Mpungose, C. B., and Khoza, S. B. (2020). Postgraduate students’ experiences on the use of moodle and Canvas learning management system. Technology, Knowledge and Learning 27, 1–16. doi: 10.1007/s10758-020-09475-1
Mtebe, J., and Gallagher, M. (2022). Continued usage intentions of digital technologies post-pandemic through the Expectation-Confirmation Model: the case of a Tanzanian university Joel Mtebe University of Dar es Salaam, Tanzania. Int. J. Educ. Dev. Using Inf. Commun. Technol. 18, 125–145.
Ness, I. J. (2017). Polyphonic orchestration – facilitating creative knowledge processes for innovation. Eur. J. Innov. Manag. 20, 557–577. doi: 10.1108/EJIM-05-2016-0049
Radmer, F., and Goodchild, S. (2021). Online mathematics teaching and learning during the COVID-19 pandemic: the perspective of lecturers and students. Nordic J. STEM Educ. 5. doi: 10.5324/njsteme.v5i1.3914
Rienties, B., Nguyen, Q., Holmes, W., and Reedy, K. (2017). A review of ten years of implementation and research in aligning learning design with learning analytics at the Open University UK. Interact. Design Architect. 33, 134–154. doi: 10.55612/s-5002-033-007
Rienties, B., and Toetenel, L. (2016). The impact of learning design on student behaviour, satisfaction and performance: a cross-institutional comparison across 151 modules. Comput. Hum. Behav. 60, 333–341. doi: 10.1016/j.chb.2016.02.074
San-Martín, S., Jiménez, N., Rodríguez-Torrico, P., and Piñeiro-Ibarra, I. (2020). The determinants of teachers’ continuance commitment to e-learning in higher education. Educ. Inf. Technol. 25, 3205–3225. doi: 10.1007/s10639-020-10117-3
Shaffer, D. W., Collier, W., and Ruis, A. R. (2016). A tutorial on epistemic network analysis: analyzing the structure of connections in cognitive, social, and interaction data. J. Learn. Anal. 3, 9–45. doi: 10.18608/jla.2016.33.3
Siegel, A. A., Zarb, M., Alshaigy, B., Blanchard, J., Crick, T., Glassey, R., et al. (2021). “Teaching through a global pandemic: educational landscapes before, during and after COVID-19” in Proceedings of the 2021 Working Group Reports on Innovation and Technology in Computer Science Education, 1–25.
Sørum, H., Raaen, K., and Gonzalez, R. (2021). Can zoom replace the classroom? Perceptions on digital learning in higher education within IT. In Proceedings of the 20th European Conference on e-Learning (ECEL’21) (pp. 427–434).
Sulun, C. (2018). The evolution and diffusion of learning management systems: The case of Canvas LMS. Driving Educational Change: Innovations in Action, 86.
Turnbull, D., Chugh, R., and Luck, J. (2021). Transitioning to E-learning during the COVID-19 pandemic: how have higher education institutions responded to the challenge? Educ. Inf. Technol. 26, 6401–6419. doi: 10.1007/s10639-021-10633-w
Whalley, B., France, D., Park, J., Mauchline, A., and Welsh, K. (2021). Towards flexible personalized learning and the future educational system in the fourth industrial revolution in the wake of COVID-19. Higher Educ. Pedagog. 6, 79–99. doi: 10.1080/23752696.2021.1883458
Whitelock-Wainwright, A., Tsai, Y. S., Lyons, K., Kaliff, S., Bryant, M., Ryan, K., et al. (2020). Disciplinary differences in blended learning design: a network analytic study. In Proceedings of the 10th International Conference on Learning Analytics & Knowledge (LAK’20) (pp. 579–588). New York Association for Computing Machinery (ACM)
Whitmer, J., Nuñez, N., Harfield, T., and Forteza, D. (2016). Patterns in blackboard learn tool use: Five course design archetypes [White paper]. Available at: https://blackboard.com/sites/default/files/resource/pdf/Bb_Patterns_LMS_Course_Design_r5_tcm136-42998.pdf
Keywords: learning design, educational leadership, learning management systems, emergency remote teaching, Epistemic Network Analysis
Citation: Misiejuk K, Ness IJ, Gray R and Wasson B (2023) Changes in online course designs: Before, during, and after the pandemic. Front. Educ. 7:996006. doi: 10.3389/feduc.2022.996006
Edited by:
Jose A. Ruiperez Valiente, University of Murcia, SpainReviewed by:
Cucuk W. Budiyanto, Sebelas Maret University, IndonesiaJanika Leoste, Tallinn University, Estonia
Copyright © 2023 Misiejuk, Ness, Gray and Wasson. This is an open-access article distributed under the terms of the Creative Commons Attribution License (CC BY). The use, distribution or reproduction in other forums is permitted, provided the original author(s) and the copyright owner(s) are credited and that the original publication in this journal is cited, in accordance with accepted academic practice. No use, distribution or reproduction is permitted which does not comply with these terms.
*Correspondence: Kamila Misiejuk, ✉ a2FtaWxhLm1pc2llanVrQHVpYi5ubw==