 Nicole Marcus1
 James E. Cooke
- 1Department of Neurobiology, School of Biological Sciences, University of California, San Diego, La Jolla, CA, United States
- 2Department of Molecular Biology, School of Biological Sciences, University of California, San Diego, La Jolla, CA, United States
Introduction: The amount of time students are given to complete an assessment is a pragmatic element to the assessment itself. Assessments that provide the vast majority (>80%) of students sufficient time for completion are said to be “unspeeded.” However, even if an assessment is unspeeded students may experience test anxiety if the assessment is timed, and test anxiety can cause students to underperform relative to their ability. While providing unlimited time to complete assessments would alleviate anxiety and improve test scores, this is unrealistic in most classroom settings. The current study assessed whether increasing the time students had to complete a timed, unspeeded exam would improve performance by lowering test anxiety.
Methods: Test anxiety surveys were administered before and after midterm exams in two sections of an undergraduate classroom: an unspeeded control section which had 1 h to complete the exam, and a treatment section which had 2 h to complete the exam.
Results: Doubling the amount of time students have on an already-unspeeded exam improved neither test performance nor test anxiety. However, students in the treatment condition were significantly less likely to report wanting more time on the exam in a post-assessment survey.
Introduction
In educational settings, assessments like tests or exams are a very common method used to assess students' understanding of course content. Not only are assessments a means of assessing students' understanding, but they may also lead to improved long(er) term retention of course content (Roediger and Karpicke, 2006). One important element of an assessment is how much time is required to complete the task (or rather, how long an assessment ought to be in order to be completed within the constraints of class time).
Some of the previous studies regarding the amount of time students are afforded to complete an assessment have been focused on whether a test is “speeded” and “unspeeded”. Although there are several ways to assess the speededness of an assessment (cf: Jurich, 2020), one approach that is easy to implement is that of Swineford (1956), who considered an assessment unspeeded if all students complete 75% of the test items, or 80% of the students complete the entire exam. If neither of these conditions hold true, then the test is considered speeded.
Much of the literature on speeded vs. unspeeded assessments are focused on whether standardized tests (e.g.: LSAT, GRE, Iowa Tests of Basic Skills) might discriminate against students with disabilities (Munger and Loyd, 1991), race (Evans and Reilly, 1972; Wild et al., 1982), gender, or time since undergraduate graduation (Wild et al., 1982). While the condition of speededness vs. unspeededness of tests has often had no significant differences in the standardized test scores of these oft-marginalized groups (Evans and Reilly, 1972; Wild et al., 1982; Munger and Loyd, 1991), there is evidence that when a test has higher level cognitive reasoning requirements, allowing students more time to complete the task improves the performance of the students (Wilhelm and Schulze, 2002).
Test anxiety is a specific form of anxiety in which people feel worried about situations that involve assessments (Cassady and Johnson, 2002), and can affect roughly 22% of undergraduate students (Thomas et al., 2018). Time constraints can be destructive to students' cognitive skills such as planning and monitoring and can cloud their memories (Walczyk et al., 1999). The time constraints being given to students on exams may be too limiting, inducing testing anxiety and preventing students from performing to their fullest potential: students perform significantly better when testing is untimed compared to timed conditions (Tsui and Mazzocco, 2006). There tends to be a negative relationship between anxiety and performance, where students with the highest levels of test anxiety tend to perform significantly worse than students with moderate or lower levels of anxiety (Seipp, 1991; Ramirez and Beilock, 2011; Steinmayr et al., 2016).
The relationship between time-on-test and anxiety has not received much attention in the literature. Although Onwuegbuzie and Seaman (1995) found that providing unlimited time in a statistics course improved test performance for students with the highest levels of test anxiety, compared to students in an unspeeded—but timed—midterm exam, this study had small sample sizes (n = 26) and was conducted on graduate students with an average age of 40.7 years. For researchers interested in undergraduate education, it is difficult to extrapolate the findings of Onwuegbuzie and Seaman (1995) to the undergraduate student body.
With current anxiety levels increasing amongst our undergraduate student population (Tan et al., 2023), finding ways of reducing this anxiety becomes an important consideration for an instructor. If timed tests can lead to poorer performance for students with the highest levels of test anxiety, the question arises of whether increasing the amount of time students have to complete an already-unspeeded test might reduce test anxiety and improve performance. The current study is designed to answer the following questions with regards to an undergraduate course: does providing more time than normal lower test anxiety (particularly for students with the highest levels of test anxiety)? And might this improve test scores? The prediction of the current study is that increased time will lower test anxiety and increase performance.
Materials and methods
Participants
The study was conducted at a large research intensive university in the southwest of the United States. Participants in this study were largely 3rd or 4th year undergraduate students enrolled in a human physiology course which is required for three out of seven different biology majors at the University. The course material includes topics such as the physiology of membranes, neurons, muscles (skeletal, smooth and cardiac) and renal systems. The study was performed over two consecutive academic quarters: Fall of 2021, in which 240 students were included in the study, and Winter of 2022, in which 198 students were included in the study. Students were only included in the study if they completed and submitted all three surveys administered throughout the quarter, as well as if they had completed at least the second midterm examination. In an attempt to ensure that the academic strength of the students in the two quarters was comparable, entering GPA values of Fall (3.43 ± 0.32 S.E.M.) and Winter (3.34 ± 0.36) quarter were compared and were not significantly different (ANOVA, p > 0.1). Ethical approval was obtained from the university's Institutional Review Board (IRB#: 809741).
Procedure
Test anxiety was assessed at two different points in time in both academic quarters. At the beginning of the quarter, students were given the Westside Test Anxiety Scale, a validated test anxiety tool (Driscoll, 2007), as a marker of baseline test anxiety (more information below). In weeks 4 and 7 of the 10-week quarters, students took midterm exams. Following each midterm exam, students were queried about how much anxiety they experienced during the exam and whether they had enough time to complete the exam using post-exam surveys. Data are available from UC San Diego Library Digital Collections (Marcus et al., 2024).
Baseline test anxiety survey
At the beginning of both academic quarters, students were asked to complete a survey that consisted entirely of the Westside Test Anxiety Scale (WTAS; Driscoll, 2007). The survey was opened after the first week of the academic quarter and left open for 1 week. Completion of the survey was worth one percent of students' grade in the class. The WTAS survey consists of ten statements pertaining to test anxiety that students rate on a scale of “Not at all or never true” to “extremely or always true”. Answers of “not at all or never true” are given a score of 1, while answers of “extremely or always true” are given a score of 5. The ten values are totaled and divided by ten to give a normalized test anxiety score for each student. Herein, these values are referred to as students' baseline test anxiety score, to differentiate from the anxiety students reported on a post-exam survey (see below).
Midterm exams
For both academic quarters studied, there were two midterm examinations that were administered during weeks 4 and 7 of the 10 week quarter. The control group (winter 2022) had 60 min to complete the midterms, which is ‘business as usual' for the corresponding author's midterms. The treatment group (fall 2021) received double the amount of time as the control group at 120 min. In both quarters, midterms were held outside of normal class time in the evening. In January 2022 the University pivoted to holding all classes and exams remotely for the first 5 weeks of the quarter in response to the Omicron variant of the Covid-19 virus. As a result, the first midterm was held virtually in the control quarter. Since the first midterm was so different in control and treatment conditions (in person vs. remote), the decision was made not to include the midterm 1 exam in the analysis. Rather, students' scores on the second midterm exam (midterm 2, or MT2) were used in the current study as the second midterm was in-person in both quarters. The second midterm in both treatment and control conditions of the course were isomorphic to one another: questions were either identical or varied only in some small detail (e.g.: a question about action potentials might involve K+ in one class and Na+ the other).
The midterm exams consisted largely of open-ended questions in which students must analyze data or predict outcomes. A few example questions of these “higher order cognitive problems” include: asking students to predict how a stimulus would affect the firing of action potentials in neurons in the “surround” of a receptive field; students are asked to describe a physiological mechanism underlying inhibition of a presynaptic terminal; students are presented a case in which a person has ingested a drug that causes certain physiological phenomena (e.g.: tachycardia) and are asked what kind of drug it could be, and how they would treat it; asking students where in a feedback loop a problem lies based on available evidence; and determining how a novel (ie: students have never seen) muscular phenomenon occurs based on their understanding of how tension is generated. There were also some questions that required simple memorization and recitation of facts. Examples include: asking students the name of the neurotransmitter released by a particular neuron; identify whether a hormone can cross the plasma membrane; the anatomical location from which a hormone is released. The examples used in each quarter are provided in the Supplementary material. In both conditions, exams were graded by instructional assistants. The first 20–30 exams are graded along with the instructor of record until they were satisfied with the consistency of the grading. Exam grades were analyzed as percentages.
Prior to beginning their midterm exams, students in both conditions were asked to take a few minutes to write down any negative or stressful feelings they might have about the upcoming exam. This “expressive writing approach” reduces test anxiety-induced reduction in grades for students with the highest levels of baseline test anxiety (Ramirez and Beilock, 2011), and the corresponding author has included this expressive writing component at the beginning of all exams as part of their “business as usual” model for years.
Students with disabilities under the Americans with Disabilities Act are provided with accommodations that include extra time (where appropriate), and these students take the exams in a different place with a proctor assigned by the home Department. These students were not included in the current study.
Post-exam survey
While a baseline test anxiety survey was run early in the academic term, a post-exam survey was also administered in an attempt to elucidate how much anxiety students actually felt during the exam itself. One could imagine a student having lower baseline test anxiety scores, but experiencing higher levels of anxiety on the day of the test itself for any number of reasons. In both quarters students were given a post-exam survey worth one percent of their grade after each of the two midterm exams. Surveys were available to students immediately following the exams and were closed 3 days later. All but one of the items on the post-exam surveys were in a Likert-scale format, with five answer choices ranging from “Strongly agree” to “Strongly disagree.” The statements on the post-exam survey were: “I believe the exam was fair”; “the questions on the exam were clear”; “I had test-related anxiety during the midterm”; “I had enough time to finish the midterm”; and “I felt prepared to take the exam prior to taking it”. For the final question of the survey, students were also asked to write out how much more time they would have wanted if they felt that they did not have enough time to finish the exam.
While the post-exam survey was a Likert scale, it was determined post-hoc that the real interest was whether the students wanted more time (or had experienced test anxiety), not the degree to which they wanted more time (or experienced test anxiety). For that reason, it was decided to re-code the Likert scale answers to Yes/No answers. In determining whether students experienced test anxiety during the midterm, answers of “Strongly agree” and “Somewhat agree” were coded to be “Yes”, with the other three response options (“Neither agree nor disagree”, “Disagree” and “Strongly disagree”) being coded as “No.” With regard to the issue of wanting more time, students were coded as “Yes” if they responded “strongly agree” or “somewhat agree” to the Likert-scale prompt, or if they responded with any value greater than zero on the question asking how much more time they might have wanted.
Analyses
To assess whether midterm scores were different between control and treatment conditions, Welch-corrected two sample t-tests were run. To assess whether the amount of time given (1 h vs. 2 h) impacted the relationship between baseline test anxiety and performance, an analysis of covariance was performed. To assess whether baseline test anxiety levels were different between control and treatment condition, a Welch-corrected two-sample t-test was run. In determining whether baseline test anxiety was a predictor of (a) students reporting wanting more time post-hoc and (b) post-hoc reports of students experiencing anxiety during the test, generalized linear modeling with a binomial distribution was used to account for the yes/no nature of responses on the post-exam survey. Chi-squared tests were run to determine whether there were differences between control and treatment groups reporting wanting more time on the post-test survey, and experiencing test anxiety on the post-test survey. Finally, we ran a linear regression to determine whether students who would have preferred more time varied by grade received on the exam. All data were analyzed using “R” software, version 4.3.3 (R Core Team, 2021).
Results
Time allotted, baseline test anxiety and exam scores
To determine whether doubling the amount of exam time impacted students' exam performance, MT2 scores between the treatment and control conditions were compared using a Welch-corrected two-sample t-test. The average MT2 score for the treatment condition was 67.09% (±14.96% S.D.), compared to an average of 68.10% (±15.70% S.D.) for control. These values were not significantly different (t value = −0.686, df = 412, R2 = 0.00109, Δx = 1.013, p = 0.493, Table 1).
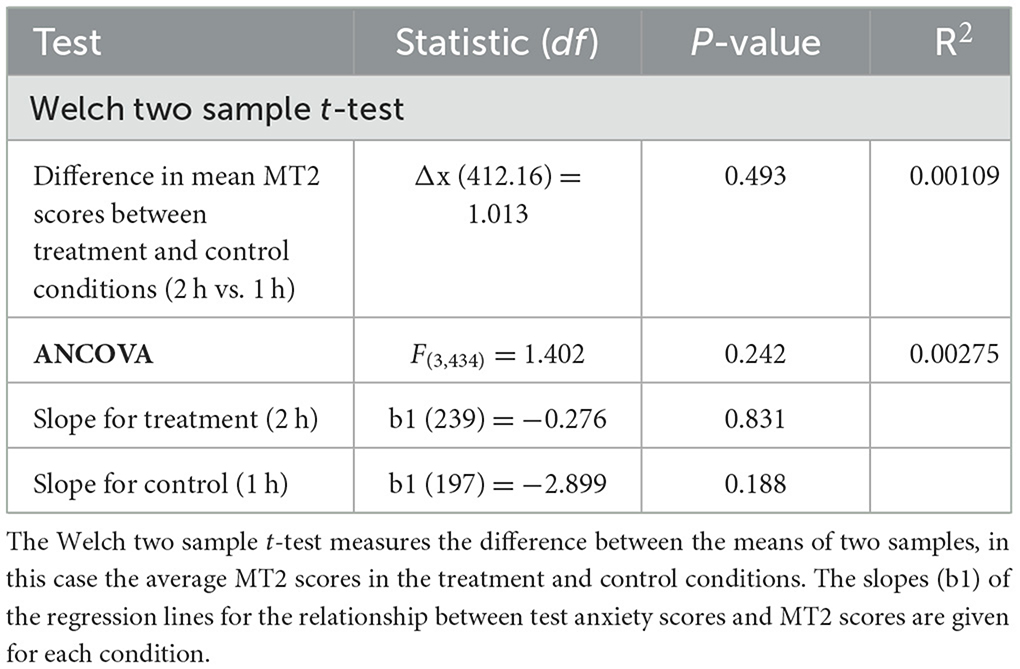
Table 1. Statistical analyses of the differences in students' MT2 scores.
To determine whether the amount of time allotted was a predictor of the relationship between test anxiety levels and exam scores, a one-way analysis of covariance (ANCOVA) was performed. The one-way ANCOVA measures the significance of the relationship between MT2 score (the dependent variable) and exam time (independent variable), while removing the effect of baseline test anxiety score (a continuous independent variable). Baseline test anxiety, treatment condition or the interaction of the two accounted for 0.28% of the total variation in MT2 scores (F = 1.402, df = 434, p = 0.242, Table 1, Figure 1). This indicates that the amount of time students were given to complete MT2 was not a significant predictor of MT2 scores. Indeed, in both control and treatment conditions, the slopes of the regression lines were not significantly different than zero (p = 0.831 for treatment and p = 0.188 for control; Table 1; Figure 1), suggesting that baseline test anxiety did not impact exam performance. While the slope of the regression line between baseline test anxiety and MT2 score was more negative in the control condition (b1 = −2.899) than for treatment (b1 = 0.276; Table 1), the difference in the slopes of the regression lines for treatment and control conditions were not statistically significant (F = 1.402, df = 434, p = 0.242; Table 1 and Figure 1).
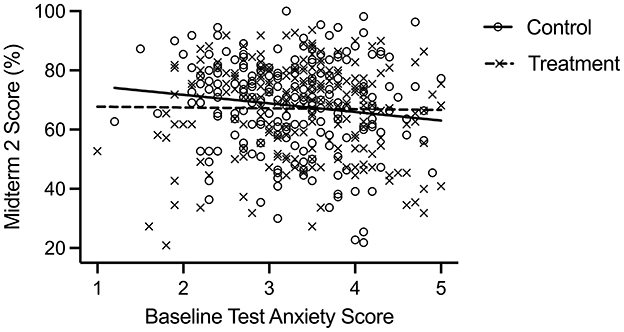
Figure 1. Midterm 2 (MT2) performance as a function of test anxiety for both treatment (2 h) and control (1 h) conditions. Each point on the graph represents an individual student's test score as a function of their baseline test anxiety score. Treatment condition is X (n = 240) and control is O (n = 198). Regression lines are included, solid for control and dashed for treatment. The slopes of the regression lines for control condition (b1 = −0.276) and the treatment condition (b1 = −2.899) were not significantly different from zero (p = 0.831 for treatment; p = 0.188 for control) nor from each other (p = 0.242).
Effects of baseline test anxiety on post-exam reports of anxiety and time
The means of the baseline test anxiety scores for treatment (3.37 ± 0.76 S.D.) and control (3.26 ± 0.72 S.D.) conditions were not significantly different (Welch-correct two sample t-test; t value = 1.597, df = 428.3, R2 = 0.00575, Δx = −0.114, p = 0.111, Table 2), suggesting that the students in both conditions had comparable levels of baseline test anxiety. In addition, students' baseline test anxiety scores were not significant predictors of whether students wanted additional exam time (when asked via a post-exam survey), as measured using a generalized linear model with a binomial distribution (b1 = −0.0367, df = 438, R2 = 0.00296, p = 0.256, Table 2). However, a generalized linear model (with binomial distribution) revealed that students' baseline test anxiety scores were significant predictors of whether students indicated experiencing test anxiety during MT2, as assessed with the post-exam survey (b1 = 0.0777, df = 438, R2 = 0.025, p < 0.05, Table 2). This suggests that students who reported being more anxious about tests at the beginning of the term were more likely to report feeling anxious during the exam itself.
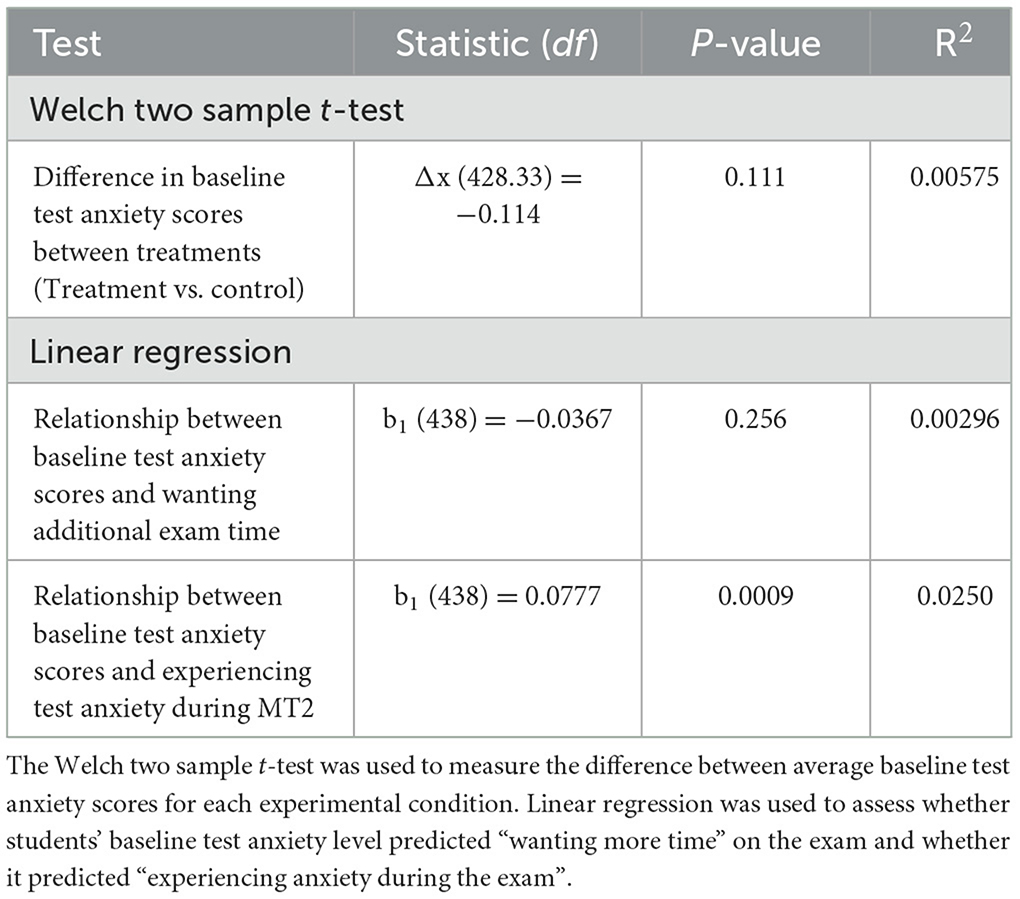
Table 2. Statistical analyses of the differences in students' test anxiety levels.
Time allotted and its impact on anxiety
When asked on the post-exam survey whether they had experienced test anxiety during the exam, 87% of students in the control condition reported experiencing test anxiety during the exam, compared to 81% of students in the treatment condition. This difference was not significant as measured using a chi-squared test (χ2= 2.59, p = 0.108; Figure 2).
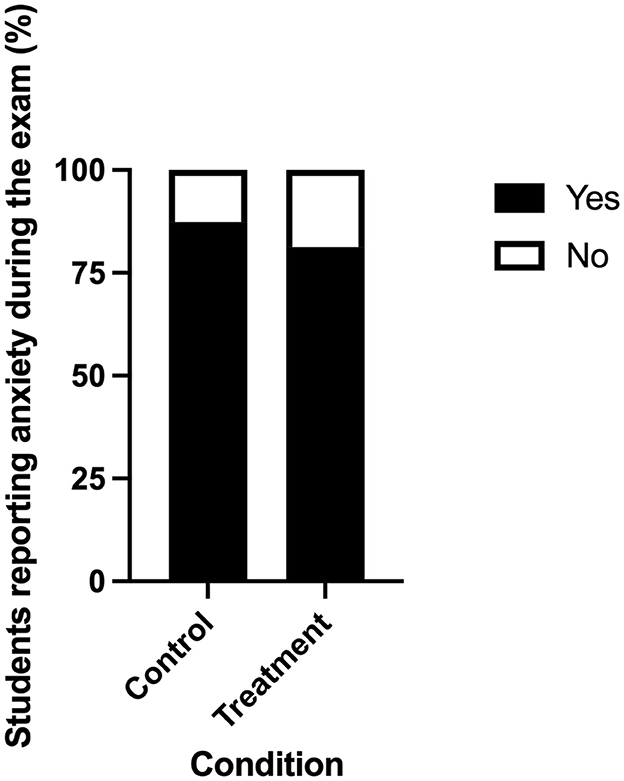
Figure 2. Percentage of students experiencing anxiety during the exam in control (1 h) and treatment (2 h) conditions. Students responded to post-exam surveys asking if they experienced anxiety during the exam. Eighty seven percent of students in the control condition responded “yes”, while 81% of students in the treatment condition responded “yes”. Responses of “yes” are represented in black and “no” are represented in white. There was no difference in “yes” and “no” answers between treatment and control conditions (χ2 = 2.59, p = 0.108). n = 240 in the treatment condition, n = 198 in control.
Students receiving more time are less likely to want additional time
A Chi-square analysis was performed to determine if there was a significant relationship between time received to complete MT2 and the percentage of students who reported wanting additional exam time on a post-exam survey. The number of students who desired more time to complete the exam in the control condition was 85% compared to 31% in the treatment condition, a difference which was statistically significant (X2= 125.85, p < 0.05, Figure 3).
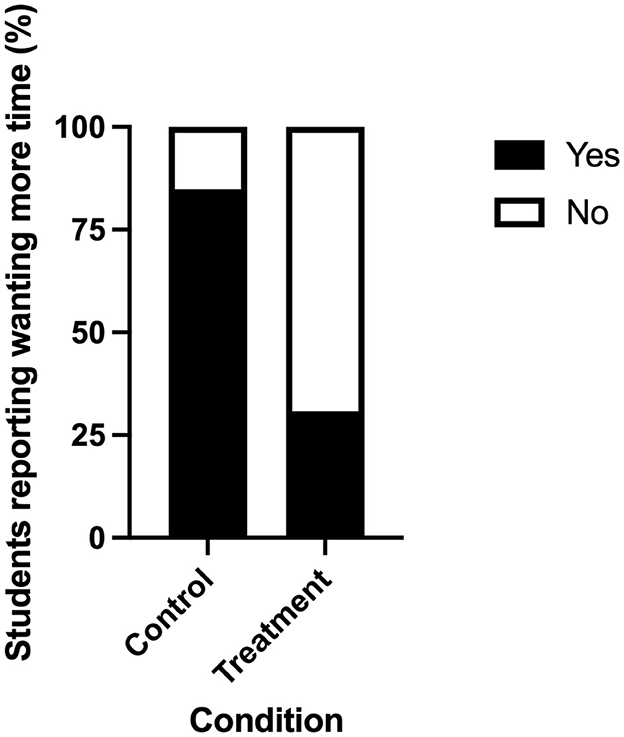
Figure 3. Percentage of students who desired more time to complete MT2 in control (1 h) and treatment (2 h) conditions. Students responded to post-exam surveys asking if they desired more time to complete the exam. Eighty five percent of students in the control condition reported wanting additional exam time compared to 31% of students in the treatment condition. This difference was statistically significant (χ2 = 125.85, p < 0.05). Responses of “yes” are represented in black and “no” are represented in white.
A linear regression was performed to assess whether students who preferred to have more time on the exam varied by grade achieved. There was no significant relationship between students who wanted more exam time and exam score (b1= 1.826; df = 438 p = 0.214).
Speeded or unspeeded?
Speededness of the shortest (1 h long) exam was assessed by counting the number of exams that had the last question of the exam unanswered. Thirty-eight out of the 296 students who took midterm 2 in the control (1 h) condition made no attempt at the last question. This completion rate (87.2%) is over the 80% threshold for an exam to be considered “unspeeded” (Swineford, 1956). Important caveats to this is that students may not take the exam in the order presented, and students may leave open-ended questions blank if they do not know the answer to the question (even if they had sufficient time to answer). Nevertheless, it seems that the assessment in the shortest (1 h long) condition was unspeeded. Since the exams are isomorphic, if 1 h was unspeeded then 2 h must also be unspeeded.
Discussion
The current study found that doubling the amount of time students had on an “unspeeded” exam—from a “business as usual” 60 min to 120 min—improved neither exam performance nor exam anxiety in an upper division physiology class. Even students with the highest reported levels of test anxiety did not have improved performance with increased test time. Despite the results that more time did not improve performance or lower anxiety, students who received more time on the exam were significantly less likely to report wanting more time on the exam. The authors are unaware of another study examining time on test and its impact on both test anxiety and performance in an undergraduate setting.
Time on task and grades
Much of the literature on the topic of time-on-task and test performance has dealt with the correlation of when students turn in their exams and what grade they receive. These studies have largely found that there is no relationship between time of submission and grade received (Nevo and Spector, 1979; Foos, 1989; Lovett et al., 2017), although there has been at least one instance in which a weak, negative relationship was found under certain circumstances (Landrum et al., 2009). The literature on whether there is a difference in performance when exams are “speeded” or “unspeeded” tends to focus on whether certain standardized tests disproportionately impact different special interest groups. For example, Evans and Reilly (1972) demonstrated that students taking the Reading Comprehension section of the Law School Admission Test (LSAT) had significantly higher scores when their exams were unspeeded (i.e.: when greater than 75% of students completed the assessment) compared to when they were speeded. However, Wild et al. (1982) found that giving folks 50% more time to complete verbal and quantitative aspects of the Graduate (GRE) test resulted in no improved performance in any of the groups studied (males vs. females; Black students vs. White students). If an educator is interested in measuring what students have learned, unspeeded assessments may be more appropriate than speeded assessments (Wilhelm and Schulze, 2002).
For this reason, the current manuscript focused on comparing increased time on task to a control condition that was already unspeeded.
The authors are only aware of one study evaluating increased time on task for an already-unspeeded assessment, done by Onwuegbuzie and Seaman (1995). In contrast to the current study, Onwuegbuzie and Seaman (1995) found a significant improvement in exam performance on a final exam when graduate students had unlimited exam time as compared to having a 90 min time constraint (also unspeeded). In particular, Onwuegbuzie and Seaman (1995) found that adding test time led to significant improvement in test performance for students with high statistics test anxiety and not for those with low statistics test anxiety. The current study found no significant relationship between test anxiety level and performance. While there are important differences in the studies (graduates vs. undergraduates; sample size; discipline), one explanation for the difference in the outcomes of these studies is that the current study used an expressive writing exercise prior to the exam in both control and treatment conditions. Ramirez and Beilock (2011) showed that allowing students to write about their anxieties and nervousness immediately prior to taking a test led to significantly higher performance for students with high levels of test anxiety. The results of the current study look comparable to those of Ramirez and Beilock (2011): in both studies, when students were encouraged to write about their anxieties before taking the exams, there was no significant relationship between test anxiety and exam performance. The reason that the expressive writing exercise is so effective may have to do with alleviating cognitive test anxiety (in which negative thoughts can lower performance) but not impact the emotional component of test anxiety - in which there is a physiological reaction to the assessment (Cassady and Johnson, 2002). This might allow for strong academic performance but still have students report high levels of anxiety on the survey that immediately followed the exam in the current study.
That both treatment and control conditions were no different in their reported levels of anxiety in the post-exam survey may also explain the lack of an impact of increased time on exam performance. If anxiety is responsible for lowering academic performance it is perhaps not surprising that there is no difference in performance when anxiety levels are comparable. Although one must interpret retroactive reporting of test anxiety cautiously: it is possible that students are reporting having felt more anxious not because of test anxiety levels, but rather as an acknowledgment of being underprepared for the exam (Seipp, 1991; Huntley et al., 2016).
Limitations
One limitation of the current study is that the post-test assessment (which asked whether students felt that they had adequate time or experienced test anxiety on the exam that had just passed) has not been validated. Also, the study was conducted in a single upper division class; a larger study evaluating the impact of extended time on anxiety and performance across different institutions and levels would be helpful at elucidating the generalizability of the current findings. Indeed, the length of time that students require to complete assessments might vary by subject and by the type(s) of cognitive skills that are demanded. For example, assessments that require memorization and recitation of facts may not require as much time as assessments that require problem-solving and interpretation.
Finally, the impact of extended test time on certain student demographics is unclear. As an example, one could imagine extended test time having a meaningful impact on students for whom English is not their first language. While students with accommodations through ADA were exempt from this study, students with learning differences may also benefit from additional time.
Practical implications
From a practical perspective, it is not possible for many undergraduate classes to offer tests or exams that last an indefinite period of time. So how should an instructor determine how much time to offer students (or rather: how long should an exam be given a fixed amount of time)? One could go about the business of determining whether their exams are “speeded” or “unspeeded” by trying multiple iterations until they are satisfied that the exams are not “speeded”. However this would likely subject some students to tests that don't allow them enough time to complete the assessment. When the corresponding author was a new instructor they were provided two suggestions for gauging how long their exams should be, given the fixed period of time provided for their assessments. The first was to provide the exam to the instructional (or teaching) assistants and ask them to time how long it takes them to complete it. Taking the average time of the instructional assistants and multiplying by two would provide a reasonable gauge for the length required for the students. The second suggestion was to print off the exam questions and have the instructor themself write down their answers to the questions. Taking the instructor's time and multiplying by three would provide a reasonable gauge for the length required for the students. In these examples, if one had an exam block that was 60 min long, the instructional assistants should finish the exam (on average) in 30 (or fewer) min, and the instructor themself should finish in 20 (or fewer) min. These suggestions are merely anecdotal, and provide the “business as usual” model for the current manuscript.
The current study found that increasing test time on an already-unspeeded test improved neither test anxiety nor performance, which begs the question: is there a benefit to increasing the amount of time students have beyond some minimal threshold after which the test is unspeeded? In a study of doubling the amount of time middle schoolers had to complete a standardized math test, Elliott and Marquart (2004) found that students' scores did not improve significantly from a timed condition of an exam to an untimed condition, but that having extended time helped increase students' motivation while taking the test and increased their self-reported confidence in their ability to perform well. This suggests the possibility that, even if increasing exam time does not improve performance, it may have potential to improve other important outcomes like self-efficacy and belonging, which are important for students' long-term success (Ballen et al., 2017). Indeed, it is easy to imagine a situation in which students might make excuses for poor exam performance by suggesting that their performance was due to a time shortage rather than poorer preparation. For this reason alone, erring on the side of giving students more time to complete assessments might be beneficial.
Data availability statement
The datasets presented in this study can be found in online repositories. The names of the repository/repositories and accession number(s) can be found in the article/Supplementary material.
Ethics statement
The studies involving humans were approved by University of California, San Diego; Institutional Review Board. The studies were conducted in accordance with the local legislation and institutional requirements. Written informed consent for participation was not required from the participants or the participants' legal guardians/next of kin.
Author contributions
NM: Conceptualization, Data curation, Formal analysis, Investigation, Methodology, Software, Writing – original draft. LM: Data curation, Formal analysis, Methodology, Software, Writing – review & editing. JC: Conceptualization, Data curation, Investigation, Methodology, Project administration, Software, Supervision, Visualization, Writing – original draft, Writing – review & editing.
Funding
The author(s) declare that no financial support was received for the research and/or publication of this article.
Acknowledgments
The authors wish to thank Dr. Steven Pan for helpful comments on an earlier draft of the manuscript.
Conflict of interest
The authors declare that the research was conducted in the absence of any commercial or financial relationships that could be construed as a potential conflict of interest.
Generative AI statement
The author(s) declare that no Gen AI was used in the creation of this manuscript.
Publisher's note
All claims expressed in this article are solely those of the authors and do not necessarily represent those of their affiliated organizations, or those of the publisher, the editors and the reviewers. Any product that may be evaluated in this article, or claim that may be made by its manufacturer, is not guaranteed or endorsed by the publisher.
Supplementary material
The Supplementary Material for this article can be found online at: https://www.frontiersin.org/articles/10.3389/feduc.2025.1567709/full#supplementary-material
References
Ballen, C. J., Wieman, C., Salehi, S., Searle, J. B., and Zamudio, K. R. (2017). Enhancing diversity in undergraduate science: self-efficacy drives performance gains with active learning. CBE Life Sci. Educ. 16:ar56. doi: 10.1187/cbe.16-12-0344
Cassady, J. C., and Johnson, R. E. (2002). Cognitive test anxiety and academic performance. Contemp. Educ. Psychol. 27, 270–295. doi: 10.1006/ceps.2001.1094
Driscoll, R. (2007). Westside test anxiety scale validation. Available online at: files.eric.ed.gov/fulltext/ED495968.pdf (accessed September 7, 2021).
Elliott, S. N., and Marquart, A. M. (2004). Extended time as a testing accommodation: its effects and perceived consequences. Except. Child. 70, 349–367. doi: 10.1177/001440290407000306
Evans, F. R., and Reilly, R. R. (1972). A study of speededness as a source of test bias. J. Educ. Measure. 9, 123–131. doi: 10.1111/j.1745-3984.1972.tb00767.x
Foos, P. W. (1989). Completion time and performance on multiple-choice and essay tests. Bull. Psycho. Soc. 27, 179–180. doi: 10.3758/BF03329933
Huntley, C. D., Young, B., Jha, V., and Fisher, P. L. (2016). The efficacy of interventions for test anxiety in university students: a protocol for a systematic review and meta-analysis. Int. J. Educ. Res. 77, 92–98. doi: 10.1016/j.ijer.2016.03.001
Jurich, D. P. (2020). “A history of test speededness,” in Integrating the Evolution of Theory and Practice, 1st Edn, eds. M. J. Margous and R. A. Feinberg (New York, NY: Routledge), 1–18. doi: 10.4324/9781351064781-1
Landrum, R. E., Carlson, H., and Manwaring, W. (2009). The relationship between time to complete a test and test performance. Psychol. Learn. Teach. 8, 53–56. doi: 10.2304/plat.2009.8.2.53
Lovett, B. J., Lewandowski, L. J., and Potts, H. E. (2017). Test-taking speed: predictors and implications. J. Psychoeduc. Assess. 35, 351–360. doi: 10.1177/0734282916639462
Marcus, N., Mueller, L. O., and Cooke, J. E. (2024). Data From: Extended Time on an Unspeeded Assessment Improves Neither Test Anxiety Nor Performance. San Diego, CA: UC San Diego Library Digital Collections.
Munger, G. F., and Loyd, B. H. (1991). Effect of speededness on test performance of handicapped and nonhandicapped examinees. J. Educ. Res. 85, 53–57. doi: 10.1080/00220671.1991.10702812
Nevo, B., and Spector, A. (1979). Personal tempo in taking tests of the multiple-choice type. J. Educ. Res. 73, 75–78. doi: 10.1080/00220671.1979.10885211
Onwuegbuzie, A. J., and Seaman, M. A. (1995). The effect of time constraints and statistics test anxiety on test performance in a statistics course. J. Exp. Educ. 63, 115–124. doi: 10.1080/00220973.1995.9943816
R Core Team (2021). R: A Language and Environment for Statistical Computing. Vienna: R Foundation for Statistical Computing.
Ramirez, G., and Beilock, S. L. (2011). Writing about testing worries boosts exam performance in the classroom. Science 331, 211–213. doi: 10.1126/science.1199427
Roediger, H. L., and Karpicke, J. D. (2006). Test-enhanced learning: taking memory tests improves long-term retention. Psychol. Sci. 17, 249–255. doi: 10.1111/j.1467-9280.2006.01693.x
Seipp, B. (1991). Anxiety and academic performance: a meta-analysis of findings. Anxiety Res. 4, 27–41. doi: 10.1080/08917779108248762
Steinmayr, R., Crede, J., McElvany, N., and Wirthwein, L. (2016) Subjective well-being test anxiety, academic achievement: testing for reciprocal effects. Front. Psychol. 6:1994. doi: 10.3389/fpsyg.2015.01994
Swineford, F. (1956). Technical Manual for Users of Test Analyses. Statistical Report 56–42. Princeton, NJ: Educational Testing Service.
Tan, G. X. D., Soh, X. C., Hartanto, A., Goh, A. Y. H., and Majeed, N. M. (2023). Prevalence of anxiety in college and university students: An umbrella review. J. Affect. Disord. Reports 14:100658. doi: 10.1016/j.jadr.2023.100658
Thomas, C. L., Cassady, J. C., and Finch, W. H. (2018). Identifying severity standards on the cognitive test anxiety scale: cut score determination using latent class and cluster analysis. J. Psychoeduc. Assess. 36, 492–508. doi: 10.1177/0734282916686004
Tsui, J. M., and Mazzocco, M. M. M. (2006). Effects of math anxiety and perfectionism on timed versus untimed math testing in mathematically gifted sixth graders. Roeper Rev. 29, 132–139. doi: 10.1080/02783190709554397
Walczyk, J. J., Kelly, K. E., Meche, S. D., and Braud, H. (1999). Time limitations enhance reading comprehension. Contemp. Educ. Psychol. 24, 156–165. doi: 10.1006/ceps.1998.0992
Wild, C. L., Durso, R., and Rubin, D. B. (1982). Effect of increased test-taking time on test scores by ethnic group, years out of school, and sex. J. Educ. Measure. 19, 19–28. doi: 10.1111/j.1745-3984.1982.tb00111.x
Keywords: test performance, undergraduate, biology, test time, test anxiety
Citation: Marcus N, Mueller LO and Cooke JE (2025) Extended time on an unspeeded assessment improves neither test anxiety nor performance. Front. Educ. 10:1567709. doi: 10.3389/feduc.2025.1567709
Received: 27 January 2025; Accepted: 07 April 2025;
Published: 22 April 2025.
Edited by:
Gavin T. L. Brown, The University of Auckland, New ZealandReviewed by:
Natanael Karjanto, Sungkyunkwan University, Republic of KoreaAnn Dowker, University of Oxford, United Kingdom
Jeffrey Stowell, Eastern Illinois University, United States
Copyright © 2025 Marcus, Mueller and Cooke. This is an open-access article distributed under the terms of the Creative Commons Attribution License (CC BY). The use, distribution or reproduction in other forums is permitted, provided the original author(s) and the copyright owner(s) are credited and that the original publication in this journal is cited, in accordance with accepted academic practice. No use, distribution or reproduction is permitted which does not comply with these terms.
*Correspondence: James E. Cooke, ajJjb29rZUB1Y3NkLmVkdQ==
†ORCID: James E. Cooke orcid.org/0000-0002-2833-0103