 Sara M. Briker1
 Jessica Y. Aduwo1
 Regine Mugeni1,2
 Margrethe F. Horlyck-Romanovsky1Christopher W. DuBose1
 Lilian S. Mabundo1
 Thomas Hormenu1
 Stephanie T. Chung1
 Joon Ha3
 Arthur Sherman3
 Anne E. Sumner1,2*
- 1Diabetes, Endocrinology, and Obesity Branch, National Institute of Diabetes, Digestive and Kidney Diseases, National Institutes of Health, Bethesda, MD, United States
- 2National Institute of Minority Health and Health Disparities, National Institutes of Health, Bethesda, MD, United States
- 3Laboratory of Biological Modeling Medicine, National Institute of Diabetes, Digestive and Kidney Diseases, National Institutes of Health, Bethesda, MD, United States
Introduction: To improve detection of undiagnosed diabetes in Africa, there is movement to replace the OGTT with A1C. The performance of A1C in the absence of hemoglobin-related micronutrient deficiencies, anemia and heterozygous hemoglobinopathies is unknown. Therefore, we determined in 441 African-born blacks living in America [male: 65% (281/441), age: 38 ± 10 y (mean ± SD), BMI: 27.5 ± 4.4 kg/m2] (1) nutritional and hematologic profiles and (2) glucose tolerance categorization by OGTT and A1C.
Methods: Hematologic and nutritional status were assessed. Hemoglobin <11 g/dL occurred in 3% (11/441) of patients and led to exclusion. A1C and OGTT were performed in the remaining 430 participants. ADA thresholds for A1C and OGTT were used. Diagnosis by A1C required meeting either A1C-alone or A1C&OGTT criteria. Diagnosis by OGTT-alone required detection by OGTT and not A1C.
Results: Hemoglobin, mean corpuscular volume and red blood cell distribution width were 14.0 ± 1.3 g/dL, 85.5 ± 5.3 fL, and 13.2 ± 1.2% respectively. B12, folate, and iron deficiency occurred in 1% (5/430), 0% (0/430), and 4% (12/310), respectively. Heterozygous hemoglobinopathy prevalence was 18% (78/430). Overall, diabetes prevalence was 7% (32/430). A1C detected diabetes in 32% (10/32) but OGTT-alone detected 68% (22/32). Overall prediabetes prevalence was 41% (178/430). A1C detected 57% (102/178) but OGTT-alone identified 43% (76/178). After excluding individuals with heterozygous hemoglobinopathies, the rate of missed diagnosis by A1C of abnormal glucose tolerance did not change (OR: 0.99, 95% CI: 0.61, 1.62).
Conclusions: In nutritionally replete Africans without anemia or heterozygous hemoglobinopathy, if only A1C is used, ~60% with diabetes and ~40% with prediabetes would be undiagnosed.
Clinical Trial Registration: www.ClinicalTrials.gov, Identifier: NCT00001853
Introduction
Undiagnosed diabetes in Africa has become an economic and public health challenge (1). In fact, 70% of Africans living with diabetes are undiagnosed (1). Historically, the OGTT has been the diagnostic standard for the detection of diabetes and its precursor state, prediabetes (2). However, due to cost and a shortage of health care professionals, conducting an OGTT is often not feasible (3). In 2010, the International Diabetes Federation (IDF) and the American Diabetes Association (ADA) approved hemoglobin A1c (A1C) as a diagnostic alternative to the OGTT (4).
A1C is a measure of the degree to which hemoglobin A1 is glycated (3). Therefore, anemia and nutritional deficiencies which affect red blood cell physiology such as iron, B12, and folate compromise the performance of A1C (5). Furthermore, heterozygous hemoglobinopathies, specifically sickle cell trait (SCT) and hemoglobin C (HbC) trait, are common in Africa (6, 7). There is great uncertainty on whether the presence of a heterozygous hemoglobinopathy impacts the diagnostic efficacy of A1C (8–10).
Studies in mixed ancestry adults from South Africa have demonstrated that A1C detects abnormal glucose tolerance at a much lower rate than the 2-h glucose obtained from an OGTT (11). However, the degree to which iron, B12 or folate deficiency influenced the results of these studies is unknown (11).
By working with African-born blacks living in America, we address the ability of A1C to diagnose abnormal glucose tolerance in Africans who are neither anemic nor nutritionally compromised.
To use A1C or OGTT data to compile health statistics or establish healthcare plans in Africa, it is imperative to assess the reproducibility of diagnoses made by these tests. Therefore, we also address the reproducibility of diagnoses made by A1C and OGTT. In addition, as we are comparing the rate of detection of diabetes by A1C vs. OGTT, we also report on the severity of physiologic characteristics of diabetes when detection is made by A1C vs. by OGTT-alone.
This investigation had both primary and secondary goals. Our primary goals were to determine in African-born blacks living in America (1) nutritional and hematologic profiles and (2) glucose tolerance categorization by OGTT and A1C. Our secondary goals were (3) determine the diagnostic reproducibility of OGTT and A1C and (4) compare degree of glycemia, insulin resistance and beta-cell function in diabetes and prediabetes detected by A1C vs. that detected by OGTT and not A1C.
Research Design and Methods Population
To assess diabetes and heart disease risk in African-born blacks living in the United States, the Africans in America cohort was established (12–15).
Recruitment was achieved by newspaper advertisements (45%), previous participant referrals (30%), NIH website and staff referrals (10%), community event outreach (10%), and flyers (5%). The study was approved by the National Institute of Diabetes Digestive and Kidney Diseases Institutional Review Board (Clinical Trials.gov Identifier: NCT00001853). Prior to enrollment, informed written consent was obtained.
To determine eligibility, telephone interviews were conducted. Prospective enrollees had to report that they were born in sub-Saharan Africa to two black parents who were also born in sub-Saharan Africa. In addition, they had to self-identify as healthy and state that to their knowledge they did not have diabetes.
After a telephone interview, 468 African-born blacks living in metropolitan Washington, DC came to the NIH Clinical Center for an outpatient screening visit. Thirty-nine individuals were excluded. Reasons for exclusion were anemia defined as hemoglobin <11 g/dL (n = 11), elevated liver transaminases (n = 1), declined blood draw (n = 1), pregnancy (n = 3), and scheduling conflicts (n = 20). In addition, two individuals were excluded because they had persistent fetal hemoglobin which interfered with A1c measurement. Hence, 430 individuals proceeded to Test Day 1.
The 430 participants were recruited in two consecutive waves: A and B (Supplement Figure 1).
Wave A consists of the first 332 enrolled individuals. At Test Day 1, A1C levels were measured and an OGTT (OGTT-1) performed. If the OGTT-1 met the ADA glucose criteria for diabetes, the person was invited to return to the Clinical Center for Test Day 2 for a repeat A1C and second OGTT (OGTT-2). Twenty-one individuals were diagnosed with diabetes and 18 agreed to return for a second A1C and OGTT-2.
Wave B consists of the 98 enrolled individuals who entered the study after Wave A. All Wave B participants were invited to the NIH Clinical Center for duplicate testing by A1C and OGTT. The two test days were 10 ± 7 days apart. Ninety-six of 98 enrollees agreed to be tested twice.
Therefore, OGTT-1 data are available for 430 participants (332 people from Wave A and 98 people from Wave B). OGTT-2 data were available for 114 (18 people from Wave A and 96 people from Wave B) (Supplement Figure 1).
Outpatient Visits
Screening Visit
A history, physical and electrocardiogram were performed. Routine blood tests were done to document the absence of anemia, kidney, liver, and thyroid disease.
Test Day 1
Participants fasted for 12h and came to the Clinical Center at 7 a.m. Weight, height, waist circumference (WC), and blood pressure were obtained (12). A whole blood sample was obtained for A1C measurement and hemoglobin electrophoresis. An OGTT (Trutol 75; Custom Laboratories, Baltimore, MD) was performed with blood samples taken at baseline, 30, 60, and 120 min for determination of glucose and insulin concentrations.
After the OGTT was completed, a computerized tomographic (CT) scan (Siemens and Somatom Force Scanner, Munich, Germany) was performed at the level of the L2–3 vertebrae using automated software for the measurement of visceral adipose tissue (VAT) (12).
Test Day 2
One hundred and fourteen participants returned to the NIH Clinical Center 10 ± 7 days after Test Day 1 for a repeat A1C and OGTT-2.
Diagnosis of Glucose Tolerance Status
A priori it was decided that glucose tolerance category assignment was based on the results of Test Day 1.
Diabetes: A1C ≥ 6.5%
or
FPG ≥ 126 mg/dL
or
2 h glucose ≥ 200 mg/dL.
Prediabetes: 5.7% ≤ A1C ≤ 6.4%
or
100 mg/dL ≤ FPG < 126 mg/dL
or
140 mg/dL < 2 h glucose < 200 mg/dL
Normal glucose tolerance:
A1C<5.7% and FPG <100 mg/dL and 2 h glucose <200 mg/dL.
Physiologic Measurements
Degree of Glycemia
Area under the glucose curve using the trapezoidal rule (16):
Insulin Resistance
Matsuda Index (17):
Beta-Cell Function
The insulinogenic index (18):
Assays
Hemoglobin, hematocrit, MCV, RDW, platelet count, and MPV were measured in EDTA-anticoagulated whole blood using a Sysmex XE-5000 analyzer (Chicago, IL). Glucose, insulin and liver enzymes were analyzed in serum with Roche Cobas 6000 analyzer (Roche Diagnostics, Indianapolis, IN). Vitamin B12 and folate in serum were analyzed with an Immulite 2000 XPi analyzer (Siemens Healthcare, Malvern, PA). Three hundred and seventy-nine consecutively enrolled individuals had albumin analyzed (Roche Cobas 6000 analyzer). Three hundred and ten consecutively enrolled individuals had reticulocyte count (Sysmex XE-5000 analyzer), and iron, transferrin, and ferritin were measured in serum (Roche Cobas 6000 analyzer).
A1C by High Performance Liquid Chromatography
A1C values were measured by three different National Glycohemoglobin Standardization Program (NGSP)-certified instruments which were used sequentially by the NIH Clinical Center. All three instruments [BioRad Classic Variant (n = 32), Bio-Rad Variant II (n = 158) and BioRad D10 (n = 240)] were manufactured by BioRad Laboratories (Hercules, CA) and used similar HPLC technology. The correlation (R2) of the results between instruments was 99%.
Hemoglobin Electrophoresis
Two hundred ninety-eight consecutively enrolled individuals had hemoglobin electrophoresis. However, 132 participants were enrolled before hemoglobin electrophoresis was included in the protocol. These 132 individuals had hemoglobin type determined by HPLC. Of these 132 participants, 7 had variant hemoglobin reported on their HPLC report but their HPLC tracing was unavailable. Therefore, the specific type of heterozygous hemoglobinopathy could not be determined (i.e., SCT, HbC trait, etc.). These individuals were classified as heterozygous hemoglobin-unknown type.
Statistical Analyses
Unless stated otherwise, data are presented as mean ± SD. As appropriate, comparisons were made by unpaired t-tests, Mann-Whitney, one-way analyses of variance with Bonferroni corrections for multiple comparisons or chi-squared tests. Odds ratios were calculated with logistic regressions.
Reproducibility of diagnosis made by A1C and OGTT was determined with the κ-statistic and illustrated with Sankey plots [http://sankeymatic.com/build/ (19)]. The κ-statistic was interpreted according to standard criteria [slight (0–0.20), fair (0.21–0.40), moderate (0.41–0.60), substantial (0.61–0.80), excellent (0.81–1.0)] (20).
Study data were managed with Research Electronic Data Capture (REDCap) (21). P-values < 0.05 were considered significant. Analyses were performed with STATA (v 15, College Station, Texas).
Results
Population characteristics are provided in Table 1. The African regions of origin of the participants were West (53%), Central (21%), and East (26%) (Table 1). The age of the participants was 38 ± 10 y. The age of entry into the United States was 26 ± 11 y. Years lived in the United States was 12 ± 9 y. West Africans lived in the United States the longest (P = 0.031).
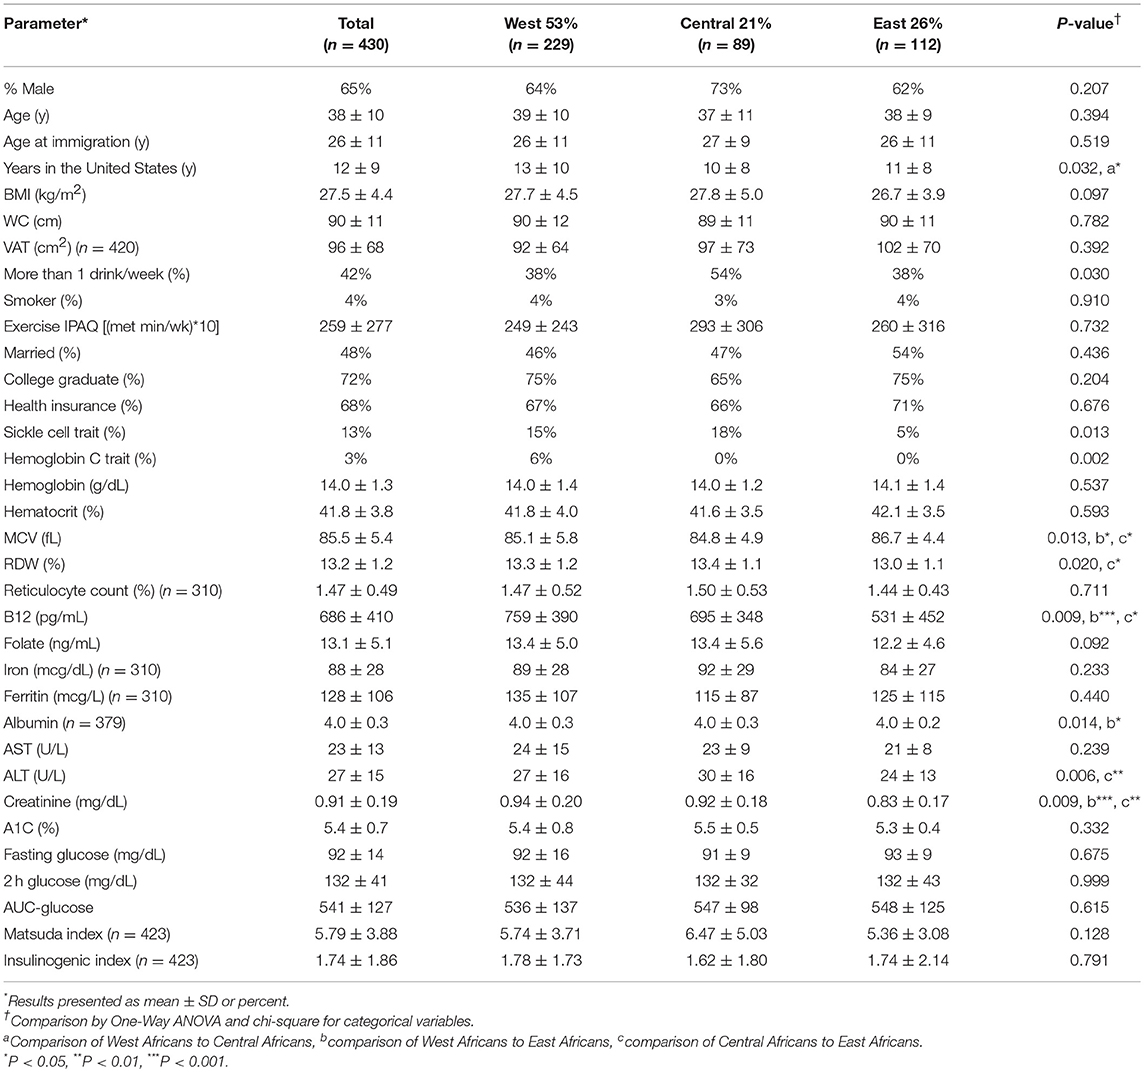
Table 1. Metabolic and demographic characteristics.
Body Size
BMI, WC and VAT did not vary by African region of origin (BMI: 27.5 ± 4.5 kg/m2, WC: 90 ± 11 cm and VAT: 95 ± 68 cm2).
Social Factors
Central Africans reported a higher rate of alcohol consumption than West and East Africans (P = 0.030). However, smoking, exercise, marital status, education and health insurance did not differ by region.
Hematologic and Nutritional Factors
SCT was more common in West and Central than East Africans (P = 0.013). HbC trait occurred only in West Africans.
Hemoglobin, hematocrit, iron concentrations, and related parameters (TIBC, % saturation and ferritin) did not vary by region. MCV was highest and RDW lowest in East Africans. B12, folate and iron deficiency occurred in 1% (5/430), 0% (0/430), and 4% (12/309) of participants, respectively. Albumin was <3.5 g/dL in 2% (9/379) of participants.
Liver and Kidney Function
Liver function tests were either normal or less than 2SD above normal. Mean creatinine was 0.91 ± 0.19 mg/dL (range 0.52 to 1.95 mg/dL).
Glycemia Measures
Neither glycemic parameters (A1C, fasting, and 2 h glucose) nor measurements of glucose physiology (AUC-glucose, insulin resistance, and beta-cell function) varied by African region. Therefore, the Africans from the three regions—West, Central, and East—were evaluated together.
Diabetes Prevalence
The prevalence of previously undiagnosed diabetes was 7% (32/430).
People with diabetes were divided into 3 groups (Figure 1A):
(1) Diabetes by A1C (A1C-alone or A1C&OGTT), 32% (10/32);
(2) Diabetes by OGTT-alone but prediabetes by A1C, 34% (11/32);
(3) Diabetes by OGTT-alone but NGT by A1C, 34% (11/32).
Degree of glycemia (AUC-glucose), insulin resistance (Matsuda index), and beta-cell function (insulinogenic index) did not differ by diabetic group (all P > 0.3) but were significantly different from the NGT group (P < 0.001) (Figure 2).
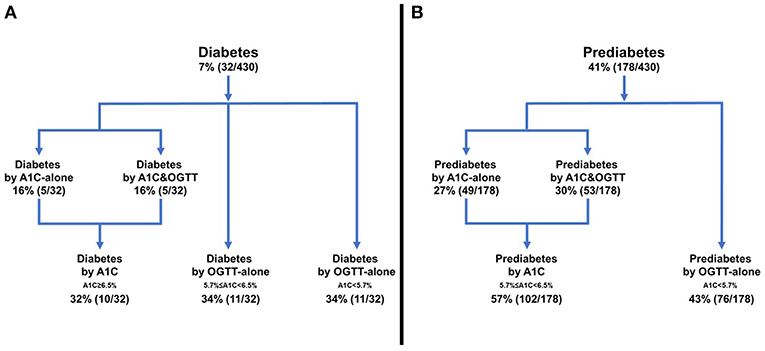
Figure 1. Frequency of diabetes or prediabetes according to diagnostic test. (A) Diabetes, (B) Prediabetes.
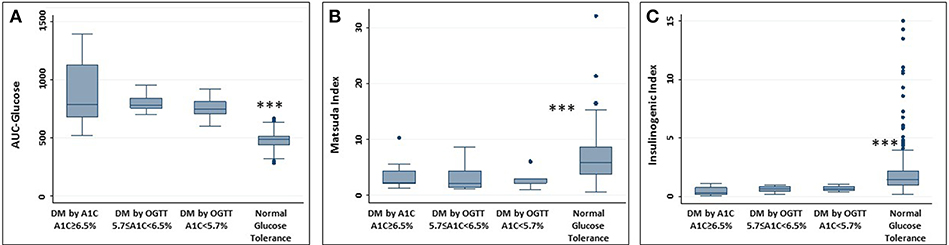
Figure 2. Measures of glucose physiology in individuals with diabetes. Normal glucose tolerance group provided for reference. (A) AUC-glucose; (B) Matsuda index; (C) Insulinogenic index. No difference between the 3 groups with diabetes. Difference between each group with diabetes and NGT, ***P < 0.001.
Age, BMI, WC, and VAT did not differ by diagnostic modality. In addition, liver and kidney function, prevalence of SCT and hemoglobin did not vary. Therefore, these potential confounders do not explain the differences in detection of diabetes by A1C vs. OGTT-alone (Supplement Table 1).
Prediabetes Prevalence
The prevalence of prediabetes in the cohort was 41% (178/430). The 178 people with prediabetes were divided into 2 groups (Figure 1B):
(1) Prediabetes detected by A1C (A1C-alone or A1C&OGTT), 57% (102/178);
(2) Prediabetes detected by OGTT-alone but NGT by A1C, 43% (76/178).
Relationship of Heterozygous Hemoglobinopathy to A1C Levels
For people with both diabetes and prediabetes, A1C levels did not differ by hemoglobin type (Supplement Figure 2). For example, A1C levels in diabetes and hemoglobin type AA vs. heterozygous hemoglobinopathy were 6.7 ± 1.7 vs. 5.7 ± 0.9, P = 0.120. For prediabetes, A1C levels in hemoglobin type AA vs. heterozygous hemoglobinopathy were 5.6 ± 0.4 vs. 5.6 ± 0.5, P = 0.581.
Diabetes
Of the 19 participants with diabetes by OGTT and hemoglobin type AA, 63% (12/19) had A1C < 6.5% (Supplement Table 2A). Therefore, 63% of people with diabetes and hemoglobin type AA would not be detected if only A1C was obtained.
Of the 13 individuals with both diabetes and heterozygous hemoglobinopathy, 77% (10/13) had A1C < 6.5% (Supplement Table 2B). Therefore, 77% of people with diabetes and heterozygous hemoglobinopathy would not be detected if only A1C was obtained.
Prediabetes
For the participants with prediabetes and hemoglobin type AA, 43% (65/152) had A1C < 5.7%. Therefore, 43% of people with prediabetes and hemoglobin type AA would not be detected if only A1C was obtained.
Of the 25 people with both prediabetes and heterozygous hemoglobinopathy, 40% (10/25) had A1C <5.7%. Therefore, 40% would not be detected if only A1C was obtained.
Overall, heterozygous hemoglobinopathies did not influence the odds of underdiagnosis of abnormal glucose tolerance by A1C (OR: 0.99, 95% CI: 0.61, 1.62).
Reproducibility
One hundred and fourteen individuals had duplicate OGTT 10 ± 7 days apart. One participant did not have a repeat A1C on the day of their second OGTT.
Reproducibility of Diagnoses Made by OGTT
For the binary outcome of diabetes or no diabetes, reproducibility was excellent (κ = 0.89). Of note, no one without diabetes on Test Day 1 was diagnosed with diabetes on Test Day 2 (Figure 3A).
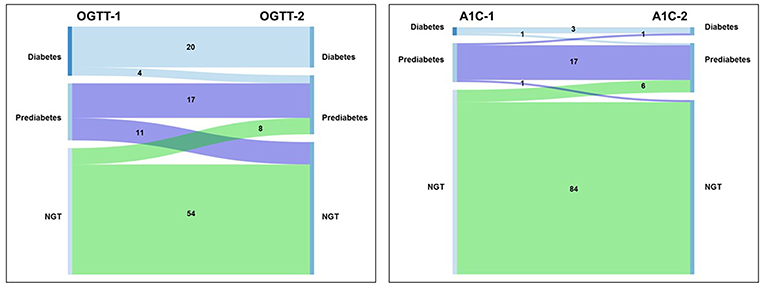
Figure 3. Sankey diagram of transitions between glucose tolerance categories. (A) OGTT; (B) A1C. Left side of each panel is the proportion of individuals with diagnosis at the first test. Right side of each panel is the proportion of individuals with diagnosis at the second test.
Excluding people with diabetes and considering the binary outcome of prediabetes or NGT, reproducibility of the diagnosis of prediabetes declined to moderate (κ = 0.49). This relatively low degree in reproducibility is largely accounted for by movement between NGT and prediabetes for people with fasting glucose ≥90 mg/dL. Individuals with fasting plasma glucose (FPG) ≥90 mg/dL were 2.5 times more likely to transition between prediabetes and NGT than people with FPG <90 mg/dL [OR 2.58 (95% CI: 1.31, 5.06), P = 0.006].
Reproducibility of Diagnoses Made by A1C
For the diagnosis of the presence or absence of diabetes, reproducibility was substantial (κ = 0.65). One person without diabetes on Test Day 1 was diagnosed with diabetes on Test Day 2 (Figure 3B).
Similarly, for the diagnosis of prediabetes, reproducibility was substantial (κ = 0.65).
Discussion
Working with African-born blacks living in America, we are the first to report that even in the absence of nutritional and hematological confounders, ~60% of Africans with diabetes and ~40% with prediabetes would be undiagnosed if A1C replaced the OGTT. This level of underperformance of A1C is within the 20 to 80% lower range of detection of diabetes observed in whites, mixed ancestry populations, indigenous peoples, Asians, and Hispanics (11, 22, 23).
It is speculated that the poor performance of A1C in Africans can be accounted for by undiagnosed anemia, hemoglobin-related micronutrient deficiencies, liver or kidney disease or heterozygous hemoglobinopathies (24, 25). However, we were able to screen for each of these conditions and document that in the Africans in America cohort, these factors did not account for underperformance of A1C as a diagnostic test.
Detection of Diabetes by OGTT but Not A1C
Of the people diagnosed with diabetes by OGTT-alone, A1C classified one half with prediabetes and one half with NGT. Concern needs to be focused on individuals diagnosed with diabetes but identified as NGT by A1C. Due to the A1C diagnosis of NGT, two adverse events occur. First, the prevalence of diabetes is underestimated. Second, healthcare providers do not provide to these patients' critical information on diet, medication, lifestyle or eye or foot care. In short, lack of the correct diagnosis increases the risk for progressive, preventable disease (26).
Detection of Prediabetes by OGTT but Not A1C
We found that if only A1C was performed, 43% of individuals with prediabetes would be categorized as NGT by A1C. This is problematic because even a single abnormal OGTT is an important risk factor for diabetes and cardiovascular disease (27). Furthermore, the evidence that conversion from prediabetes to diabetes can be prevented or delayed by lifestyle interventions is based on OGTT diagnosed disease (28).
Physiologic Severity
We performed multi-sampled OGTT and calculated the degree of glycemia (AUC-glucose), insulin resistance (Matsuda Index), and β-cell function (insulinogenic index) in diabetes detected by A1C vs. OGTT-alone. Hence, we are able to report that the physiologic severity of diabetes and prediabetes detected by A1C vs. OGTT-alone is equivalent. Therefore, abnormal glucose tolerance diagnosed by either test should be treated.
Heterozygous Hemoglobinopathy
There is concern that heterozygous hemoglobinopathies might contribute to the underperformance of A1C (8, 9). However, in our study, the presence of heterozygous hemoglobinopathies did not increase the odds of under detection of abnormal glucose tolerance by A1C. Therefore, we do not attribute the poor performance of A1C as a diagnostic test to the presence of heterozygous hemoglobinopathies.
However, there may be two reasons for the difference in our assessment of the effect of heterozygous hemoglobinopathy. First, we were able to operate under more optimal conditions. First, people with anemia were excluded. Second, we were able to document that <5% of participants had low B12, folate or iron concentrations. Furthermore, in an earlier study of 90 participants enrolled in this cohort, we analyzed A1C by both HPLC (BioRad) and boronate affinity chromatography (10). Twenty-three percent (22/90) of that sample had heterozygous hemoglobinopathy. Agreement between A1C levels determined by the two methods, boronate affinity and HPLC, in both groups was excellent. In short, under ideal conditions heterozygous hemoglobinopathies do not appear to interfere with determination of A1C levels. But ideal conditions are not the norm in clinical practice.
Reproducibility of Diagnosis
We evaluated OGTT reproducibility by analyzing diabetes and prediabetes separately. When the analysis was designed to determine the presence or absence of diabetes, reproducibility was excellent (κ = 0.89). This high degree of reproducibility is consistent with the observation that no one transitioned from diabetes to NGT and no new cases of diabetes were detected at the second OGTT. In short, the high degree of reproducibility for the diagnosis of diabetes in Africans should engender confidence in a diagnosis made by a single OGTT.
However, when the diagnosis was confined to the presence or absence of prediabetes, the OGTT exhibited only moderate reproducibility (κ = 0.49). This degree of reproducibility of the diagnosis by prediabetes by OGTT is consistent with studies in other populations (27, 29). Overall, low reproducibility for the diagnosis of prediabetes by the OGTT is to be anticipated because prediabetes is a transitory state. We found that those in the subgroup with fasting glucose between 90 and 100 mg/dL were most likely to transition between NGT and prediabetes.
Reproducibility of diagnosis by A1C was substantial for both diabetes and prediabetes (κ = 0.65). However, as the overall rate of detection of diabetes and prediabetes was so low at the first study, serial testing with A1C is not likely to resolve the problem of underdiagnosis.
Strengths and Limitations
A major strength of this study was our access to a wide range of data, including (a) multi-sampled OGTT (b) duplicate studies in 114 participants, (c) hemoglobin electrophoresis and (d) blood work, which made it possible to rule out A1C confounders such as anemia, iron, folate and B12 deficiencies as well as liver and kidney dysfunction.
There are also weaknesses. We recognize that our sample size is relatively small. However, the prevalence of diabetes in our cohort was 7%, which is similar to the prevalence of diabetes in African-born blacks living in Canada (30). Equivalent epidemiologic data is not available in the United States. In addition, our sample size was large enough that the prevalence of sickle cell trait was significantly higher in West and Central Africa than East Africa. Correspondingly, the mean corpuscular volume (MCV) was lower in West and Central than East Africa.
Although this was a cross-sectional study, our goal was to determine the prevalence of diabetes (and prediabetes) if A1C replaced the OGTT. Nonetheless, it would be ideal to have a prospective study to compare disease progression in A1C diagnosed disease vs. OGTT-alone diagnosed disease.
Conclusions
Our investigation confirms that A1C underperforms as a diagnostic test for hyperglycemic states even in the absence of nutritional deficiencies or hemoglobinopathies. Therefore, we agree that while controversy exists in the diagnostic efficacy of A1C overall, as a single test in Africans, A1C is not an optimal substitute for the OGTT (11, 24, 31, 32). In short, the poor diagnostic performance of A1C as a single test in African-born blacks has the potential to contribute to an underestimation of diabetes prevalence and compromise healthcare resource allocation and care. However, emerging data suggests there may be value in combining A1C with other tests such as FPG or glycated albumin (10, 33, 34). This is important because the OGTT cannot be recommended because it is neither cost-effective nor feasible. Emerging alternatives to the OGTT include fasting glucose, glycated albumin, fructosamine, and 1,5-anhydroglucitol (10, 33, 35). Optimizing the diagnosis of glucose tolerance status in Africans requires investment in research to assess if these alternatives alone or in combination with A1C could be the way forward.
Data Availability
The datasets generated for this study are available on request to the corresponding author.
Ethics Statement
This study was approved by National Institute of Diabetes Digestive and Kidney Diseases Institutional Review Board (ClinicalTrials.gov Identifier: NCT00001853). Prior to enrollment, informed written consent was obtained.
Author Contributions
SB, JA, CD, LM, SC, and AES collected the data. SB, JA, RM, MH-R, TH, SC, JH, AS, and AES analyzed the data. SB and AES wrote the manuscript. SB, JA, RM, MH-R, CD, LM, TH, SC, JH, AS, and AES provided critical rewrites.
Funding
This study was funded by the Intramural Programs of two NIH Institutes (NIDDK and NIMHD) and the NIH Clinical Center. The NIH had no influence on the content of the manuscript.
Conflict of Interest Statement
The authors declare that the research was conducted in the absence of any commercial or financial relationships that could be construed as a potential conflict of interest.
Acknowledgments
SB, JA, RM, MH-R, CD, LM, TH, SC, JH, AS, and AES, were supported by the intramural program of NIDDK. RM and AES also received support from the intramural program of NIMHD.
Supplementary Material
The Supplementary Material for this article can be found online at: https://www.frontiersin.org/articles/10.3389/fendo.2019.00533/full#supplementary-material
References
1. IDF Diabetes Atlas-8th Edition. (2017). Available online at: http://www.diabetesatlas.org
2. Classification and diagnosis of diabetes mellitus and other categories of glucose intolerance. National Diabetes Data Group. Diabetes. (1979) 28:1039–57. doi: 10.2337/diab.28.12.1039
3. Sacks DB. A1C versus glucose testing: a comparison. Diab Care. (2011) 34:518–23. doi: 10.2337/dc10-1546
4. Standards of medical care in diabetes−2010. Diabetes Care. (2010) 33 (Suppl 1):S11–61. doi: 10.2337/dc10-S011
5. Sacks DB. Hemoglobin A1c in diabetes: panacea or pointless? Diabetes. (2013) 62:41–3. doi: 10.2337/db12-1485
6. Piel FB, Howes RE, Patil AP, Nyangiri OA, Gething PW, Bhatt S, et al. The distribution of haemoglobin C and its prevalence in newborns in Africa. Sci Rep. (2013) 3:1671. doi: 10.1038/srep01671
7. Piel FB, Patil AP, Howes RE, Nyangiri OA, Gething PW, Dewi M, et al. Global epidemiology of sickle haemoglobin in neonates: a contemporary geostatistical model-based map and population estimates. Lancet. (2013) 381:142–51. doi: 10.1016/S0140-6736(12)61229-X
8. Lacy ME, Wellenius GA, Sumner AE, Correa A, Carnethon MR, Liem RI, et al. Association of sickle cell trait with hemoglobin A1c in African Americans. JAMA. (2017) 317:507–15. doi: 10.1001/jama.2016.21035
9. Skinner S, Diaw M, Ndour Mbaye M, Joly P, Renoux C, Masson C, et al. Evaluation of agreement between hemoglobin A1c, fasting glucose, and fructosamine in Senegalese individuals with and without sickle-cell trait. PLoS ONE. (2019) 14:e0212552. doi: 10.1371/journal.pone.0212552
10. Sumner AE, Thoreson CK, O'Connor MY, Ricks M, Chung ST, Tulloch-Reid MK, et al. Detection of abnormal glucose tolerance in Africans is improved by combining A1C with fasting glucose: the Africans in America study. Diab Care. (2015) 38:213–9. doi: 10.2337/dc14-1179
11. Kengne AP, Erasmus RT, Levitt NS, Matsha TE. Alternative indices of glucose homeostasis as biochemical diagnostic tests for abnormal glucose tolerance in an African setting. Prim Care Diab. (2017) 11:119–31. doi: 10.1016/j.pcd.2017.01.004
12. Kabakambira JD, Baker RL Jr, Briker SM, Courville AB, Mabundo LS, DuBose CW, et al. Do current guidelines for waist circumference apply to black Africans? Prediction of insulin resistance by waist circumference among Africans living in America. BMJ Glob Health. (2018) 3:e001057. doi: 10.1136/bmjgh-2018-001057
13. O'Connor MY, Thoreson CK, Ricks M, Courville AB, Thomas F, Yao J, et al. Worse cardiometabolic health in African immigrant men than African American men: reconsideration of the healthy immigrant effect. Metab Syndr Relat Disord. (2014) 12:347–53. doi: 10.1089/met.2014.0026
14. Ukegbu UJ, Castillo DC, Knight MG, Ricks M, Miller BV, 3rd, Onumah BM, Sumner AE. Metabolic syndrome does not detect metabolic risk in African men living in the U.S. Diab Care. (2011) 34:2297–99. doi: 10.2337/dc11-1055
15. Utumatwishima JN, Baker RL Jr, Bingham BA, Chung ST, Berrigan D, Sumner AE. Stress measured by allostatic load score varies by reason for immigration: the Africans in America study. J Racial Ethnic Health Dispar. (2018) 5:279–86. doi: 10.1007/s40615-017-0368-7
16. Sumner AE, Kushner H, Sherif KD, Tulenko TN, Falkner B, Marsh JB. Sex differences in African-Americans regarding sensitivity to insulin's glucoregulatory and antilipolytic actions. Diab Care. (1999) 22:71–7. doi: 10.2337/diacare.22.1.71
17. Matsuda M, DeFronzo RA. Insulin sensitivity indices obtained from oral glucose tolerance testing: comparison with the euglycemic insulin clamp. Diab Care. (1999) 22:1462–70. doi: 10.2337/diacare.22.9.1462
18. Utzschneider KM, Prigeon RL, Faulenbach MV, Tong J, Carr DB, Boyko EJ, et al. Oral disposition index predicts the development of future diabetes above and beyond fasting and 2-h glucose levels. Diab Care. (2009) 32:335–41. doi: 10.2337/dc08-1478
19. Hulman A, Witte DR, Vistisen D, Balkau B, Dekker JM, Herder C, et al. Pathophysiological characteristics underlying different glucose response curves: a latent class trajectory analysis from the prospective EGIR-RISC study. Diab Care. (2018) 41:1740–8. doi: 10.2337/dc18-0279
20. Khan KS, Chien PF. Evaluation of a clinical test. I: assessment of reliability. BJOG. (2001) 108:562–7. doi: 10.1111/j.1471-0528.2001.00150.x
21. Harris PA, Taylor R, Thielke R, Payne J, Gonzalez N, Conde JG. Research electronic data capture (REDCap)–a metadata-driven methodology and workflow process for providing translational research informatics support. J Biomed Inform. (2009) 42:377–81. doi: 10.1016/j.jbi.2008.08.010
22. NCD Risk Factor Collaboration (NCD-RisC). Effects of diabetes definition on global surveillance of diabetes prevalence and diagnosis: a pooled analysis of 96 population-based studies with 331,288 participants. Lancet Diab Endocrinol. (2015) 3:624–37.
23. Christensen DL, Witte DR, Kaduka L, Jorgensen ME, Borch-Johnsen K, Mohan V, et al. Moving to an A1C-based diagnosis of diabetes has a different impact on prevalence in different ethnic groups. Diab Care. (2010) 33:580–2. doi: 10.2337/dc09-1843
24. Dagogo-Jack S. Pitfalls in the use of HbA(1)(c) as a diagnostic test: the ethnic conundrum. Nat Rev Endocrinol. (2010) 6:589–93. doi: 10.1038/nrendo.2010.126
25. Hare MJ, Shaw JE, Zimmet PZ. Current controversies in the use of haemoglobin A1c. J Intern Med. (2012) 271:227–36. doi: 10.1111/j.1365-2796.2012.02513.x
26. Zoungas S, Arima H, Gerstein HC, Holman RR, Woodward M, Reaven P, et al. Effects of intensive glucose control on microvascular outcomes in patients with type 2 diabetes: a meta-analysis of individual participant data from randomised controlled trials. Lancet Diab Endocrinol. (2017) 5:431–7. doi: 10.1016/S2213-8587(17)30104-3
27. Ko GT, Chan JC, Woo J, Lau E, Yeung VT, Chow CC, et al. The reproducibility and usefulness of the oral glucose tolerance test in screening for diabetes and other cardiovascular risk factors. Ann Clin Biochem. (1998) 35(Pt 1):62–7. doi: 10.1177/000456329803500107
28. Knowler WC, Barrett-Connor E, Fowler SE, Hamman RF, Lachin JM, Walker EA, et al. Reduction in the incidence of type 2 diabetes with lifestyle intervention or metformin. N Engl J Med. (2002) 346:393–403. doi: 10.1056/NEJMoa012512
29. Balion CM, Raina PS, Gerstein HC, Santaguida PL, Morrison KM, Booker L, et al. Reproducibility of impaired glucose tolerance (IGT) and impaired fasting glucose (IFG) classification: a systematic review. Clin Chem Lab Med. (2007) 45:1180–5. doi: 10.1515/CCLM.2007.505
30. Creatore MI, Moineddin R, Booth G, Manuel DH, DesMeules M, McDermott S, et al. Age- and sex-related prevalence of diabetes mellitus among immigrants to Ontario, Canada. CMAJ. (2010) 182:781–9. doi: 10.1503/cmaj.091551
31. Herman WH, Cohen RM. Racial and ethnic differences in the relationship between HbA1c and blood glucose: implications for the diagnosis of diabetes. J Clin Endocrinol Metab. (2012) 97:1067–72. doi: 10.1097/01.ogx.0000419562.01729.33
32. Wang JS, Lee IT, Lee WJ, Lin SY, Fu CP, Lee WL, et al. Comparing HbA1c, fasting and 2-h plasma glucose for screening for abnormal glucose regulation in patients undergoing coronary angiography. Clin Chem Lab Med. (2015) 53:1441–9. doi: 10.1515/cclm-2014-0860
33. Sumner AE, Duong MT, Aldana PC, Ricks M, Tulloch-Reid MK, Lozier JN, et al. A1C combined with glycated albumin improves detection of prediabetes in Africans: the Africans in America study. Diab Care. (2016) 39:271–7. doi: 10.2337/dc15-1699
34. Sumner AE, Duong MT, Bingham BA, Aldana PC, Ricks M, Mabundo LS, et al. Glycated albumin identifies prediabetes not detected by hemoglobin A1c: the Africans in America study. Clin Chem. (2016) 62:1524–32. doi: 10.1373/clinchem.2016.261255
Keywords: diabetes, Africans, sickle cell trait, anemia, A1C
Citation: Briker SM, Aduwo JY, Mugeni R, Horlyck-Romanovsky MF, DuBose CW, Mabundo LS, Hormenu T, Chung ST, Ha J, Sherman A and Sumner AE (2019) A1C Underperforms as a Diagnostic Test in Africans Even in the Absence of Nutritional Deficiencies, Anemia and Hemoglobinopathies: Insight From the Africans in America Study. Front. Endocrinol. 10:533. doi: 10.3389/fendo.2019.00533
Received: 06 May 2019; Accepted: 18 July 2019;
Published: 07 August 2019.
Edited by:
Solomon Tesfaye, Sheffield Teaching Hospitals NHS Foundation Trust, United KingdomReviewed by:
Jan Brož, Second Faculty of Medicine, Charles University, CzechiaJoseph Aloi, Wake Forest Baptist Medical Center, United States
Copyright © 2019 Briker, Aduwo, Mugeni, Horlyck-Romanovsky, DuBose, Mabundo, Hormenu, Chung, Ha, Sherman and Sumner. This is an open-access article distributed under the terms of the Creative Commons Attribution License (CC BY). The use, distribution or reproduction in other forums is permitted, provided the original author(s) and the copyright owner(s) are credited and that the original publication in this journal is cited, in accordance with accepted academic practice. No use, distribution or reproduction is permitted which does not comply with these terms.
*Correspondence: Anne E. Sumner, YW5uZXNAbWFpbC5uaWguZ292