 Linda Yip
 Rebecca Fuhlbrigge
 C. Garrison Fathman
- Division of Immunology and Rheumatology, Department of Medicine, Stanford University, Stanford, CA, United States
Type 1 Diabetes (T1D) occurs as a result of the autoimmune destruction of pancreatic β-cells by self-reactive T cells. The etiology of this disease is complex and difficult to study due to a lack of disease-relevant tissues from pre-diabetic individuals. In this study, we performed gene expression analysis on human pancreas tissues obtained from the Network of Pancreatic Organ Donors with Diabetes (nPOD), and showed that 155 genes were differentially expressed by ≥2-fold in the pancreata of autoantibody-positive (AA+) at-risk individuals compared to healthy controls. Only 48 of these genes remained changed by ≥2-fold in the pancreata of established T1D patients. Pathway analysis of these genes showed a significant association with various immune pathways. We were able to validate the differential expression of eight disease-relevant genes by QPCR analysis: A significant upregulation of CADM2, and downregulation of TRPM5, CRH, PDK4, ANGPL4, CLEC4D, RSG16, and FCGR2B was confirmed in the pancreata of AA+ individuals versus controls. Studies have already implicated FCGR2B in the pathogenesis of disease in non-obese diabetic (NOD) mice. Here we showed that CADM2, TRPM5, PDK4, and ANGPL4 were similarly changed in the pancreata of pre-diabetic 12-week-old NOD mice compared to NOD.B10 controls, suggesting a possible role for these genes in the pathogenesis of both T1D and NOD disease. The loss of the leukocyte-specific gene, FCGR2B, in the pancreata of AA+ individuals, is particularly interesting, as it may serve as a potential whole blood biomarker of disease progression. To test this, we quantified FCGR2B expression in peripheral blood samples of T1D patients, and AA+ and AA- first-degree relatives of T1D patients enrolled in the TrialNet Pathway to Prevention study. We showed that FCGR2B was significantly reduced in the peripheral blood of AA+ individuals compared to AA- controls. Together, these findings demonstrate that gene expression analysis of pancreatic tissue and peripheral blood samples can be used to identify disease-relevant genes and pathways and potential biomarkers of disease progression in T1D.
Introduction
Type 1 Diabetes (T1D) results from the autoimmune and chronic destruction of pancreatic β-cells by self-reactive T cells. It is the most common autoimmune disease in children, affecting approximately 1 in 500 in the United States, and the incidence is growing each year (1). The etiology of this disease is complex, and involves a strong genetic component and a number of possible environmental triggers. Genome-wide association studies (GWAS) have identified >60 polymorphisms that contribute to the genetic susceptibility of T1D (2, 3) and various environmental triggers have been shown to play a role in disease onset (4–6). The pathogenesis of this disease, however, remains unclear due to the difficulty in identifying pre-diabetic individuals and in obtaining biological specimens from such individuals.
Animal models of T1D have been crucial in understanding the mechanisms involved in the pathogenesis of T1D, but there are notable differences in human disease development. In humans, β-cell destruction occurs months to years before the onset of hyperglycemia. Individuals are asymptomatic, and develop autoantibodies (AAs) against various islet antigens including glutamic acid decarboxylase (GAD), zinc transporter 8 (ZnT8), insulin, and islet antigen 2 (IA-2) during the pre-hyperglycemic stage of disease. The presence and number of AAs detected in the serum is currently the most reliable biomarker for assessing the disease risk. However, there is a need for additional early, robust and reproducible biomarkers of disease progression.
The pancreata of at-risk AA+ individuals are significantly smaller than those of healthy individuals (7, 8), and analysis of pancreas sections demonstrate increased CD4+ and CD11c+ immune cell infiltration in the exocrine pancreas of these individuals (9). The islets of at-risk individuals differ functionally and morphologically from healthy controls (10), but insulitis is only detected in a small percentage of AA+ individuals (11, 12). In contrast, the islets of non-obese diabetic (NOD) mice, a well-established mouse model of T1D, develop large peri-insulitic lesions beginning at 4 weeks of age. Destructive insulitis occurs at ~12 weeks of age, and hyperglycemia follows at ~16 to 25 weeks of age (13).
We and others have shown that the pancreata and islets of rodent models of T1D differ from those of healthy controls, and that these differences are reflected in the gene expression profile during the progression of disease (13–15). Gene expression data support the upregulation of glucagon and insulin secretion, β-cell hyperactivation and/or ER stress playing a role during different stages of disease development (13–15). Currently, it is unclear if similar changes in gene expression are observed in the pancreata of pre-diabetic humans after seroconversion preceding hyperglycemia.
Human pancreatic tissues from healthy controls, AA+ and T1D patients are available through the Juvenile Diabetes Research Foundation Network for Pancreatic Organ Donors with Diabetes (JDRF nPOD; www.jdrfnpod.org). These samples are collected from deceased donors and processed under well-defined standard operating procedures. However, due to the high level of pancreatic ribonucleases and tissue recovery time, RNA degradation occurs (16–18). Nevertheless, studies have shown that the impact of RNA degradation on the assessment of gene expression by microarray analysis is minimal, and largely offset by biological differences between samples (19).
In this study, we obtained pancreas samples of at-risk AA+ individuals, T1D patients, and healthy controls from nPOD and performed gene expression analyses. We then compared the genes that were differentially expressed in pre-diabetic AA+ individuals with those that were differentially expressed in the pancreata of NOD mice. The overlapping genes may be pathogenic and play a role in the development of T1D and NOD disease. We identified a number of biologically relevant genes that were changed in the pancreata of AA+ individuals. One gene, in particular, is expressed in leukocytes and could serve as a potential biomarker of disease progression that may be monitored in blood samples of individuals with a genetic risk for developing T1D. This gene, FCGR2B, encodes the CD32B receptor, an inhibitory low affinity receptor for the Fc region of IgG complexes (20, 21). Changes to FCGR2B/CD32B expression have been associated with multiple autoimmune diseases in humans (22–25), and have been suggested to underlie the autoimmune susceptibility of several strains of mice, including NOD mice (26, 27).
In this study, we also examined the potential of FCGR2B as a candidate biomarker of disease progression, by comparing FCGR2B expression in peripheral blood RNA samples of T1D patients, AA+ individuals who later developed T1D (AA+ progressors), and AA- first-degree relatives of T1D patients (AA- FDRs) obtained from the National Institute of Health TrialNet repository.
Materials and Methods
Human Samples
Pancreas
Human pancreas samples were obtained through the JDRF network for Pancreatic Organ Donors with Diabetes (nPOD). Patient information for the final samples used for this study is shown on Tables 1A and B, and standard operating procedures for tissue processing are available at https://www.jdrfnpod.org/for-investigators/standard-operating-procedures/. Tissues were obtained from cadaveric donors that died of various causes, and AA+ individuals were identified by autoantibody screening after death. Thus, the length of islet autoimmunity in AA+ individuals is unknown. The pancreatic tissues used for this study were minced, placed in cryovials containing RNAlater, incubated at room temperature for 15 min and then snap frozen and stored at -80°C until shipment. RNA was extracted as described below.
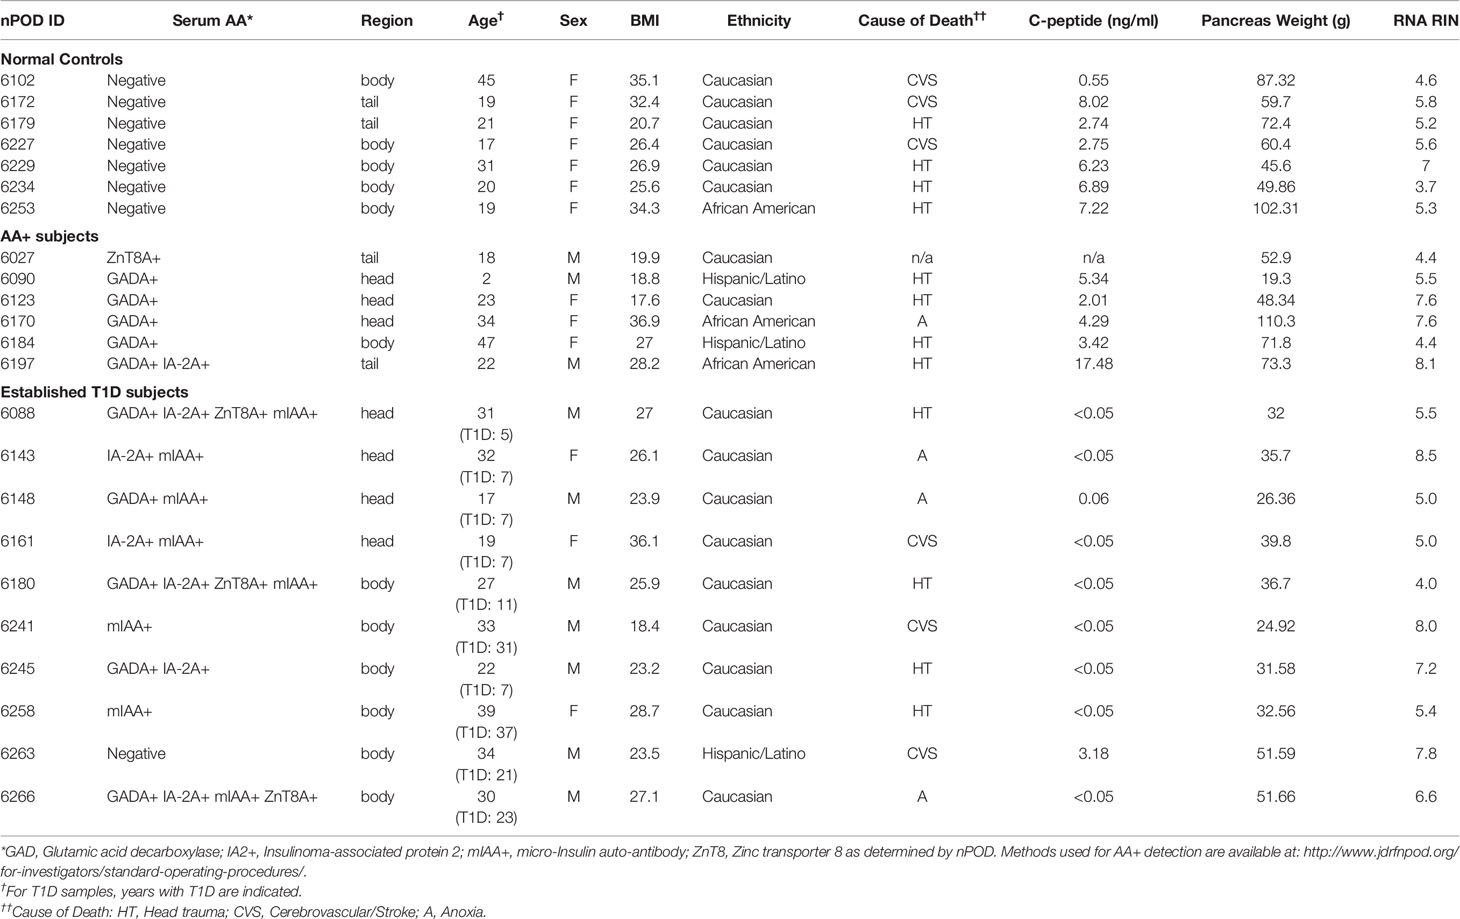
Table 1A Patient information for nPOD pancreata samples.
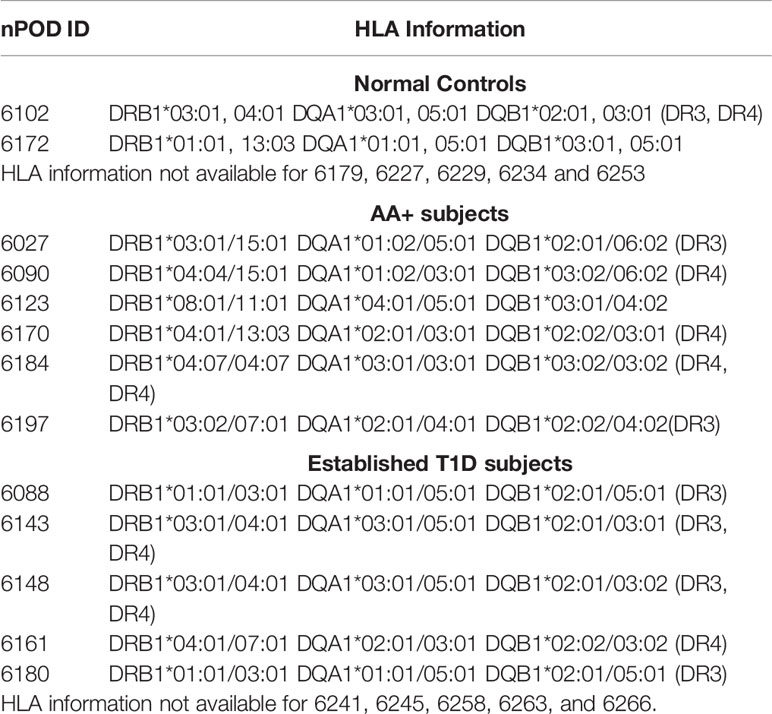
Table 1B HLA Information for nPOD pancreata samples.
Whole Blood Samples
Whole blood RNA samples were provided by TrialNet. Samples from AA- FDRs (n=15) and AA+ FDRs who later progressed to hyperglycemia (AA+ progressors, n=20) were from individuals enrolled in the TrialNet Pathway to Prevention Study. Samples from T1D patients (n=10) were obtained from individuals enrolled in the Glutamic Acid Decarboxylase (GAD) Vaccine trial. IRB approval was obtained at the institution where samples were collected. All participants provided written informed consent. Before use, all RNA samples were repurified using the Qiagen RNeasy mini kit. Briefly, 100 μl of RNA (<100 μg) was combined with 350 μl of buffer RLT, mixed, added to 250 μl ethanol, and applied to a RNeasy mini column to bind the RNA. The RNA was washed and eluted according to manufacturer’s instructions. Re-extracted RNA concentrations were measured by Nanodrop and RNA quality was determined by Bioanalyzer analysis (Agilent) and listed in Table 2.
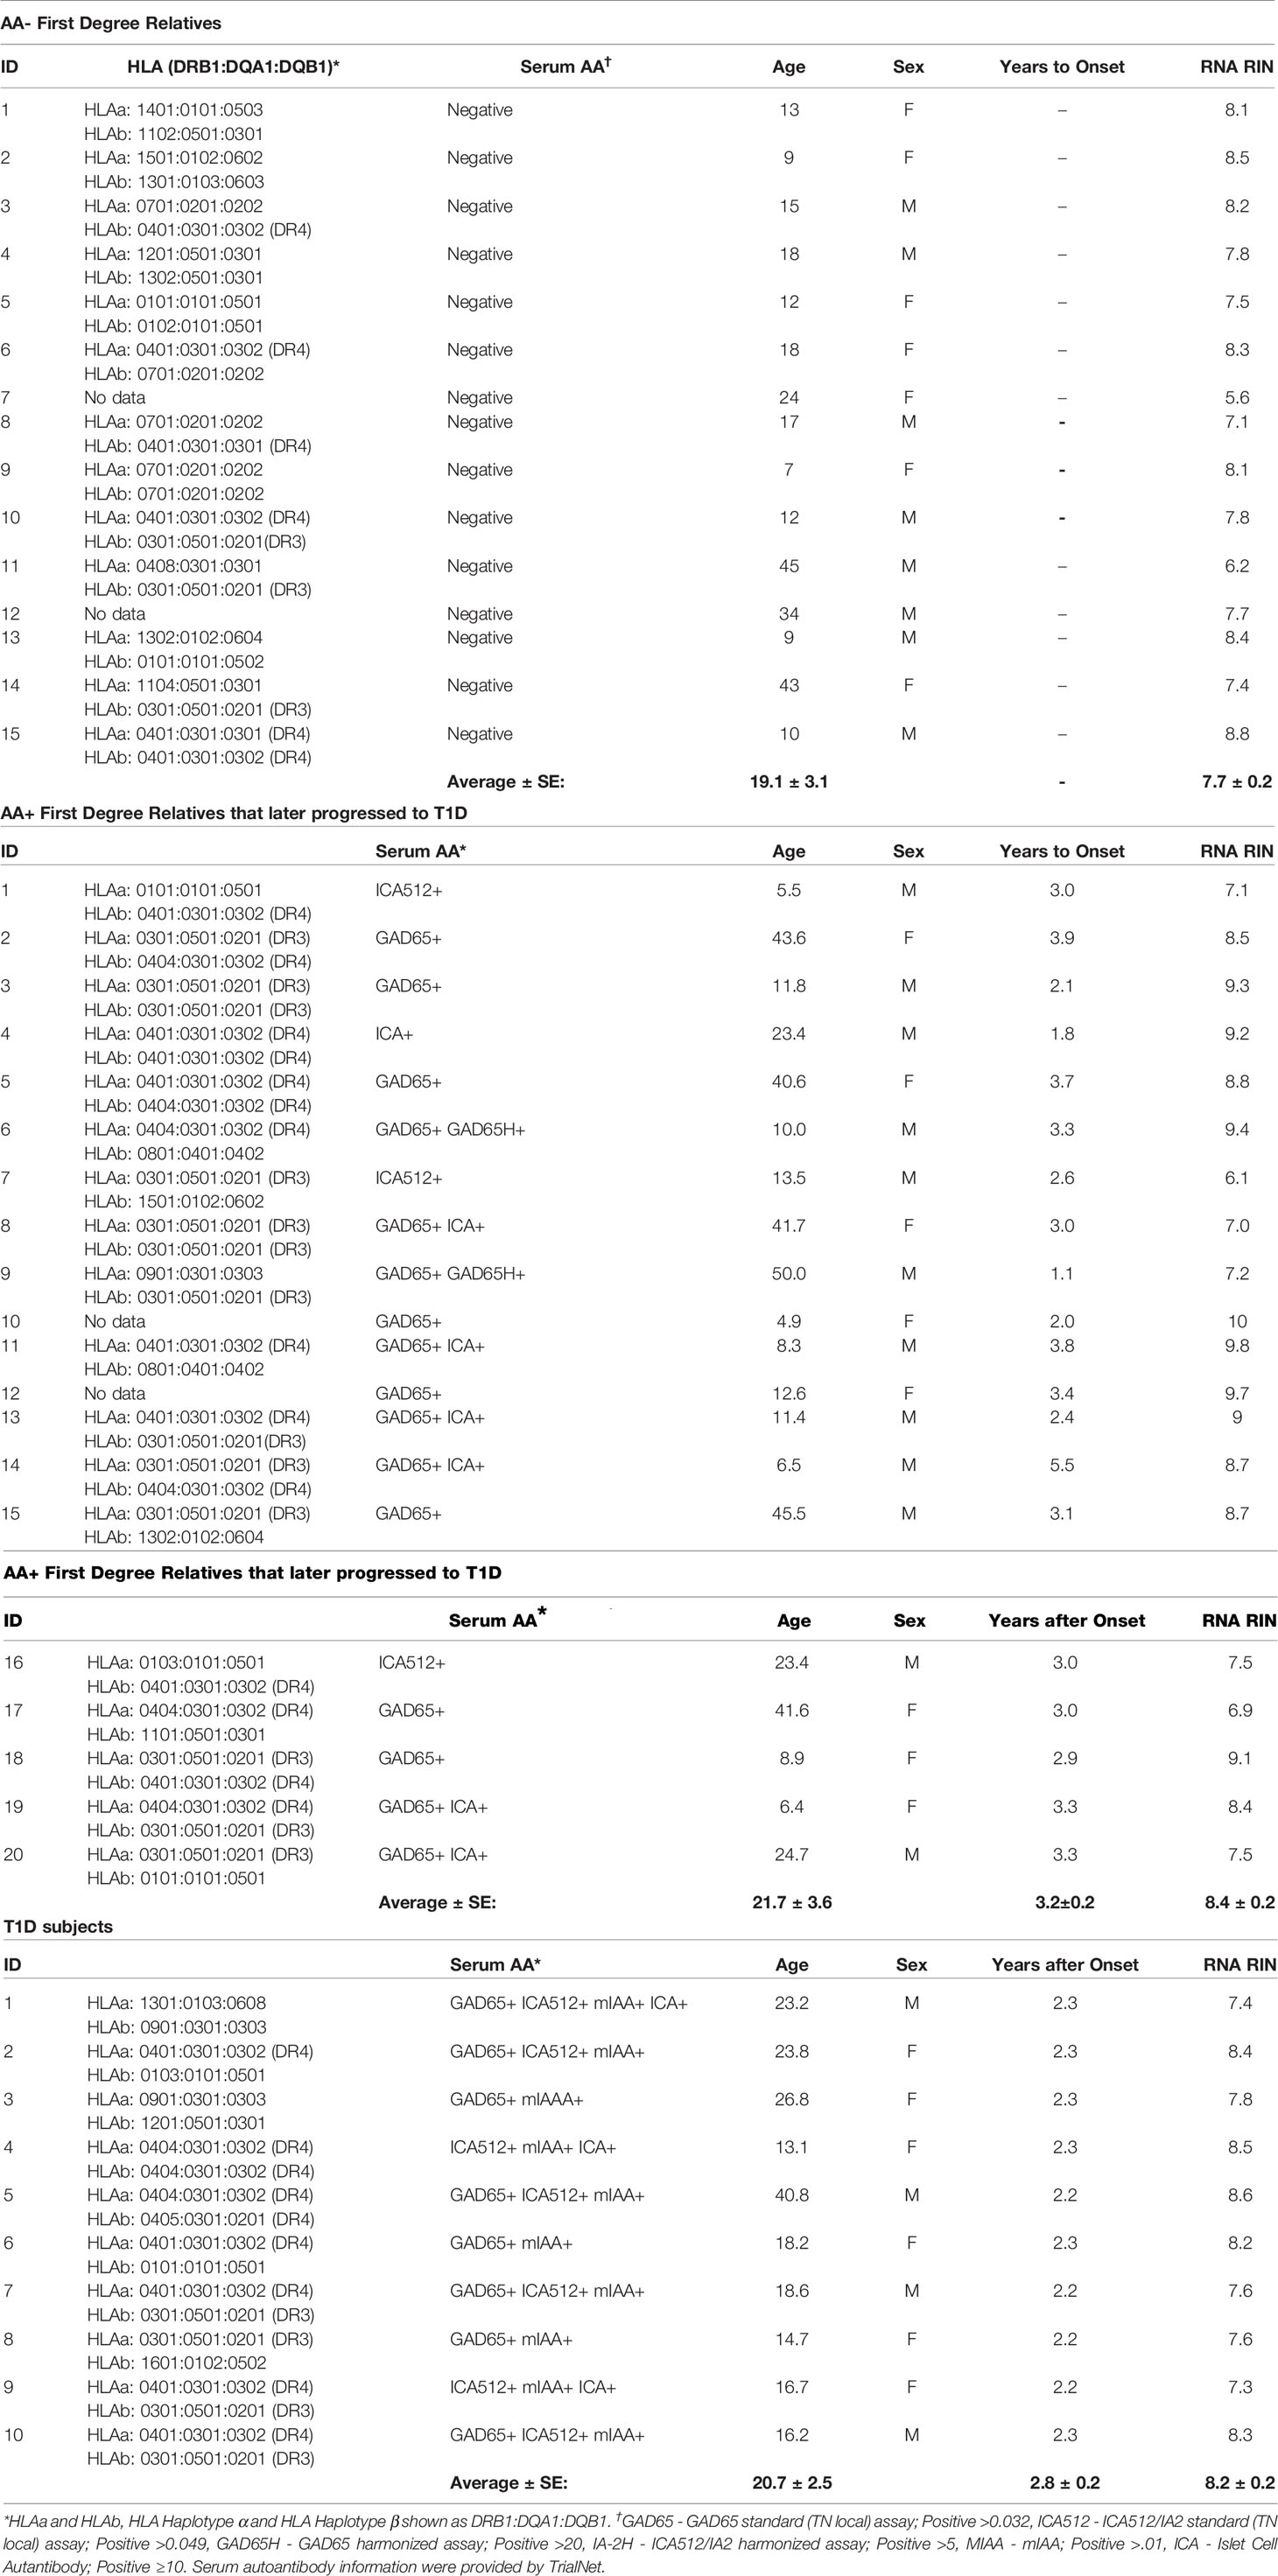
Table 2 Patient information for TrialNet whole blood RNA samples.
Animals
Female NOD/LtJ (NOD) and NOD.B10Sn-H2b/J (NOD.B10) mice were purchased from Jackson Laboratories (Bar Harbor, ME). Animals were maintained under pathogen-free conditions at the Stanford School of Medicine Animal facility, according to institutional guidelines under approved protocols. Pancreas tissues were isolated from 12-week-old NOD and NOD.B10 mice (8 animals per group) and immediately homogenized in Trizol reagent on ice, and stored at -80°C. RNA was extracted as described below. See Supplementary Figure 1 for blood glucose levels, weight of mice, and bioanalyzer traces of RNA samples.
RNA Extraction From Pancreas Tissue
Total RNA was extracted using Trizol reagent and the Qiagen RNeasy mini kit, as previously described (28, 29). For human pancreas tissues, RNA was extracted from at least 14 samples per group (controls, AA+ and T1D). Pancreatic samples were thawed on ice, removed from RNAlater, and homogenized in Trizol reagent (100 mg tissue/ml Trizol) on ice. For human and NOD mouse samples, RNA was extracted from 1 ml of the tissue/Trizol homogenate. 0.2 ml chloroform was added to the homogenate, shaken vigorously and centrifuged at 12,000xg for 15 min at 4°C. The aqueous phase was removed, mixed with an equal volume of 70% ethanol and bound to a Qiagen RNeasy mini-column. The column was washed and RNA was eluted according to manufacturer’s instructions. Total RNA concentrations were measured by Nanodrop and quality was determined by Bioanalyzer analysis (Agilent Technologies, Santa Clara, CA). Bioanalyzer traces for human and mouse samples are shown in Figure 1 and Supplementary Figure 1, respectively. The human samples with the highest RNA integrity numbers (RIN; n≥6 per group) were selected for gene expression analysis studies.
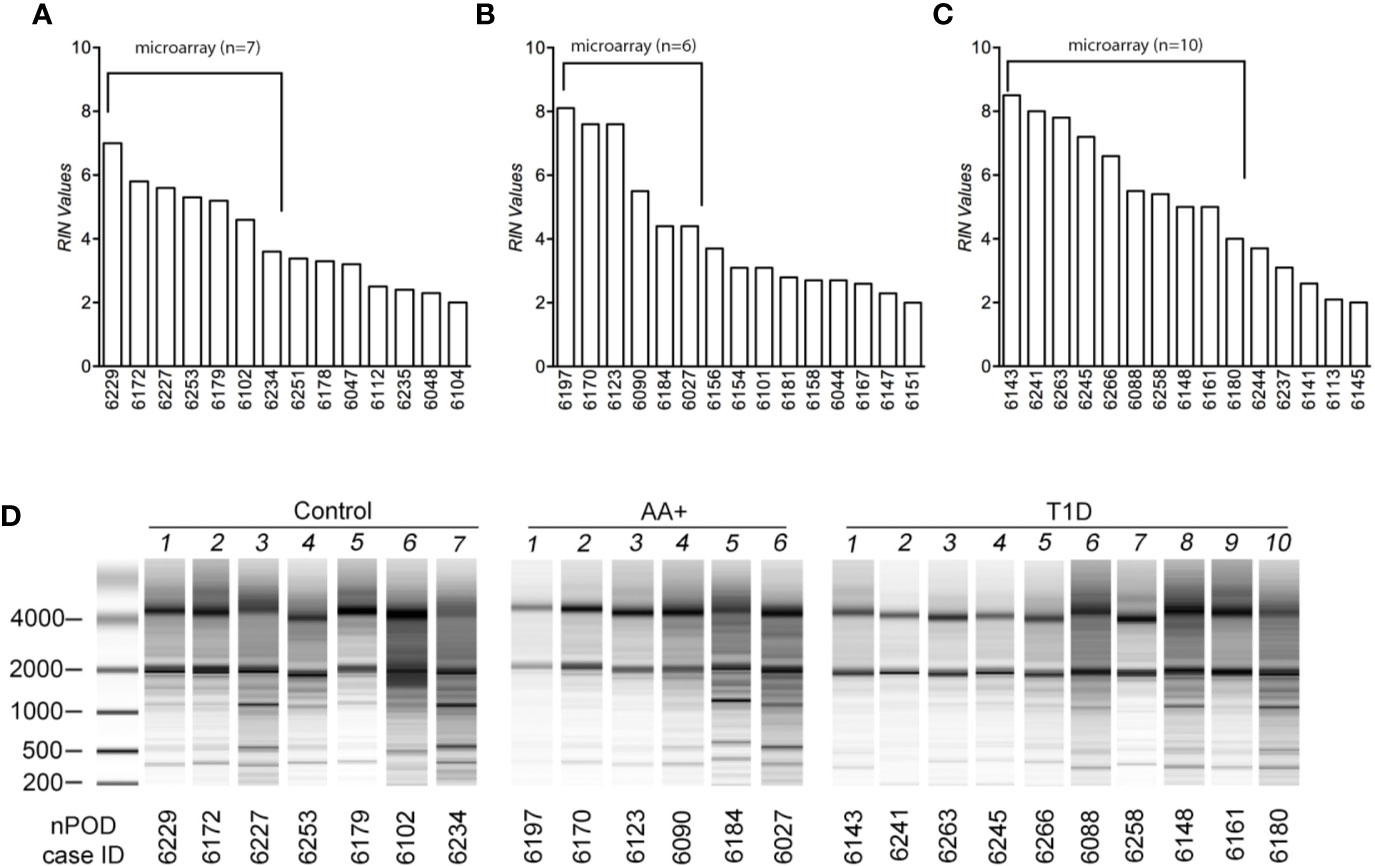
Figure 1 Assessment of RNA quality of samples extracted from human pancreatic tissues. RNA was isolated from pancreatic tissues of controls (A), AA+ individuals (B), and T1D patients (C) obtained from nPOD, and bioanalyzer analysis was performed to assess RNA quality. RIN (RNA integrity numbers) values (A–C) and bioanalyzer traces (D) are shown. The samples with the highest RIN values were used for microarray analysis (as indicated).
Microarray Analysis
Human Samples
One-color microarrays were performed by the Stanford Human Immune Monitoring Center to measure gene expression in individual pancreas samples of seven controls, six AA+, and 10 T1D patients (Table 1) using the SurePrint G3 Human GE 8x60K microarray kit (Agilent Technologies). One microgram of total RNA was labeled with Cy3 using the low RNA input fluorescence linear amplification kit (Agilent Technologies). Hybridization was performed using the gene expression hybridization kit (Agilent Technologies) and the microarray hybridization chamber (Agilent Technologies), according to the manufacturer. Microarray chips were scanned using the DNA microarray scanner (Agilent Technologies) and data were processed with Feature Extraction Software (Agilent Technologies), and analyzed using GeneSpring GX 12.6.1 Software (Agilent Technologies). All microarray data have been submitted to the Gene Expression Omnibus (GEO) Database at NCBI (GEO series accession number: GSE72492), and are accessible at: http://www.ncbi.nlm.nih.gov/geo/query/acc.cgi?acc=GSE72492. Samples were filtered for entities that were detected in at least six out of 23 samples, and entities with annotated gene symbols. Because of the gender imbalance between the groups, genes that were significantly changed by ≥5 fold between male and female subjects were removed from the analysis (Supplementary Table 1). A final list of 29,438 entities was used for further analysis. Moderated T-tests were performed to identify differentially expressed genes (p<0.05), and pathway analysis of differentially expressed genes was performed using Ingenuity Pathway Analysis (IPA; Qiagen Inc; https://www.qiagenbioinformatics.com/products/ingenuitypathway-analysis).
Mouse Samples
Two-color microarrays were performed to measure gene expression in the pancreas of individual 12-week-old NOD mice against a pool of age-matched NOD.B10 mice (n=8 animals per group) using the Whole Mouse Genome Microarray Kit, 4×44K 2-color arrays (Agilent Technologies) as previously described (29). Data were analyzed using GeneSpring (version 12.6.1, Agilent Technologies). Samples were filtered for entities with annotated gene symbols that are expressed (minimum raw expression ≥ 25) in at least four of the eight NOD samples, have equivalent human homologues, and are expressed in the human pancreas samples. The resultant 25,283 entities were analyzed. Data are available at GEO (Series accession number: GSE154739, http://www.ncbi.nlm.nih.gov/geo/query/acc.cgi?acc=GSE154739). T-test and Benjamini-Hochberg multiple testing correction were performed to identify differentially expressed genes in the pancreata of NOD vs. NOD.B10 mice with a fold change ≥2-fold (corrected p<0.01).
Validation by QPCR
We identified a number of biologically relevant genes among those that were changed in the pancreata of AA+ individuals vs. controls. These include genes that have previously been associated with T1D, T2D, metabolism or obesity, and genes with biological functions that may be involved in the pathogenesis of T1D. These genes and their significance are listed in Table 3.
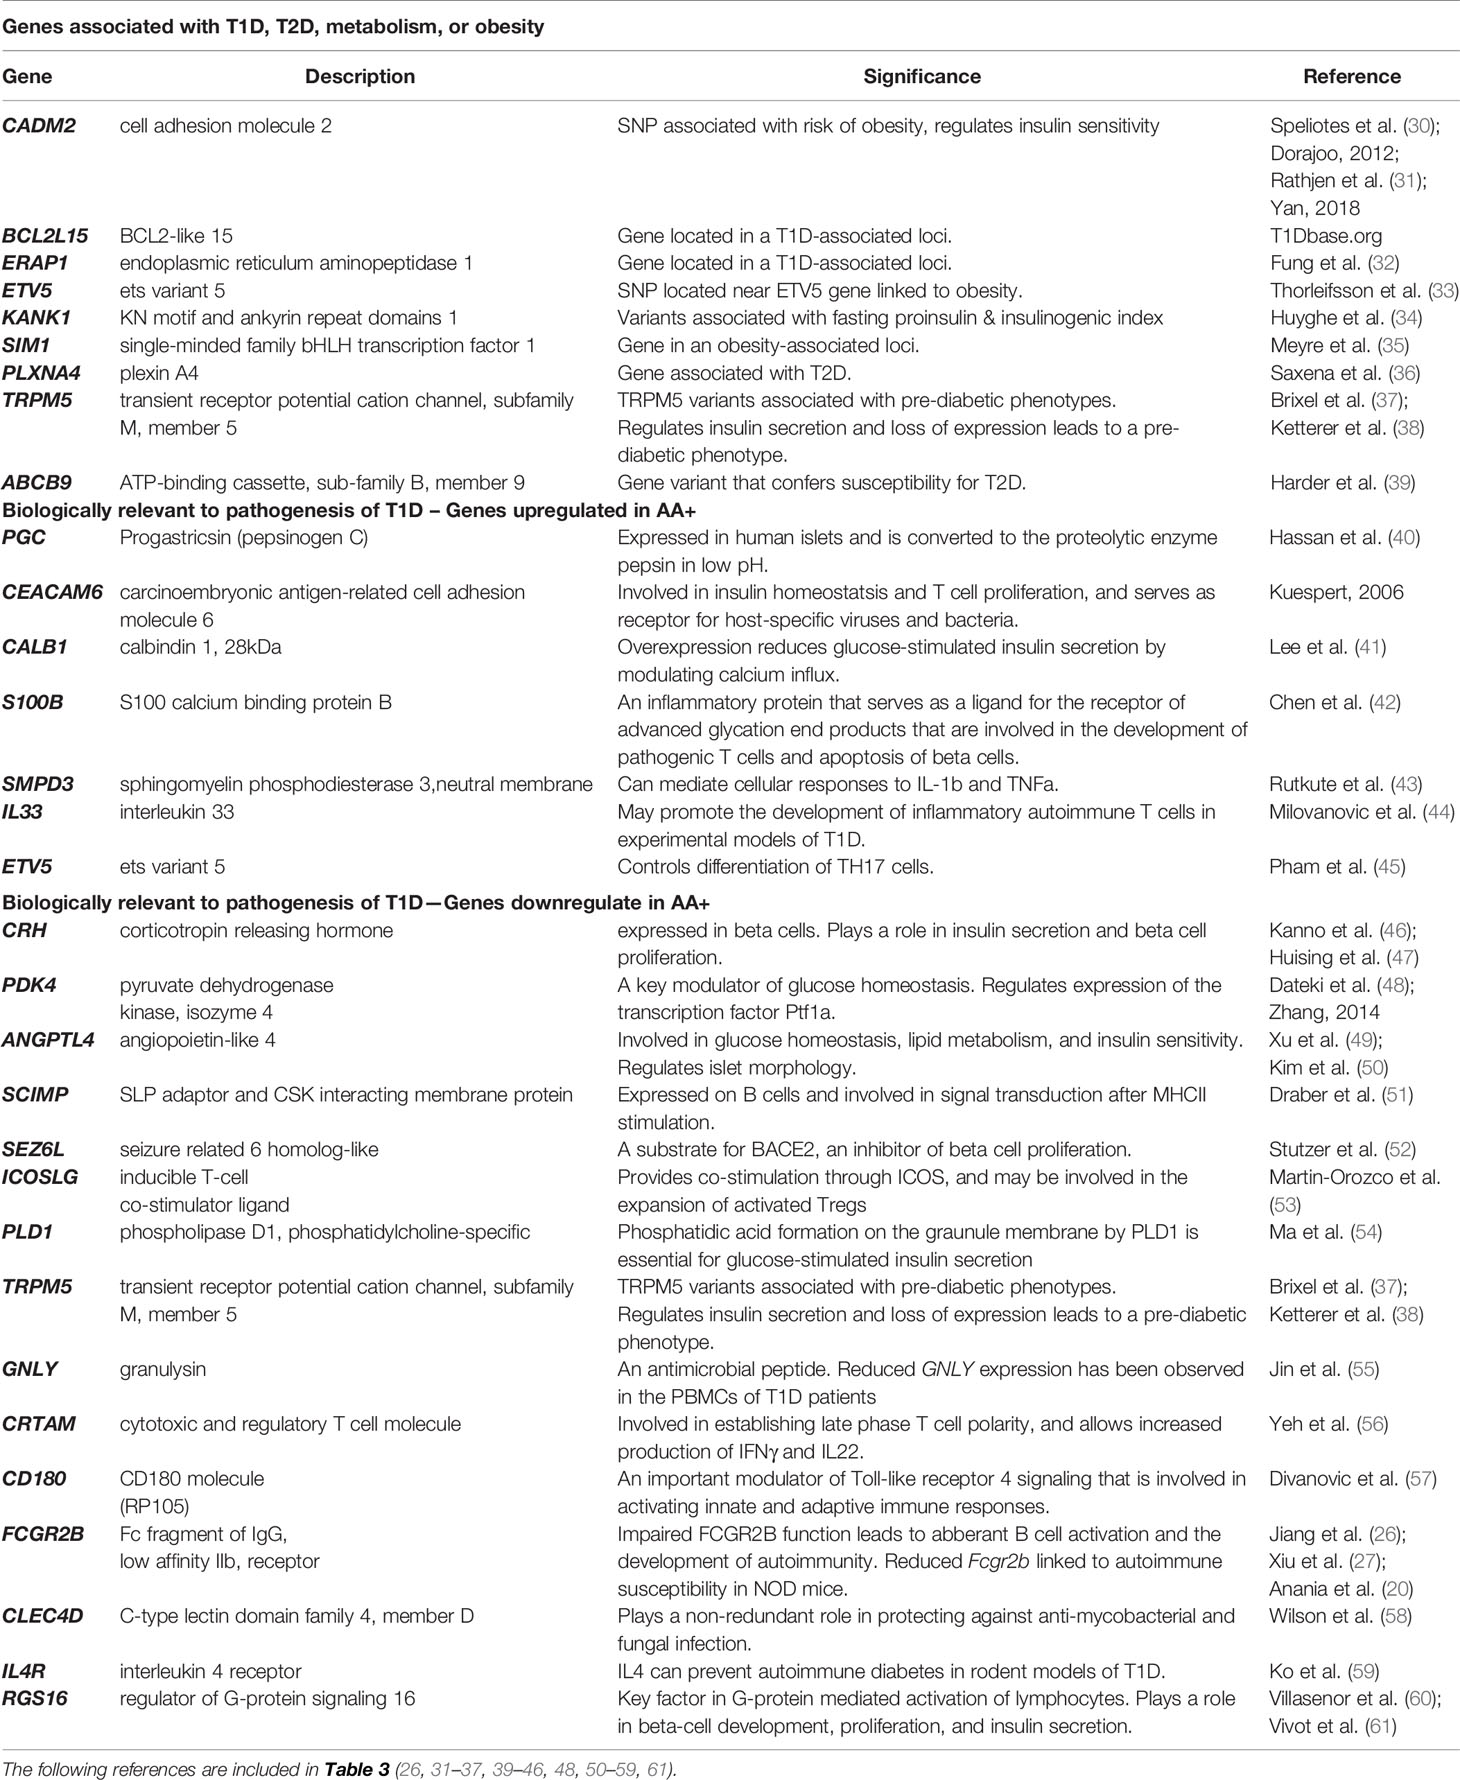
Table 3 Biologically relevant genes that are significantly changed in the pancreata of AA+ vs. control (Microarray experiments).
QPCR was performed to validate differential gene expression. cDNA was synthesized and QPCR was performed as previously described (28, 29). Briefly, first strand cDNA was generated from 1 μg of total RNA using Superscript III (Invitrogen) and random hexamers according to manufacturer’s instructions. QPCR was performed to measure human INS, BCL2L15, ERAP1, CADM2, ERAP1, ETV5, KANK1, SIM1, ABCB9, PGC, CEACAM6, CALB1, S100B, SMPD3, IL33, SCIMP, SEZ6L, PLD1, GNLY, CRTAM, CD180, IL4R, PLXNA4, PDK4, FCGR2B, TRPM5, CRH, ANGPTL4, CLEC4D, RGS16, ICOSLG, CD19, CD20, CD11C, and housekeeping genes GAPDH, ACTB, B2M, and 18S rRNA using commercially available Taqman gene expression assays (Applied Biosystems). cDNA was preamplified using the Taqman PreAmp Mastermix (Applied Biosystems) prior to QPCR for measurements that initially gave threshold cycle (Ct) values of >30. The 7900HT Fast Real Time PCR System (Applied Biosystems) and the Taqman Gene Expression Mastermix (Applied Biosystems) were used, according to manufacturer’s instructions. The comparative Ct method for relative quantification (ΔΔCt) was used. QPCR was also performed to measure the expression of FCGR2B, CD19, CD20, CD11C, and ACTB in whole blood RNA samples obtained from TrialNet. For these experiments, cDNA was synthesized (from 100 ng of total RNA) and QPCR was performed to described above.
Statistical Analysis
Statistical analyses for QPCR experiments were performed using the two-tailed Mann-Whitney test (Prism 8, GraphPad Software Inc. San Diego, CA). A P-value of ≤0.05 was considered significant.
Results
Gene Expression Analysis in Human Pancreata Samples
Total RNA was initially isolated from ≥14 subjects per group (healthy controls, AA+ and T1D subjects). Bioanalyzer analysis showed considerable RNA degradation in some samples, with RIN (RNA integrity number) values ranging from 2.0 to 8.5 (Table 1, Figure 1). The majority of samples had a RIN ≥5, and samples with RIN values of ≥3.7 were used for microarray analysis (n=7 controls, 6 AA+, and 10 T1D samples). Microarray and QPCR results showed that the expression of housekeeping genes ACTB, GAPDH did not significantly differ between groups and did not strongly correlate with RIN values (Figure 2). As expected, INS (Insulin) expression was found to be significantly reduced in the pancreata of T1D patients compared to controls, and pre-diabetic AA+ individuals (Figure 2).
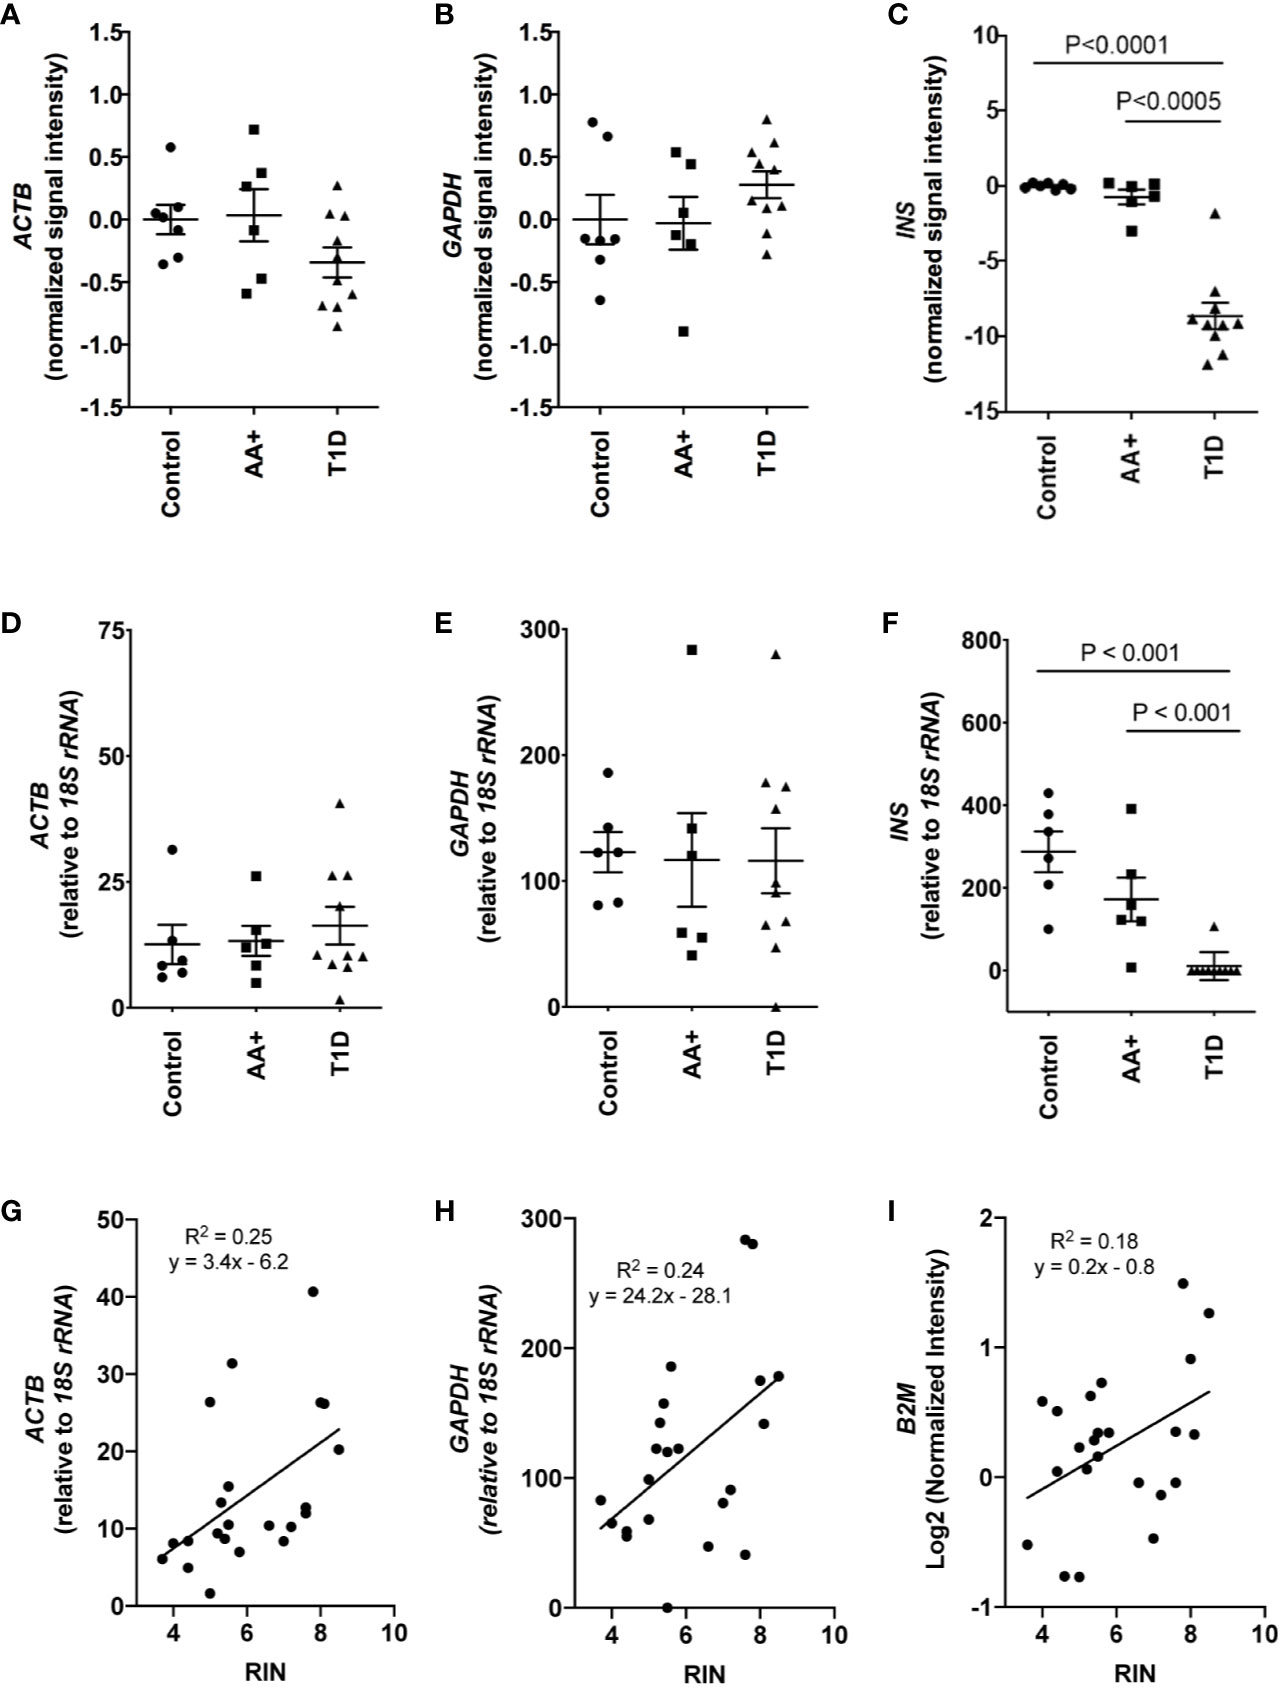
Figure 2 Comparison of house-keeping gene and INS expression in control, AA+ and T1D samples. (A–C) Microarray data showing the normalized signal intensity for ACTB (A), GAPDH (B) and INS (C) in individual control, AA+ and T1D samples. No difference in ACTB and GAPDH expression was observed between groups. INS expression was significantly lower in T1D patients. (D–F) QPCR analysis showing similar data for ACTB (D), GAPDH (E), and INS (F) expression. (G–I) Graphs showing the expression of house-keeping genes ACTB, GAPDH, and B2M against RIN values. Statistical analysis was performed using the Moderated T-test (panel A-C) or the two-tailed Mann-Whitney test (Panel D–F).
Microarray analysis was performed on 29,168 entities representing 20,813 genes that were expressed in at least six of the 23 human pancreata. Because of the gender imbalance between groups, we eliminated genes from our analysis that were significantly changed by >5-fold in male vs. female subjects (Supplementary Table 1). The expression of certain genes, however, may still be influenced by age or sex.
We showed that 155 genes (59 upregulated and 96 downregulated) were changed by ≥2-fold in the pancreata of AA+ compared to controls (Figure 3A; Supplementary Table 2), and 645 genes (252 genes upregulated and 395 downregulated) were changed by ≥2-fold in the pancreata of T1D patients compared to controls (Supplementary Table 3). Among the 155 genes changed by ≥2-fold in the pancreata of AA+ individuals (Figure 3A), 48 genes were similarly and significantly changed by ≥2-fold in T1D patients (Figure 3B), 19 were significantly changed by <2-fold in T1D patients (Figure 3C), and 88 were not significantly changed in T1D patients (Figure 3D). Another 28 genes were found to be significantly changed by 1.5 to 2-fold in AA+ vs. controls, but >2-fold in T1D vs. controls (Figure 3E). These data indicate that 107 genes may be transiently changed after seroconversion, but no longer changed after the establishment of hyperglycemia, while 76 genes may be changed after seroconversion and during T1D. Heatmaps of gene expression for the 183 genes (represented in Figures 3A, E) are shown in Figure 3F (upregulated genes) and Figure 3G (downregulated genes).
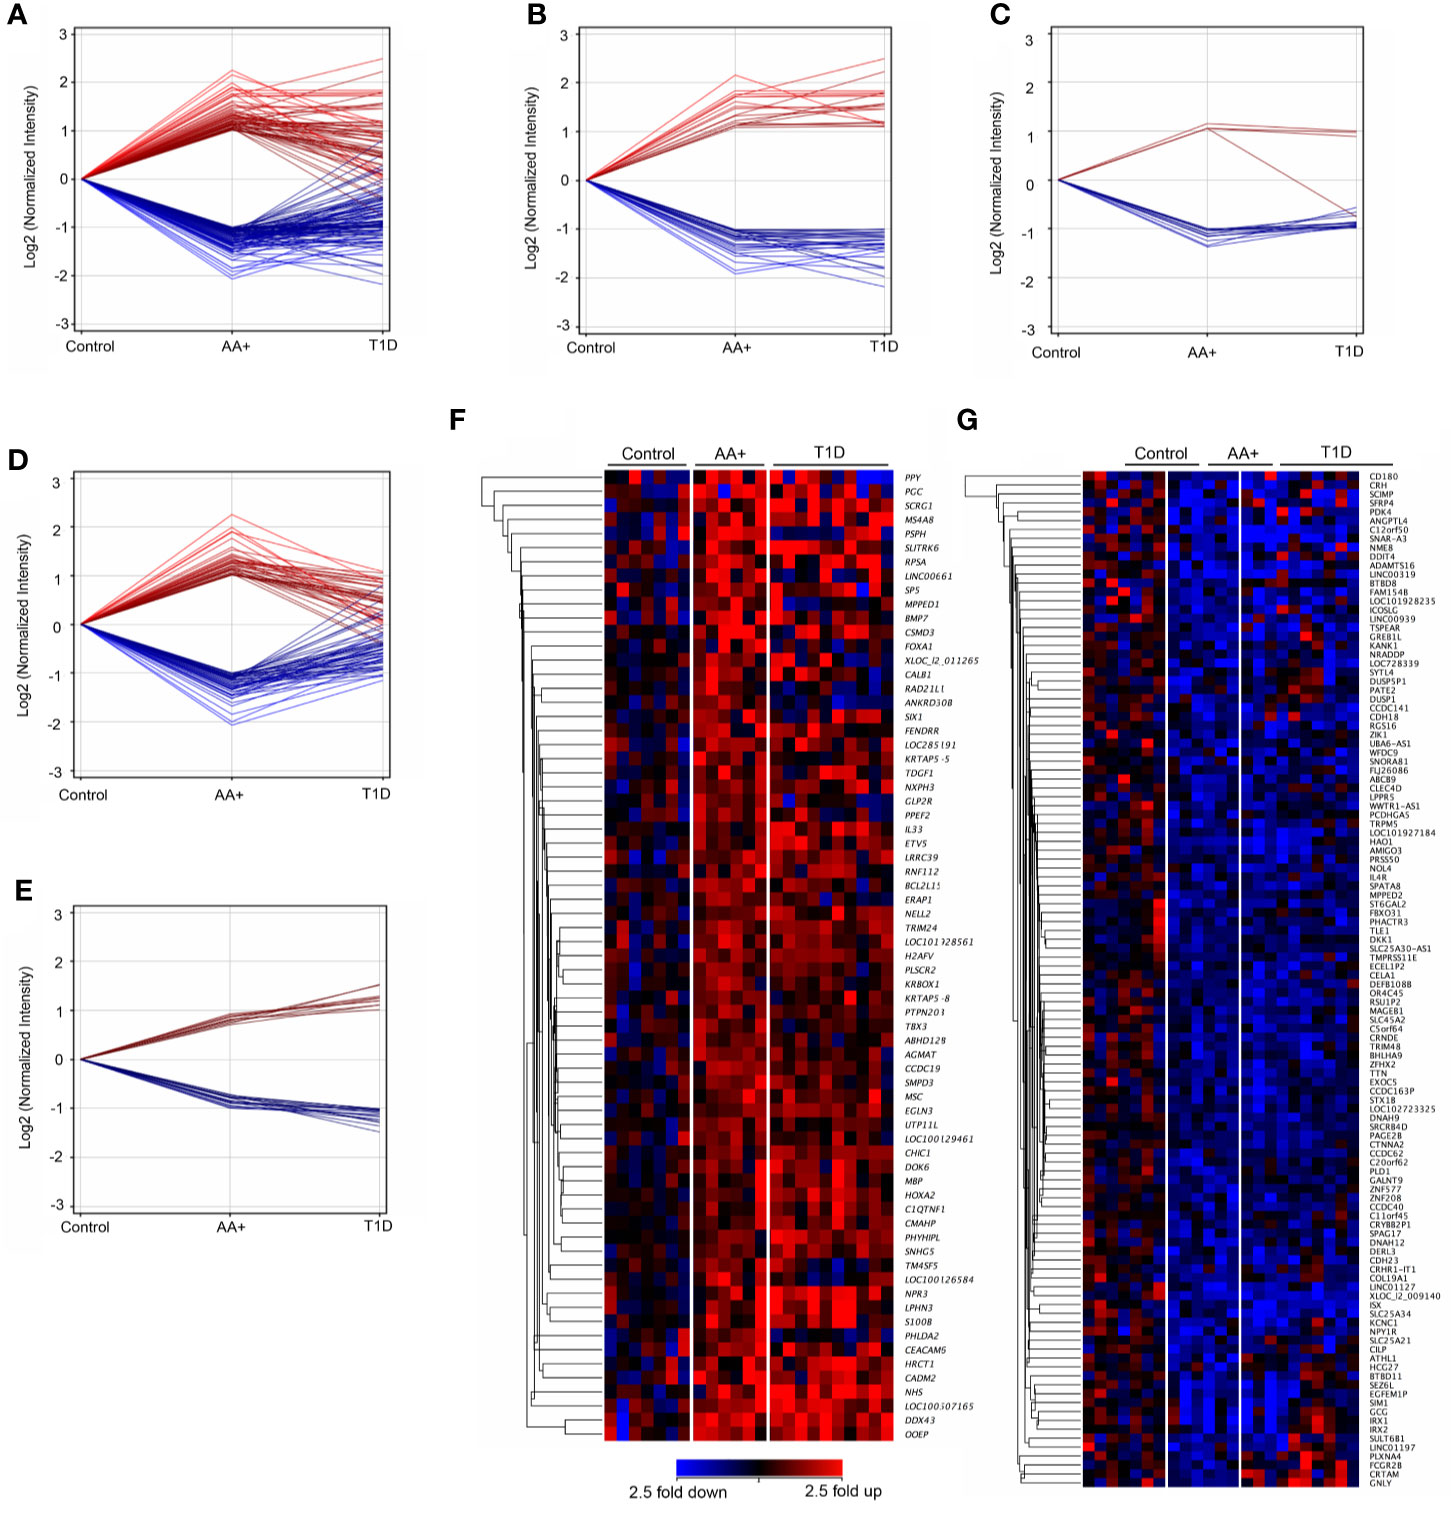
Figure 3 Differentially expressed genes in the pancreata of AA+ individuals compared to controls. 155 genes (59 upregulated and 96 downregulated) were significantly changed by at least 2-fold in the pancreata of AA+ individuals vs. controls (A). Among these, 48 were changed by >2-fold (B), 19 were changed by <2-fold (C), and 88 were unchanged (D) in the pancreata of T1D patients vs. controls. An additional 28 genes were significantly changed by 1.5 to 2-fold in AA+ vs. controls and >2-fold in T1D vs. controls (E). Gene expression heatmaps of the upregulated (F) and downregulated (G) genes from panels A and E are shown. These genes were further analyzed for biological function (See Supplementary Table 2 and Table 3).
Pathway Analysis of Differentially Expressed Genes in At-Risk AA+ vs. Controls
IPA pathway analysis was performed on the 183 genes that are differentially expressed in the pancreata of AA+ individuals compared to controls. A significant association of genes with various immune response functions was observed (Table 4A), with the strongest association seen with “function of helper T lymphocytes” (p = 1.93x10⁻⁶). Upstream regulator analysis using IPA identified several cytokines including IL-1β that may drive the observed changes in gene expression (Table 4B). The top upstream regulator was found to be CNR1 (canniboid receptor 1, also known as the CB1 receptor; p<2.55 x 10⁻⁵), a receptor that has been linked to β-cell dysfunction and islet inflammation (62).
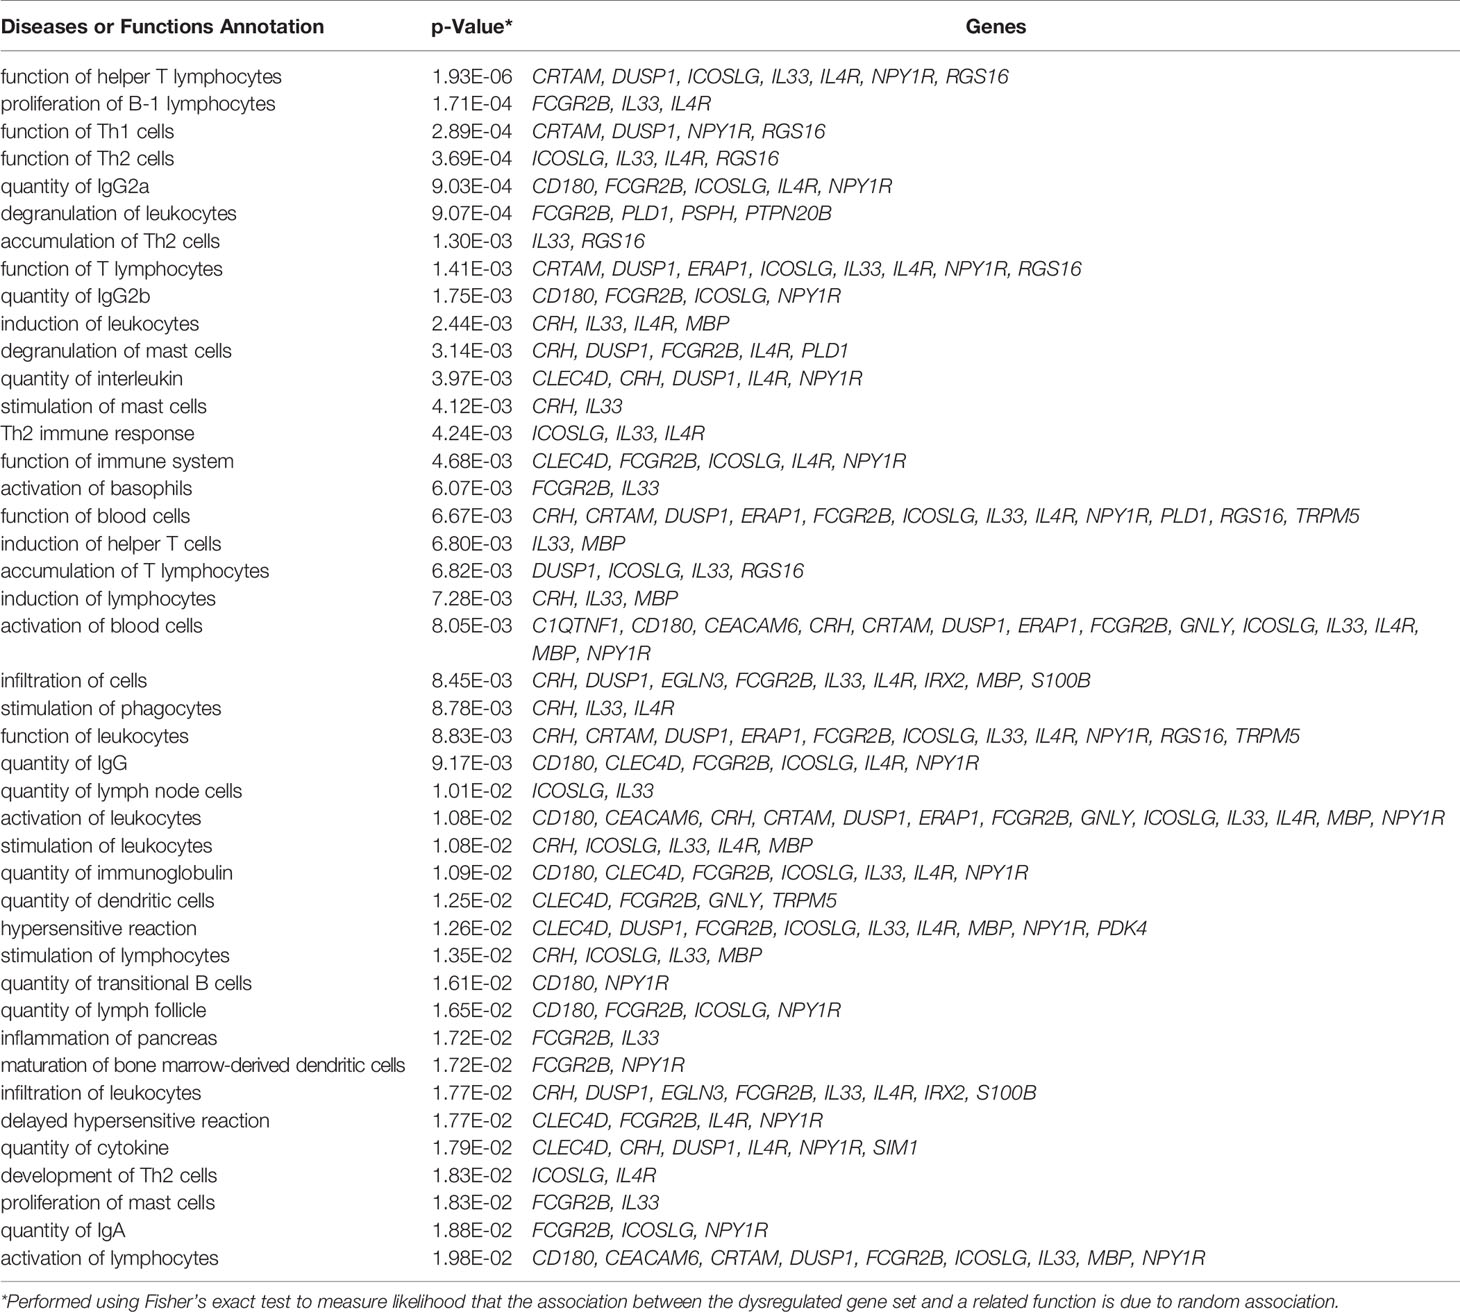
Table 4A Immune functions associated with differentially expressed genes in AA+ vs. control identified by IPA.
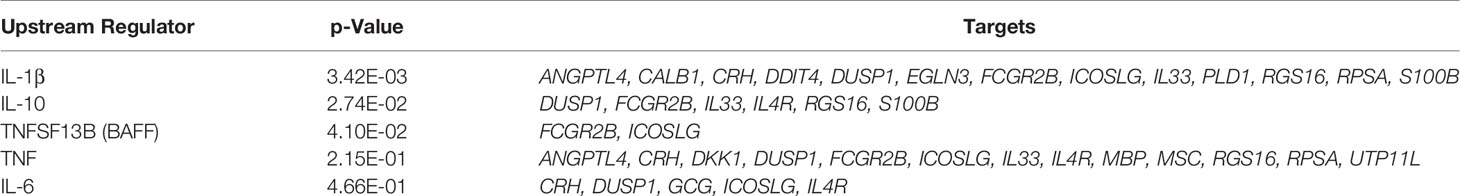
Table 4B Upstream regulators of differentially expressed genes in AA+ vs. control identified by IPA analysis.
QPCR Validation of Biologically Relevant Genes That Are Changed in AA+ Individuals
Among the 183 genes that are significantly changed in the pancreata of AA+ individuals vs. controls, we identified 9 genes that are located in genetic loci that have previously been associated with T1D, T2D, metabolism or obesity, by GWAS studies. In addition, we identified another seven upregulated genes, and 15 downregulated genes, that have functions biologically relevant for disease pathogenesis (Table 3). The expression of these genes was verified by QPCR analysis. We were able to validate changes in eight out of 29 genes examined (Figure 4, Supplementary Figure 2, and Table 5). A significant upregulation of CADM2, and downregulation of TRPM5, CRH, PDK4, ANGPTL4, CLEC4D, RGS16, and FCGR2B was confirmed in the pancreata of AA+ vs. controls. Fold-change differences were higher when gene expression was measured by QPCR vs. microarray analysis. The QPCR cycle threshold (Ct) values for these genes are shown in Supplementary Table 5. RNA RIN values of the samples did not appear to influence the expression of these 8 genes when measured by microarray or QPCR analysis (Supplementary Figures 3 and 4).
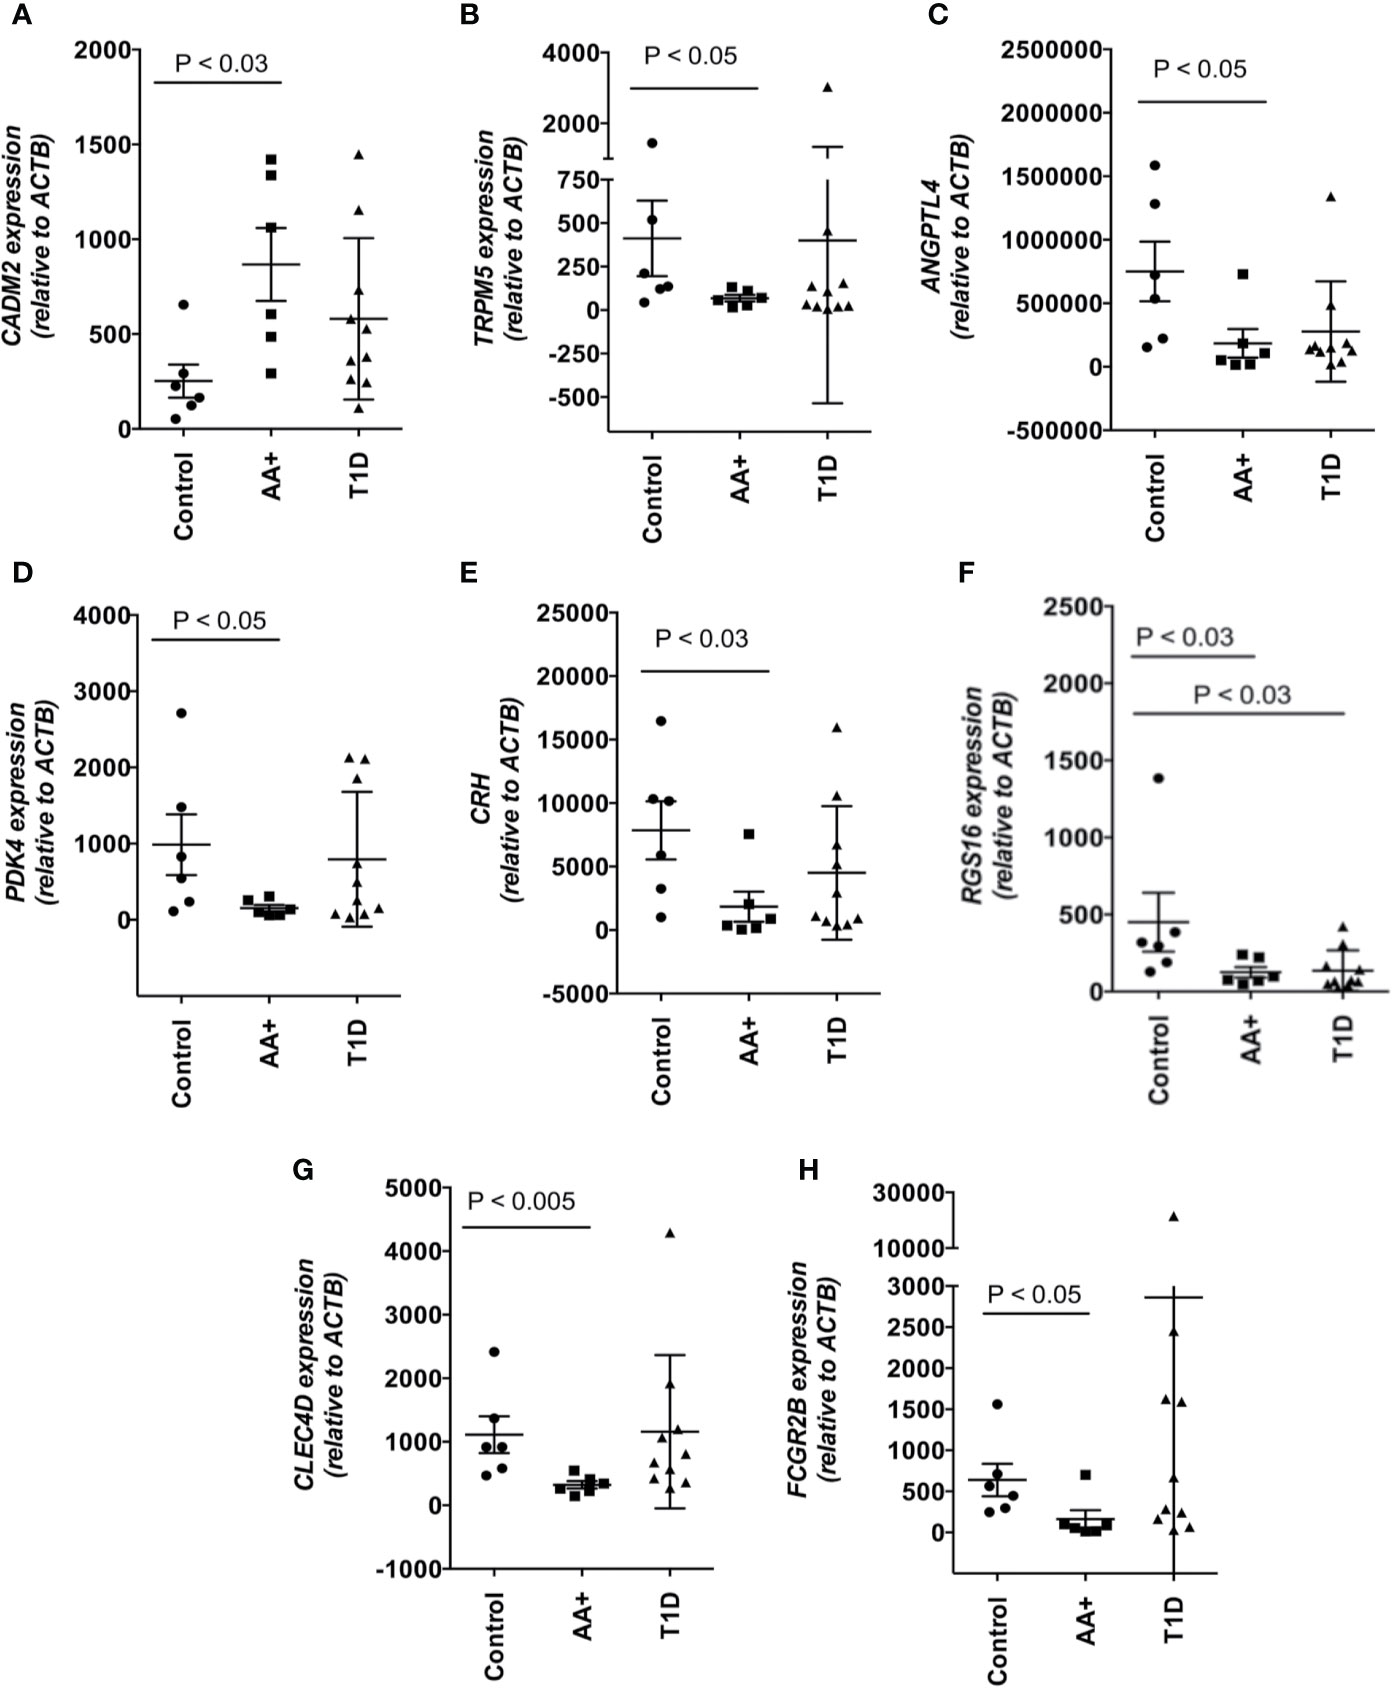
Figure 4 Changes in the expression of 8 disease-relevant genes were verified by QPCR analysis. A significant upregulation of CADM2 (A), and downregulation of TRPM5 (B), ANGPTL4 (C), PDK4 (D), CRH (E), RGS16 (F), CLEC4D (G), and FCGR2B (H) was verified in the pancreata of AA+ vs. control individuals by QPCR analysis. Statistical analysis was performed using the two-tailed Mann-Whitney test. (See Supplementary Figure 2 for complete set of QPCR data of all genes shown in Table 3).
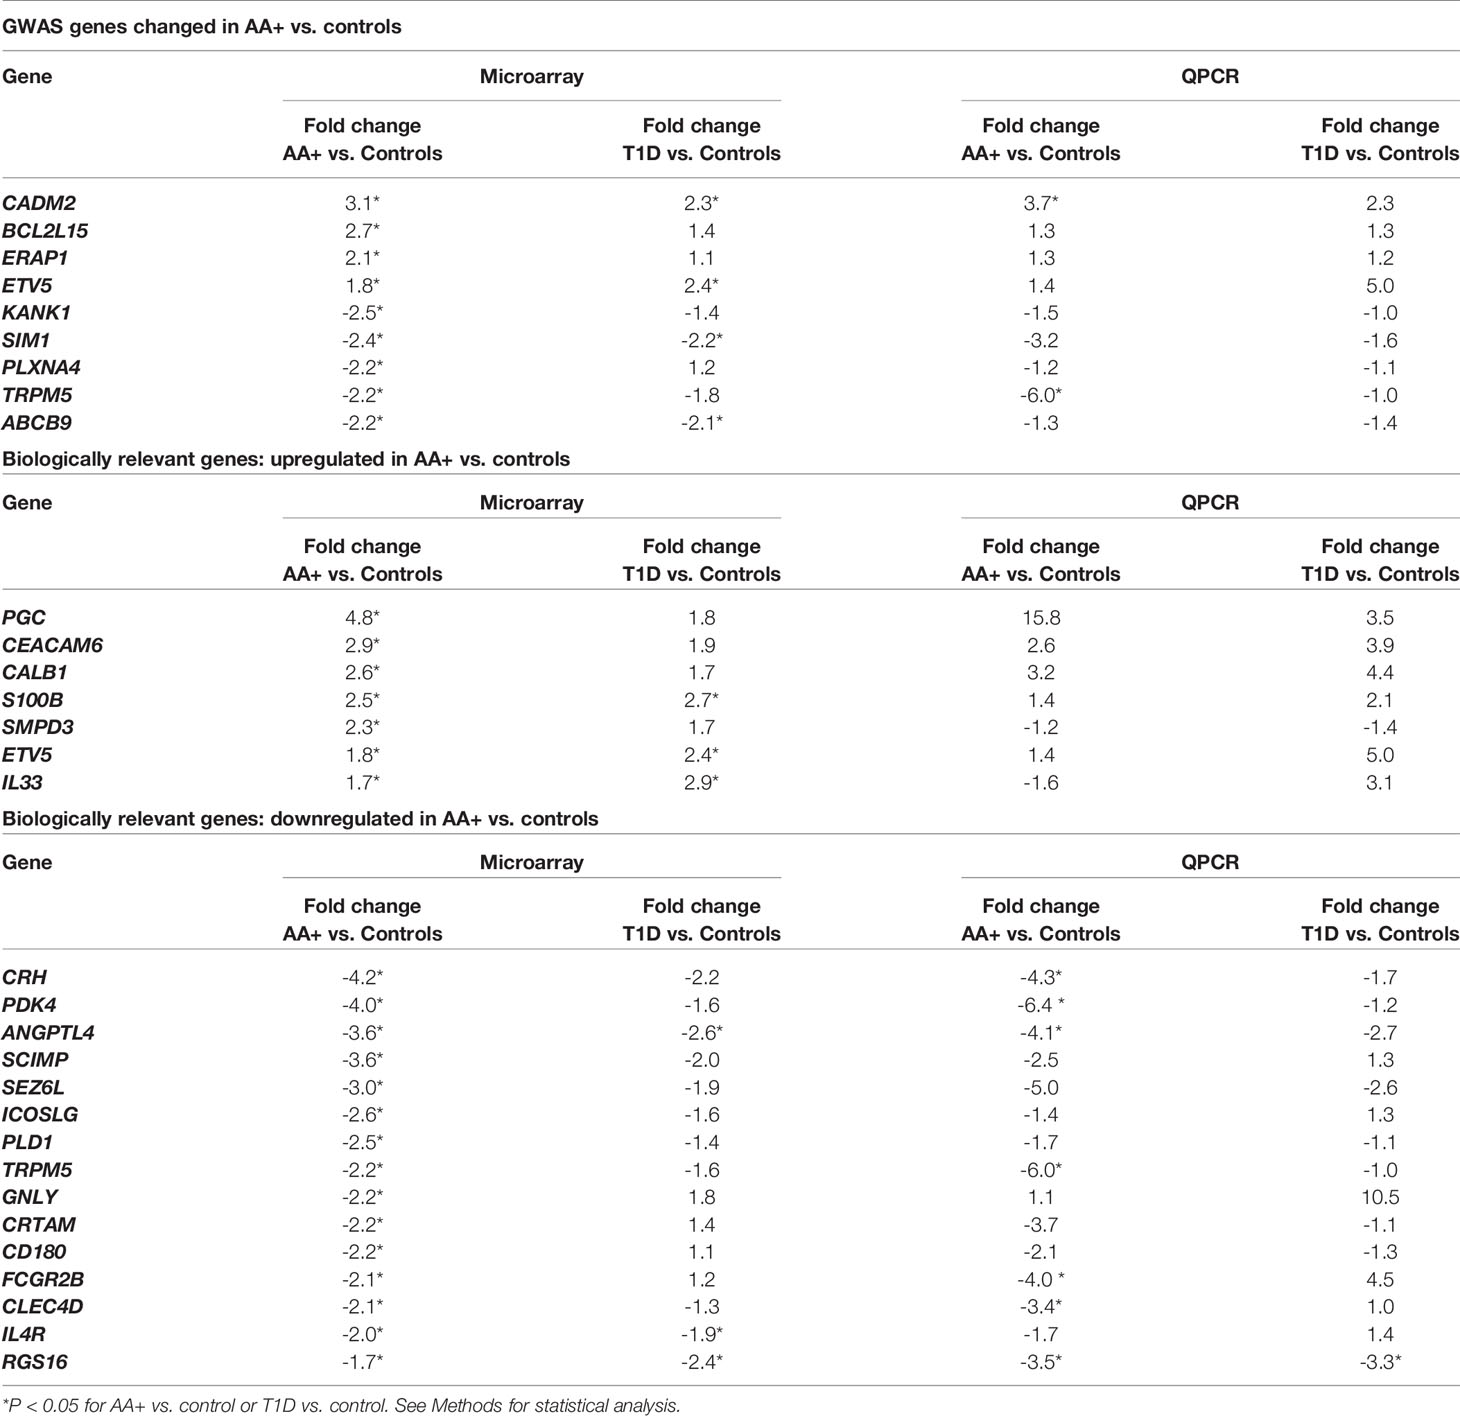
Table 5 Microarray and QPCR data for biologically relevant genes that are differentially expressed in the pancreata of AA+ and T1D patients vs. controls.
Our inability to validate additional genes may be due to inherent differences in the quantification methods used. QPCR data is normalized to house-keeping gene expression and may be affected by the choice of house-keeping gene. The Taqman assays used for QPCR may also contain primers and probes that target a different region of the gene compared to the probes on the microarray. Thus, differential expression of gene transcripts or alternative splicing of genes could result in differences between microarray and QPCR data.
Among the genes that we validated by QPCR, the change in FCGR2B expression is particularly interesting. This gene has been shown to play a role in multiple autoimmune diseases and a role in the development of NOD disease (26). FCGR2B encodes the inhibitory CD32B receptor that is mainly expressed in B-cells (20). To examine if the change in FCGR2B expression may simply reflect a change in the abundance of immune cells, we measured CD19, CD20 and CD11C expression, and found no significant difference in expression between controls, AA+ and T1D patients (Figure 5).

Figure 5 Expression CD19, CD20, and CD11c in the pancreata of AA+ and T1D patients compared to controls. Expression levels were measured by QPCR and statistical analysis was performed using the two-tailed Mann Whitney test.
Comparison of Differentially Expressed Genes in At-Risk AA+ Individuals and Pre-Diabetic NOD Mice
To determine if similar genes are altered in the pancreata of AA+ individuals and pre-diabetic NOD mice, we performed microarray analysis on pancreas samples of 12-week-old NOD mice compared to age-matched congenic non-diabetes-prone NOD.B10 mice. Female NOD mice develop insulitic lesions starting at 4 weeks of age, and the onset of destructive insulitis occurs at 12 weeks age, followed by hyperglycemia at ~16 weeks of age (13). For these experiments, pancreatic tissues of 12-week-old NOD and NOD.B10 mice were immediately isolated and homogenized in Trizol reagent. RNA prepared from these samples showed little RNA degradation, with RIN values exceeding 8 for all samples (Figure S1). 25,283 entities representing 15,119 genes expressed in NOD pancreas samples overlap with genes on the human microarray. Among these, 2,043 entities representing 1880 genes were differentially expressed by at least 2-fold (p<0.01) in the pancreata of NOD vs. NOD.B10 mice. Only 12 genes were found to be similarly changed in the pancreata of NOD mice and human AA+ individuals (Figure 6A). Interestingly 4 of the 12 genes were among those that we successfully validated by QPCR (Figure 4). We showed that Cadm2 was significantly increased while Trpm5, Pdk4 and Angptl4 were significantly reduced in the pancreata of NOD vs. NOD.B10 mice. No changes in housekeeping genes Actb and Gapdh were observed (Figure 6A). Crh was not present in the mouse microarray. The other three genes, Fcgr2b, Clec4d, and Rgs16, that were reduced in the pancreata of AA+ individuals, were not changed in the pancreata of NOD mice (Figure 6B). These genes are abundantly expressed on B-cells, T-cells, DCs, and/or macrophages (20, 63–65). Thus their expression in the pancreas is impacted by the presence of immune cells in the insulitic lesion of NOD mice. Accordingly, we found significantly elevated expression of various leukocyte markers including Cd3e and CD28 (T-cell markers), Cd20 and B220 (B-cell markers), Cd11c (Itgax; dendritic cell marker), and Cd11b (Itgam; macrophage marker) in the pancreata of NOD vs. NOD.B10 mice (Figure 6C).
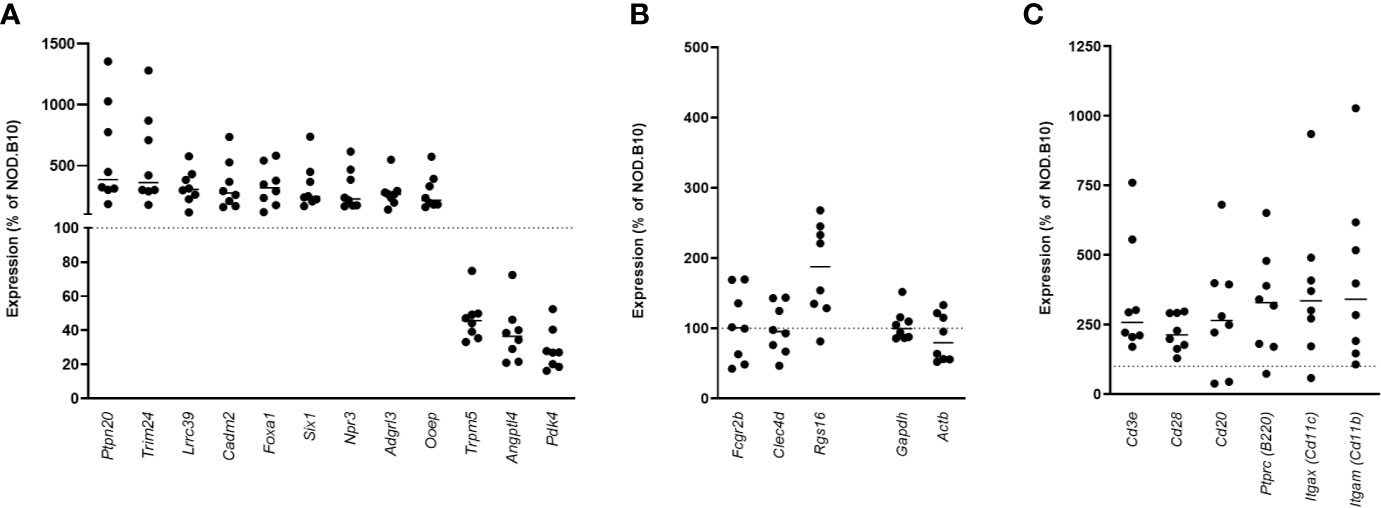
Figure 6 Gene expression in the pancreata of pre-diabetic 12-week-old NOD mice compared to AA+ individuals. 12 genes were found to be similarly changed in the pre-diabetic pancreata of 12-week-old NOD vs. NOD.B10 control mice and the pancreata of AA+ individuals vs. controls (A) Surprisingly, 4 of these genes were among the biologically relevant genes that we verified by QPCR (Figure 4). Fcgr2b, Clec4d, and Rgs16 were not found to be reduced in the pancreata of NOD mice (B), likely due to the high level of insulitis. Abundant expression of various immune cell markers was observed in the NOD pancreas (C).
FCGR2B Gene Expression in Whole Blood Samples
Since FCGR2B is highly expressed on B-cells, we asked whether the expression of this gene could serve as a potential biomarker of disease progression in peripheral blood cells. QPCR was performed to measure FCGR2B expression in whole blood samples of AA- first-degree relatives of T1D patients (AA- FDRs; n=15), AA+ FDRs who later progressed to hyperglycemia (AA+ progressors, n=20), and established T1D patients. Remarkably, we showed that FCGR2B expression was significantly lower in the whole blood of AA+ progressors and T1D patients compared to AA- FDRs (Figure 7A). CD19, CD20, and CD11c expression was not changed in AA+ progressors, while CD19 and CD20 expression was significantly elevated in peripheral blood cells of T1D patients vs. AA- FDRs (Figures 7B–D). When FCGR2B is expressed as a ratio of the B-cell markers CD19 or CD20, the differences observed between AA+ progressors and T1D vs. AA- FDRs were more significant (Figures 7E, F). These data suggest that a loss of FCGR2B expression may occur in the peripheral blood, possibly in B-cells, during the development and progression of T1D.
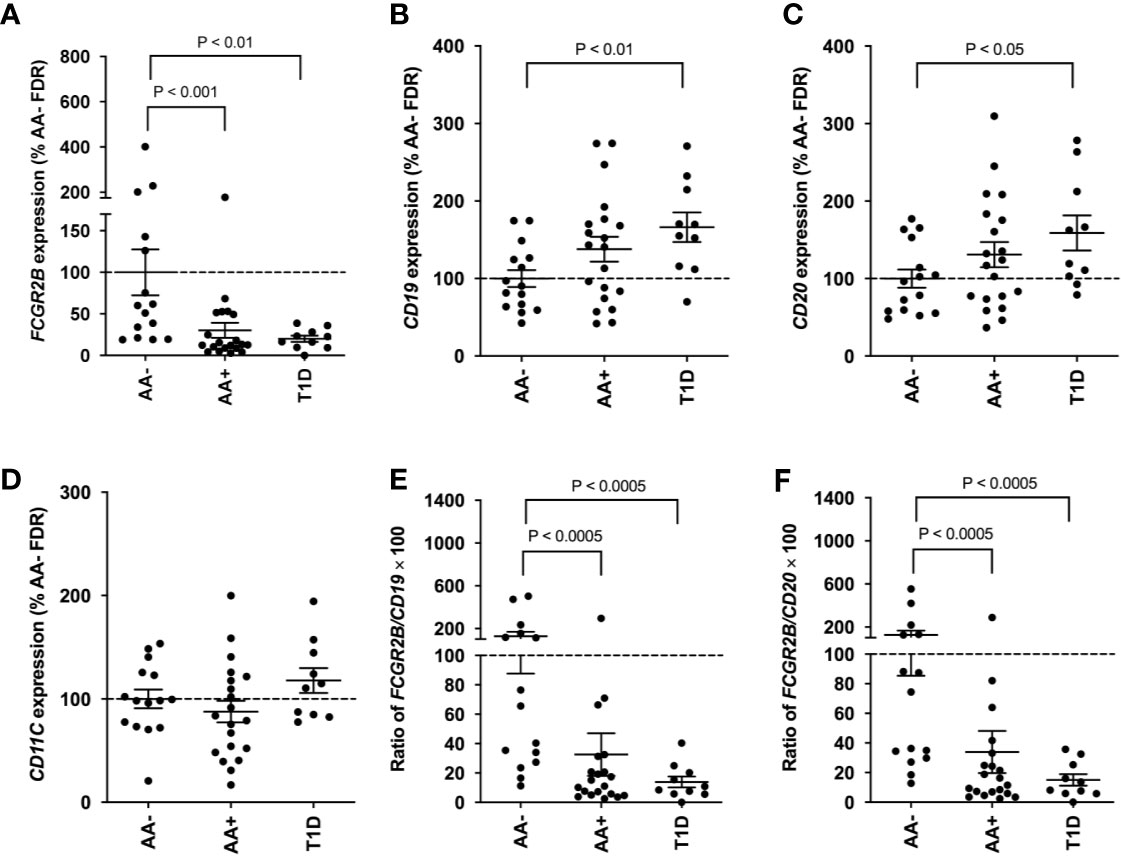
Figure 7 Loss of FCGR2B gene expression in the peripheral blood of AA+ FDRs and T1D patients. QPCR data showing FCGR2B (A), CD19 (B), CD20 (C), and CD11c (D) expression in the whole blood of AA- FDRs, AA+ progressors, and T1D patients. FCGR2B expression is also shown relative to CD19 (E) and CD20 (F) expression for each individual. Statistical analysis was performed using the two-tailed Mann-Whitney test.
Discussion
A number of gene expression analysis studies have previously been performed to examine disease pathogenesis in T1D. The majority of studies, however, have been carried out using peripheral blood samples of AA+ at-risk and early onset T1D patients, while relatively few have been performed in the pancreata of these individuals, where insulitis, and islet destruction occur (66–72). This is partly due to the lack of pancreas samples available for study, and the difficulty in extracting high-quality RNA from these tissues. High levels of endogenous RNAses, DNases and proteases present in the pancreas result in the rapid autolysis of tissues following tissue damage, and lead to varying levels of RNA degradation (16, 73, 74). This is frequently observed in tissues collected post-mortem, when extensive tissue processing times are unavoidable. Pancreatic tissues collected from live individuals yield high quality RNA, but are difficult to obtain. In the Diabetes Virus Detection (DiViD) study, pancreatic biopsies were collected from live recent onset T1D patients, however, enrollment was halted when serious complications developed in 3 of the 6 individuals enrolled in the study (75, 76).
In this study, we utilized pancreatic tissue samples from JDRF nPOD for gene expression analysis. This repository contains one of the largest collections of tissues recovered from at-risk AA+ and T1D patients. Pancreatic tissues collected by nPOD are routinely minced and treated with RNAlater to increase RNA stability (73). The quality of the RNA extracted from pancreatic samples stored at nPOD has previously been assessed, and found to vary based on several factors including cause of death. Samples from head trauma victims had lower RIN values (18). This was also observed in our set of samples (Table 1). While appreciable levels of RNA degradation occurred in some of the samples, we were still able to identify a number of biologically relevant genes that were differentially expressed in AA+ and T1D patients compared to controls. Others have already shown that degraded RNA can be used successfully for transcriptome analysis and that the biological differences between groups outweigh the effects of RNA degradation on gene expression (19).
This study is the first to show that a distinct subset of genes is differentially expressed in the pancreata of at-risk AA+ individuals compared to T1D patients and to healthy controls. Of the 155 genes changed by >2-fold in the pancreata of AA+ individuals, only one-third remained changed in the pancreata of established T1D patients, reflecting the transient nature of events that are active during the early stages of disease development. After the establishment of hyperglycemia, the number of differentially expressed genes increased by ~4-fold to 645 genes. This includes genes such as INS that are lost as a result of β-cell death (Figure 2).
Changes in the gene expression profile of AA+ individuals reflect the activation of various immune pathways (Table 4A), and are consistent with the increased CD4+ and CD11c+ cell infiltration previously observed in the pancreata of AA+ patients (9). A number of cytokines including IL-1β, IL-10, TNSF13B (BAFF), TNF, and IL-6 were identified by IPA analysis to be upstream regulators of various differentially expressed genes (Table 4B). These cytokines have already been shown to play a role in the development of T1D (77–82).
To identify novel mechanisms that may contribute to disease pathogenesis, we focused on biologically relevant genes that were changed in the pancreata of AA+ individuals, and successfully validated the differential expression of 8 genes (CADM2, TRPM5, PDK4, ANGPTL4, CRH, CLEC4D, RGS16, and FCGR2B) by QPCR. We also performed gene expression analysis on 12-week-old NOD mice, during the onset of destructive insulitis, to identify genes or disease mechanisms that may be similarly changed in the pancreata of pre-diabetic NOD mice and “pre-diabetic” AA+ at-risk individuals. NOD disease shares many similarities with human T1D, however, there are striking differences in disease progression, especially in the pancreas where relatively mild insulitis is observed in humans, and large insulitic lesions and highly infiltrated islets are observed in NOD mice (83). As a result, the most differentially expressed genes observed in the pancreata of pre-diabetic NOD mice vs. NOD.B10 control mice are those expressed in the infiltrating leukocytes (See GEO series GSE154739).
We showed that only 12 genes were similarly changed in the pancreata of NOD mice and AA+ individuals (Figure 6A). Surprisingly, four of these genes were among the eight disease-relevant genes that we validated to be changed in the pancreata of AA+ individuals. These four genes, Cadm2, Trpm5, Pdk4, and Angptl, are not highly expressed in leukocytes and thus, their expression is not significantly impacted by the presence infiltrating cells in the NOD pancreas. The other three genes validated to be reduced in the pancreata of AA+ individuals, Clec4d, Rgs16, and Fcgr2b, are abundantly expressed on leukocytes, thus, their expression in the NOD pancreas would be significantly influenced by the high level of insulitis. The Crh gene was not present on the mouse microarray.
Our data suggest that increased expression of CADM2, and reduced expression of TRPM5, PDK4, and/or ANGPTL4 could play a role in the development of both human T1D and NOD disease by altering mechanisms that control insulin sensitivity, insulin secretion, β-cell and pancreas development, and/or islet cell organization. The CADM2 gene encodes cell adhesion molecule 2, a mediator of synaptic signaling. GWAS studies have identified SNPs near CADM2 that are associated with higher expression of CADM2, and the development of obesity (30, 84). In animal models, increased Cadm2 expression is associated with obesity, while knockout or loss of Cadm2 prevents obesity, improves insulin sensitivity and protects mice from developing diabetes (31, 84). Interestingly, Cadm2 expression is reduced in obese and insulin-resistant mice by treatment with leptin (84), an adipose hormone that has been suggested as a potential treatment for T1D (85).
The TRPM5 gene, encodes the transient receptor potential cation channel, subfamily M, member 5, a calcium-activated non-selective channel expressed in β-cells that is an indispensable regulator of insulin secretion (86, 87). In humans, genetic variation within the TRPM5 locus associates with pre-diabetic phenotypes in subjects who are at risk for developing T2D (38). In mice, loss of Trpm5 expression results in compromised glucose-stimulated insulin secretion, and maintained elevated blood glucose levels following a glucose challenge (37). TRPM5 has also been shown to mediate insulin secretion by L-arginine and to potentiate glucose-induced insulin secretion by glucagon-like peptide 1 (88, 89).
The ANGPTL4 gene, encodes angiopoietin-like 4, a protein that is critically involved in maintaining normal glucose and lipid metabolism (49). In the islets, Angptl4 is expressed in glucagon-secreting alpha cells, and enhances glucose-stimulated insulin secretion. Mice deficient in Angptl4 have impaired glucose tolerance, secreting significantly lower levels of insulin in response to glucose-stimulation, and have dysmorphic islets with abnormally distributed alpha cells (50). Interestingly, we had previously observed disorganization of alpha cell distribution within the islets of 12-week-old NOD mice (14). It is possible that this may result from the significant loss of Angptl4 expression in the pancreas.
The PDK4 gene encodes pyruvate dehydrogenase kinase 4. In the pancreas, PDK4 may induce the expression of the pancreas-specific transcription factor 1a (PTF1A) (48). In mice, Ptf1a is involved in pancreatic development and function. Reduced Ptf1a levels leads to pancreatic hypoplasia and glucose intolerance. Ptf1a levels are a determinant of pancreatic size (90). This is interesting, as reduced pancreatic size has been observed in T1D patients, AA+ individuals, and AA- first-degree relatives of T1D patients (7, 8, 91, 92). Ptf1a also activates expression of Pdx1 (Pancreas/duodenum homeobox protein 1) (93, 94), an important transcription factor that regulates β-cell proliferation, differentiation, and function (95). It is possible that reduced levels of PDK4 lead to loss of PTF1A, and subsequently, a loss of PDX1 expression in the pancreata of AA+ individuals and NOD mice.
The CRH gene encodes corticotropin-releasing hormone, an important regulator of the hypothalamic-pituitary-adrenal (HPA) axis. In islets, CRH activates corticotropin-releasing hormone receptors on β-cells to stimulate insulin secretion, and promote islet development and proliferation (46, 47, 96). Reduced levels of CRH have been observed in the plasma of T2D patients (97). Reduced pancreatic expression of CRH may increase the risk for developing T1D in AA+ individuals.
We observed significantly reduced expression of 3 other genes, RGS16, CLEC4D, and FCGR2B, in the pancreata of AA+ individuals, but not in that of NOD mice. These genes are enriched in leukocytes, and loss of their expression may contribute to the development of T1D by promoting inflammation, activating T cells and B-cells, and altering β-cell development. The RGS16 gene encodes regulator of G‐protein signaling 16, and is abundantly expressed in immune cells and pancreatic islets (61, 98–100). Increased RGS16 expression inhibits T cell migration in response to various chemokines, and downregulates pro-inflammatory cytokine production in monocytes (99, 100). In the pancreas, RGS16 is highly enriched in β-cells, where it is involved in the cell development and proliferation (60), and in the regulation of insulin secretion (61).
The CLEC4D gene encodes a C-type lectin mycobacterial receptor that is highly expressed in macrophages and myeloid cells. CLEC4D plays a crucial role in anti-mycobacterial host defense. In mice, loss of Clec4d expression results in elevated inflammation, increased mycobacterial levels, and increased mortality (58). In humans, a polymorphism in the CLEC4D gene that results in reduced expression, is associated with increased susceptibility to pulmonary tuberculosis (58). T1D patients have a reduced capacity to produce pro-inflammatory cytokines in response to Mycobacterium tuberculosis (101), and have a higher risk of developing tuberculosis (102). This may involve a loss of CLEC4D expression.
The FCGR2B gene encodes CD32B, an inhibitory low affinity receptor for the Fc region of IgG complexes that is highly expressed on B-cells. This receptor contains an immunoreceptor tyrosine-based inhibitory motif that negatively regulates the BCR complex and its signaling threshold (20). Activation of CD32B in B-cells ultimately leads to diminished BCR-dependent cell activation and antibody production, and loss of CD32B expression can lead to hyper-responsiveness, proliferation and maturation of B-cells. Diminished CD32B expression has already been observed in a number of autoimmune diseases. The autoimmune susceptibility of various strains of mice including NOD mice has also been attributed to polymorphisms in the FCGR2B gene that result in reduced CD32B expression in germinal center B-cells (26, 27). Loss of FCGR2B gene expression, and reduced surface expression of CD32B have been observed in activated B-cells of NOD mice, and human systemic lupus erythematosus patients (24–27), while a lower frequency of CD32B+ B-cells, and lower mean fluorescent intensity of CD32B expression have been observed in B-cells of rheumatoid arthritis patients compared to controls (23). Reduced FCGR2B gene expression has also been observed in the PBMCs of patients with active Graves’ disease (92).
Here, we showed that FCGR2B gene expression was significantly reduced in the pancreas and peripheral blood of AA+ progressors and T1D patients compared to controls. CD19, CD20, and CD11c expression was not significantly changed in AA+ progressors. However, when FCGR2B is expressed relative to CD19 or CD20 expression, differences between the AA+ progressors vs. AA-FDRs were more significant. This was also observed in T1D patients, suggesting that FCGR2B expression may be diminished in B-cells of “pre-diabetic” AA+ individuals and T1D patients. There is abundant evidence suggesting a role for B-cells in T1D (103–106). A loss of CD32B expression may lead to deficient negative feedback regulation of the BCR resulting in intrinsic hyper-responsiveness, proliferation and maturation of B-cells, and contribute to the onset of T1D. Since significantly reduced expression of FCGR2B may be seen in AA+ individuals years before the onset of T1D (Table 2), this gene could potentially serve as an early biomarker of disease progression, and be used to predict disease onset. Flow cytometry experiments are currently in progress at our lab to study the expression of CD32B in longitudinal blood samples collected from AA+ individuals and healthy controls.
Together, our data show that different pathological events driven by changes in CADM2, TRPM5, PDK4, ANGPTL4, CRH, CLEC4D, RGS16, and FCGR2B gene expression may contribute to the development of T1D. These genes are involved in various functions including pancreatic development, β-cell proliferation, insulin sensitivity and secretion, inflammation, and/or immune cell function. Changes in the expression of these genes were mainly observed in the pancreata of AA+ individuals, during the active development of disease, and overlapped well with changes observed in the pancreata of pre-diabetic NOD mice. These findings emphasize the importance of utilizing tissues collected from pre-diabetic individuals, rather than established T1D patients, in understanding the pathogenesis of disease and in identifying early biomarkers of disease progression. Biorepositories such as nPOD and TrialNet play a crucial role in providing access to these rare and important samples.
Data Availability Statement
The datasets presented in this study can be found in online repositories. The names of the repository/repositories and accession number(s) can be found below: https://www.ncbi.nlm.nih.gov/geo/, GSE72492; https://www.ncbi.nlm.nih.gov/geo/, GSE154739.
Ethics Statement
The animal study was reviewed and approved by Stanford University Institutional Animal Care and Use Committee (IACUC).
Author Contributions
LY performed the microarray and QPCR experiments, performed the data analysis, prepared the manuscript, and composed the figures and tables. RF performed RNA extraction, bioanalyzer, and QPCR analysis. RA performed QPCR experiments. CF and LY were involved in the planning and direction of this work. All authors contributed to the article and approved the submitted version.
Funding
Funding was provided by the National Institute of Health (NIH Grant: 5R01DK11587403) and the Juvenile Diabetes Research Foundation (JDRF grant 2-SRA-2016-340-S-B). This work was also supported by pilot funding from the Stanford Diabetes Research Center (P30DK116074), and a grant from the Myra Reinhard Foundation. This research was performed with the support of the Network for Pancreatic Organ donors with Diabetes (nPOD; RRID:SCR_014641), a collaborative type 1 diabetes research project sponsored by JDRF (nPOD: 5-SRA-2018-557-Q-R) and The Leona M. & Harry B. Helmsley Charitable Trust (Grant#2018PG-T1D053). The content and views expressed are the responsibility of the authors and do not necessarily reflect the official view of nPOD. Organ Procurement Organizations (OPO) partnering with nPOD to provide research resources are listed at http://www.jdrfnpod.org/for-partners/npod-partners/.
Conflict of Interest
The authors declare that the research was conducted in the absence of any commercial or financial relationships that could be construed as a potential conflict of interest.
Acknowledgments
We acknowledge the support of the Type 1 Diabetes TrialNet Study Group, which identified study participants and provided samples and follow-up data for this study. The Type 1 Diabetes TrialNet Study Group is a clinical trials network funded by the National Institutes of Health (NIH) through the National Institute of Diabetes and Digestive and Kidney Diseases, the National Institute of Allergy and Infectious Diseases, and The Eunice Kennedy Shriver National Institute of Child Health and Human Development, through the cooperative agreements U01 DK061010, U01 DK061034, U01 DK061042, U01 DK061058, U01 DK085453, U01 DK085461, U01 DK085465, U01 DK085466, U01 DK085476, U01 DK085499, U01 DK085504, U01 DK085509, U01 DK103180, U01 DK103153, U01 DK103266, U01 DK103282, U01 DK106984, U01 DK106994, U01 DK107013, U01 DK107014, UC4 DK106993, UC4 DK11700901, U01 DK 106693-02, and the JDRF. The contents of this article are solely the responsibility of the authors and do not necessarily represent the official views of the NIH or the JDRF.
Supplementary Material
The Supplementary Material for this article can be found online at: https://www.frontiersin.org/articles/10.3389/fendo.2020.609271/full#supplementary-material
References
1. Atkinson MA. The pathogenesis and natural history of type 1 diabetes. Cold Spring Harb Perspect Med (2012) 2. doi: 10.1101/cshperspect.a007641
2. Concannon P, Rich SS, Nepom GT. Genetics of type 1A diabetes. N Engl J Med (2009) 360:1646–54. doi: 10.1056/NEJMra0808284
3. Noble JA, Erlich HA. Genetics of type 1 diabetes. Cold Spring Harb Perspect Med (2012) 2:a007732. doi: 10.1101/cshperspect.a007732
4. Ronningen KS. Type 1 diabetes: prospective cohort studies for identification of the environmental trigger. Arch Immunol Ther Exp (Warsz) (2013) 61:459–68. doi: 10.1007/s00005-013-0247-9
5. Knip M, Simell O. Environmental triggers of type 1 diabetes. Cold Spring Harb Perspect Med (2012) 2:a007690. doi: 10.1101/cshperspect.a007690
6. Barbeau WE. What is the key environmental trigger in type 1 diabetes–is it viruses, or wheat gluten, or both? Autoimmun Rev (2012) 12:295–9. doi: 10.1016/j.autrev.2012.05.003
7. Campbell-Thompson M, Wasserfall C, Montgomery EL, Atkinson MA, Kaddis JS. Pancreas organ weight in individuals with disease-associated autoantibodies at risk for type 1 diabetes. JAMA (2012) 308:2337–9. doi: 10.1001/jama.2012.15008
8. Williams AJ, Thrower SL, Sequeiros IM, Ward A, Bickerton AS, Triay JM, et al. Pancreatic volume is reduced in adult patients with recently diagnosed type 1 diabetes. J Clin Endocrinol Metab (2012) 97:E2109–2113. doi: 10.1210/jc.2012-1815
9. Rodriguez-Calvo T, Ekwall O, Amirian N, Zapardiel-Gonzalo J, von Herrath MG. Increased immune cell infiltration of the exocrine pancreas: a possible contribution to the pathogenesis of type 1 diabetes. Diabetes (2014) 63:3880–90. doi: 10.2337/db14-0549
10. Atkinson MA. Losing a grip on the notion of beta-cell specificity for immune responses in type 1 diabetes: can we handle the truth? Diabetes (2014) 63:3572–4. doi: 10.2337/db14-1069
11. Campbell-Thompson M, Fu A, Kaddis JS, Wasserfall C, Schatz DA, Pugliese A, et al. Insulitis and beta-Cell Mass in the Natural History of Type 1 Diabetes. Diabetes (2016) 65:719–31. doi: 10.2337/db15-0779
12. In’t Veld P, Lievens D, De Grijse J, Ling Z, Van der Auwera B, Pipeleers-Marichal M, et al. Screening for insulitis in adult autoantibody-positive organ donors. Diabetes (2007) 56:2400–4. doi: 10.2337/db07-0416
13. Yip L, Fathman CG. Type 1 diabetes in mice and men: gene expression profiling to investigate disease pathogenesis. Immunol Res (2014) 58:340–50. doi: 10.1007/s12026-014-8501-8
14. Yip L, Taylor C, Whiting CC, Fathman CG. Diminished adenosine A1 receptor expression in pancreatic alpha-cells may contribute to the pathology of type 1 diabetes. Diabetes (2013) 62:4208–19. doi: 10.2337/db13-0614
15. Crookshank JA, Serrano D, Wang GS, Patrick C, Morgan BS, Pare MF, et al. Changes in insulin, glucagon and ER stress precede immune activation in type 1 diabetes. J Endocrinol (2018) 239:181–95. doi: 10.1530/JOE-18-0328
16. Azevedo-Pouly AC, Elgamal OA, Schmittgen TD. RNA isolation from mouse pancreas: a ribonuclease-rich tissue. J Visualized Experiments JoVE (2014), e51779. doi: 10.3791/51779
17. Walker DG, Whetzel AM, Serrano G, Sue LI, Lue LF, Beach TG. Characterization of RNA isolated from eighteen different human tissues: results from a rapid human autopsy program. Cell Tissue Banking (2016) 17:361–75. doi: 10.1007/s10561-016-9555-8
18. Philips T, Kusmartseva I, Gerling IC, Campbell-Thompson M, Wasserfall C, Pugliese A, et al. Factors That Influence the Quality of RNA From the Pancreas of Organ Donors. Pancreas (2017) 46:252–9. doi: 10.1097/MPA.0000000000000717
19. Opitz L, Salinas-Riester G, Grade M, Jung K, Jo P, Emons G, et al. Impact of RNA degradation on gene expression profiling. BMC Med Genomics (2010) 3:36. doi: 10.1186/1755-8794-3-36
20. Anania JC, Chenoweth AM, Wines BD, Hogarth PM. The Human FcgammaRII (CD32) Family of Leukocyte FcR in Health and Disease. Front Immunol (2019) 10:464. doi: 10.3389/fimmu.2019.00464
21. Nimmerjahn F, Ravetch JV. Fcgamma receptors as regulators of immune responses. Nat Rev Immunol (2008) 8:34–47. doi: 10.1038/nri2206
22. Mori H, Amino N, Iwatani Y, Kabutomori O, Asari S, Motoi S, et al. Increase of peripheral B lymphocytes in Graves’ disease. Clin Exp Immunol (1980) 42:33–40.
23. Prokopec KE, Rhodiner M, Matt P, Lindqvist U, Kleinau S. Down regulation of Fc and complement receptors on B cells in rheumatoid arthritis. Clin Immunol (2010) 137:322–9. doi: 10.1016/j.clim.2010.08.006
24. Chu ZT, Tsuchiya N, Kyogoku C, Ohashi J, Qian YP, Xu SB, et al. Association of Fcgamma receptor IIb polymorphism with susceptibility to systemic lupus erythematosus in Chinese: a common susceptibility gene in the Asian populations. Tissue Antigens (2004) 63:21–7. doi: 10.1111/j.1399-0039.2004.00142.x
25. Kyogoku C, Dijstelbloem HM, Tsuchiya N, Hatta Y, Kato H, Yamaguchi A, et al. Fcgamma receptor gene polymorphisms in Japanese patients with systemic lupus erythematosus: contribution of FCGR2B to genetic susceptibility. Arthritis Rheum (2002) 46:1242–54. doi: 10.1002/art.10257
26. Jiang Y, Hirose S, Abe M, Sanokawa-Akakura R, Ohtsuji M, Mi X, et al. Polymorphisms in IgG Fc receptor IIB regulatory regions associated with autoimmune susceptibility. Immunogenetics (2000) 51:429–35. doi: 10.1007/s002510050641
27. Xiu Y, Nakamura K, Abe M, Li N, Wen XS, Jiang Y, et al. Transcriptional regulation of Fcgr2b gene by polymorphic promoter region and its contribution to humoral immune responses. J Immunol (2002) 169:4340–6. doi: 10.4049/jimmunol.169.8.4340
28. Yip L, Creusot RJ, Pager CT, Sarnow P, Fathman CG. Reduced DEAF1 function during type 1 diabetes inhibits translation in lymph node stromal cells by suppressing Eif4g3. J Mol Cell Biol (2013) 5:99–110. doi: 10.1093/jmcb/mjs052
29. Yip L, Su L, Sheng D, Chang P, Atkinson M, Czesak M, et al. Deaf1 isoforms control the expression of genes encoding peripheral tissue antigens in the pancreatic lymph nodes during type 1 diabetes. Nat Immunol (2009) 10:1026–33. doi: 10.1038/ni.1773
30. Speliotes EK, Willer CJ, Berndt SI, Monda KL, Thorleifsson G, Jackson AU, et al. Association analyses of 249,796 individuals reveal 18 new loci associated with body mass index. Nat Genet (2010) 42:937–48.
31. Rathjen T, Yan X, Kononenko NL, Ku MC, Song K, Ferrarese L, et al. Regulation of body weight and energy homeostasis by neuronal cell adhesion molecule 1. Nat Neurosci (2017) 20:1096–103. doi: 10.1038/nn.4590
32. Fung EY, Smyth DJ, Howson JM, Cooper JD, Walker NM, Stevens H, et al. Analysis of 17 autoimmune disease-associated variants in type 1 diabetes identifies 6q23/TNFAIP3 as a susceptibility locus. Genes Immun (2009) 10:188–91. doi: 10.1038/gene.2008.99
33. Thorleifsson G, Walters GB, Gudbjartsson DF, Steinthorsdottir V, Sulem P, Helgadottir A, et al. Genome-wide association yields new sequence variants at seven loci that associate with measures of obesity. Nat Genet (2009) 41:18–24. doi: 10.1038/ng.274
34. Huyghe JR, Jackson AU, Fogarty MP, Buchkovich ML, Stancakova A, Stringham HM, et al. Exome array analysis identifies new loci and low-frequency variants influencing insulin processing and secretion. Nat Genet (2013) 45:197–201. doi: 10.1038/ng.2507
35. Meyre D, Lecoeur C, Delplanque J, Francke S, Vatin V, Durand E, et al. A genome-wide scan for childhood obesity-associated traits in French families shows significant linkage on chromosome 6q22.31-q23.2. Diabetes (2004) 53:803–11. doi: 10.2337/diabetes.53.3.803
36. Saxena R, Saleheen D, Been LF, Garavito ML, Braun T, Bjonnes A, et al. Genome-wide association study identifies a novel locus contributing to type 2 diabetes susceptibility in Sikhs of Punjabi origin from India. Diabetes (2013) 62:1746–55. doi: 10.2337/db12-1077
37. Brixel LR, Monteilh-Zoller MK, Ingenbrandt CS, Fleig A, Penner R, Enklaar T, et al. TRPM5 regulates glucose-stimulated insulin secretion. Pflugers Arch (2010) 460:69–76. doi: 10.1007/s00424-010-0835-z
38. Ketterer C, Mussig K, Heni M, Dudziak K, Randrianarisoa E, Wagner R, et al. Genetic variation within the TRPM5 locus associates with prediabetic phenotypes in subjects at increased risk for type 2 diabetes. Metabolism (2011) 60:1325–33. doi: 10.1016/j.metabol.2011.02.002
39. Harder MN, Appel EV, Grarup N, Gjesing AP, Ahluwalia TS, Jorgensen T, et al. The type 2 diabetes risk allele of TMEM154-rs6813195 associates with decreased beta cell function in a study of 6,486 Danes. PLoS One (2015) 10:e0120890. doi: 10.1371/journal.pone.0120890
40. Hassan MI, Toor A, Ahmad F. Progastriscin: structure, function, and its role in tumor progression. J Mol Cell Biol (2010) 2:118–27. doi: 10.1093/jmcb/mjq001
41. Lee D, Obukhov AG, Shen Q, Liu Y, Dhawan P, Nowycky MC, et al. Calbindin-D28k decreases L-type calcium channel activity and modulates intracellular calcium homeostasis in response to K+ depolarization in a rat beta cell line RINr1046-38. Cell Calcium (2006) 39:475–85. doi: 10.1016/j.ceca.2006.01.010
42. Chen Y, Yan SS, Colgan J, Zhang HP, Luban J, Schmidt AM, et al. Blockade of late stages of autoimmune diabetes by inhibition of the receptor for advanced glycation end products. J Immunol (2004) 173:1399–405. doi: 10.4049/jimmunol.173.2.1399
43. Rutkute K, Karakashian AA, Giltiay NV, Dobierzewska A, Nikolova-Karakashian MN. Aging in rat causes hepatic hyperresposiveness to interleukin-1beta which is mediated by neutral sphingomyelinase-2. Hepatology (2007) 46:1166–76. doi: 10.1002/hep.21777
44. Milovanovic M, Volarevic V, Radosavljevic G, Jovanovic I, Pejnovic N, Arsenijevic N, et al. IL-33/ST2 axis in inflammation and immunopathology. Immunol Res (2012) 52:89–99. doi: 10.1007/s12026-012-8283-9
45. Pham D, Sehra S, Sun X, Kaplan MH. The transcription factor Etv5 controls TH17 cell development and allergic airway inflammation. J Allergy Clin Immunol (2014) 134:204–14. doi: 10.1016/j.jaci.2013.12.021
46. Kanno T, Suga S, Nakano K, Kamimura N, Wakui M. Corticotropin-releasing factor modulation of Ca2+ influx in rat pancreatic beta-cells. Diabetes (1999) 48:1741–6. doi: 10.2337/diabetes.48.9.1741
47. Huising MO, van der Meulen T, Vaughan JM, Matsumoto M, Donaldson CJ, Park H, et al. CRFR1 is expressed on pancreatic beta cells, promotes beta cell proliferation, and potentiates insulin secretion in a glucose-dependent manner. Proc Natl Acad Sci USA (2010) 107:912–7. doi: 10.1073/pnas.0913610107
48. Dateki M, Kunitomo M, Yoshioka K, Yanai K, Nakasono S, Negishi T. Adaptive gene regulation of pyruvate dehydrogenase kinase isoenzyme 4 in hepatotoxic chemical-induced liver injury and its stimulatory potential for DNA repair and cell proliferation. J Receptor Signal Transduct Res (2011) 31:85–95. doi: 10.3109/10799893.2010.538405
49. Xu A, Lam MC, Chan KW, Wang Y, Zhang J, Hoo RL, et al. Angiopoietin-like protein 4 decreases blood glucose and improves glucose tolerance but induces hyperlipidemia and hepatic steatosis in mice. Proc Natl Acad Sci USA (2005) 102:6086–91. doi: 10.1073/pnas.0408452102
50. Kim HK, Kwon O, Park KH, Lee KJ, Youn BS, Kim SW, et al. Angiopoietin-like peptide 4 regulates insulin secretion and islet morphology. Biochem Biophys Res Commun (2017) 485:113–8. doi: 10.1016/j.bbrc.2017.02.031
51. Draber P, Vonkova I, Stepanek O, Hrdinka M, Kucova M, Skopcova T, et al. SCIMP, a transmembrane adaptor protein involved in major histocompatibility complex class II signaling. Mol Cell Biol (2011) 31:4550–62. doi: 10.1128/MCB.05817-11
52. Stutzer I, Selevsek N, Esterhazy D, Schmidt A, Aebersold R, Stoffel M. Systematic proteomic analysis identifies beta-site amyloid precursor protein cleaving enzyme 2 and 1 (BACE2 and BACE1) substrates in pancreatic beta-cells. J Biol Chem (2013) 288:10536–47. doi: 10.1074/jbc.M112.444703
53. Martin-Orozco N, Li Y, Wang Y, Liu S, Hwu P, Liu YJ, et al. Melanoma cells express ICOS ligand to promote the activation and expansion of T-regulatory cells. Cancer Res (2010) 70:9581–90. doi: 10.1158/0008-5472.CAN-10-1379
54. Ma WN, Park SY, Han JS. Role of phospholipase D1 in glucose-induced insulin secretion in pancreatic Beta cells. Exp Mol Med (2010) 42:456–64. doi: 10.3858/emm.2010.42.6.047
55. Jin Y, Sharma A, Carey C, Hopkins D, Wang X, Robertson DG, et al. The expression of inflammatory genes is upregulated in peripheral blood of patients with type 1 diabetes. Diabetes Care (2013) 36:2794–802. doi: 10.2337/dc12-1986
56. Yeh JH, Sidhu SS, Chan AC. Regulation of a late phase of T cell polarity and effector functions by Crtam. Cell (2008) 132:846–59. doi: 10.1016/j.cell.2008.01.013
57. Divanovic S, Trompette A, Petiniot LK, Allen JL, Flick LM, Belkaid Y, et al. Regulation of TLR4 signaling and the host interface with pathogens and danger: the role of RP105. J Leukocyte Biol (2007) 82:265–71. doi: 10.1189/jlb.0107021
58. Wilson GJ, Marakalala MJ, Hoving JC, van Laarhoven A, Drummond RA, Kerscher B, et al. The C-type lectin receptor CLECSF8/CLEC4D is a key component of anti-mycobacterial immunity. Cell Host Microbe (2015) 17:252–9. doi: 10.1016/j.chom.2015.01.004
59. Ko KS, Lee M, Koh JJ, Kim SW. Combined administration of plasmids encoding IL-4 and IL-10 prevents the development of autoimmune diabetes in nonobese diabetic mice. Mol Ther (2001) 4:313–6. doi: 10.1006/mthe.2001.0459
60. Villasenor A, Wang ZV, Rivera LB, Ocal O, Asterholm IW, Scherer PE, et al. Rgs16 and Rgs8 in embryonic endocrine pancreas and mouse models of diabetes. Dis Models Mech (2010) 3:567–80. doi: 10.1242/dmm.003210
61. Vivot K, Moulle VS, Zarrouki B, Tremblay C, Mancini AD, Maachi H, et al. The regulator of G-protein signaling RGS16 promotes insulin secretion and beta-cell proliferation in rodent and human islets. Mol Metab (2016) 5:988–96. doi: 10.1016/j.molmet.2016.08.010
62. Gonzalez-Mariscal I, Montoro RA, Doyle ME, Liu QR, Rouse M, O’Connell JF, et al. Absence of cannabinoid 1 receptor in beta cells protects against high-fat/high-sugar diet-induced beta cell dysfunction and inflammation in murine islets. Diabetologia (2018) 61:1470–83. doi: 10.1007/s00125-018-4576-4
63. Graham LM, Gupta V, Schafer G, Reid DM, Kimberg M, Dennehy KM, et al. The C-type lectin receptor CLECSF8 (CLEC4D) is expressed by myeloid cells and triggers cellular activation through Syk kinase. J Biol Chem (2012) 287:25964–74. doi: 10.1074/jbc.M112.384164
64. Shankar SP, Wilson MS, DiVietro JA, Mentink-Kane MM, Xie Z, Wynn TA, et al. RGS16 attenuates pulmonary Th2/Th17 inflammatory responses. J Immunol (2012) 188:6347–56. doi: 10.4049/jimmunol.1103781
65. Wong KL, Tai JJ, Wong WC, Han H, Sem X, Yeap WH, et al. Gene expression profiling reveals the defining features of the classical, intermediate, and nonclassical human monocyte subsets. Blood (2011) 118:e16–31. doi: 10.1182/blood-2010-12-326355
66. Klak M, Urban S, Gomolka M, Cichon J, Ambrozkiewicz F, Berman A, et al. Changes in Gene Expression of Selected Genes in Patients with Type 1 Diabetes and Pancreas Transplant in Peripheral Blood. Transplant Proc (2019) 51:2787–92. doi: 10.1016/j.transproceed.2019.04.086
67. Planas R, Carrillo J, Sanchez A, de Villa MC, Nunez F, Verdaguer J, et al. Gene expression profiles for the human pancreas and purified islets in type 1 diabetes: new findings at clinical onset and in long-standing diabetes. Clin Exp Immunol (2010) 159:23–44. doi: 10.1111/j.1365-2249.2009.04053.x
68. Richardson SJ, Rodriguez-Calvo T, Gerling IC, Mathews CE, Kaddis JS, Russell MA, et al. Islet cell hyperexpression of HLA class I antigens: a defining feature in type 1 diabetes. Diabetologia (2016) 59:2448–58. doi: 10.1007/s00125-016-4067-4
69. Padmos RC, Schloot NC, Beyan H, Ruwhof C, Staal FJ, de Ridder D, et al. Distinct monocyte gene-expression profiles in autoimmune diabetes. Diabetes (2008) 57:2768–73. doi: 10.2337/db08-0496
70. Panarina M, Kisand K, Alnek K, Heilman K, Peet A, Uibo R. Interferon and interferon-inducible gene activation in patients with type 1 diabetes. Scand J Immunol (2014) 80:283–92. doi: 10.1111/sji.12204
71. Han D, Cai X, Wen J, Matheson D, Skyler JS, Kenyon NS, et al. Innate and adaptive immune gene expression profiles as biomarkers in human type 1 diabetes. Clin Exp Immunol (2012) 170:131–8. doi: 10.1111/j.1365-2249.2012.04650.x
72. Han D, Leyva CA, Matheson D, Mineo D, Messinger S, Blomberg BB, et al. Immune profiling by multiple gene expression analysis in patients at-risk and with type 1 diabetes. Clin Immunol (2011) 139:290–301. doi: 10.1016/j.clim.2011.02.016
73. Jun E, Oh J, Lee S, Jun HR, Seo EH, Jang JY, et al. Method Optimization for Extracting High-Quality RNA From the Human Pancreas Tissue. Trans Oncol (2018) 11:800–7. doi: 10.1016/j.tranon.2018.04.004
74. Rudloff U, Bhanot U, Gerald W, Klimstra DS, Jarnagin WR, Brennan MF, et al. Biobanking of human pancreas cancer tissue: impact of ex-vivo procurement times on RNA quality. Ann Surg Oncol (2010) 17:2229–36. doi: 10.1245/s10434-010-0959-6
75. Atkinson MA. Pancreatic biopsies in type 1 diabetes: revisiting the myth of Pandora’s box. Diabetologia (2014) 57:656–9. doi: 10.1007/s00125-013-3159-7
76. Krogvold L, Edwin B, Buanes T, Ludvigsson J, Korsgren O, Hyoty H, et al. Pancreatic biopsy by minimal tail resection in live adult patients at the onset of type 1 diabetes: experiences from the DiViD study. Diabetologia (2014) 57:841–3. doi: 10.1007/s00125-013-3155-y
77. Anquetil F, Sabouri S, Thivolet C, Rodriguez-Calvo T, Zapardiel-Gonzalo J, Amirian N, et al. Alpha cells, the main source of IL-1beta in human pancreas. J Autoimmun (2017) 81:68–73. doi: 10.1016/j.jaut.2017.03.006
78. Lu J, Liu J, Li L, Lan Y, Liang Y. Cytokines in type 1 diabetes: mechanisms of action and immunotherapeutic targets. Clin Transl Immunol (2020) 9:e1122. doi: 10.1002/cti2.1122
79. Parackova Z, Klocperk A, Rataj M, Kayserova J, Zentsova I, Sumnik Z, et al. Alteration of B cell subsets and the receptor for B cell activating factor (BAFF) in paediatric patients with type 1 diabetes. Immunol Lett (2017) 189:94–100. doi: 10.1016/j.imlet.2017.04.009
80. Qiao YC, Shen J, Hong XZ, Liang L, Bo CS, Sui Y, et al. Changes of regulatory T cells, transforming growth factor-beta and interleukin-10 in patients with type 1 diabetes mellitus: A systematic review and meta-analysis. Clin Immunol (2016) 170:61–9. doi: 10.1016/j.clim.2016.08.004
81. Wang Q, Racine JJ, Ratiu JJ, Wang S, Ettinger R, Wasserfall C, et al. Transient BAFF Blockade Inhibits Type 1 Diabetes Development in Nonobese Diabetic Mice by Enriching Immunoregulatory B Lymphocytes Sensitive to Deletion by Anti-CD20 Cotherapy. J Immunol (2017) 199:3757–70. doi: 10.4049/jimmunol.1700822
82. Wilson CA, Jacobs C, Baker P, Baskin DG, Dower S, Lernmark A, et al. IL-1 beta modulation of spontaneous autoimmune diabetes and thyroiditis in the BB rat. J Immunol (1990) 144:3784–8.
83. In’t Veld P. Insulitis in human type 1 diabetes: a comparison between patients and animal models. Semin Immunopathol (2014) 36:569–79. doi: 10.1007/s00281-014-0438-4
84. Yan X, Wang Z, Schmidt V, Gauert A, Willnow TE, Heinig M, et al. Cadm2 regulates body weight and energy homeostasis in mice. Mol Metab (2018) 8:180–8. doi: 10.1016/j.molmet.2017.11.010
85. Wang MY, Chen L, Clark GO, Lee Y, Stevens RD, Ilkayeva OR, et al. Leptin therapy in insulin-deficient type I diabetes. Proc Natl Acad Sci USA (2010) 107:4813–9. doi: 10.1073/pnas.0909422107
86. Colsoul B, Vennekens R, Nilius B. Transient receptor potential cation channels in pancreatic beta cells. Rev Physiol Biochem Pharmacol (2011) 161:87–110. doi: 10.1007/112_2011_2
87. Prawitt D, Monteilh-Zoller MK, Brixel L, Spangenberg C, Zabel B, Fleig A, et al. TRPM5 is a transient Ca2+-activated cation channel responding to rapid changes in [Ca2+]i. Proc Natl Acad Sci USA (2003) 100:15166–71. doi: 10.1073/pnas.2334624100
88. Krishnan K, Ma Z, Bjorklund A, Islam MS. Role of transient receptor potential melastatin-like subtype 5 channel in insulin secretion from rat beta-cells. Pancreas (2014) 43:597–604. doi: 10.1097/MPA.0000000000000027
89. Shigeto M, Ramracheya R, Tarasov AI, Cha CY, Chibalina MV, Hastoy B, et al. GLP-1 stimulates insulin secretion by PKC-dependent TRPM4 and TRPM5 activation. J Clin Invest (2015) 125:4714–28. doi: 10.1172/JCI81975
90. Fukuda A, Kawaguchi Y, Furuyama K, Kodama S, Horiguchi M, Kuhara T, et al. Reduction of Ptf1a gene dosage causes pancreatic hypoplasia and diabetes in mice. Diabetes (2008) 57:2421–31. doi: 10.2337/db07-1558
91. Altobelli E, Blasetti A, Verrotti A, Di Giandomenico V, Bonomo L, Chiarelli F. Size of pancreas in children and adolescents with type I (insulin-dependent) diabetes. J Clin Ultrasound JCU (1998) 26:391–5. doi: 10.1002/(SICI)1097-0096(199810)26:8<391::AID-JCU3>3.0.CO;2-D
92. Campbell-Thompson ML, Filipp SL, Grajo JR, Nambam B, Beegle R, Middlebrooks EH, et al. Relative Pancreas Volume Is Reduced in First-Degree Relatives of Patients With Type 1 Diabetes. Diabetes Care (2019) 42:281–7. doi: 10.2337/dc18-1512
93. Miyatsuka T, Matsuoka TA, Shiraiwa T, Yamamoto T, Kojima I, Kaneto H. Ptf1a and RBP-J cooperate in activating Pdx1 gene expression through binding to Area III. Biochem Biophys Res Commun (2007) 362:905–9. doi: 10.1016/j.bbrc.2007.08.076
94. Wiebe PO, Kormish JD, Roper VT, Fujitani Y, Alston NI, Zaret KS, et al. Ptf1a binds to and activates area III, a highly conserved region of the Pdx1 promoter that mediates early pancreas-wide Pdx1 expression. Mol Cell Biol (2007) 27:4093–104. doi: 10.1128/MCB.01978-06
95. Fujimoto K, Polonsky KS. Pdx1 and other factors that regulate pancreatic beta-cell survival. Diabetes Obes Metab (2009) 11 Suppl 4:30–7. doi: 10.1111/j.1463-1326.2009.01121.x
96. O’Carroll AM, Howell GM, Roberts EM, Lolait SJ. Vasopressin potentiates corticotropin-releasing hormone-induced insulin release from mouse pancreatic beta-cells. J Endocrinol (2008) 197:231–9. doi: 10.1677/JOE-07-0645
97. Hashimoto K, Nishioka T, Takao T, Numata Y. Low plasma corticotropin-releasing hormone (CRH) levels in patients with non-insulin dependent diabetes mellitus (NIDDM). Endocr J (1993) 40:705–9. doi: 10.1507/endocrj.40.705
98. Kveberg L, Ryan JC, Rolstad B, Inngjerdingen M. Expression of regulator of G protein signalling proteins in natural killer cells, and their modulation by Ly49A and Ly49D. Immunology (2005) 115:358–65. doi: 10.1111/j.1365-2567.2005.02174.x
99. Lippert E, Yowe DL, Gonzalo JA, Justice JP, Webster JM, Fedyk ER, et al. Role of regulator of G protein signaling 16 in inflammation-induced T lymphocyte migration and activation. J Immunol (2003) 171:1542–55. doi: 10.4049/jimmunol.171.3.1542
100. Suurvali J, Pahtma M, Saar R, Paalme V, Nutt A, Tiivel T, et al. RGS16 restricts the pro-inflammatory response of monocytes. Scand J Immunol (2015) 81:23–30. doi: 10.1111/sji.12250
101. Lachmandas E, Thiem K, van den Heuvel C, Hijmans A, de Galan BE, Tack CJ, et al. Patients with type 1 diabetes mellitus have impaired IL-1beta production in response to Mycobacterium tuberculosis. Eur J Clin Microbiol Infect Dis (2018) 37:371–80. doi: 10.1007/s10096-017-3145-y
102. Shen TC, Lin CL, Wei CC, Liao WC, Chen WC, Chen CH, et al. Increased risk of tuberculosis in patients with type 1 diabetes mellitus: results from a population-based cohort study in Taiwan. Medicine (2014) 93:e96. doi: 10.1097/MD.0000000000000096
103. Smith MJ, Simmons KM, Cambier JC. B cells in type 1 diabetes mellitus and diabetic kidney disease. Nat Rev Nephrol (2017) 13:712–20. doi: 10.1038/nrneph.2017.138
104. Hinman RM, Cambier JC. Role of B lymphocytes in the pathogenesis of type 1 diabetes. Curr Diabetes Rep (2014) 14:543. doi: 10.1007/s11892-014-0543-8
105. Stechova K, Kolar M, Blatny R, Halbhuber Z, Vcelakova J, Hubackova M, et al. Healthy first degree relatives of patients with type 1 diabetes exhibit significant differences in basal gene expression pattern of immunocompetent cells compared to controls: expression pattern as predeterminant of autoimmune diabetes. Scand J Immunol (2011). doi: 10.1111/j.1365-3083.2011.02637.x
Keywords: gene expression, type 1 diabetes, auto-antibody positive, non-obese diabetic mice, pancreas, biomarker, FCGR2B
Citation: Yip L, Fuhlbrigge R, Alkhataybeh R and Fathman CG (2020) Gene Expression Analysis of the Pre-Diabetic Pancreas to Identify Pathogenic Mechanisms and Biomarkers of Type 1 Diabetes. Front. Endocrinol. 11:609271. doi: 10.3389/fendo.2020.609271
Received: 22 September 2020; Accepted: 16 November 2020;
Published: 23 December 2020.
Edited by:
Teresa Rodriguez-Calvo, Helmholtz Zentrum München, GermanyReviewed by:
Arnaud Zaldumbide, Leiden University Medical Center, NetherlandsIvan Gerling, University of Tennessee Health Science Center (UTHSC), United States
Copyright © 2020 Yip, Fuhlbrigge, Alkhataybeh and Fathman. This is an open-access article distributed under the terms of the Creative Commons Attribution License (CC BY). The use, distribution or reproduction in other forums is permitted, provided the original author(s) and the copyright owner(s) are credited and that the original publication in this journal is cited, in accordance with accepted academic practice. No use, distribution or reproduction is permitted which does not comply with these terms.
*Correspondence: Linda Yip, bGluZGF5aXBAc3RhbmZvcmQuZWR1