 Dominik Pesta1,2,3,4,5†
 Tomas Jelenik1,2†Oana-Patricia Zaharia1,2
 Pavel Bobrov2,6Sven Görgens2,7Kálmán Bódis1,2,8Yanislava Karusheva1,2
 Nina Krako Jakovljevic2,9
 Nebojsa M. Lalic7
 Daniel F. Markgraf1,2Volker Burkart1,2
 Karsten Müssig1,2,8
 Birgit Knebel2,10Jörg Kotzka2,10Jürgen Eckel2,7Klaus Strassburger2,6
 Julia Szendroedi1,2,8
 Michael Roden1,2,8* on behalf of the GDS group
- 1Institute for Clinical Diabetology, German Diabetes Center, Leibniz Center for Diabetes Research at Heinrich Heine University, Düsseldorf, Germany
- 2German Center for Diabetes Research (DZD e.V.), Düsseldorf, Germany
- 3Institute of Aerospace Medicine, German Aerospace Center (DLR), Cologne, Germany
- 4Center for Endocrinology, Diabetes and Preventive Medicine (CEDP), University Hospital Cologne, Cologne, Germany
- 5Cologne Excellence Cluster on Cellular Stress Responses in Aging-Associated Diseases (CECAD), Cologne, Germany
- 6Institute for Biometrics and Epidemiology, German Diabetes Center, Leibniz Center for Diabetes Research at Heinrich-Heine University, Düsseldorf, Germany
- 7Paul-Langerhaus-Group Integrative Physiology, German Diabetes Center, Düsseldorf, Germany
- 8Department of Endocrinology and Diabetology, Medical Faculty and University Hospital, Heinrich Heine University Düsseldorf, Düsseldorf, Germany
- 9Clinics for Endocrinology, Diabetes and Metabolic Diseases, University Clinical Centre of Serbia, Faculty of Medicine, University of Belgrade, Belgrade, Serbia
- 10Institute of Clinical Biochemistry and Pathobiochemistry, German Diabetes Center, Leibniz Center for Diabetes Research at Heinrich-Heine University, Düsseldorf, Germany
The rs540467 SNP in the NDUFB6 gene, encoding a mitochondrial complex I subunit, has been shown to modulate adaptations to exercise training. Interaction effects with diabetes mellitus remain unclear. We assessed associations of habitual physical activity (PA) levels with metabolic variables and examined a possible modifying effect of the rs540467 SNP. Volunteers with type 2 (n=242), type 1 diabetes (n=250) or normal glucose tolerance (control; n=139) were studied at diagnosis and subgroups with type 1 (n=96) and type 2 diabetes (n=95) after 5 years. Insulin sensitivity was measured by hyperinsulinemic-euglycemic clamps, oxygen uptake at the ventilator threshold (VO2AT) by spiroergometry and PA by questionnaires. Translational studies investigated insulin signaling and mitochondrial function in Ndufb6 siRNA-treated C2C12 myotubes, with electronic pulse stimulation (EPS) to simulate exercising. PA levels were 10 and 6%, VO2AT was 31% and 8% lower in type 2 and type 1 diabetes compared to control. Within 5 years, 36% of people with type 2 diabetes did not improve their insulin sensitivity despite increasing PA levels. The NDUFB6 rs540467 SNP modifies PA-mediated changes in insulin sensitivity, body composition and liver fat estimates in type 2 diabetes. Silencing Ndufb6 in myotubes reduced mitochondrial respiration and prevented rescue from palmitate-induced insulin resistance after EPS. A substantial proportion of humans with type 2 diabetes fails to respond to rising PA with increasing insulin sensitivity. This may at least partly relate to a polymorphism of the NDUFB6 gene, which may contribute to modulating mitochondrial function.
Clinical Trial Registration: ClinicalTrials.gov, identifier NCT01055093. The trial was retrospectively registered on 25th of January 2010.
Introduction
Exercise training improves insulin sensitivity and ameliorates the risk of diabetes onset and cardiovascular mortality in type 2 diabetes (T2D) (1–3), but may also be beneficial for type 1 diabetes (T1D) (4). Nevertheless, the effects of structured exercise training, i.e. aerobic or resistance training, vary considerably (5), with up to 63% of participants being non-responders with regard to improvements of glucose homeostasis or cardiovascular outcomes (5, 6). This phenomenon and its causes have not yet been addressed in a prospective manner in newly-diagnosed diabetes.
Impaired response to exercise training may not only result from acquired, but also from inherited factors (7, 8). We previously demonstrated that an SNP in the NADH dehydrogenase-1ß subcomplex subunit 6 (NDUFB6) of the mitochondrial complex I relates to impaired muscle mitochondrial plasticity after exercise training in first-degree relatives of type 2 diabetic patients (7, 9). Presence of the G/G genotype (rs540467) was associated with exercise-mediated increases in muscle ATP synthase flux (7) and insulin sensitivity (9) with responders to exercise being more frequently carriers of the G allele of the NDUFB6 rs540467 polymorphism. These associations remain unclear in patients with diabetes mellitus.
Increasing habitual physical activity (PA), i. e. any type of muscular activity leading to increased energy expenditure, lowers the risk of diabetes in adults with impaired fasting glucose (10) and associates with reductions in liver fat content (11). PA could therefore represent an attractive alternative to structured exercise training for diabetes patients for improving insulin sensitivity and body composition. Despite growing evidence for non-responsiveness to exercise interventions, less is known about a possible non-response to habitual PA in patients with diabetes mellitus. Particularly in these patients, it is unclear whether (i) lower habitual PA effects metabolism, e. g. insulin sensitivity, body composition and lipid metabolism at time of diagnosis and during disease progression, (ii) the responder/non-responder status also extends to habitual PA-mediated beneficial effects and if so, (iii) whether responsiveness of PA-mediated improvements in metabolism relate to a gene polymorphism and to gene-related metabolic effects in T2D.
Using comprehensive phenotyping and based on previous observations, we performed a longitudinal analysis of how the polymorphism influences the relationship between changes in PA and changes in metabolism over five years in people with diabetes mellitus and healthy humans and the underlying cellular mechanisms in a muscle cell culture model suitable to assess effects of PA in vitro (12).
Materials and Methods
The prospective observational German Diabetes Study (GDS) monitors people with recent-onset diabetes and glucose-tolerant humans (ClinicalTrial.gov registration no: NCT01055093) (13). Volunteers consented to a protocol, approved by the ethics board of Heinrich-Heine-University Düsseldorf and performed according to the 2013 version of the Declaration of Helsinki. Inclusion and exclusion criteria of the GDS applied (13). This longitudinal analysis included participants enrolled into GDS between 02/2009 and 04/2020 with complete data sets regarding the relevant variables.
Participants
Individuals with recently diagnosed type 1 (n=250), type 2 (n=242) or without diabetes (control, n=139) were included. From these collectives, a subgroup of individuals with type 1 (n=96) and type 2 diabetes (n=95) was available for the 5-years follow-up analysis. As the GDS is an ongoing observational study, by design, 48% of patients have not reached the follow-up time point of 5 years disease duration at the time of analysis. The “true” loss to follow-up is ~13% (14) and lies within the range of comparable cohorts (15, 16). All metabolic tests were performed under the following conditions: (i) carbohydrate-rich nutrition for 3 days, (ii) a physical activity break of 48 hours and (iii) overnight fasting for 10-12 hours before the test.
Physical Activity and Dietary Intake Reporting
Self-reported PA levels over the preceding 12 months were assessed by the German version (17) of the modified Baecke questionnaire, validated for people with diabetes (18) which showed good agreement with triaxial-accelerometry and are valid for larger cohort studies (19). The Baecke questionnaire inquiries about sport and leisure type of activity as well as activity at work on a 5-point scale. The higher the score, the higher the level of PA. The combined Baecke score was calculated as the sum of the sports-, leisure- and work score. The EPIC-Potsdam Food Frequency Questionnaire was used to assess dietary intake in a subgroup with type 2 diabetes (n=37) (20). This questionnaire assesses average food intake during the past 12 months and allows for estimating macronutrient and total energy intake. After diabetes diagnosis, physicians give general lifestyle recommendations to their patients to improve their physical activity levels, but there was no structured lifestyle intervention provided.
Spiroergometry
All participants performed an incremental exhaustive exercise test on a cycle ergometer (Viasprint 200, Ergoline, Bitz, Germany) for recording VO2peak and VO2 at the aerobic threshold (VO2AT). VO2AT was assessed using the V-slope method (21). As an index of physical fitness, VO2AT has repeatedly been shown to better predict maximal endurance performance (22). Exhaustion was defined according to the guidelines on cardiopulmonary exercise testing by the presence of one or more of the following criteria: (i) respiratory exchange ratio (RER) >1.15 or if (ii) predicted maximum heart rate (HRmax), (iii) predicted VO2peak and/or a plateau, or (iv) predicted maximal work rate were achieved (23). Participants not achieving the exhaustion criteria were excluded from the analysis.
Bioimpedance Analysis (BIA)
BIA was carried out after an overnight fast and was used for the estimation of fat mass (FM), percent fat mass (%FM) and fat-free mass (BioElectrical Impedance Analyzer System, RJL Systems, Detroit, MI).
Modified Botnia Clamp Test
This metabolic test was used to assess insulin sensitivity and secretion after overnight fasting and a physical activity break of 48 hours (13). An i. v. glucose tolerance test was performed for 60 minutes to measure total C-peptide secretion from the incremental area under the curve for C-peptide levels. Then a hyperinsulinemic-eugycemic clamp using isotopic dilution ([6,6-2H2]glucose) was performed to assess whole-body insulin sensitivity. The hyperinsulinemic-eugycemic clamp test was started with a priming insulin dose (10 mU per kg body weight per min for 10 minutes i.v.; Insuman Rapid, Sanofi, Frankfurt, Germany) followed by a constant insulin infusion (1.5 mU per kg body weight per min) over a 3-hours period. Blood glucose concentration was maintained at 90 mg/dl by a variable i. v. infusion of 20% glucose. Glucose infusion rates during steady state of the clamp were used to calculate whole-body insulin sensitivity and expressed as M value after glucose space correction (13).
Glucagon Stimulation Test
For this metabolic test, volunteers received an i. v. bolus of 1 mg glucagon to obtain a measure of glucagon-stimulated C-peptide (insulin) secretion capacity from difference of C-peptide (insulin) concentrations at 6 and 0 minutes (13).
Magnetic Resonance (MR) Spectroscopy
A subgroup of people with type 2 diabetes (n=18) underwent 1H MR spectroscopy using a stimulated echo acquisition mode (STEAM) sequence in a 3-T MR scanner (Achieva X-series, Philips Healthcare, Best, Netherlands), to assess hepatocellular lipid content (24).
Fatty Liver Index (FLI) and Homeostatic Model Assessment for Insulin Resistance (HOMA-IR)
The FLI was calculated from BMI, waist circumference, serum triglycerides and gamma-glutamyl transferase as a noninvasive surrogate index of hepatic steatosis (25). HOMA-IR was calculated according to the formula: fasting insulin (µU/l) * fasting glucose (mmol/1)/22.5 (26).
Genotyping
Genomic DNA was extracted from whole blood (27) and genotyping was conducted using real-time polymerase chain reaction-based allelic discrimination according to manufacturer’s recommendations with probe-based genotyping assays for the single-nucleotide polymorphism rs540467 in the NDUFB6 gene (Life Technologies, Darmstadt, Germany). The genotype concordance of >99.8% was determined using TaqMan Genotyper software v.1.3 (Life Technologies). All variants were in Hardy-Weinberg-equilibrium and re-sequencing of 1% of randomly chosen individuals was conducted for data validation and quality management, confirming genotyping results by 100%. Due to the low number of AA carriers, A allele carriers (GA and AA) were combined for analyses.
Cell Culture and siRNA Transfection
C2C12 myoblasts (American Type Culture Collection, Manassas, VA, USA) were grown in DMEM (Gibco, Berlin, Germany), 10% FBS and antibiotics (100 U/mL penicillin and 100 mg/mL streptomycin) in humid air (5% CO2, 37°C) and differentiated into myotubes by switching to DMEM with 2% horse serum (Gibco, Berlin, Germany) up to 6 days (28). Silencing experiments in differentiated C2C12 myotubes were performed using FlexiTube small interfering RNA (siRNA) and HiPerfect (Qiagen) according to the manufacturer’s instructions. Control cells were treated with negative control siRNA (AllStars Negative Control siRNA, Qiagen, Hilden, Germany). Cells were studied under basal or palmitate-treated (0.2 mM, 24 h) conditions, with and without electronic pulse stimulation (EPS) contraction (n=4-6) (29). EPS (1 Hz, 2 ms and 11.5 V) was applied for 24 h to fully differentiated C2C12 myotubes (day 6) in six-well dishes using a C-Dish combined with a pulse generator emitting bipolar stimuli (C-Pace 100; IonOptix, Milton, MA, USA) (29). Cells that were not stimulated, but were incubated with a C-Dish for the same timepoint (24 h), were used as controls. Insulin signaling was assessed after 10 min stimulation with 100 nM insulin (I5523, Sigma, Munich, Germany).
High-Resolution Respirometry
Mitochondrial function was assessed by high-resolution respirometry in 0.25*106/ml digitonin-permeabilized myotubes (Oxygraph-2k, Oroboros Instruments, Innsbruck, Austria) (30). Complex I-linked leak respiration was assessed using malate (2 mM), pyruvate (10 mM) and glutamate (10 mM) and β-oxidation-linked electron-transferring flavoprotein complex (CETF)-respiration using malate (2 mM) and octanoyl-carnitine (0.2 mM). State 3 respiration was induced in both protocols by addition of ADP (2.5 mM), state 4o by oligomycin (5 µM), maximal respiration (state u) by stepwise increments of 0.25 µM carbonyl-cyanide-p-trifluoromethoxyphenylhydrazone (FCCP) (30). Respiratory control ratio (RCR) was calculated as state 3 over state 4o, leak control ratio (LCR) as leak state over state 4o.
Quantitative Real-Time (qRT) PCR
Total RNA was isolated using RNeasy kit (Qiagen, Hilden, Germany). mRNA expression was measured using pre-designed primers (Quantitect Primer Assay, Qiagen) and GoTaq qPCR Master Mix (Promega, Mannheim, Germany) in SYBR Green-based qRT PCR.
Western Blots
Reagents for SDS-PAGE were supplied by GE Healthcare (Munich, Germany) and Sigma and rotiphorese by Carl Roth (Karlsruhe, Germany). Antibodies used were anti-phosphorylated Akt at serine 473 (pAkt-Ser473; Cell Signalling Technology), ß-actin (Sigma) and horseradish peroxidase-conjugated goat anti-rabbit and anti-mouse IgG (Promega, Mannheim, Germany).
Laboratory Analyses
For all parameters [HbA1c, plasma glucose, C-peptide, lipids, high-sensitivity C-reactive protein (hsCRP)], fasting blood samples were taken at baseline and after 5 years using standardized tubes and tube additives and analyzed using identical instruments and methods as described previously (13).
Statistics
Data are presented as percentages (%), mean ± SD or median [25th, 75th percentiles] in case of skewed distributed variables, as appropriate. For group comparisons, analyses were adjusted for age, sex and BMI. The Tukey-Kramer method was used to adjust p-values for multiple comparisons or pairwise comparisons of three groups.
Univariate and multivariable linear least squared regression was performed to analyze the association of PA levels and other variables. In multivariable analyses, regression coefficients were adjusted for age, sex and BMI. To investigate whether the slope between NDUF genotypes differ, an interaction term of the genotype (dominant coding) and the independent variable were added to the model and tests for interaction were performed. Given a sample size of n=90, small to medium effect sizes (Cohens f=0.08) can be detected with a power of 80% (31). Fisher’s exact test was used to compare categorical variables. For skewed distributed variables (M-value, fasting C-peptide, fasting triglycerides, hsCRP), data was log-transformed before analyses. P-values ≤0.05 after correction for multiple testing were considered to indicate significant differences. Statistical analyses were performed with SAS (version 9.3; SAS Institute, Cary, NC) and figures were computed with Graph Prism (version 7.04 for Windows; GraphPad Software, La Jolla California USA).
Results
Physical Activity, Exercise Capacity and Metabolism in Recent-Onset Diabetes (Baseline)
According to diabetes type, age and BMI differed between groups (Table 1) so that all further statistical analyses were adjusted for these confounders. Waist-to-hip ratio (WHR) and %FM were highest in T2D compared to T1D and glucose-tolerant persons. The combined Baecke index was 6% and 10% lower in T1D and T2D compared to glucose-tolerant individuals (controls). Similarly, the sports index was also lower in the diabetes groups, while leisure and work indices were not different between groups. VO2AT was 14% and 23% lower in T1D and T2D compared to controls, respectively.
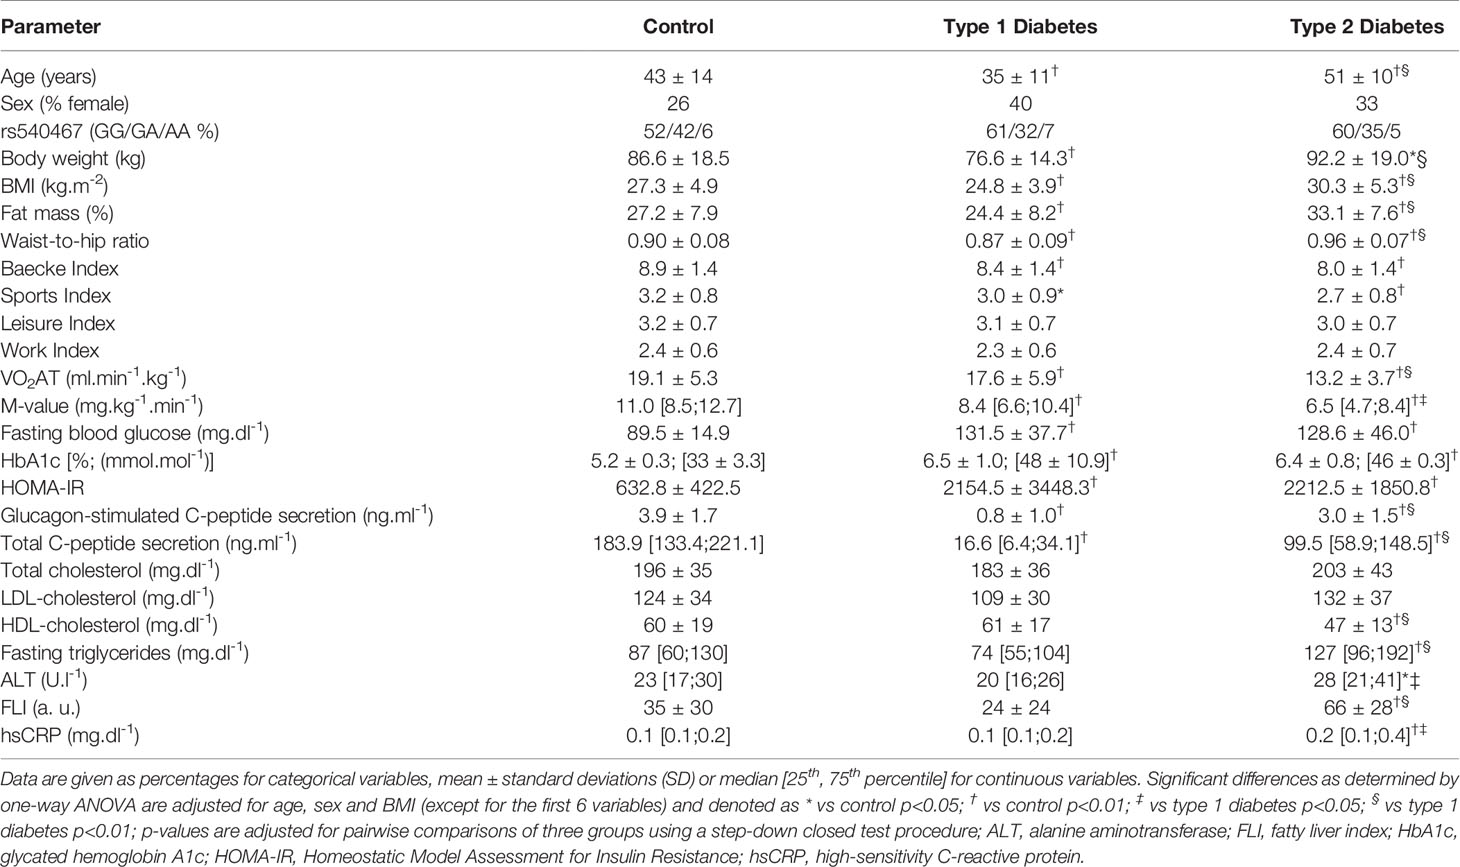
Table 1 Baseline characteristics of healthy controls (n=84), patients with type 1 (n=212) and type 2 (n=215) diabetes.
Whole-body insulin sensitivity (M-value) was 20% and 40% lower in T1D and T2D compared to controls, respectively. The same held true for HOMA-IR, a surrogate parameter of insulin resistance. Beta-cell function (glucagon- and glucose-stimulated C-peptide secretion) was lower in T1D compared to the other groups. Glycemic control (fasting blood glucose, HbA1c) was similarly excellent in both diabetes groups, but - as expected - higher than in controls. Compared to both T1D and controls, persons with T2D had lower HDL-cholesterol, but higher triglycerides. Alanine aminotransferase (ALT), FLI and hsCRP levels were highest in T2D.
Five-Year Follow-up of Physical Activity, Exercise and Metabolic Performance
Regression analyses of the changes over the 5-years follow-up revealed a trend for an association of changes in PA over 5 years and changes in M-value in TD2 (Figure 1A), but not T1D (Figure 1B). However, changes in PA levels neither affected HbA1c nor insulin secretion in individuals with T2D. Changes in PA levels, as assessed from combined Baecke and leisure indices, associated with lower body weight (BW) in type 2, but not T1D (Figures 1C, D). In T2D only, increased PA associated negatively with the FLI (Figures 1E, F), whereas increased PA was positively associated with VO2AT in both diabetes types (Figures 1G, H). In support of this observation, we found a trend of a negative association between changes in 1H MRS-measured hepatocellular lipid content and changes in PA in a subgroup of 18 people (p=0.06, β=-4.35 ± 2.10). Lower fasting plasma glucose associated with higher PA and leisure activity (p=0.01, β=-11.3 ± 4.4) and higher HDL-cholesterol levels related to increased PA (p=0.02, β =1.85 ± 0.75) in T2D. Furthermore, increased PA over 5 years associated with lower FM and lower waist circumference in T2D (all p<0.05). In order to assess responder status based on changes in insulin sensitivity in response to changes in PA levels, we divided individuals with type 2 and type 1 diabetes into four groups, Q1, Q2, Q3 and Q4 (Figures 1A, B). During the 5-year period within T2D, group 1 (Q1; n=23) increased their PA levels and insulin sensitivity, group 2 (Q2; n=8) decreased PA levels and worsened fasting blood glucose, group 3 (Q3; n=26), decreased both insulin sensitivity and PA levels and group 4 (Q4; n=37) and increased PA levels without any improvement in insulin sensitivity. Members of Q4, representing 36% of the whole cohort, were therefore defined as non-responders with regard to this endpoint.
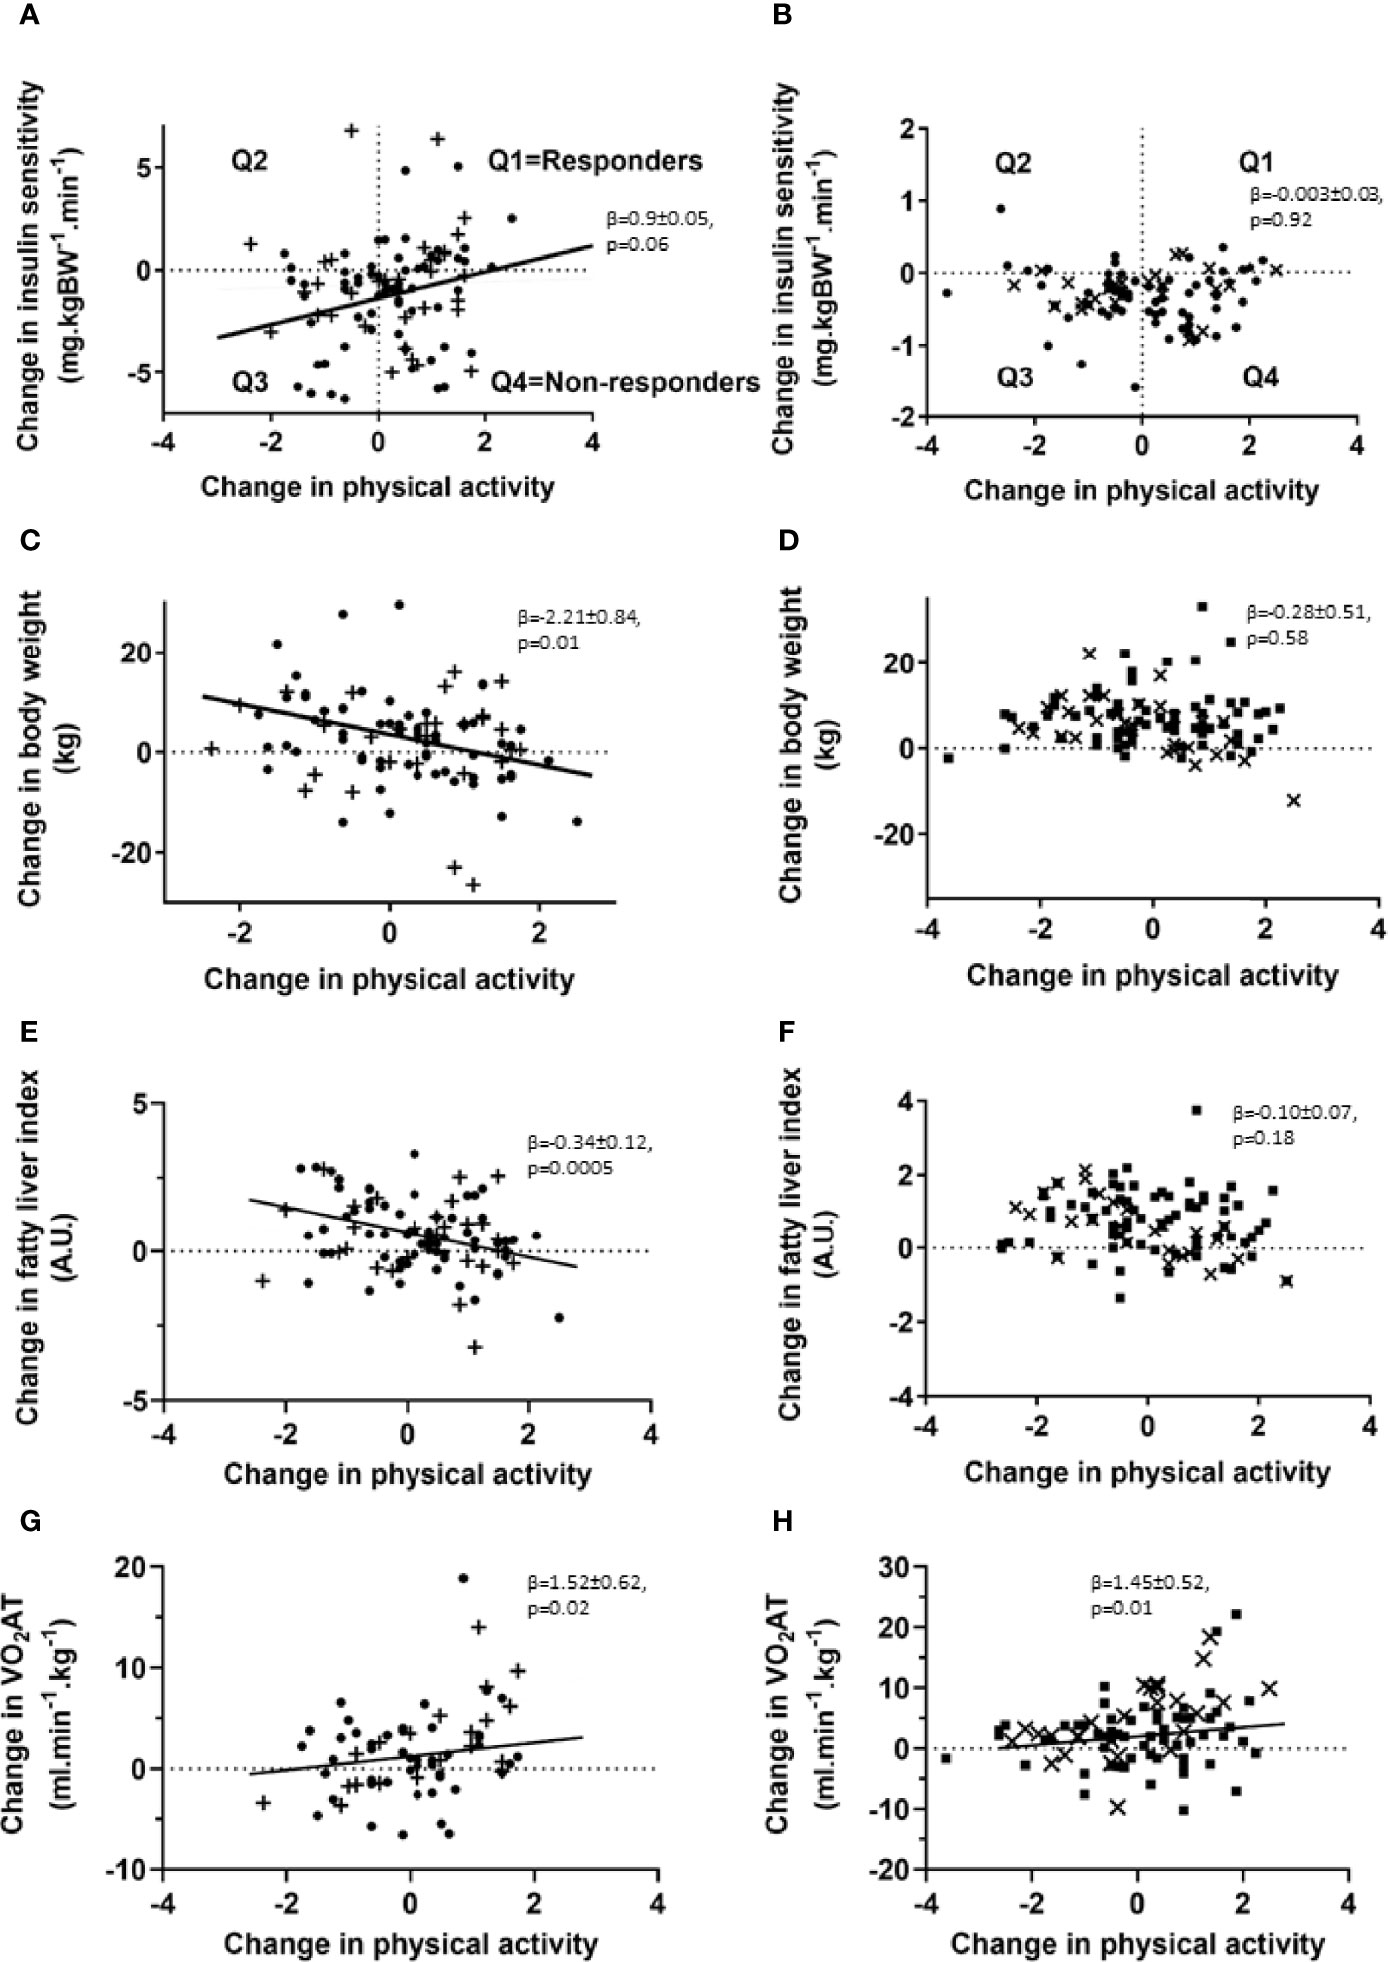
Figure 1 Association of changes in PA levels and insulin sensitivity, body weight, liver fat estimates and exercise capacity in individuals with type 2 and type 1 diabetes. Association of changes in PA levels and insulin sensitivity (A, B), body weight (C, D), liver fat estimates (E, F) and physical performance (G, H) for patients with type 2 (left panel, • – G/G allele carriers; + - G/A and A/A allele carriers) and type 1 diabetes (right panel, ▪ – G/G allele carriers; x – G/A and A/A allele carriers) at the 5-year follow-up time point. Patients with type 2 and type 1 diabetes were subdivided into four groups (Q1, Q2, Q3, Q4) based on response to changes in insulin sensitivity and PA levels. Univariate and multivariable linear least squared regression method was performed, adjusted for baseline values of both PA levels and the investigated clinical parameter. N=95 for changes in insulin sensitivity, N=95 for body weight changes and N=67 for performance changes in individuals with type 2 diabetes and N=100 for changes in insulin sensitivity, N=101 for body weight changes and N=90 for performance changes in individuals with type 1 diabetes. VO2 AT: oxygen uptake at the first ventilatory threshold.
Acquired and Inherited Factors Determining Responder Status to Increases in Physical Activity
We then assessed changes of metabolic parameters within these groups over the 5-year period (Table 2). Within T2D, Q1 - in whom both PA indices and insulin sensitivity improved - decreased their fasting C-peptide, ALT and hsCRP levels. Q2 only showed increased LDL-cholesterol levels and decreased C-peptide secretion. Notably, in Q3 - where all PA indices and insulin sensitivity worsened - most anthropometric and metabolic parameters, including BW, BMI, FM, fasting plasma glucose, HbA1c, total C-peptide secretion, triglycerides and hsCRP deteriorated over the 5-year period. In Q4, fasting plasma glucose, HbA1c and total C-peptide secretion deteriorated, despite improvements of PA indices and VO2AT. Among T1D, Q1 increased their HbA1c and combined Baecke and sports index as well as VO2AT while decreasing their fasting C-peptide and total C-peptide secretion levels. Q2 improved their VO2AT and BW, but decreased their fasting C-peptide, glucagon-stimulated C-peptide and total C-peptide secretion levels as well as their combined Baecke and leisure index. Interestingly, in Q3, BW, BMI, diastolic blood pressure, and %FM as well as fasting plasma glucose, HbA1c, fasting C-peptide, glucagon-stimulated C-peptide secretion, total C-peptide secretion and triglycerides deteriorated over 5 years. Q4 showed an increase in BW, BMI, HbA1c, %FM and VO2AT and a deterioration of beta cell function (Table 3).
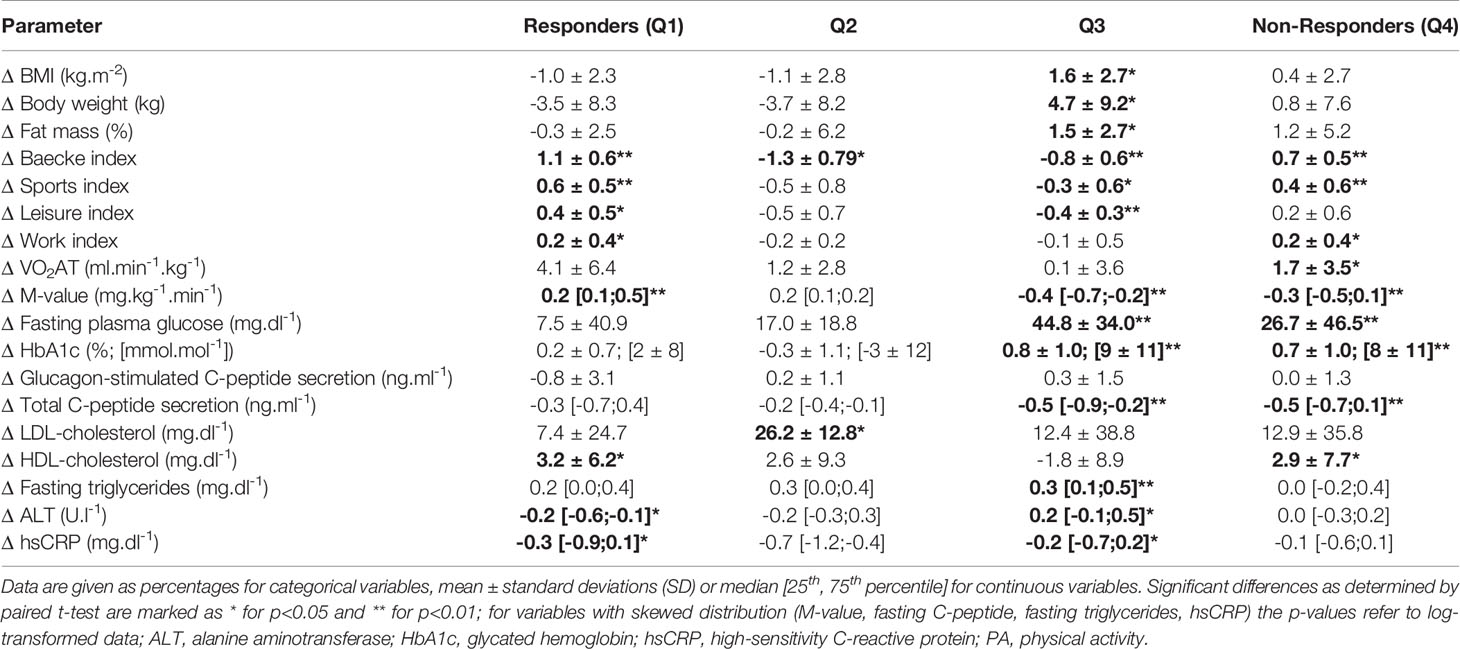
Table 2 Subgroup analysis of changes (Δ) of anthropometric, performance and metabolic parameters based on response to changes in whole-body insulin sensitivity and PA participation over 5 years for patients with type 2 diabetes, divided into responders (n=17), Q2 (n=5), Q3 (n=23) and non-responders (n=30).
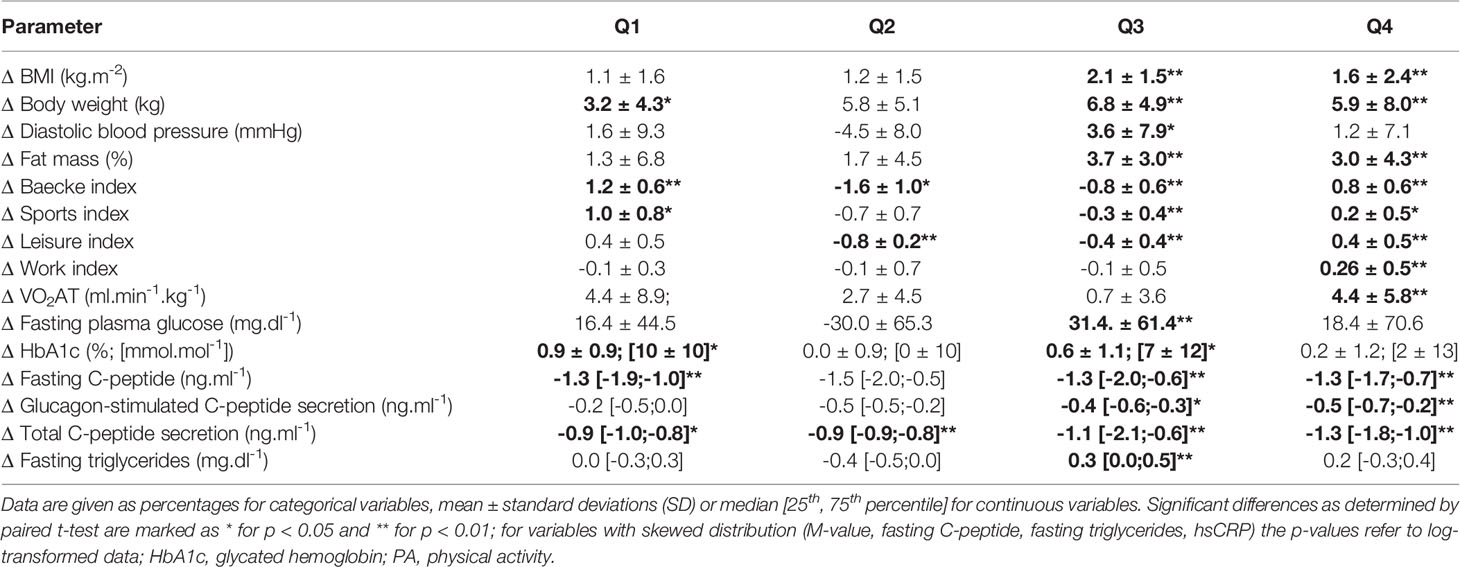
Table 3 Subgroup analysis of changes (Δ) of anthropometric, performance and metabolic parameters based on response to changes in whole-body insulin sensitivity and PA participation over 5 years for patients with type 1 diabetes, divided into Q1 (n=9), Q2 (n=5), Q3 (n=33) and Q4 (n=34).
PA-Mediated Metabolic Effects Stratified by Genotype
Based on previous findings showing NDUFB6 gene polymorphisms modulating responses to exercising in patients with T2D (7, 9), and the observed association of changes in PA and insulin sensitivity in these patients only, we stratified further analyses by the rs540467 SNP. Individuals with T2D carrying the G/G genotype of the NDUFB6 SNP rs540467 exhibited a positive correlation between changes in M-value and PA levels compared to carriers of the A-allele showing no such association of these variables (Figures 2A, B). A linear multivariable model revealed a trend for interaction of the different alleles with PA-mediated changes in insulin sensitivity (p=0.07). Of note, the genotype frequency of the A allele of rs540467 previously associated to non-response to exercise training was 38% in Q2-Q4 and 22% in Q1-Q3 (p=0.12). We further found a decrease of waist circumference (p=0.03, β=-1.52 ± 0.68) and FLI (Figures 2C, D) with increasing PA in T2D individuals carrying the G/G allele, but not in A allele carriers. In addition, there were significant interactions between genotypes and PA-mediated changes of waist circumference and FLI (both p<0.05). No difference were found between SNP carriers at baseline or at the follow-up time point regarding the use of medication (Supplemental Table 1), dietary composition and energy intake (Supplemental Table 2).
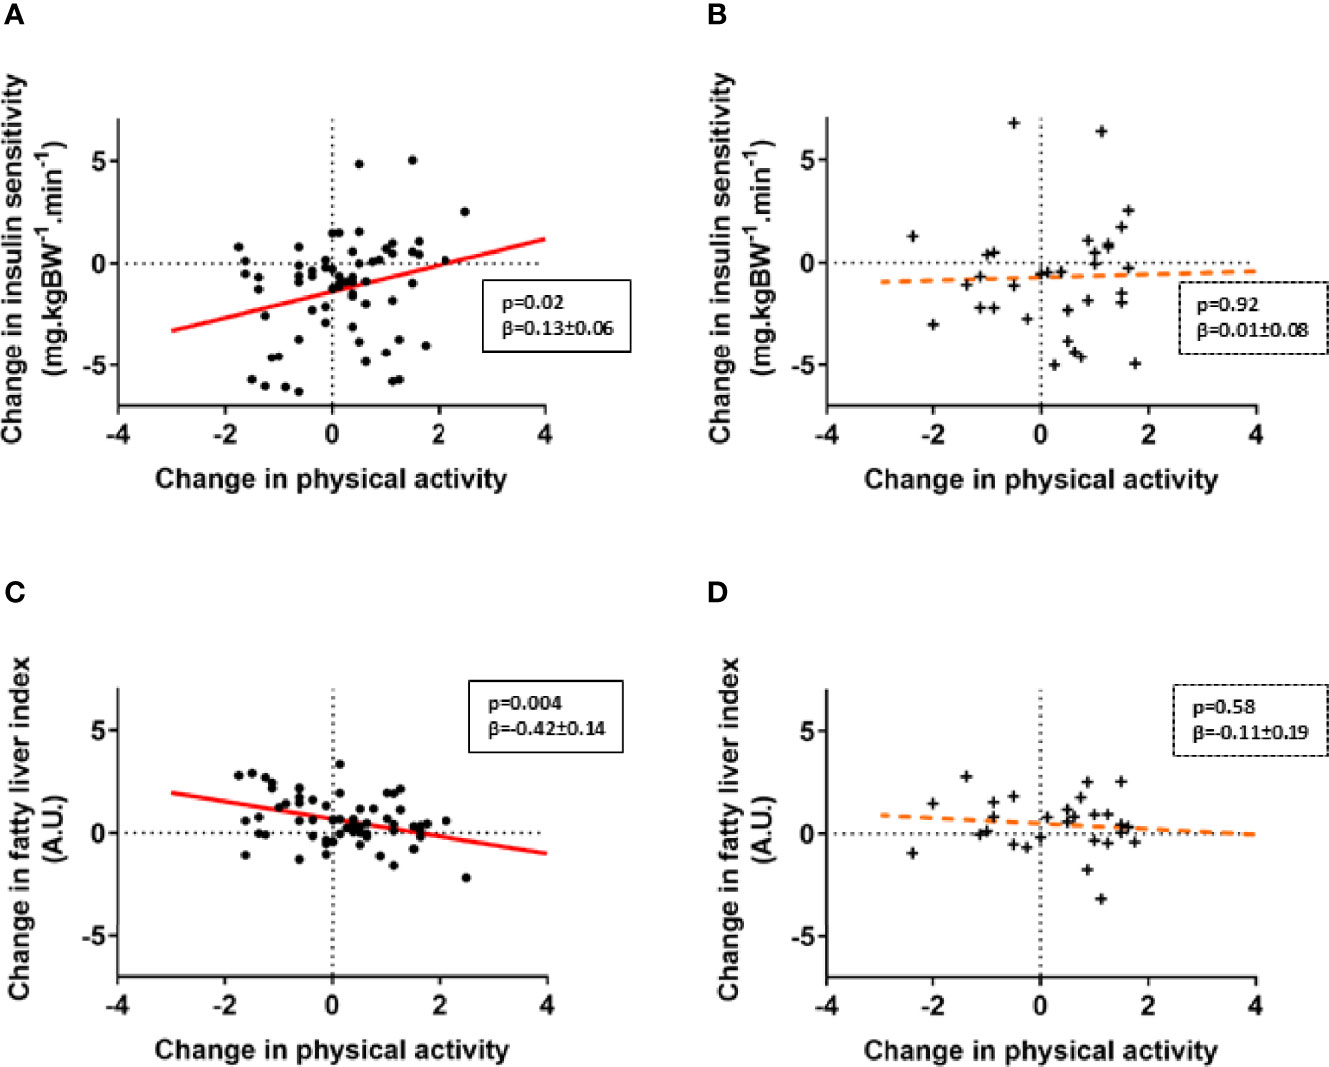
Figure 2 NDUFB6 SNP allele modulates responder status to changes in physical activity. Associations of changes in PA levels and insulin sensitivity (A, B) as well as liver fat estimates (C,D) are displayed for patients with type 2 diabetes, stratified according to genotype. Type 2 diabetes carriers of the G/G allele of the rs540467 single nucleotide polymorphism of the NDUFB6 gene are marked as dots (•), carriers of the G/A and A/A genotype are marked as crosses (+). The solid regression line depicts a strong trend or a significant association whereas the dotted line represents non-significant associations. Change in insulin sensitivity on the y-axis refer to ln M-value difference while change in physical activity on the x-axis refers to the Baecke index difference.
NDUFB6 Modulates Contraction-Induced Changes in Mitochondrial Function and Insulin Signaling in C2C12 Myocytes
In light of the association of the NDUFB6 SNP with the M-value, which mainly reflects muscle insulin sensitivity (32), and the previously reported lower mRNA and protein levels of NDUFB6 in muscles of humans with higher age or T2D (33, 34), we next examined the effects of reduced NDUFB6 expression in differentiated C2C12 myotubes, a cell culture model suitable to assess effects of PA in vitro (12). Ndufb6 was silenced on day 4 of myoblast differentiation, as the expression of NDUFB6 mRNA was maximal and remained stable from day 4 on (Figure 3A). Treatment for 24 h with siRNA, but not with control RNA reduced Ndufb6 protein levels by 40% (Figure 3B). Thus, all following experiments were performed 24 h after Ndufb6 silencing.
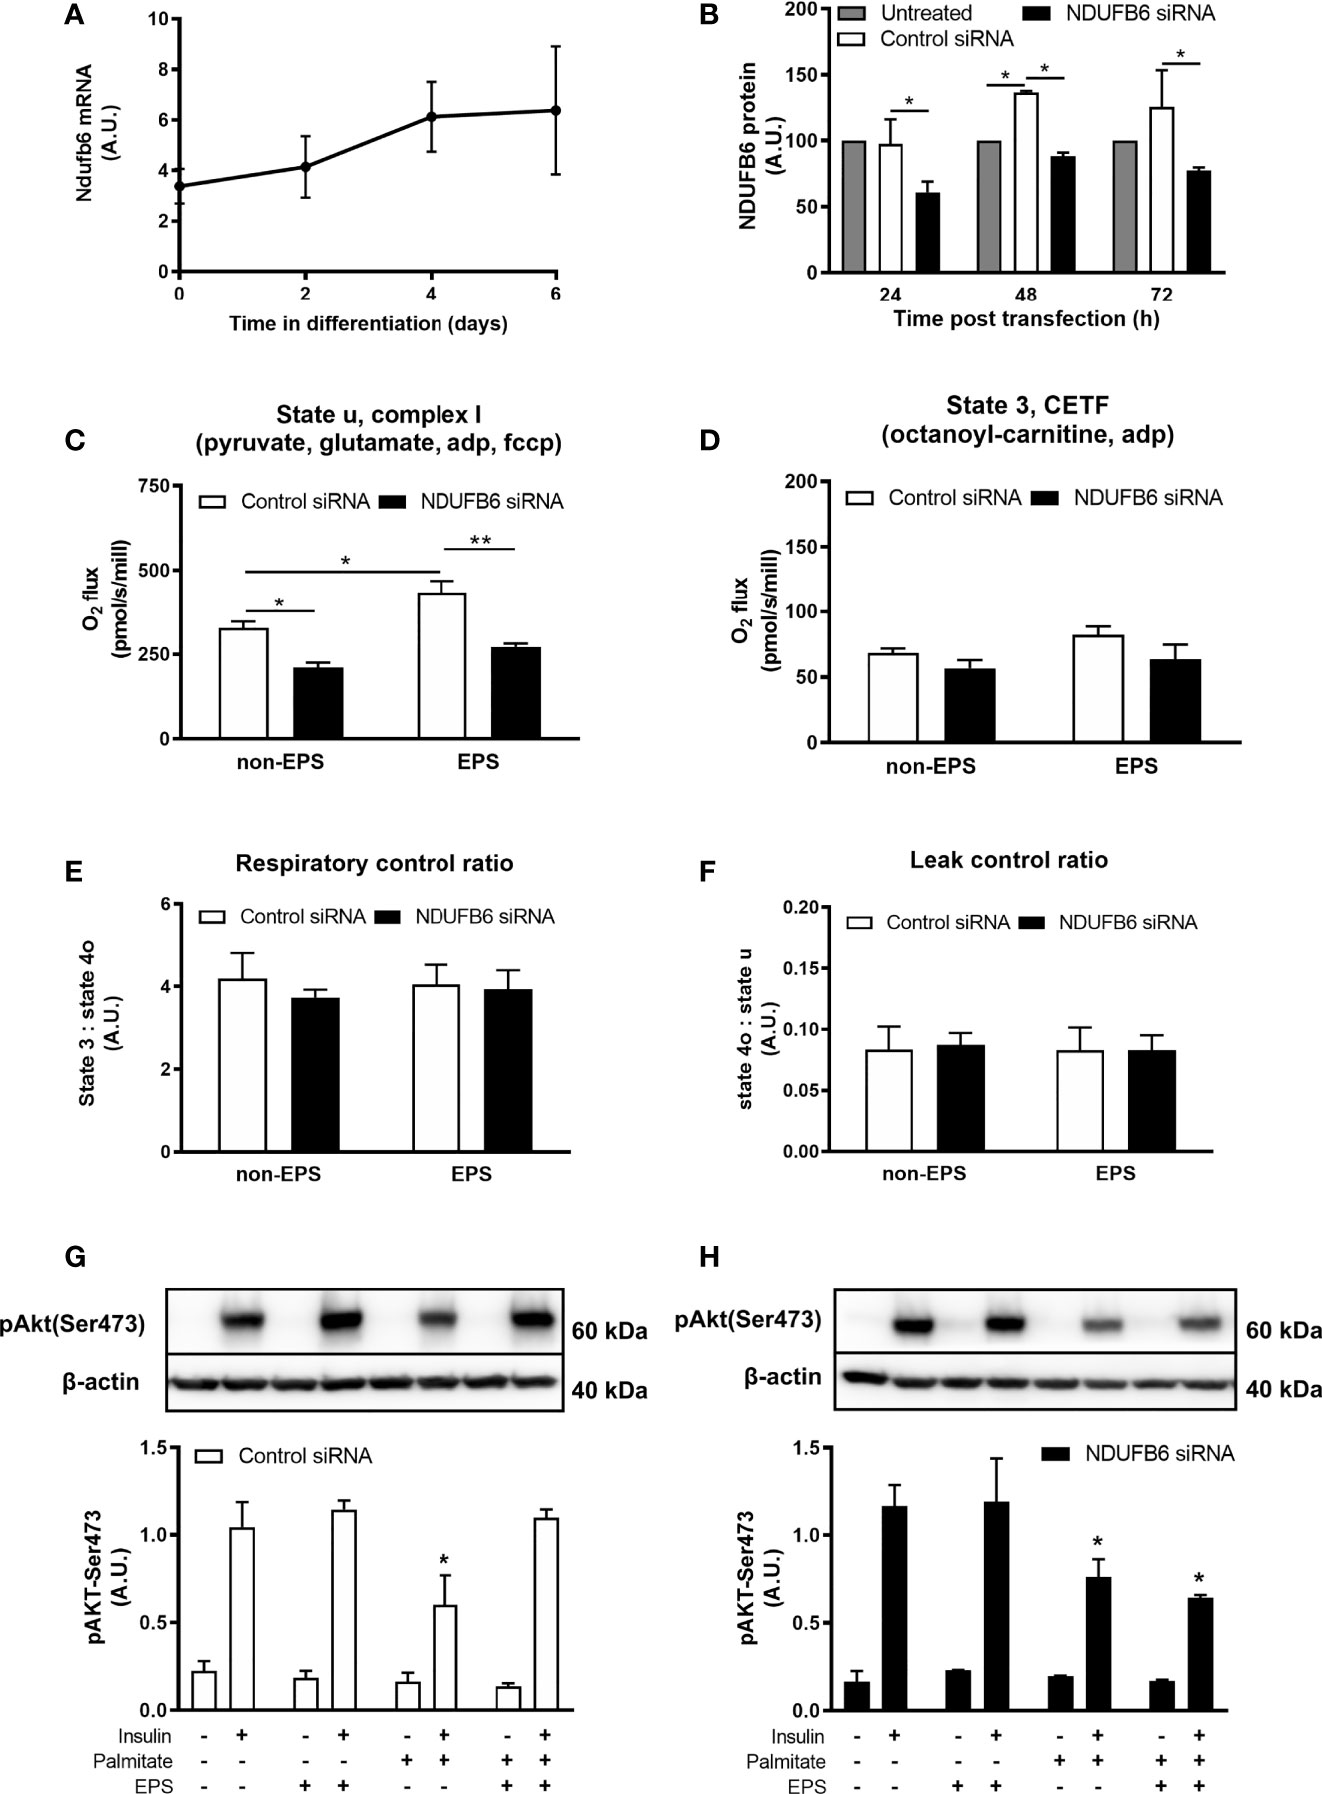
Figure 3 Ndufb6 expression after siRNA silencing and effects of the Ndufb6 silencing on mitochondrial function in differentiated C2C12 myotubes after EPS-induced contractions. Ndufb6 expression during differentiation of C2C12 myocytes (A) and protein levels (B) after siRNA silencing. Ndufb6 protein levels were normalized to GAPDH. State u, complex I-linked (C) respiration and electron-transferring flavoprotein complex (CETF)-linked (D) respiration as well as respiratory control ratio (E) and leak control ratio (F) were assessed at the basal (non-EPS) and EPS-induced contractions; an independent samples t-test was used for group-comparison. Insulin-stimulated Akt phosphorylation at Ser473 (pAkt-Ser473) after palmitate incubation and electric pulse stimulation (EPS)-induced contractions in differentiated C2C12 myotubes treated with control siRNA (G) or NDUFB6 siRNA (H); Data are expressed as mean ± SEM (n=3-4/group), *p < 0.05 and **p < 0.01 vs. corresponding basal and control or untreated condition.
Compared to control, Ndufb6 silencing decreased complex I-linked state u respiration by 36% in the absence of EPS-induced contractions (Figure 3C). Interestingly, EPS-induced contractions increased complex I-linked respiration in control, but not in Ndufb6 silenced myotubes (Figure 3C). Ndufb6 silencing neither affected CETF-linked respiration (Figure 3D) nor RCR (Figure 3E) or LCR (Figure 3F), indicators of mitochondrial coupling efficiency and proton leak. Taken together, in vitro inhibition of NDUFB6 leads to reduced mitochondrial respiration in this model.
We then tested the effects of EPS on insulin signaling after palmitate-induced insulin resistance. Palmitate inhibited insulin-stimulated pAkt-Ser473 in control myotubes, which was restored to control conditions (without palmitate) after EPS-induced contractions (Figure 3G). In contrast, EPS did not rescue palmitate-induced reduction of pAkt-Ser473 in Ndufb6-silenced myotubes (Figure 3H). Palmitate-induced reduction in pAkt-Ser473 was decreased by 35% in Ndufb6 siRNA when compared to control siRNA conditions after EPS exposure (0.64 ± 0.02 vs. 1.10 ± 0.05 AU; p<0.01), indicating that contractions were not able to protect against palmitate-induced insulin resistance after Ndufb6 silencing (Figures 3G, H).
Discussion
This study shows that (i) habitual PA is lower in T1D and T2D within the first year after diagnosis, (ii) increases in habitual PA over 5 years do not associate with improvements of insulin sensitivity in 36% of individuals with T2D, (iii) rs540467 SNP of the NDUFB6 gene is associated with PA-mediated changes in insulin sensitivity, body composition and liver fat estimates (iv) silencing NDUFB6 in myotubes lowers mitochondrial respiration and inhibits the contraction-mediated rescue from palmitate-induced insulin resistance. These findings suggest that a polymorphism related to mitochondrial function could contribute to modulating the effect of PA on important metabolic endpoints in T2D.
This study extends findings from previous observations of lower habitual PA in individuals with long-standing T1D (35) and T2D (36) to humans with recent-onset diabetes compared to healthy humans when adjusted for age, BMI and sex. Although PA levels are inversely correlated with BMI, the present results are not simply due to differences in FM, but rather result from lower insulin sensitivity in the diabetes groups. Five years after diagnosis, changes in self-reported habitual PA differently associated with improved physical performance in both diabetes groups, but with lower BW, FLI as well as waist circumference and a trend for higher insulin sensitivity only in T2D. Exercise training enhances physical fitness and insulin sensitivity in patients with T2D (1), but even light PA such as supervised walking can improve insulin sensitivity (37). PA can further impact on hepatocellular lipid content (11), which is in agreement with the present findings. We show that the NDUFB6 SNP exhibits allele-specific modulations of PA regarding this endpoint. This could be driven by alterations in adiposity and visceral fat, as reflected by changes in BW and waist circumference in the G/G allele carriers. Of note, the present study showed that more than one third of patients failed to improve insulin sensitivity despite increased habitual PA. Our non-responder group primarily increased their sports activity, which may confer an insufficient dose, i.e. number, duration or intensity of exercise sessions per week. Indeed, a recent study showed that increasing the dose of exercise can overcome non-response (38). This suggests that a higher dose of PA, as observed in the responders, might also contribute to reduction of non-response.
Despite non-response with regard to insulin sensitivity, improved aerobic fitness suggests that non-response to increased PA is not necessarily a general phenomenon, in line with previous observations (6). In the context of PA and exercise training, the term “non-response” therefore requires a precise definition of an endpoint.
Although medication can interfere with metabolic adaptations to exercise (39), we did not identify differences in medication between SNP carriers and can therefore exclude that medication influences on these associations (Supplemental Table 1). Dietary composition and energy intake are other important modulators of glucose metabolism and insulin sensitivity (40, 41), but we also did not find any respective group differences between SNP carriers (Supplemental Table 2).
Aside from exogenous factors, inherited factors may contribute to modulating exercise effects on insulin sensitivity, body composition and liver fat content. To our knowledge, this is the first evidence for the NDUFB6 tag SNP in modulating PA-mediated effects on metabolic endpoints. The results extend our previous data from short-term (9) or long-term training (7) to habitual PA. In these studies, relatives of individuals with T2D carrying the A allele of the NDUFB6 SNP, rs540467, failed to increase their muscle ATP synthase flux during short-term training (9). Similarly, relatives carrying the G allele of the NDUFB6 SNP exhibited greater improvement of muscle ATP synthase flux after 26 weeks of exercise training (7), underlining the importance of muscle mitochondrial function. In a previous exercise intervention study, T2D non-responders to 10 weeks of training with regard to muscle mitochondrial function also did not improve their insulin sensitivity (42). We have previously shown that reduced mitochondrial fitness is associated with insulin resistance and T2D (43). However, evidence for an explanation of this dissociation of responses between muscle mitochondrial function and insulin resistance is still scant. Since NDUFB6 is part of the oxidative phosphorylation system with its expression declining under insulin resistant conditions (33, 34), polymorphisms of this gene could modulate the PA-mediated inability to improve insulin sensitivity.
Although the heritability estimates for NDUFB6 expression have been shown to be up to 65%, both genetic and nongenetic factors likely influence NDUFB6 expression in skeletal muscle (34). In light of the multifactorial pathogenesis of T2D, this study proposes a possible framework, by which reduced complex I-related respiration relate to insulin sensitivity by silencing Ndufb6 in myocytes. These findings identify muscle mitochondrial fitness as key components in maintaining whole-body metabolism and underline the significance of an SNP in a gene relevant for energy metabolism.
The study has some limitations. Non-response to PA can be a dose-related phenomenon (38). As PA behavior was assessed by a questionnaire, it is not possible to provide the actual dose of PA in the present cohort. An inherent limitation of the GDS, as an ongoing actively recruiting observational study, is the fact that there are more volunteers included at baseline than at follow up as only a limited number of patients have reached 5 years disease duration at the time of analysis. A further limitation is absence of information on PA and metabolic parameters of those few, who were lost during follow up (~13%). Further to that, we are aware that cell culture is not a perfect surrogate resembling the human situation but we believe that these experiments still provide valuable mechanistic insights. In conclusion, a large percentage of patients with recent-onset T2D does not respond to increased habitual PA with improved insulin sensitivity. The A allele of the NDUFB6 rs540467 SNP at least partly contributes to this non-response. Silencing of NDUFB6 affects complex I-mediated mitochondrial respiration, which associates with impaired insulin signaling (Figure 4). Thus, our study reveals a relevant gene-environment interaction for one single SNP involved in muscle energy metabolism in T2D, likely affecting muscle mitochondrial function under exercising conditions (44, 45). Sedentary individuals may profit from lifestyle interventions and should be encouraged to increase PA levels early on. Of note, considering the relatively low percentage of non-responders (36%) compared to exercise interventions makes habitual physical activity an attractive alternative to structured exercise. Nevertheless, it becomes increasingly important for clinicians to identify and monitor non-responders to lifestyle interventions and potentially consider specific gene analysis paving the way to precision medicine in the field of T2D.
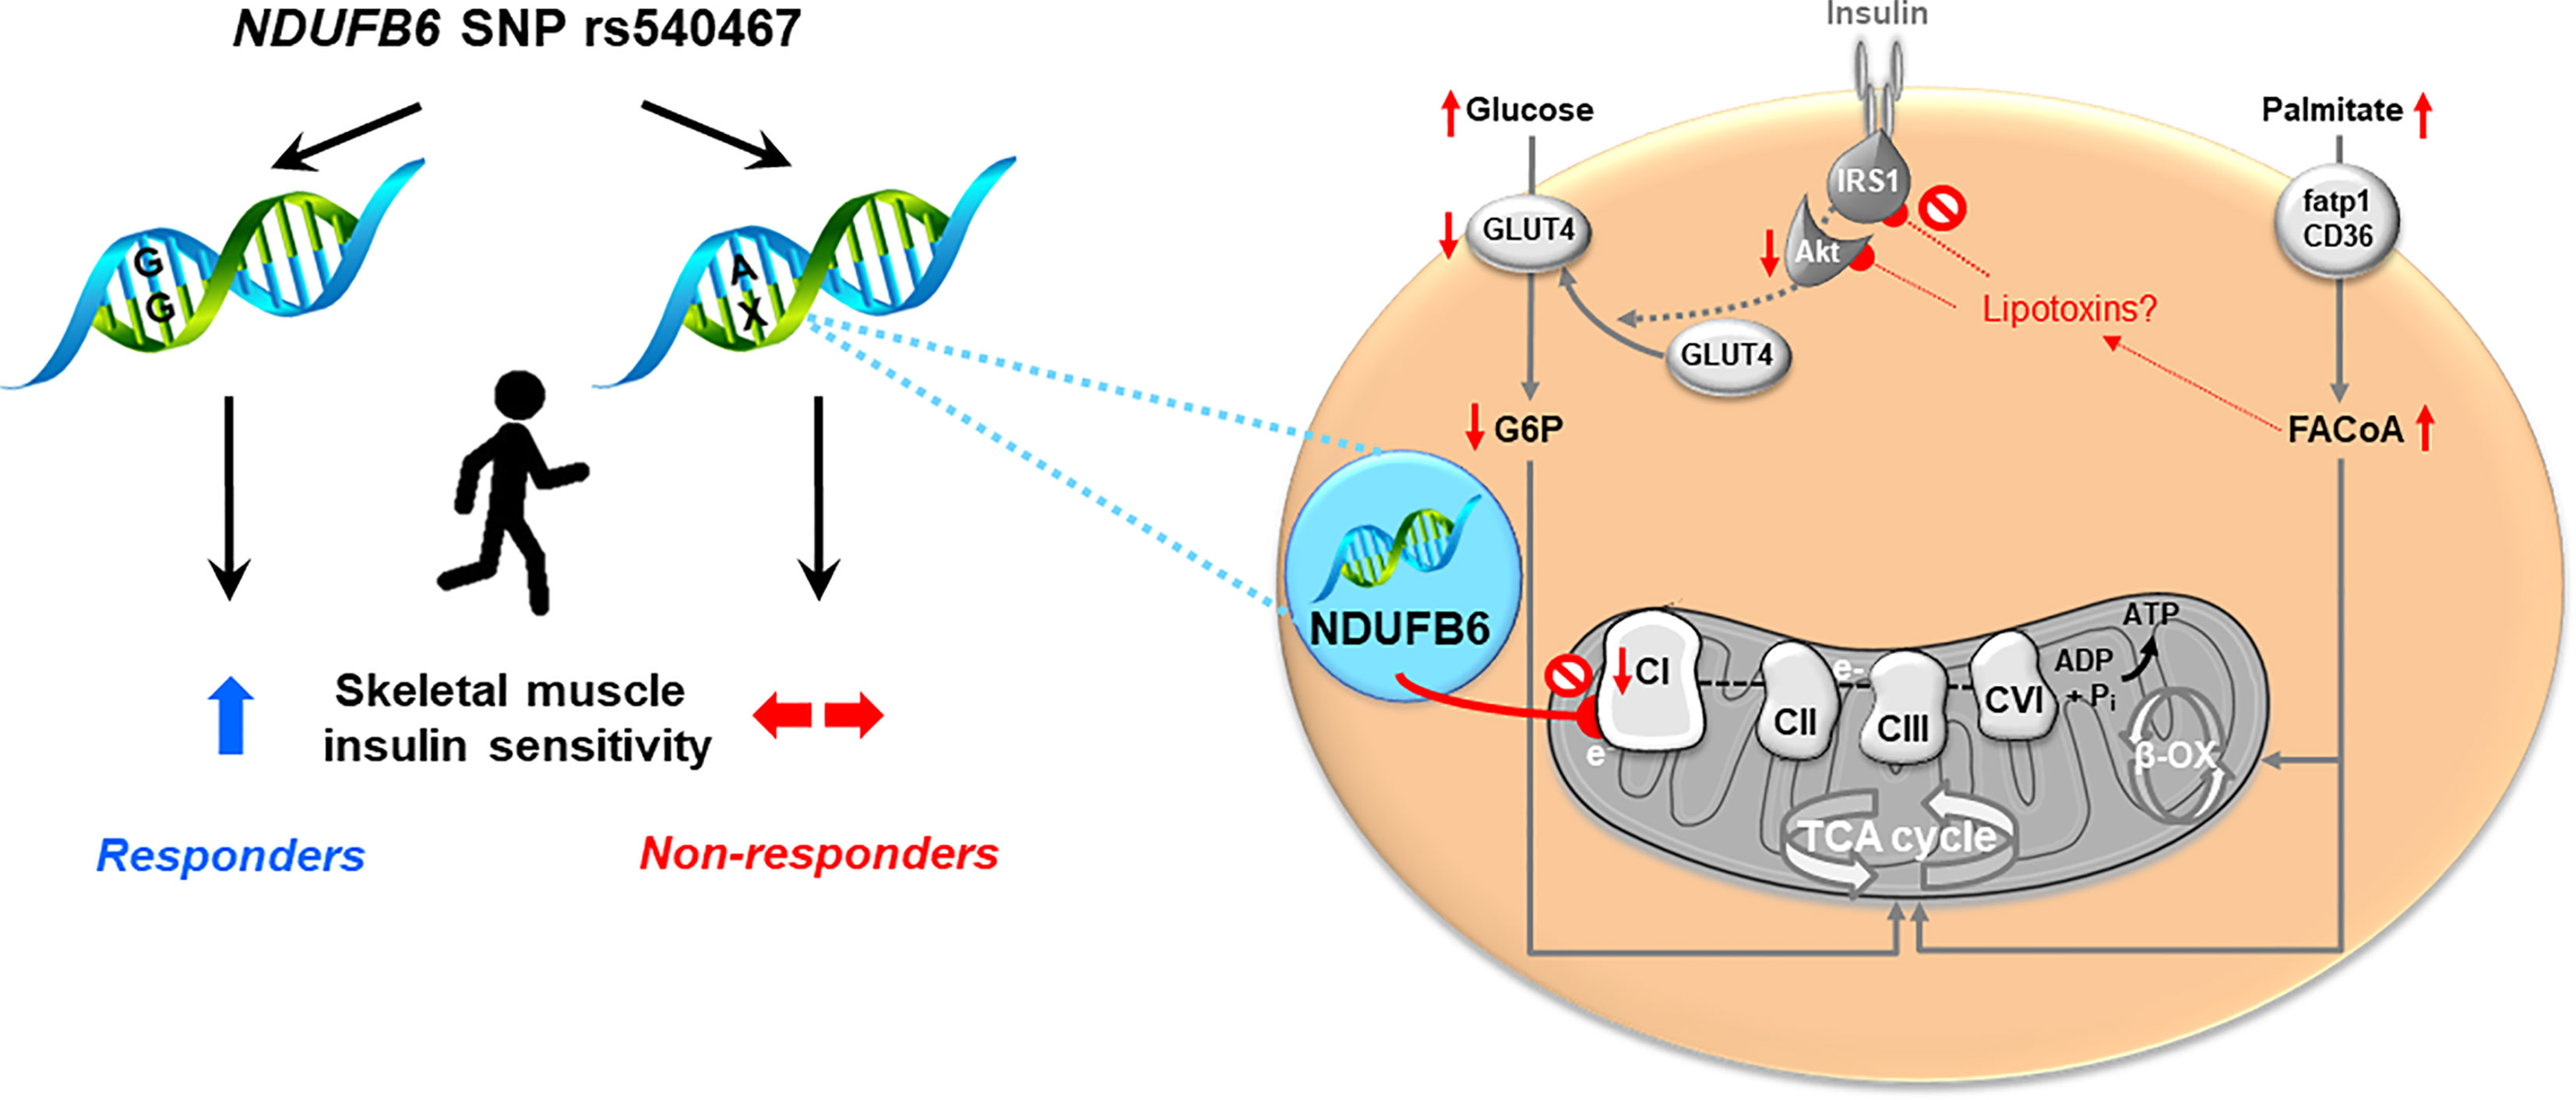
Figure 4 Proposed framework of NDUFB6 interaction with physical activity-mediated improvement of mitochondrial function.
Data Availability Statement
The data sets generated during and/or analyzed during the current study are not publicly available, since they are subject to national data protection laws and restrictions imposed by the ethics committee to ensure data privacy of the study participants. However, they can be applied for through an individual project agreement with the principal investigator of the German Diabetes Study. Requests to access the datasets should be directed tobWljaGFlbC5yb2RlbkBkZHouZGU=.
Ethics Statement
This study was conducted after the approval of the ethics board of Heinrich Heine University Düsseldorf (previous reference number 2478, current reference number 4508) and has been performed in accordance with the ethical standards as set down in the 1964 Declaration of Helsinki and its last amendments of 2013 or comparable ethical standards. All volunteers gave informed consent to the approved protocol. The patients/participants provided their written informed consent to participate in this study.
THE GDS GROUP
The GDS Group consists of A.E. Buyken, B. Belgardt, G. Geerling, H. Al-Hasani, C. Herder, A. Icks, J. Kotzka, O. Kuss, E. Lammert, JH. Hwang, D. Markgraf, K. Müssig, W. Rathmann, J. Szendrödi, D. Ziegler and M. Roden (speaker).
Author Contributions
DP, TJ, and MR wrote the manuscript and researched data. PB and KS performed the statistical analyses. O-PZ, SG, KB, YK, NK, NL, DM, VB, KM, JK, BK, JE, and JS researched data, contributed to the discussion and reviewed/edited the manuscript. All authors critically reviewed the manuscript. MR is the guarantor of this work and, as such, had full access to all the data in the study and takes responsibility for the integrity of the data and the accuracy of the data analysis. All authors contributed to the article and approved the submitted version.
Funding
This work was supported by the Ministry of Culture and Science of the State of North Rhine-Westphalia (MKW NRW) and the German Federal Ministry of Health (BMG). This study was supported in part by a grant of the Federal Ministry for Education and Research (BMBF) to the German Center for Diabetes Research (DZD e.V.) MR is further supported by grants from the European Regional Development Fund (EFRE-0400191), German Research Foundation (DFG, SFB 1116/2). NK received an Albert Renold Travel Fellowship from the European Foundation for the Study of Diabetes (EFSD), TJ a grant from the Deutsche Diabetes Gesellschaft (DDG) Allgemeine Projektförderung and DP from the Dr. Eickelberg-Stiftung. The funding sources had neither influence on design and conduct of this study, collection, analysis and interpretation of the data; nor on the preparation, review, or approval of this article.
Conflict of Interest
MR receives research support by the Ministry of Culture and Science of the State of North Rhine-Westphalia and the German Federal Ministry of Health, serves as investigator of studies supported by Boehringer-Ingelheim Pharma, Nutriticia/Danone and Sanofi and has served as advisor/consultant for Bristol-Myers Squibb, Eli Lilly, Gilead, Intercept Pharma, Novo Nordisk, Novartis, Poxel, Prosciento, Sanofi, Servier and TARGET NASH.
The remaining authors declare that the research was conducted in the absence of any commercial or financial relationships that could be constructed as a potential conflict of interest.
Publisher’s Note
All claims expressed in this article are solely those of the authors and do not necessarily represent those of their affiliated organizations, or those of the publisher, the editors and the reviewers. Any product that may be evaluated in this article, or claim that may be made by its manufacturer, is not guaranteed or endorsed by the publisher.
Acknowledgments
The authors would like to thank the staff of the Clinical Research Center, Institute for Clinical Diabetology at the German Diabetes Center, Düsseldorf, Germany for excellent help with the studies. We thank the participants for their invaluable contributions to the study. Special thanks go to Ilka Rokitta for her excellent help with sample preparation and Samuel Tonne for initial discussions. The results of the study are presented clearly, honestly, and without fabrication, falsification, or inappropriate data manipulation. The results of the present study do not constitute endorsement by ACSM.
Supplementary Material
The Supplementary Material for this article can be found online at: https://www.frontiersin.org/articles/10.3389/fendo.2021.693683/full#supplementary-material
Supplementary Table 1 | AB: Differences in medication between G/G allele as well as A/G and A/A allele carriers at baseline (A) and at the follow-up time point (B). NSAID, Nonsteroidal anti-inflammatory drugs.
Supplementary Table 2 | Intake of dietary macronutrients of a subset of individuals with type 2 diabetes (n=37) at (A) baseline and after 5 years follow-up and between different genotype carriers at (B) baseline and (C) after 5 years follow-up. Data are given as mean ± standard deviations (SD); p-values have been assessed with dependent samples t-test.
Abbreviations
ALT, Alanine aminotransferase; BIA, Bioimpedance analysis; BW, body weight; EPS, electronic pulse stimulation; FCCP, carbonyl-cyanide-p-trifluoromethoxyphenylhydrazone; FLI, fatty liver index; FM, fat mass; GDS, German Diabetes Study; hsCRP, high-sensitivity C-reactive protein; LCR, leak control ratio; NDUFB6, NADH dehydrogenase 1 beta subcomplex subunit 6; PA, physical activity; RCR, respiratory control ratio; SNP, single nucleotide polymorphism; VO2AT, VO2 at the aerobic threshold.
References
1. Colberg SR, Sigal RJ, Yardley JE, Riddell MC, Dunstan DW, Dempsey PC, et al. Physical Activity/Exercise and Diabetes: A Position Statement of the American Diabetes Association. Diabetes Care (2016) 39(11):2065–79. doi: 10.2337/dc16-1728
2. Rohling M, Herder C, Roden M, Stemper T, Mussig K. Effects of Long-Term Exercise Interventions on Glycaemic Control in Type 1 and Type 2 Diabetes: A Systematic Review. Exp Clin Endocrinol Diabetes (2016) 124(8):487–94. doi: 10.1055/s-0042-106293
3. Perseghin G, Price TB, Petersen KF, Roden M, Cline GW, Gerow K, et al. Increased Glucose Transport-Phosphorylation and Muscle Glycogen Synthesis After Exercise Training in Insulin-Resistant Subjects. N Engl J Med (1996) 335(18):1357–62. doi: 10.1056/NEJM199610313351804
4. Riddell MC, Gallen IW, Smart CE, Taplin CE, Adolfsson P, Lumb AN, et al. Exercise Management in Type 1 Diabetes: A Consensus Statement. Lancet Diabetes Endocrinol (2017) 5(5):377–90. doi: 10.1016/S2213-8587(17)30014-1
5. Stephens NA, Sparks LM. Resistance to the Beneficial Effects of Exercise in Type 2 Diabetes: Are Some Individuals Programmed to Fail? J Clin Endocrinol Metab (2015) 100(1):43–52. doi: 10.1210/jc.2014-2545
6. Look ARG, Wing RR, Bolin P, Brancati FL, Bray GA, Clark JM, et al. Cardiovascular Effects of Intensive Lifestyle Intervention in Type 2 Diabetes. N Engl J Med (2013) 369(2):145–54. doi: 10.1056/NEJMoa1212914
7. Kacerovsky-Bielesz G, Kacerovsky M, Chmelik M, Farukuoye M, Ling C, Pokan R, et al. A Single Nucleotide Polymorphism Associates With the Response of Muscle ATP Synthesis to Long-Term Exercise Training in Relatives of Type 2 Diabetic Humans. Diabetes Care (2012) 35(2):350–7. doi: 10.2337/dc11-1426
8. Herrmann SD, Willis EA, Honas JJ, Lee J, Washburn RA, Donnelly JE. Energy Intake, Nonexercise Physical Activity, and Weight Loss in Responders and Nonresponders: The Midwest Exercise Trial 2. Obes (Silver Spring Md) (2015) 23(8):1539–49. doi: 10.1002/oby.21073
9. Kacerovsky-Bielesz G, Chmelik M, Ling C, Pokan R, Szendroedi J, Farukuoye M, et al. Short-Term Exercise Training Does Not Stimulate Skeletal Muscle ATP Synthesis in Relatives of Humans With Type 2 Diabetes. Diabetes (2009) 58(6):1333–41. doi: 10.2337/db08-1240
10. Lao XQ, Deng HB, Liu X, Chan TC, Zhang Z, Chang LY, et al. Increased Leisure-Time Physical Activity Associated With Lower Onset of Diabetes in 44 828 Adults With Impaired Fasting Glucose: A Population-Based Prospective Cohort Study. Br J Sports Med (2019) 53(14):895–900. doi: 10.1136/bjsports-2017-098199
11. Perseghin G, Lattuada G, De Cobelli F, Ragogna F, Ntali G, Esposito A, et al. Habitual Physical Activity is Associated With Intrahepatic Fat Content in Humans. Diabetes Care (2007) 30(3):683–8. doi: 10.2337/dc06-2032
12. Evers-van Gogh IJ, Alex S, Stienstra R, Brenkman AB, Kersten S, Kalkhoven E. Electric Pulse Stimulation of Myotubes as an In Vitro Exercise Model: Cell-Mediated and non-Cell-Mediated Effects. Sci Rep (2015) 5:10944. doi: 10.1038/srep10944
13. Szendroedi J, Saxena A, Weber KS, Strassburger K, Herder C, Burkart V, et al. Cohort Profile: The German Diabetes Study (GDS). Cardiovasc Diabetol (2016) 15:59. doi: 10.1186/s12933-016-0374-9
14. Zaharia OP, Strassburger K, Strom A, Bonhof GJ, Karusheva Y, Antoniou S, et al. Risk of Diabetes-Associated Diseases in Subgroups of Patients With Recent-Onset Diabetes: A 5-Year Follow-Up Study. Lancet Diabetes Endocrinol (2019) 7(9):684–94. doi: 10.1016/S2213-8587(19)30187-1
15. Dambha-Miller H, Day AJ, Strelitz J, Irving G, Griffin SJ. Behaviour Change, Weight Loss and Remission of Type 2 Diabetes: A Community-Based Prospective Cohort Study. Diabetes Med (2020) 37(4):681–8. doi: 10.1111/dme.14122
16. 7Diabetes Prevention Program Research G, Knowler WC, Fowler SE, Hamman RF, Christophi CA, Hoffman HJ, et al. 10-Year Follow-Up of Diabetes Incidence and Weight Loss in the Diabetes Prevention Program Outcomes Study. Lancet (2009) 374(9702):1677–86. doi: 10.1016/S0140-6736(09)61457-4
17. Wagner P, Singer R. Ein Fragebogen Zur Erfassung Der Habituellen Körperlichen Aktivität Verschiedener Bevölkerungsgruppen. Sportwissenschaft (2003) 33(4):383–97.
18. Babic Z, Deskin M, Muacevic-Katanec D, Erdeljic V, Misigoj-Durakovic M, Metelko Z. Estimation of Physical Activity by Different Questionnaires in Overweight Subjects and Patients With Type 2 Diabetes Mellitus: Relationship With Anthropometric and Metabolic Variables. Diabetes Nutr Metab (2004) 17(5):280–9.
19. Philippaerts RM, Westerterp KR, Lefevre J. Comparison of Two Questionnaires With a Tri-Axial Accelerometer to Assess Physical Activity Patterns. Int J Sports Med (2001) 22(1):34–9. doi: 10.1055/s-2001-11359
20. Boeing H, Bohlscheid-Thomas S, Voss S, Schneeweiss S, Wahrendorf J. The Relative Validity of Vitamin Intakes Derived From a Food Frequency Questionnaire Compared to 24-Hour Recalls and Biological Measurements: Results From the EPIC Pilot Study in Germany. Eur Prospective Invest into Cancer Nutr Int J Epidemiol (1997) 26 Suppl 1:S82–90. doi: 10.1093/ije/26.suppl_1.s82
21. Schneider DA, Phillips SE, Stoffolano S. The Simplified V-Slope Method of Detecting the Gas Exchange Threshold. Med Sci Sports Exerc (1993) 25(10):1180–4. doi: 10.1249/00005768-199310000-00015
22. Reybrouck T, Ghesquiere J, Weymans M, Amery A. Ventilatory Threshold Measurement to Evaluate Maximal Endurance Performance. Int J Sports Med (1986) 7(1):26–9. doi: 10.1055/s-2008-1025730
23. ATS/ACCP Statement on Cardiopulmonary Exercise Testing. Am J Respir Crit Care Med (2003) 167(2):211–77. doi: 10.1164/rccm.167.2.211
24. Laufs A, Livingstone R, Nowotny B, Nowotny P, Wickrath F, Giani G, et al. Quantitative Liver 31P Magnetic Resonance Spectroscopy at 3T on a Clinical Scanner. Magn Reson Med (2014) 71(5):1670–5. doi: 10.1002/mrm.24835
25. Bedogni G, Bellentani S, Miglioli L, Masutti F, Passalacqua M, Castiglione A, et al. The Fatty Liver Index: A Simple and Accurate Predictor of Hepatic Steatosis in the General Population. BMC Gastroenterol (2006) 6:33. doi: 10.1186/1471-230X-6-33
26. Matthews DR, Hosker JP, Rudenski AS, Naylor BA, Treacher DF, Turner RC. Homeostasis Model Assessment: Insulin Resistance and Beta-Cell Function From Fasting Plasma Glucose and Insulin Concentrations in Man. Diabetologia (1985) 28(7):412–9. doi: 10.1007/BF00280883
27. Weber KS, Knebel B, Strassburger K, Kotzka J, Stehle P, Szendroedi J, et al. Associations Between Explorative Dietary Patterns and Serum Lipid Levels and Their Interactions With Apoa5 and Apoe Haplotype in Patients With Recently Diagnosed Type 2 Diabetes. Cardiovasc Diabetol (2016) 15(1):138. doi: 10.1186/s12933-016-0455-9
28. Ko JA, Kimura Y, Matsuura K, Yamamoto H, Gondo T, Inui M. PDZRN3 (LNX3, SEMCAP3) Is Required for the Differentiation of C2C12 Myoblasts Into Myotubes. J Cell Sci (2006) 119(Pt 24):5106–13. doi: 10.1242/jcs.03290
29. Lambernd S, Taube A, Schober A, Platzbecker B, Gorgens SW, Schlich R, et al. Contractile Activity of Human Skeletal Muscle Cells Prevents Insulin Resistance by Inhibiting Pro-Inflammatory Signalling Pathways. Diabetologia (2012) 55(4):1128–39. doi: 10.1007/s00125-012-2454-z
30. Pesta D, Gnaiger E. High-Resolution Respirometry: OXPHOS Protocols for Human Cells and Permeabilized Fibers From Small Biopsies of Human Muscle. Methods Mol Biol (2012) 810:25–58. doi: 10.1007/978-1-61779-382-0_3
31. Cohen J. Statistical Power Analysis for the Behavioral Sciences. 2nd Ed. Associates LE, editor. Hillsdale, NJ: Lawrence Erlbaum Associates Publishers (1988).
32. Koliaki C, Roden M. Alterations of Mitochondrial Function and Insulin Sensitivity in Human Obesity and Diabetes Mellitus. Annu Rev Nutr (2016) 36:337–67. doi: 10.1146/annurev-nutr-071715-050656
33. Mootha VK, Lindgren CM, Eriksson KF, Subramanian A, Sihag S, Lehar J, et al. PGC-1alpha-Responsive Genes Involved in Oxidative Phosphorylation are Coordinately Downregulated in Human Diabetes. Nat Genet (2003) 34(3):267–73. doi: 10.1038/ng1180
34. Ling C, Poulsen P, Simonsson S, Ronn T, Holmkvist J, Almgren P, et al. Genetic and Epigenetic Factors are Associated With Expression of Respiratory Chain Component NDUFB6 in Human Skeletal Muscle. J Clin Invest (2007) 117(11):3427–35. doi: 10.1172/JCI30938
35. Valerio G, Spagnuolo MI, Lombardi F, Spadaro R, Siano M, Franzese A. Physical Activity and Sports Participation in Children and Adolescents With Type 1 Diabetes Mellitus. Nutr Metab Cardiovasc Dis (2007) 17(5):376–82. doi: 10.1016/j.numecd.2005.10.012
36. Fagour C, Gonzalez C, Pezzino S, Florenty S, Rosette-Narece M, Gin H, et al. Low Physical Activity in Patients With Type 2 Diabetes: The Role of Obesity. Diabetes Metab (2013) 39(1):85–7. doi: 10.1016/j.diabet.2012.09.003
37. Herzig KH, Ahola R, Leppaluoto J, Jokelainen J, Jamsa T, Keinanen-Kiukaanniemi S. Light Physical Activity Determined by a Motion Sensor Decreases Insulin Resistance, Improves Lipid Homeostasis and Reduces Visceral Fat in High-Risk Subjects: Prediabex Study RCT. Int J Obes (Lond) (2014) 38(8):1089–96. doi: 10.1038/ijo.2013.224
38. Montero D, Lundby C. Refuting the Myth of non-Response to Exercise Training: ‘Non-Responders’ do Respond to Higher Dose of Training. J Physiol (2017) 595(11):3377–87. doi: 10.1113/JP273480
39. Shahar J, Hamdy O. Medication and Exercise Interactions: Considering and Managing Hypoglycemia Risk. Diabetes spectrum: Publ Am Diabetes Assoc (2015) 28(1):64–7. doi: 10.2337/diaspect.28.1.64
40. Hernández E, Kahl S, Seelig A, Begovatz P, Irmler M, Kupriyanova Y, et al. Acute Dietary Fat Intake Initiates Alterations in Energy Metabolism and Insulin Resistance. J Clin Invest (2017) 127(2):695–708. doi: 10.1172/JCI89444
41. Bisschop PH, de Metz J, Ackermans MT, Endert E, Pijl H, Kuipers F, et al. Dietary Fat Content Alters Insulin-Mediated Glucose Metabolism in Healthy Men. Am J Clin Nutr (2001) 73(3):554–9. doi: 10.1093/ajcn/73.3.554
42. Stephens NA, Brouwers B, Eroshkin AM, Yi F, Cornnell HH, Meyer C, et al. Exercise Response Variations in Skeletal Muscle Pcr Recovery Rate and Insulin Sensitivity Relate to Muscle Epigenomic Profiles in Individuals With Type 2 Diabetes. Diabetes Care (2018) 41(10):2245–54. doi: 10.2337/dc18-0296
43. Szendroedi J, Schmid AI, Meyerspeer M, Cervin C, Kacerovsky M, Smekal G, et al. Impaired Mitochondrial Function and Insulin Resistance of Skeletal Muscle in Mitochondrial Diabetes. Diabetes Care (2009) 32(4):677–9. doi: 10.2337/dc08-2078
44. Pesta D, Roden M. The Janus Head of Oxidative Stress in Metabolic Diseases and During Physical Exercise. Curr Diabetes Rep (2017) 17(6):41. doi: 10.1007/s11892-017-0867-2
Keywords: diabetes mellitus, physical activity, single nucleotide polymorphism, insulin sensitivity, mitochondrial function
Citation: Pesta D, Jelenik T, Zaharia O-P, Bobrov P, Görgens S, Bódis K, Karusheva Y, Krako Jakovljevic N, Lalic NM, Markgraf DF, Burkart V, Müssig K, Knebel B, Kotzka J, Eckel J, Strassburger K, Szendroedi J and Roden M (2021) NDUFB6 Polymorphism Is Associated With Physical Activity-Mediated Metabolic Changes in Type 2 Diabetes. Front. Endocrinol. 12:693683. doi: 10.3389/fendo.2021.693683
Received: 11 April 2021; Accepted: 09 September 2021;
Published: 24 September 2021.
Edited by:
Luigi Gnudi, King’s College London, United KingdomReviewed by:
Rachel Perry, Yale University, United StatesBarbara Ukropcova, Slovak Academy of Sciences, Slovakia
Renata Goncalves, Harvard University, United States
Copyright © 2021 Pesta, Jelenik, Zaharia, Bobrov, Görgens, Bódis, Karusheva, Krako Jakovljevic, Lalic, Markgraf, Burkart, Müssig, Knebel, Kotzka, Eckel, Strassburger, Szendroedi and Roden. This is an open-access article distributed under the terms of the Creative Commons Attribution License (CC BY). The use, distribution or reproduction in other forums is permitted, provided the original author(s) and the copyright owner(s) are credited and that the original publication in this journal is cited, in accordance with accepted academic practice. No use, distribution or reproduction is permitted which does not comply with these terms.
*Correspondence: Michael Roden, bWljaGFlbC5yb2RlbkBkZHouZGU=
The GDS Group consists of A.E. Buyken, B. Belgardt, G. Geerling, H. Al-Hasani, C. Herder, A. Icks, J. Kotzka, O. Kuss, E. Lammert, JH. Hwang, D. Markgraf, K. Müssig, W. Rathmann, J. Szendrödi, D. Ziegler and M. Roden (speaker)
†These authors have contributed equally to this work