 Cody McGrath1†
 Sarah E. Little-Letsinger1†Jeyantt Srinivas Sankaran1
 Buer Sen1Zhihui Xie1
 Martin A. Styner2,3Xiaopeng Zong4
 Weiqin Chen5Janet Rubin1,6†Eric L. Klett1,6,7†Rosalind A. Coleman7
 Maya Styner1,6*†
- 1Department of Medicine, Division of Endocrinology & Metabolism, School of Medicine, University of North Carolina at Chapel Hill, Chapel Hill, NC, United States
- 2Department of Psychiatry, School of Medicine, University of North Carolina at Chapel Hill, Chapel Hill, NC, United States
- 3Department of Computer Science, University of North Carolina at Chapel Hill, Chapel Hill, NC, United States
- 4Biomedical Research Imaging Center, University of North Carolina at Chapel Hill, Chapel Hill, NC, United States
- 5Department of Physiology, Medical College of Georgia at Augusta University, Augusta, GA, United States
- 6North Carolina Diabetes Research Center (NCDRC), Chapel Hill, NC, United States
- 7Department of Nutrition, Gillings School of Global Public Health, UNC, Chapel Hill, NC, United States
Exercise, typically beneficial for skeletal health, has not yet been studied in lipodystrophy, a condition characterized by paucity of white adipose tissue, with eventual diabetes, and steatosis. We applied a mouse model of global deficiency of Bscl2 (SEIPIN), required for lipid droplet formation. Male twelve-week-old B6 knockouts (KO) and wild type (WT) littermates were assigned six-weeks of voluntary, running exercise (E) versus non-exercise (N=5-8). KO weighed 14% less than WT (p=0.01) and exhibited an absence of epididymal adipose tissue; KO liver Plin1 via qPCR was 9-fold that of WT (p=0.04), consistent with steatosis. Bone marrow adipose tissue (BMAT), unlike white adipose, was measurable, although 40.5% lower in KO vs WT (p=0.0003) via 9.4T MRI/advanced image analysis. SEIPIN ablation’s most notable effect marrow adiposity was in the proximal femoral diaphysis (-56% KO vs WT, p=0.005), with relative preservation in KO-distal-femur. Bone via μCT was preserved in SEIPIN KO, though some quality parameters were attenuated. Running distance, speed, and time were comparable in KO and WT. Exercise reduced weight (-24% WT-E vs WT p<0.001) but not in KO. Notably, exercise increased trabecular BV/TV in both (+31%, KO-E vs KO, p=0.004; +14%, WT-E vs WT, p=0.006). The presence and distribution of BMAT in SEIPIN KO, though lower than WT, is unexpected and points to a uniqueness of this depot. That trabecular bone increases were achievable in both KO and WT, despite a difference in BMAT quantity/distribution, points to potential metabolic flexibility during exercise-induced skeletal anabolism.
Introduction
Exercise -induced skeletal anabolism is a vital physiologic process, which in addition to calcium, vitamin D, and hormonal stimuli, necessitates substrate energy, fueling osteoblasts as they lay new bone (1). An array of cells orchestrate this bone-building response to mechanical loading (2–11), including osteocytes, osteoclasts, endothelial cells, and their progenitors. Osteoblasts, while able to use various substrates (12) prefer energy-rich fatty acids (13). Bone marrow adipose tissue (BMAT) likely serves as the energy depot in exercising, non-calorically restricted mice (14–16) but it is unknown if metabolic flexibility permits use of other substrates to reproducibly build bone. Here we asked whether exercise-induced bone is achievable in the setting of a mouse model of congenital generalized lipodystrophy (CGL), characterized by a near absence of peripheral white adipose tissue stores.
Human studies show a varied effect of partial and generalized congenital lipodystrophies on bone, which might be due to disease-specific mutations. An increase in bone quantity has been noted, along with advanced skeletal age; yet, there is also evidence of skeletal ‘harm’, in the form of cystic or osteolytic bone lesions (17–19). Lima et al. shows a higher bone mass in trabecular sites, contrasted with a reduction in the distal radius, a cortical site (20). A comprehensive radiologic analysis of the skeleton in 3 CGL patients (21) reports cystic bone lesions, multiple long bone defects, reduced BMAT, periarticular hyperemia, as well as increased activity via triple phase scintigraphy in some skeletal sites. In some (mutations Bscl2, Agpat2) there is a reduction in marrow fat via MRS (22–24); while in others (mutations CAV1, LMNA) a preservation of BMAT is noted (25, 26). Mouse models like A-ZIP fat-less (27), Cav1 (-/-) (28), transgenics applying diphtheria toxin to ablate adipocytes (29) or PPARγ(+/-) (30), reveal increased bone quantity or osteosclerosis. The precise effect of CGL generally, and specifically that of Bscl2/SEIPIN deficiency on bone, remains essentially unknown. Defined by an inability to store triglycerides in adipocytes, lipodystrophy results in diabetes, hypertriglyceridemia, heart disease, and intellectual disability (31–33). In humans, the most clinically severe CGL arises due to loss of function of Bscl2 (34), encoding SEIPIN, which packages lipid and protein cargo into maturing droplets necessary for adipogenesis (34–37). We thus hypothesized that in a mouse model of SEIPIN deficiency, attenuated BMAT storage or function might alter exercise -induced bone formation.
Due to numerically limited human studies of CGL, animal studies are vital in the interrogation of BMAT and bone-response to exercise. Methods to quantify and visualize BMAT distribution in rodents are also unparalleled in human trials (15). We asked if adiposity in the marrow is measurable in lipodystrophic mice, and whether exercise regulates bone, when adipose stores are scant. We were surprised to find a quantifiable marrow adipose tissue (BMAT) depot in the SEIPIN KO mice by histomorphometry and MRI. While SEIPIN KO BMAT was present, it was lower than WT, particularly in the proximal femur, with relative preservation of BMAT in the distal femur. The presence of BMAT in SEIPIN KO contrasted with an absence of white adipose tissue. We also discovered that exercise-induced trabecular bone was robust in SEIPIN KO, even without exercise-induced attenuation of BMAT, highlighting a possibility that SEIPIN KO rely on an alternative substrate to fuel skeletal anabolism.
Materials and Methods
Animals, Diet, and Exercise Intervention
Procedures and ethical guidelines of the University of North Carolina’s Institutional Animal Care and Use Committee (IACUC) were adhered throughout the study. Male, twelve-week-old, wild-type (WT) and global SEIPIN knock-out (KO) mice (laboratory of Weiqin Chen) were randomized to running or sedentary groups as available due to breeding. Global SEIPIN KO mice were generated as previously described (38, 39). Briefly, Bscl2 exon 3 germ-line deletion was accomplished by crossing mice with loxP Bscl2 allele to mice expressing Cre recombinase driven by germ (oocyte) specific promoter (Zp3-cre, Jax #003394). Screening of progeny via PCR for loss of the Bscl2 exon 3 was performed. After the Bscl2-null allele was generated, the strain was crossed with C57BL/6 for 3 generations and inbreed with heterozygotes to obtain homozygotes. The Bscl2-nulls were backcrossed at least 6 times prior to initiation of these experiments. C57BL/6 mice of this age were selected as BMAT and exercise response has not previously been quantified in this sample. Males were selected due to an abundance of prior metabolic data in male 12-week-old SEIPIN KO (39). Mice were housed in controlled light (12-hour light/12-hour dark), temperature (21-22 degrees Celsius), and humidity (range 30-70%) conditions, with ad libitum access to food and water, and acclimated for 5 days prior to initiation of experiments. Mice were randomly assigned to the following experimental groups for 6 weeks: non-exercising WT (WT, n=5) (2), exercising WT (WT-E, n=6), (3) non-exercising KO (KO, n=8), and (4) exercising KO (KO-E, n=6). For MRI analyses, WT-E group was excluded due to an insufficient number of specimens. Running intervention length did not differ between groups. Mice were 18 weeks of age at harvest; age at harvest did not differ between groups. Mice were individually housed for the duration of the experiment to track daily wheel running. Exercise groups were provided access to running wheels as previously described (5, 40, 41). Wheel use was monitored using a Mity 8 Cyclometer (CC-MT400, Cat Eye, Osaka, Japan). All mice were fed a standard 10% fat diet (#D12450H, Research Diets, New Jersey, USA) for the duration of the experiment. Body weights were measured weekly.
3D Quantification and Imaging of Bone Marrow Adipose Tissue
Quantification of BMAT was performed via high-resolution 9.4T MRI with advanced image analysis for 3D volumetric BMAT analysis, a method previously validated against both osmium-stained-μCT with advanced image analysis, as well as histomorphometry (see Expanded Supplemental Methods, Supplementary Figure 1) (14, 15). Mechanical loading or weight-bearing exercise in rodents has been shown to affect hind limbs, e.g., tibia and femur, but also other sites (42–44). Progenitor populations in the femur (10) are more exercise-responsive, though both have strong response and are therefore preferred for exercise experiments, as compared with forelimbs (10). Briefly, femurs were analyzed with a 9.4T horizontal small-bore MRI scanner to quantify BMAT volumetrically (14, 15). Water and fat maps were obtained with a 2-dimensional RARE imaging sequence with the following parameters: RARE factor = 4, TE = 28 ms, TR = 4000 ms, number of averages = 4, number of slices = 24, slice thickness = 0.5 mm, in-plane resolution = 100×100 μm2, matrix size = 130×130. Utilizing the fact that the fat and water protons have an NMR frequency separation of 3.5 ppm, a Gaussian-shaped 90-degree saturation pulse with a width of 2 ms was applied preceding the RARE sequence to suppress the fat or water signal while the other signal remained unaffected. Fat and water images were acquired by setting the saturation pulse frequency to be the same as the water and fat frequencies, respectively.
In our processing workflow, we manually subdivided the full images containing all 10 samples into individual images for each bone. Then, we employed water images to manually outline femoral bone masks using Insight ITK-SNAP (open-access www.itksnap.org) (45). Using these bone masks, interior bone regions were masked from other image parts in both water and fat maps. Next, we established a common, study-specific reference space by computing an unbiased average image (46) from masked water maps using the ANTs registration software (47). All individual water and fat maps were then propagated into the common space, where voxel-wise correspondence allows direct comparison of intensities. Average fat maps for each experimental group were computed in the common space and superimposed on the common, average water image for visualization of group fat maps as in Figure 2A. Fat map intensities were represented with a colored heat map in 3DSlicer for visualization (open-access www.slicer.org) (45, 48). 3D Slicer is a platform distributed under a BSD-style open-source license that is broadly compatible with the Open-Source Definition by The Open-Source Initiative and contains no restrictions on legal uses of the software. For BMAT quantification, we created a regional label map of the femur, excluding cortical bone regions, with regions for the epiphysis, metaphysis, and diaphysis. Intensity weighted volume of BMAT was then quantified via regional fat histograms.
Bone Marrow Adipocyte Quantification via Histomorphometry
Fixed and decalcified femurs were embedded in paraffin, sectioned at 5 µm, stained with hematoxylin (MHS16, Sigma-Aldrich, St. Louis, MO, USA) (14, 49). Imaging on an Olympus X81 at 4x and 40x.The 40x images were obtained at the distal femoral metaphysis, where lipid content is maximal. ImageJ was used to isolate adipocytes within 40x images and to quantify adipocyte size as previously described (50). Globular maxima were removed manually to isolate defined adipocytes. The “Analyze Particles” function was used to outline cells and calculate area in pixels. A lower limit of 1000 pixels was applied to N=2-3 mice/group, with a minimum of 5 distinct histologic regions per section, as well as a minimum of 3 sections per animal. A minimum of 20 adipocytes were analyzed for adipocyte area measurement per mouse in the 3 sections. To assess adipocyte number via ImageJ, the marrow cavity at the distal metaphysis was imaged at a magnification of 4x and adipocytes were manually counted. Adipocyte number was then normalized to the total metaphyseal area assessed to obtain adipocyte number per square (#/mm2). Presence of adipocytes in the femur of B6 mice of similar age, via H&E as well as perilipin 1 immunohistochemistry are shown in Supplementary Figure 1 (Supplementary 1A–C distal femoral metaphysis, Supplementary 1D proximal femoral diaphysis).
Bone Microarchitecture and Biomechanical Testing
Bone microarchitecture parameters of the proximal tibia metaphysis and mid diaphysis were quantified ex-vivo via high resolution μCT (Scanco μCT40, UNC- Chapel Hill Biomedical Imaging Research Center, resolution 12 μm; E 55 kVa; I 145 μA) (51, 52). Briefly, the interface of trabecular and cortical surfaces was manually contoured. To resolve the compartments, natural contour was preserved at the endosteum, where the cortical surface was delineated from trabecular struts based on variations in discrete density values (mgHA/ccm). Subsequently, an automated algorithm was applied to quantify bone in each compartment. Parameters analyzed in trabecular bone include: Ratio of the segmented bone volume to the total volume of region of interest (Bone Volume Fraction; BV/TV); Measure of average number of trabeculae per unit length (Trabecular number; Tb.N); Mean thickness of trabeculae, assessed using direct 3D methods (trabecular thickness; Tb.Th); Mean distance between trabeculae, assessed using direct 3D methods (Trabecular separation; Tb.Sp). Parameters in cortical bone include: Total cross sectional area inside the periosteal envelope (Tt.Ar); Cortical bone area (Ct.Ar) calculated from cortical volume divided by number of slices x slice thickness; Cortical area fraction (Ct.Ar/Tt.Ar); Average cortical thickness (Ct.Th).
TRAP Stain
Femurs were fixed in 10% formalin, decalcified in formic acid (UN3412 Immunocal, StatLab, Texas, USA), paraffin-embedded, and sectioned longitudinally at 5 µm, and mounted on glass slides. Xylene- deparaffinized sections were rehydrated with graded ethanol, rinsed with deionized water, and stained for TRAP by a buffer containing Naphthol-AS-BI-phosphate (70485, Sigma-Aldrich, St. Louis, MO, USA) followed by a buffer containing Sodium Nitrite (237213, Sigma-Aldrich, St. Louis, MO, USA) and Pararosaniline dye (215600, Sigma-Aldrich, St. Louis, MO, USA). Fast Green stain was applied (F7252, Sigma-Aldrich, St. Louis, MO, USA), dehydrated, then exposed to Xylene before mounting with Cytoseal (8312-4, Thermo Fisher Scientific, MA, USA). Images were obtained via an Olympus IX81 and TRAP was quantified using open-source software (50).
Real-Time qPCR
Whole tibia mRNA was reverse transcribed and analyzed via real-time qPCR as previously described (53–55). Briefly,Ten µL of cDNA from each experimental condition were pooled and diluted 1:10 to 1:10,000 to generate a 5-point standard curve. A non-template control was added to each PCR reaction. Standards and samples were run in duplicate. PCR products were normalized to GAPDH. PCR primer sequences are available in Supplemental Table 1.
Statistical Analysis
Analyses were performed using GraphPad Prism Version 9.1.0 (GraphPad, San Diego, CA, USA). Data sets passed the Shapiro-Wilk normality test. We applied the one-way or two-way analysis of the variance or ANOVA (genotype x exercise) with correction for multiple comparisons via Tukey’s post-hoc test. Significance was defined as an α less than 0.05. Adipocyte area was assessed via nested ANOVA. Running parameters (WT-E vs KO-E) were analyzed using an unpaired, two-tailed t-test.
Results
SEIPIN Deficient Mice Run Similarly to Wild Type
To investigate the effect of exercise on bone and BMAT, we employed a lipodystrophic mouse with global ablation of Bscl2, encoding SEIPIN, a protein required for lipid droplet formation. Our prior work showed that these Bscl2 KO mice are hyperglycemic and hyper insulinemic by 10 weeks of age, though this was not quantified in the present cohort (39). Lipodystrophic KO weighed less than WT littermates throughout the experimental period, with a final weight 14% less than WT (p=0.01) (Figures 1A, B). Prior studies similarly note reduced weight in KO, though at a younger age (39). Consistent with loss of SEIPIN (39, 56), KO -exercisers and non- exercisers- lacked epididymal fat pads. In terms of other adipose depots, prior work by our team (39) in the same Bscl2-/- mice showed loss or reduction of several depots including subcutaneous, interscapular, perirenal, gonadal WAT, as well as a histological appearance of smaller adipocytes possessing mostly unilocular lipid droplets. Regarding lean mass, prior work in the same Bscl2-/- mice showed an increase in lean mass consistent with lipodystrophy (39). The liver Plin1 via qPCR was 9-fold higher in SEIPIN KO than WT (p=0.04), consistent with probable steatosis (39), which was also supported by gross examination demonstrating enlarged, pale livers (Figure 6).
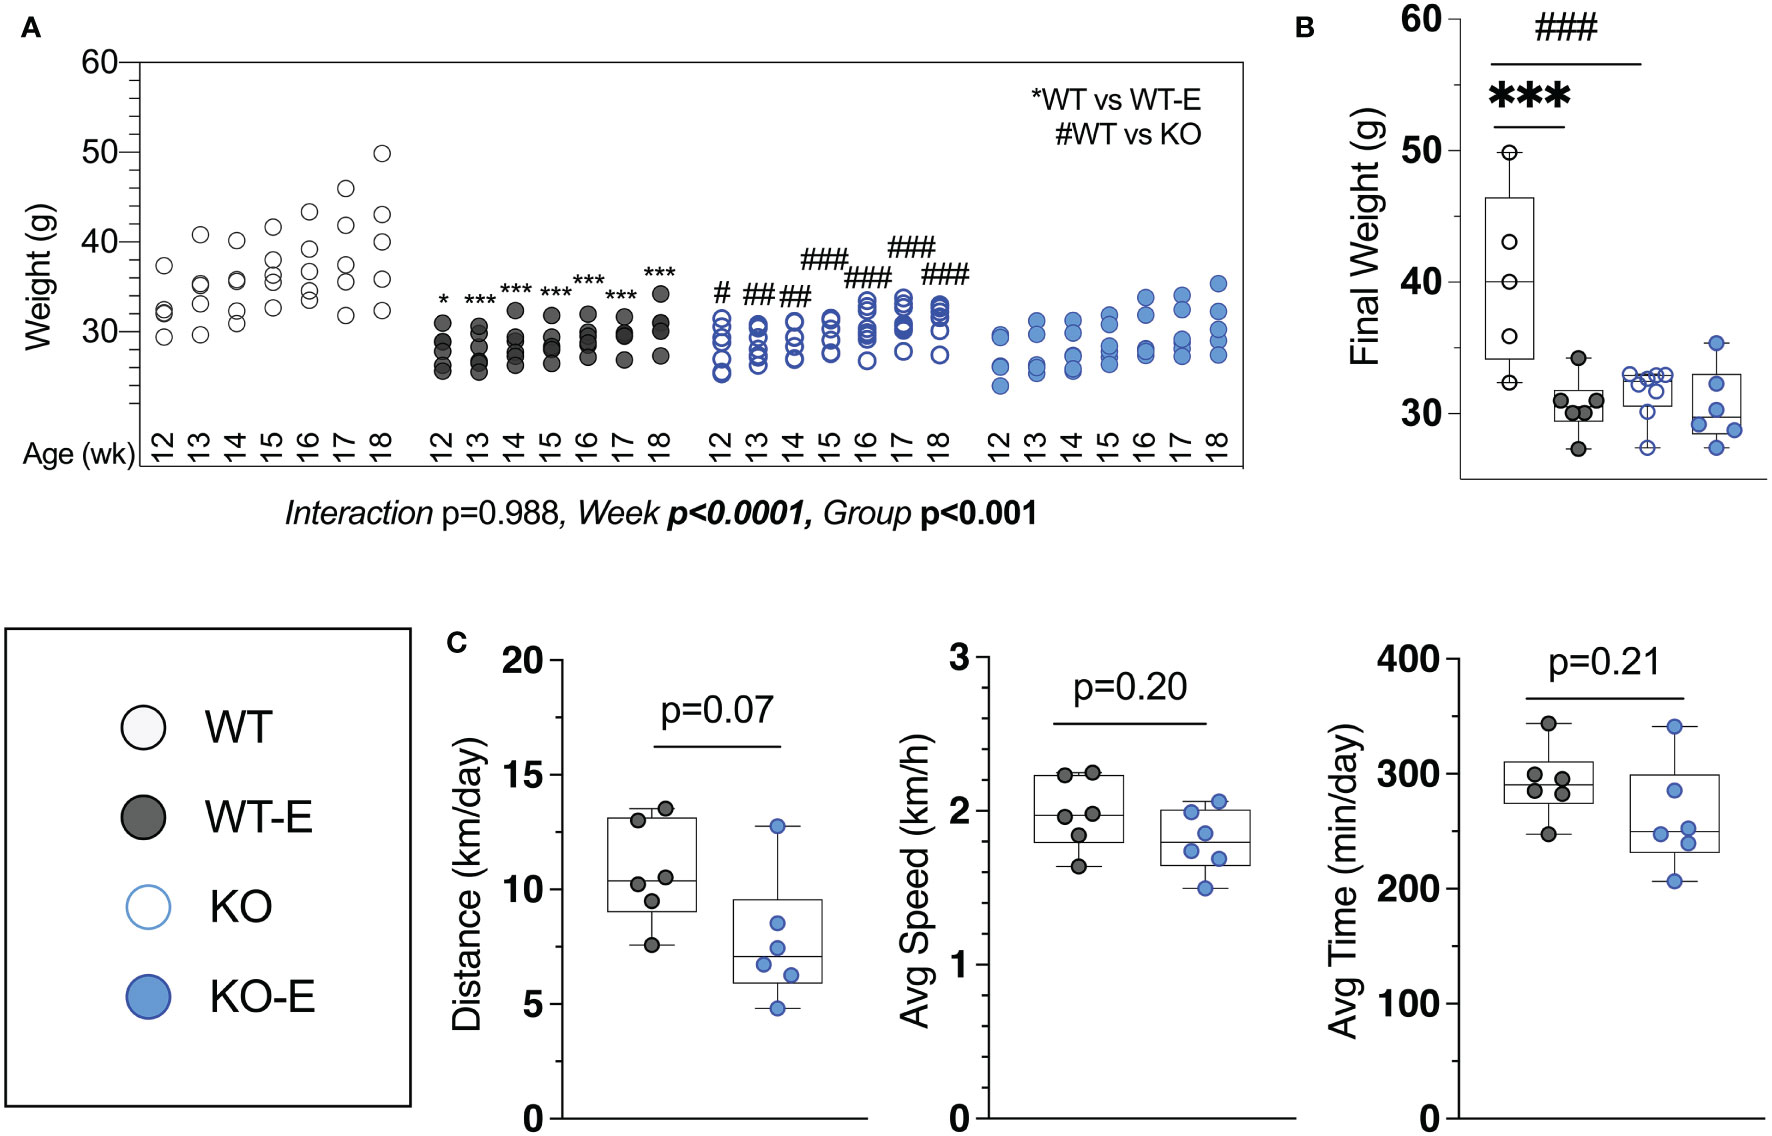
Figure 1 Lipodystrohic SEIPIN KO run similar to WT despite lower body weight. Male SEIPIN KO and WT littermates allocated to voluntary running exercise (E) or non-exercise groups (KO, WT) at twelve weeks for a six-week experimental period (N=5-8). (A) Individual body weights throughout and (B) at harvest. (C) Voluntary wheel running metrics via cyclometer- average daily running distance (km/day), average running speed (km/h), and average daily running duration (min/day) in WT-E and KO-E. Data as individual values on box and whisker plots (min to max). Horizontal lines represent means. Significance via 2-way ANOVA with Tukey's post hoc (A, B) or unpaired t-test (C) Between-group * or #p < 0.05; **or ##p < 0.01; ***or ###p < 0.001.
Harvest weights were highest in the WT non-runners (40.3 ± 7.8 g Figure 1A). Exercise associated with significantly reduced weight in WT-E vs. WT at each week of the experimental period (Figure 1A), consistent with prior work (14, 15, 41) Notably, we found that KO-E weight did not differ significantly from KO, diverging from the exercise-effect on body weight noted in WT. One of the early publications by Seip et al. (56) pointed to hyperphagia in this form of lipodystrophy in humans. Based on this and our prior work in mice (39), increased caloric intake in SEIPIN KO is anticipated. It is possible that caloric intake in SEIPIN KO-E was attenuated as lipodystrophy has been associated with hyperphagia in the literature (39), however as caloric intake was not quantified in our analysis, we cannot firmly state the cause for this.
Daily running parameters were similar in KO-E (7.8 ± 2.7 km/day Figure 1C) and WT-E (10.7 ± 2.2 km/day, p=0.07 though trended less). Average running speed (1.81 ± 0.21 km/hr. in KO-E; 2.0 ± 0.2 km/hr. in WT-E, p=0.20) and daily running time were similar between groups (262 min ± 46 min in KO-E; 292 ± 31 min in WT-E vs, p=0.2)
Distal Femur BMAT Is Present in SEIPIN KO, and Reduced in the Proximal Femur Diaphysis
Next we turned to investigate BMAT via 3-dimentional MRI in the 9.4T scanner, quantifying and localizing femoral BMAT with advanced image analysis (Figures 2A–D and 3A–D) (5, 45–47) (BMAT quantification: Extended Supplementary Methods, Supplementary Figure 1) BMAT was visualized via superimposed average group images (Figure 2A). It is notable that BMAT was extant and quantifiable in SEIPIN KO, though measuring 40.5% less than WT (p=0.003) SEIPIN ablation resulted in a significant reduction of BMAT in the hip, specifically the proximal diaphysis (-56% KO vs WT, p=0.005, Figure 3A), with relative preservation of BMAT in the KO-distal-femur (Figure 2B). Prior work demonstrated that exercise associates with reduced BMAT in WT animals fed ad-libitum (14, 15, 40, 41). Due to insufficient number of specimens (absent running data in one animal and poor MR image quality in another). WT-E group was excluded from this analysis, but the group was not required to test our hypotheses (14, 41). The WT-E group was included in other analyses such as bone microarchitecture, qPCR and histomorphometry. Histomorphometric quantification of marrow adipocytes via hematoxylin staining showed similar average adipocyte number and size across the groups (Figure 2E). The high-resolution MRI sequence for volumetric BMAT quantification correlates well with osmium stained-μCT analyses, as well as histomorphometry (15).While it is valuable to show histological support for 3-dimensional, volumetric BMAT via high resolution MRI, it is the MRI data that is most conclusive representing higher volume throughout the entire bone; thus, our conclusions were largely based on MRI quantification of BMAT. Whole bone adiponectin mRNA was 53% lower in KO vs. WT (Figure 2F, p=0.039) and 64% lower in WT-E vs WT (p=0.018). Whole tibia mRNA of white and brown adipose tissue markers, as well as bone markers, did not significantly vary between groups (Figure 6). In sum, the presence of BMAT in SEIPIN KO was notable, and the fact that BMAT was more proximally distributed in the femur, than in WT based on MRI quantification (Figures 3A–D).
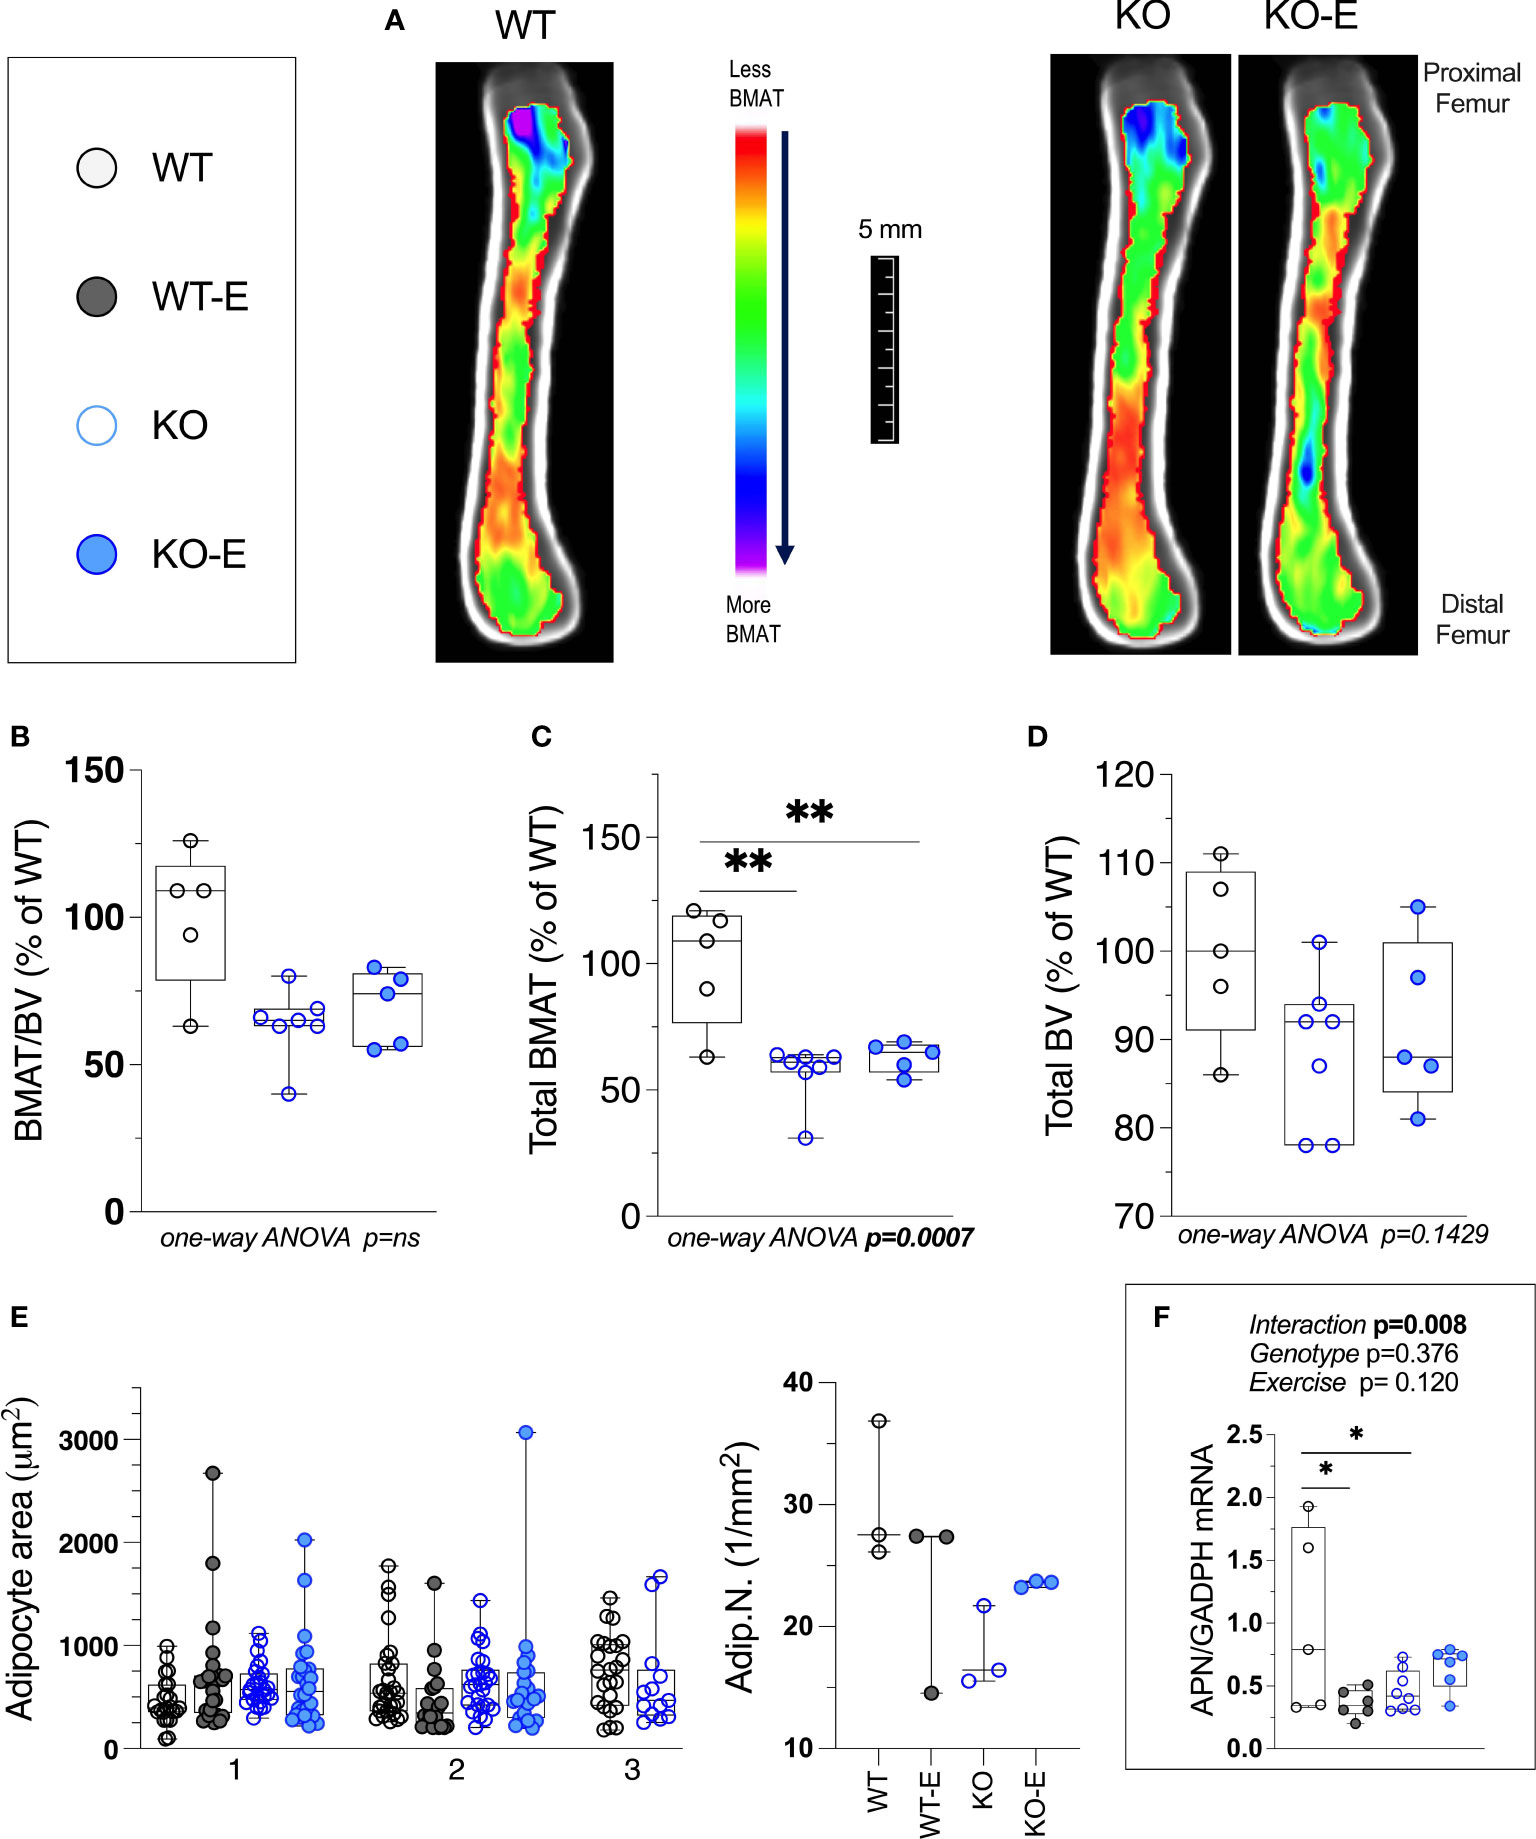
Figure 2 Bone Marrow adipose tissue (BMAT) is extant, but reduced in SEIPIN KO Lipodystrophy. 12-week old male Bscl2 -/- KO allocated to exercise (E) vs non-exercise for 6 wk. compared to WT (A) Visualization of BMAT via 9.4 T MRI with advanced image analysis; each image is an average from superimposed individual images in the sagittal plane. Volumetric quantification of BMAT form N=5-7 MRI images is shown in (A). In (B–D), BMAT values are shown as % relative to WT mean. (B): Bone Marrow Adipose Tissue /Bone Volume (BMAT/BV). (C): Total Femoral Bone Marrow Adipose Tissue (BMAT). (D): Bone Volume (BV). Group differences in (B–D) were analyzed via one-way ANOVA with Tukey's post-hoc test, **p < 0.01. Due to insufficient number of specimens, WTE group was excluded. (E) plot of histomorphometric analysis: adipocyte area (1μm2) and number (1/mm2), via lmageJ, with X-axis representative of 2-3 experimental animals. For data in (E) there were no significant differences between groups by nested one-way ANOVA. (F): Whole tibia adiponectin (APN) mRNA via qPCR (n=5-8 I group) via 2-way ANOVA, Tukey's post hoc, between-group *p < 0.05. Data as individual values on box and whisker plots (min to max). Horizontal lines represent means.
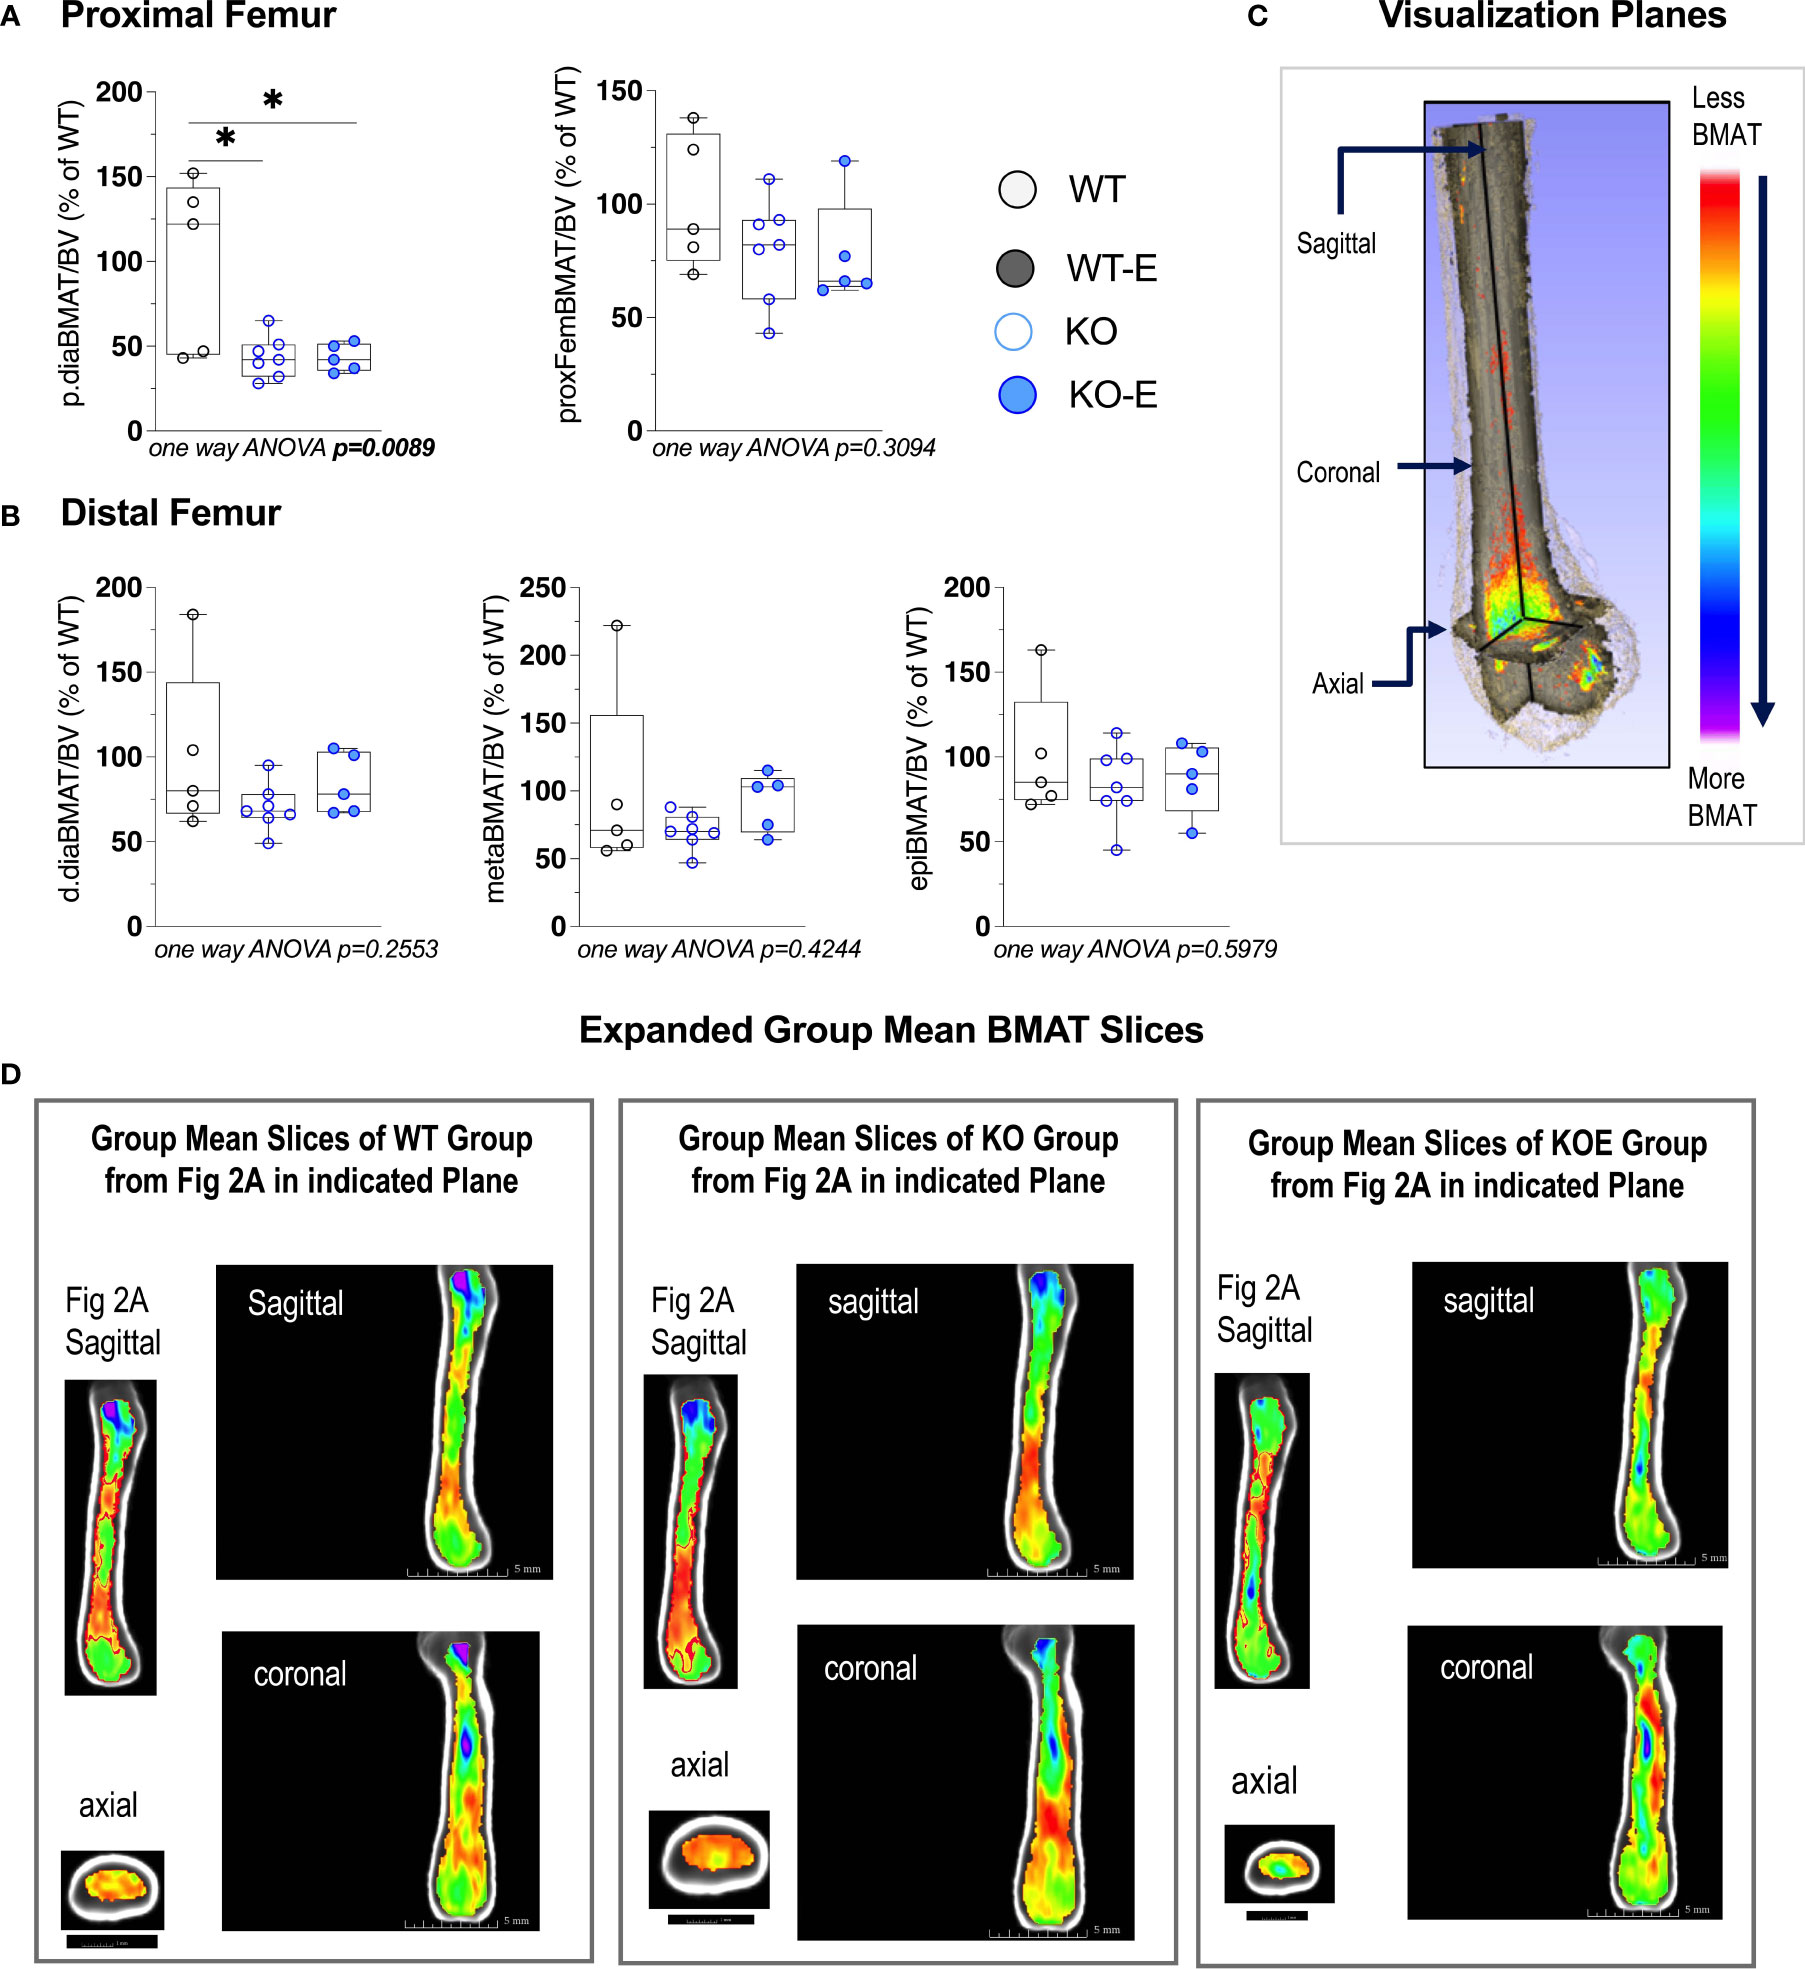
Figure 3 Seipin KO exhibit reduced BMAT in the proximal femoral diaphysis. Twelve-wk.-old male SEIPIN KO allocated to exercise (E) vs non-exercise for 6 weeks, compared to wild type (WT) (n=5-8). BMAT quantified by 9.4T MRI with advanced image analysis to analyze regional distribution of BMAT relative to bone volume (BV). Data expressed as relative% BMAT to WT mean. (A) BMAT/BV assessed at the hip and the proximal diaphysis (p.dia). (B) BMAT/BV assessed at the distal diaphysis (d.dia), metaphysis (meta), and epiphysis (epi). Analyzed via one-way ANOVA with Tukey's post hoc, *p < 0.05. Data as individual values on box and whisker plots (min to max). Horizontal lines represent means. (C) Visualization planes for 9.4T MRI inboth Figures 2 and 3. (D) Extended group mean slices obtained at indicated planes.
Increased Bone in Exercisers, Both WT and Lipodystrophic SEIPIN KO
While in humans there is much to be discovered about the type of exercise that optimally stimulates (57–60) bone, wheel running in rodents reproducibly associates with skeletal anabolism (15, 40, 41). Moreover, as wheel running increases bone alongside a diminution of BMAT (15, 40, 41, 61), we asked whether BMAT, as well as bone quantity/quality, are regulated by exercise SEIPIN deficiency. At the outset, we hypothesized that loss of SEIPIN would lower BMAT, thus lessening exercise-induced skeletal anabolism. To our surprise, despite the lower quantity of BMAT in SEIPIN KO, exercise increased trabecular BV/TV in both groups (+31%, KO-E vs KO, p=0.004; +14%, WT-E vs WT, p=0.006, Figure 4A), despite a difference in BMAT quantity/distribution (Figures 2A, B and 3A–D). The between-group comparisons for BV/TV revealed p= 0.9797 for WT-E vs KO-E. Exercise accounted for 43% of the total variance, while genotype alone accounted for only 1.48% of the variance. When combined, genotype plus exercise account for 4.5% of the total variance. Other trabecular parameters such as trabecular thickness and separation were similarly responsive to exercise in both KO and WT groups (Figure 4A).
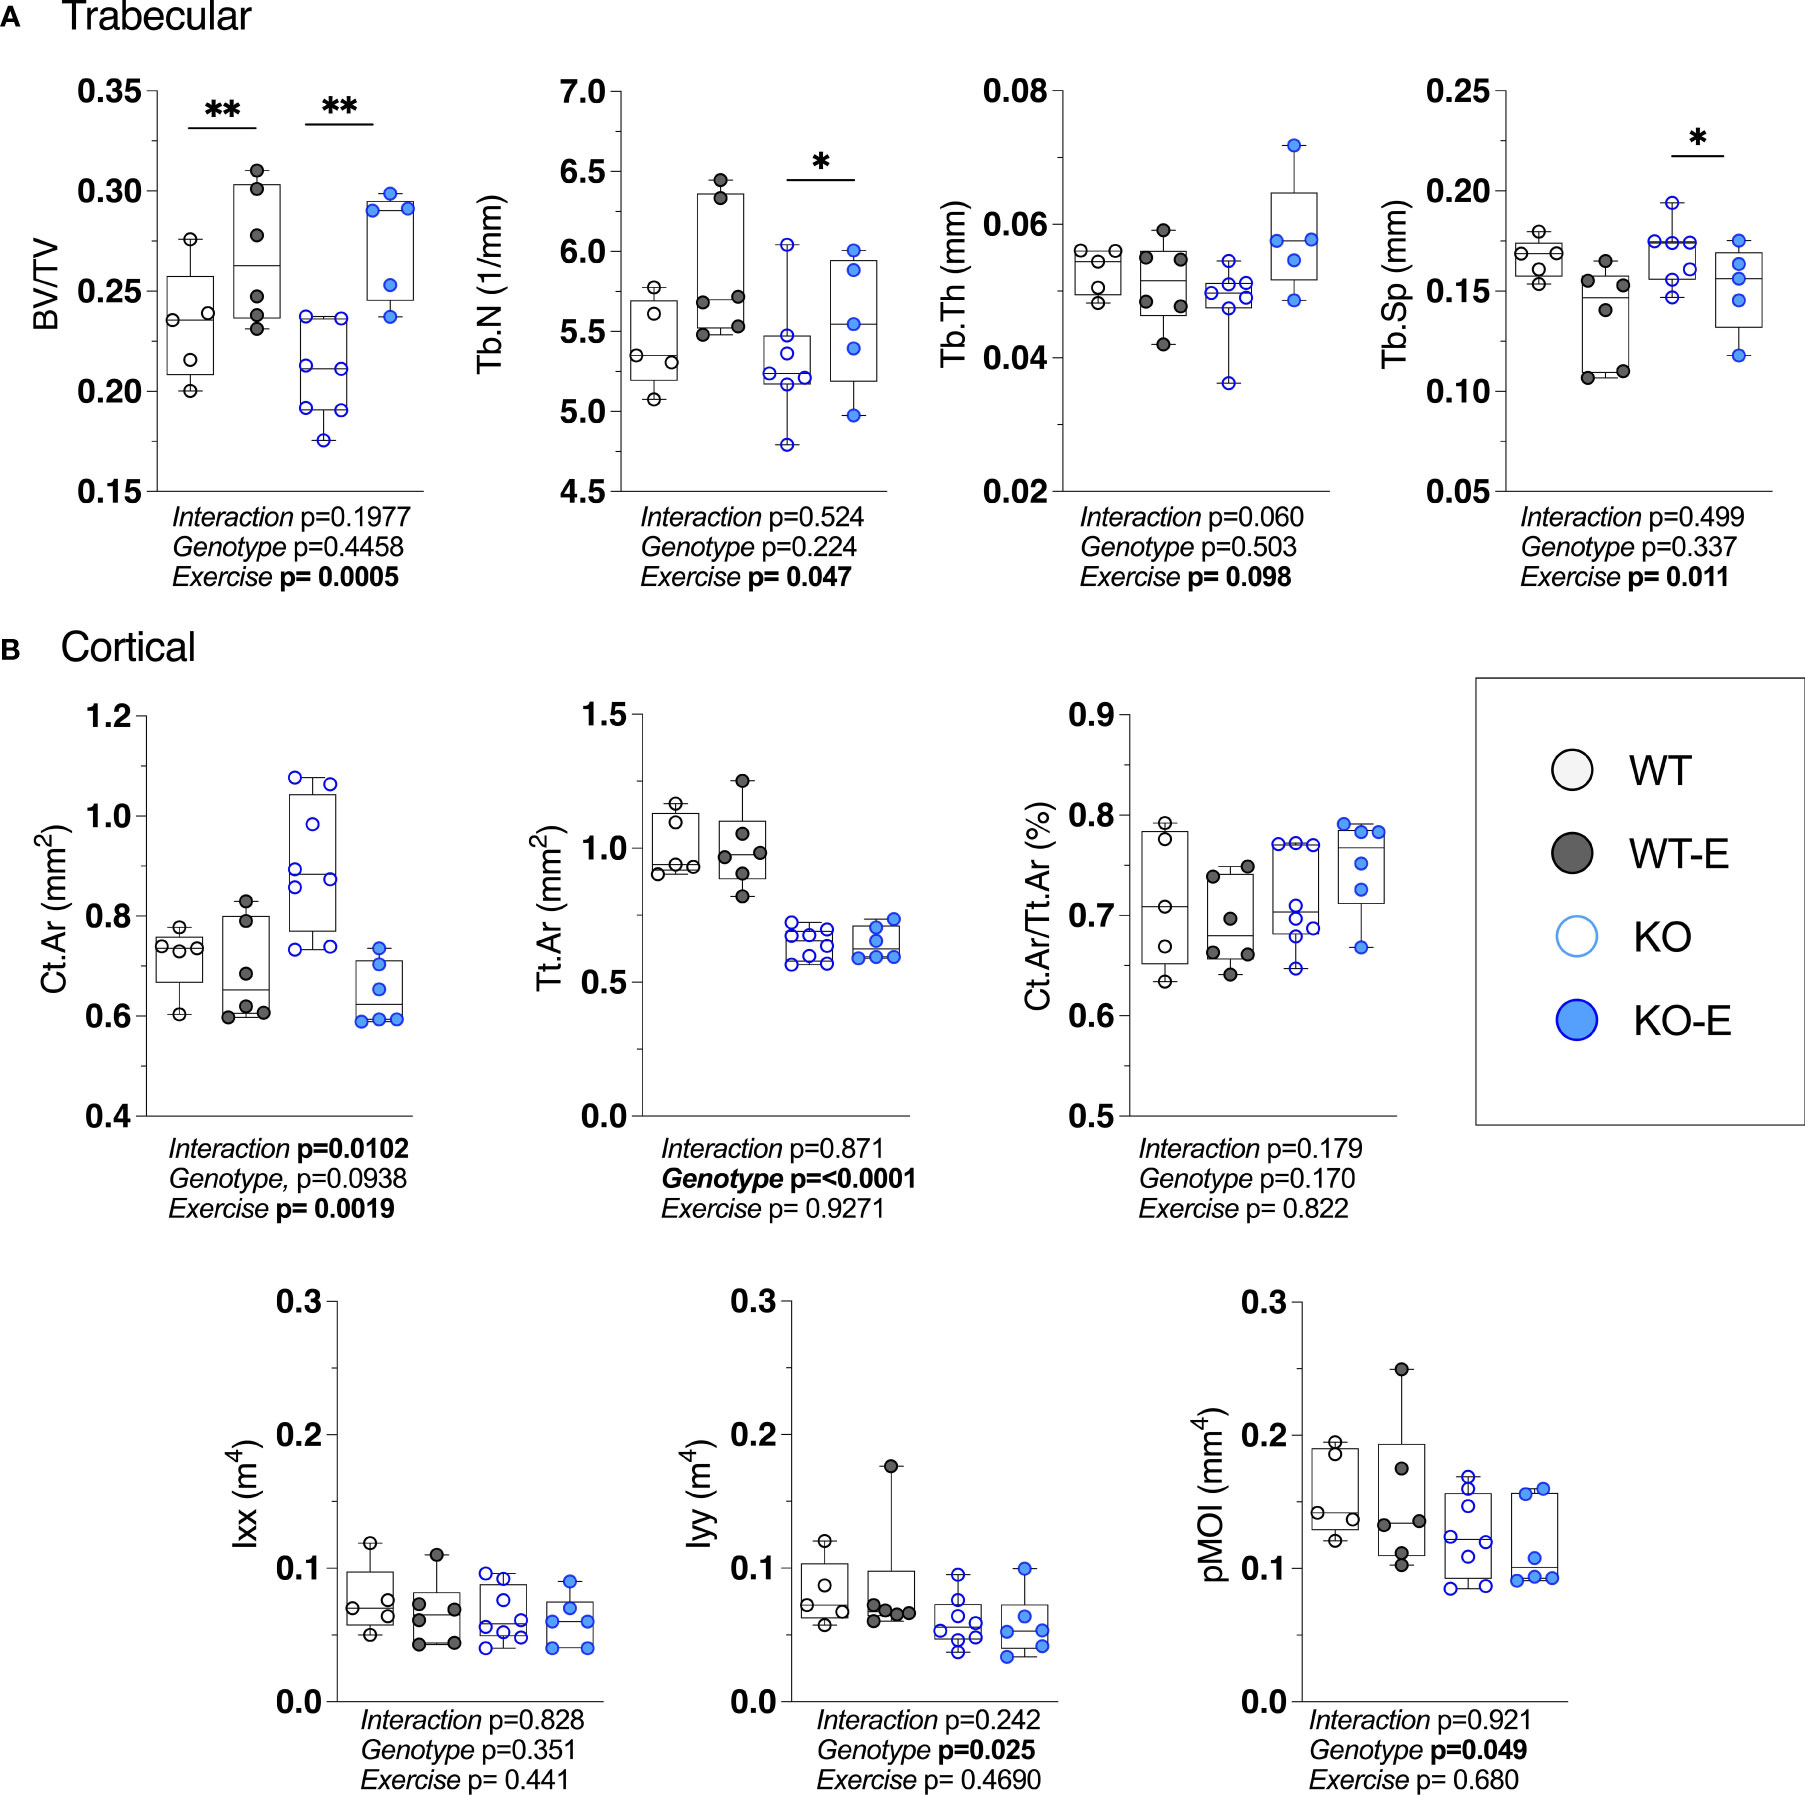
Figure 4 Higher bone quantity in exercising WT and lipodystrophic SEIPIN KO mice. Twelve-week-old male SEIPIN KO and WT allocated to exercise (E) vs non-exercise for 6 weeks (n=S-8). (A) Trabecular bone microarchitecture (BV/TV, Tb.N, Tb.Th, Tb.Sp) assessed at the proximal tibial metaphysis via 1JCT. (B) Cortical geometry (Ct.Ar, Tt.Ar, Ct.Ar/Tt.Ar) and biomechanical measures (lxx, lyy, pMOI) assessed at the mid-tibial diaphysis. Data plotted as individual values with means represented by horizontal lines. Significance assessed via 2- way ANOVA, Tukey's post hoc. Significance for between-group comparisons: *p < O.OS; **p < 0.01. Data as individual values on box and whisker plots (min to max). Horizontal lines represent means.
With the cortical parameters, a genotype effect was stronger than that of exercise. Specifically, Tt.Ar was 35% lower in KO vs WT (Figure 4B, p<0.0001) accounting for 78% of the variance, a finding that is possibly related to lower body weight in SEIPIN KO. The Ct.Ar was ~ 10% higher in KO (Figure 4B) however this did not reach significance (p=0.09).The cortical bone volume fraction (Ct.Ar/Tt.Ar) failed to show an effect of genotype or exercise in our analysis (Figure 4B).
Consistent with cortical geometry, polar moment of inertia (pMOI) in SEIPIN KO was reduced by -21% (p=0.049 Figure 4B) and the rotational moment of inertia (MOI), an index of resistance to bending, was – 38% in the YY (Iyy) plane vs WT (p=0.025 Figure 4B) pointing to possible cortical bone loss. Histomorphometric analysis of TRAP-stained sections (Figure 5) showed a similar quantity in the experimental groups.
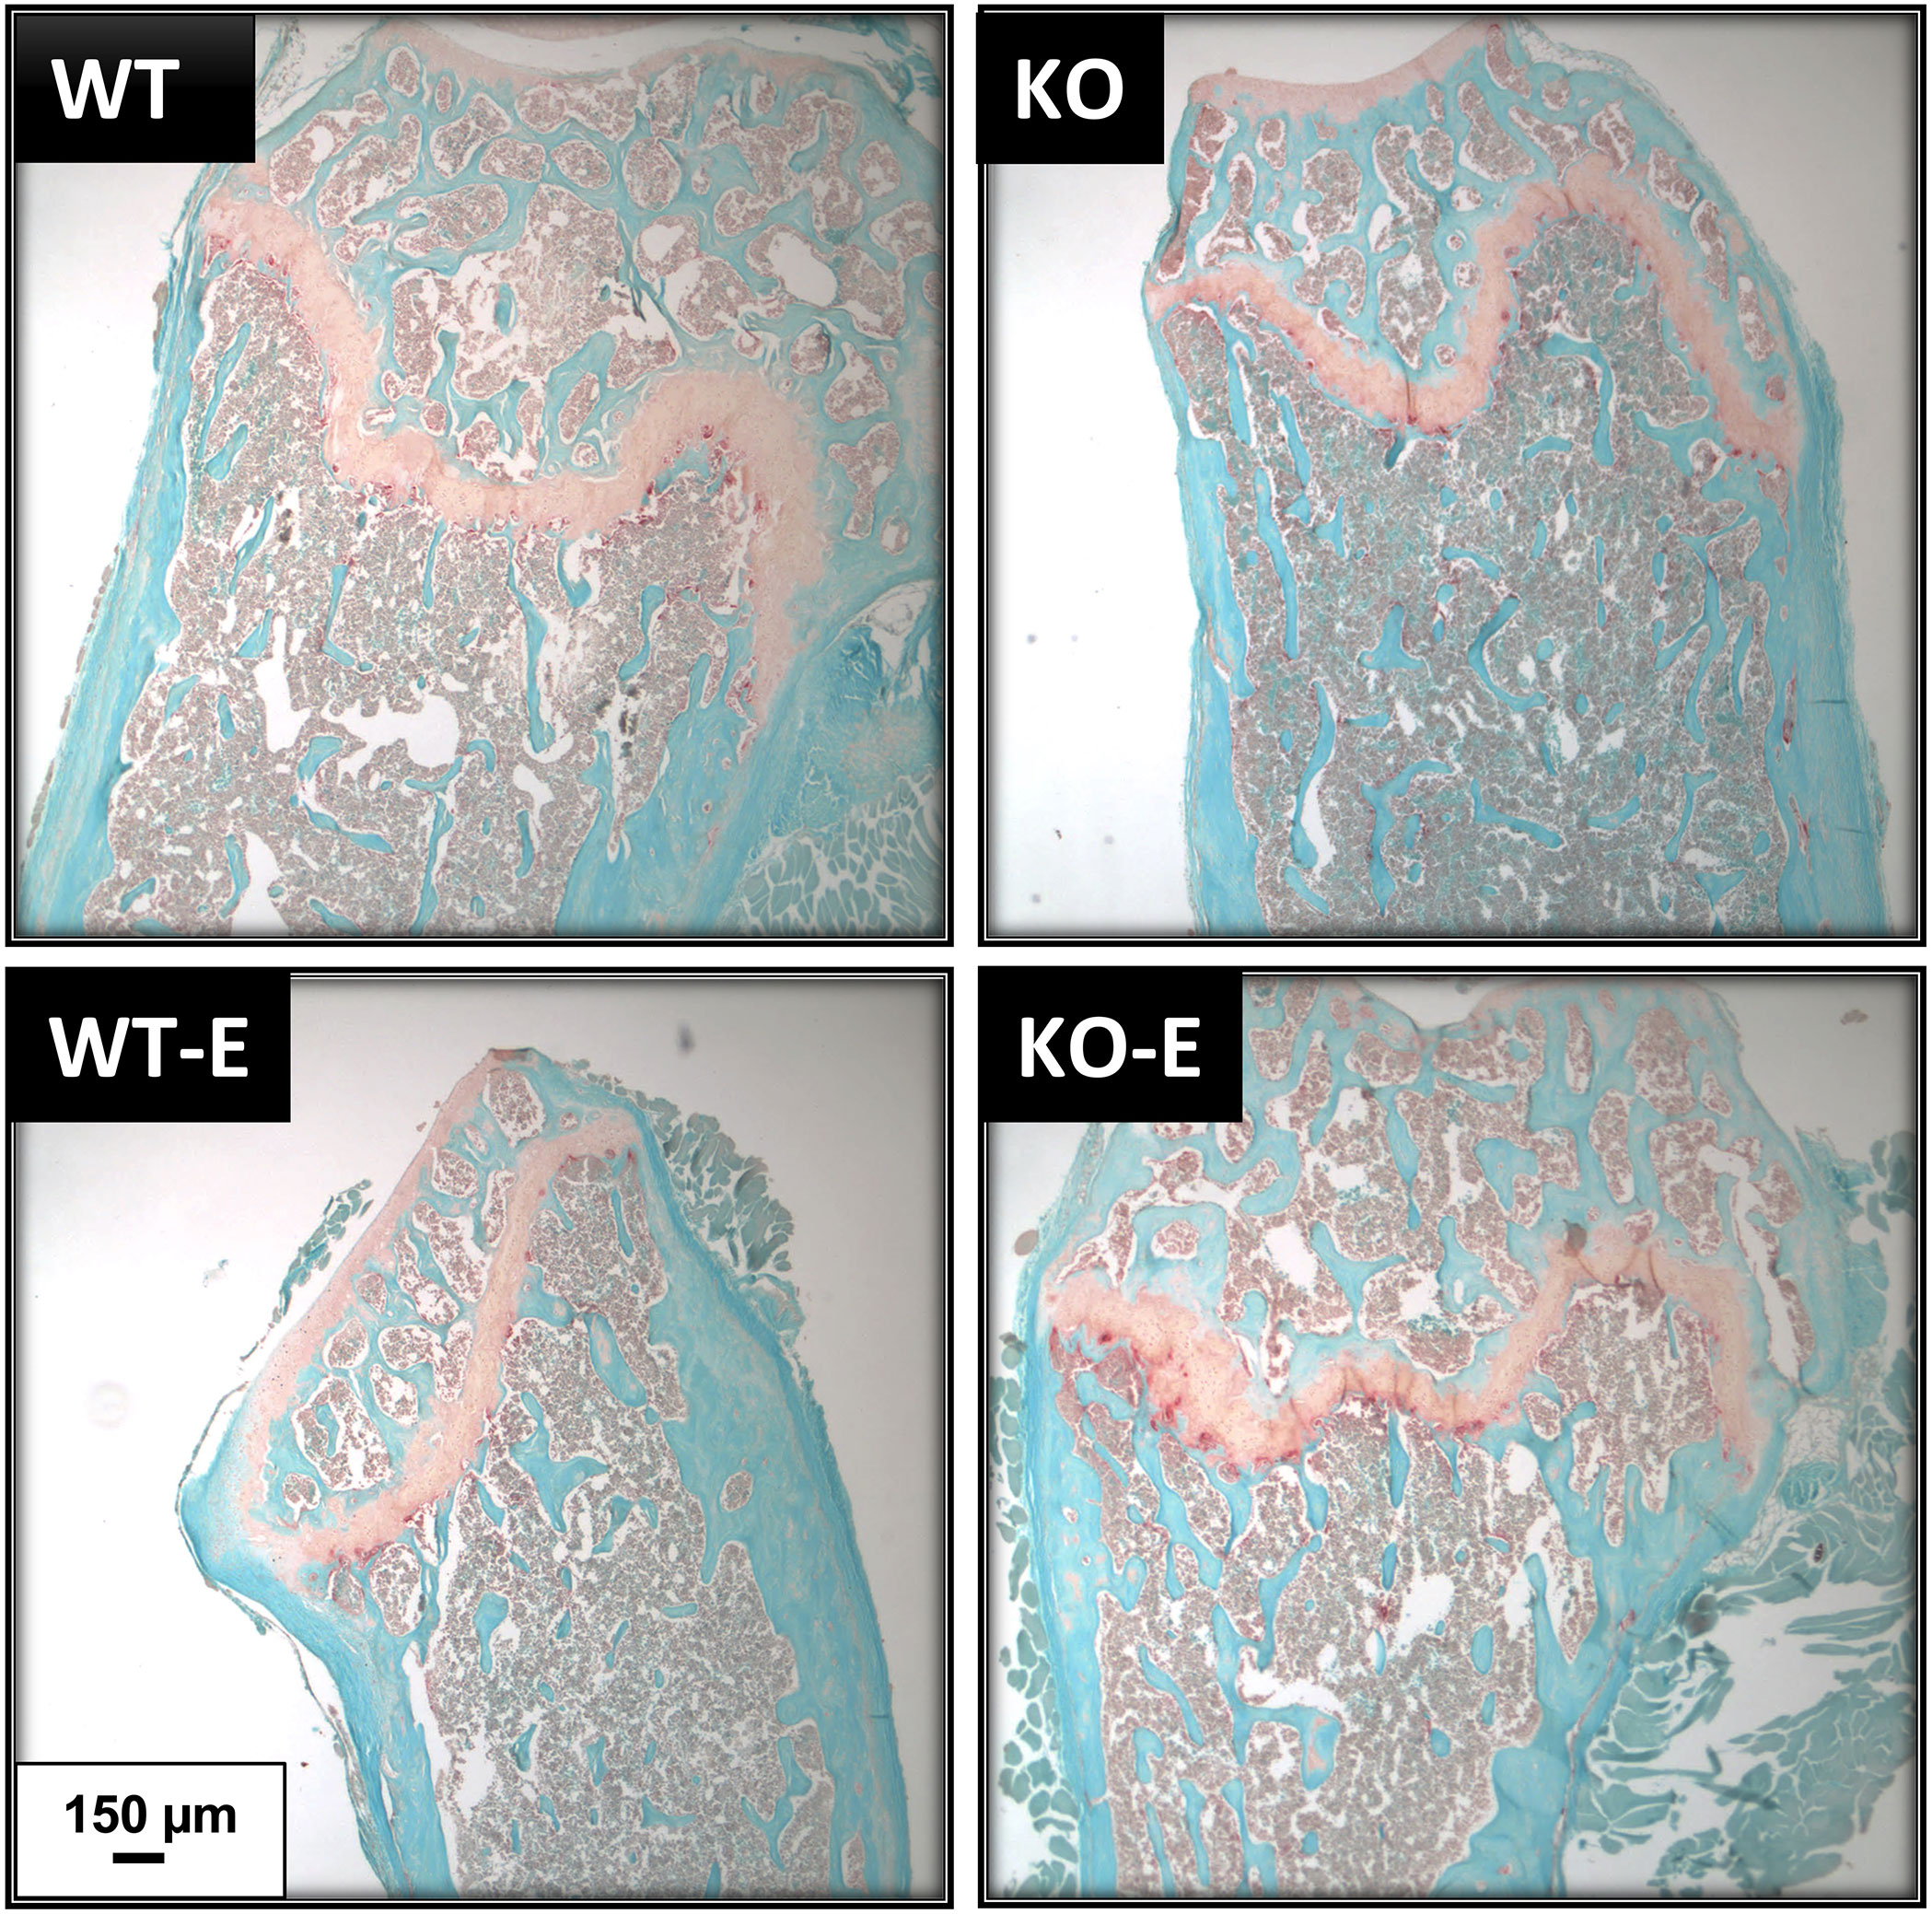
Figure 5 TRAP staining shows similar osteoclast numbers in WT and SEIPIN KO. Twelve-week-old male SEIPIN KO and WT were allocated to exercise (E) vs non-exercise controls for 6 weeks. Representative histologic sections of the distal femur were stained with Fast Green and TRAP, images via Olympus IX81.
Discussion
The skeleton demonstrates an anabolic response to exercise in animal (6, 15, 62–64) and human (60, 65, 66) studies. Despite clinical guidelines recommending lifestyle and exercise intervention (67) as a first-line therapy the effect of mechanical loading or exercise on bone and BMAT, has not been investigated in lipodystrophy. Our preclinical data point to a robust increase in trabecular bone quantity with exercise in lipodystrophic SEIPIN KO mice, despite a scarcity of peripheral adiposity, as well as less BMAT in the proximal femoral diaphysis. These findings, pertinent not only for an improved understanding of a musculoskeletal response to exercise, should prompt additional study of the therapeutic potential of non-pharmacologic, exercise-based therapies for lipodystrophy.
We previously suggested that marrow adipose stores provide metabolic substrates for exercise-induced bone formation (15, 40, 41). It remains unclear if bone cells and their precursors harbor metabolic flexibility, as related tissues like skeletal muscle and cardiomyocytes preferentially rely on fatty acid β-oxidation for ATP during exercise (68, 69). Metabolic flexibility is discussed in reference to skeletal cells known to require fatty acid oxidation (70) though many cells in the niche participate in bone turnover and could be impacted by substrate availability. The reduced peripheral white adipose stores in SEIPIN KO means that they have a reduced capacity to buffer fatty acids from exogenous and endogenous sources and serve as a storage depot, thought to result in metabolic inflexibility that requires a constant supply of metabolic substrates (71). Few studies compare CGL patients with healthy, age-matched controls, and thus it is unknown what are the expected differences in body weight with and without exercise. Percent change in body weights were as expected in WT exercisers compared to control (72). Remarkably, exercise in SEIPIN KO did not result in weight loss, which might be due to known hyperphagia in CGL, thus mitigating the metabolic inflexibility, though this cannot be stated with certainty since caloric intake was not quantified in our study. Thus, our current study with a robust exercise-induced bone in SEIPIN KO means that BMAT might have no role or potentially a different role in skeletal anabolism of SEIPIN KO. Abundant in vitro data suggests mechanical signals, mediated by Wnt/β-catenin, cytoskeletal elements, as well as epigenetics -e.g., EZH2- (73) serve to bias mesenchymal stem cells away from the adipocyte lineage, thereby promoting bone; yet these questions remain to be definitively answered in vivo. Many of these mechanisms are likely operating in concert with metabolism to achieve exercise-induced bone formation. Future work is needed to improve our understanding of how exercise impacts bone health and metabolic health in lipodystrophy.
Our finding of quantifiable but lower quantity of BMAT in SEIPIN KO is new and provides a systematic quantification of this depot in a mouse model of severe generalized congenital lipodystrophy. In humans, CGL via SEIPIN deficiency is characterized by an absence of white adipose tissue stores (31, 32, 74, 75). Marrow Adipose Tissue in lipodystrophy has not been sufficiently quantified due to the rarity of this disorder (17, 18, 20, 21, 76); though it has been investigated in rodents in other less severe forms of lipodystrophy (PPARγ +/- or Cav1-/-) (77). A study of adipocyte-specific deletion of Bscl2, rather than global deletion, showed preservation of vertebral BMAT with a relative loss of tibial (proximal and distal) BMAT, though these animals do not exhibit metabolic dysfunction as noted in global SEIPIN deletion (71). Prior case reports measured BMAT via biopsy or MRI however the small subject number in these precludes a definitive answer (23–25). Interestingly, the prior human studies had mixed reports on preservation of bone marrow adipose across CGL causal mutations (23–25). This study demonstrated that global ablation of SEIPIN in mice associated with reduced marrow adiposity in the proximal femur- and relative preservation in the distal femur. This finding of preservation at the distal end of a mechanically sensitive long bone and the reduction of BMAT proximally, might be viewed as consistent with the prior literature in both human and animal studies which was mixed and reinforces the need for quantitative volumetric investigations of BMAT that might clarify the physiologic role of the distal vs the proximal femoral BMAT depot.
Prior studies suggested an increase in bone mass in CGL along with cystic bony lesions. Here, SEIPIN KO mice had similar trabecular bone metrics compared to WT, while cortical parameters demonstrated a negative effect of genotype on cortical bone geometry. Our data fits with clinical reports of bone parameters in CGL patients, assessed via DXA, showing increased density primarily at trabecular sites, whereas cortical sites, like the radial diaphysis, is decreased (20).
Several adipokines are known to play a role in whole body metabolism and possibly in the regulation of BMAT (78). Though not assessed here, leptin plays a key role in the regulation of bone mass (79) and its deficiency has been proposed to be causal in driving the bone phenotype in lipodystrophy (80). However, despite a beneficial therapeutic effect on metabolism in CGL patients, leptin therapy fails to attenuate bone mass (23). Adiponectin is associated with fat mass, particularly in exercise-induced weight loss (81). CGL lipodystrophic patients exhibit decreased serum levels of adiponectin, consistent with global reduction of adipocytes (82). In bone, we found significantly lower adiponectin mRNA in SEIPIN KO which might be due to lower BMAT; serum adiponectin levels were not assessed. Prior work suggested Bscl2 may play a role in brown adipose tissue function (83), however BAT-specific Bscl2 deletion showed Bscl2 is not required for brown adipogenesis, but rather plays a cell-autonomous role in mediating BAT development and function (84, 85). Marrow adipocytes in our global Bscl2 KO and WT sections were unilocular and similar between KO and WT, though locularity and mRNA analyses (Figure 6) are insufficient to exclude brown/beige properties and require additional investigations (UCP1 staining, or ultrastructural as well as bioenergetic analyses of mitochondria (86, 87), are important for future studies. No difference in bone mRNA for sclerostin and osteocalcin was found between groups, even with exercise-induced bone formation, in line with prior work (14). Studies that showed an attenuation of sclerostin/osteocalcin in BSCL (88) measured these in the serum, whereas our study investigated these solely in bone and thus cannot be compared.
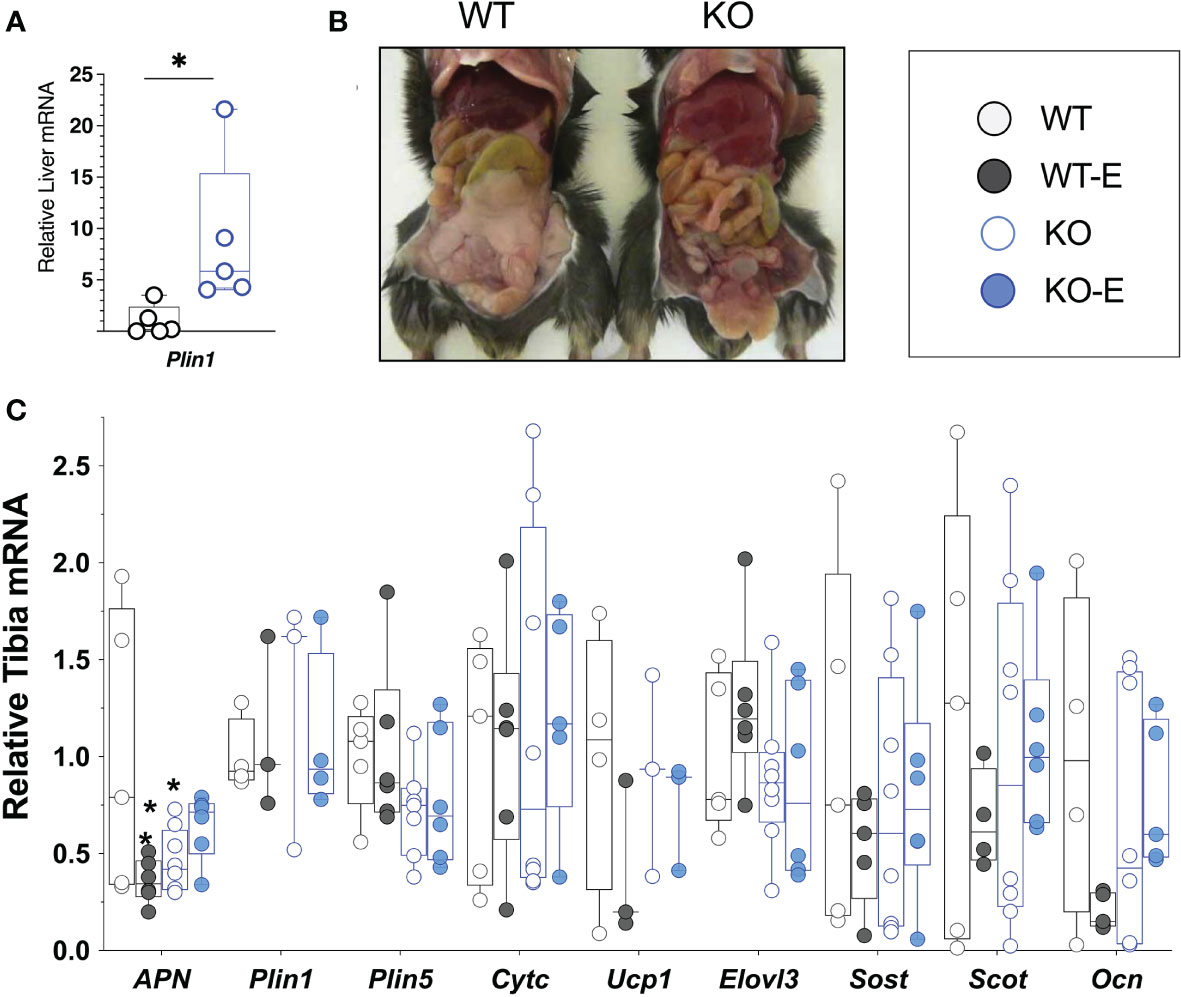
Figure 6 SEIPIN global KO demonstrate higher liver Plin1 expression, consistent with lipodystrophy. (A) Liver mRNA (N=5) via qPCR shows relative expression of Plin1. (B), Representative photo of KO and WT demonstrating lipodystrophic liver phenotype in KO. (C) Whole Tibia mRNA (N=4-8) via qPCR for metabolism, bone markers. Box and whisker plot, min to max with means. Between group differences as *p < 0.05 vs. WT.
With regard to BMAT quantification, we and others previously published on presence of BMAT in similar age animals in long bones, femur and/or tibia (14, 15, 40, 41, 89, 90), as well as validating this method against histology and osmium-µCT (15) (Supplementary Figure 1, Extended Methods). High resolution Magnetic Resonance (MR)-based methods are considered gold standard for analysis of adipose depots and body composition across multiple organisms. MR-based methods to look at BMAT were published as early as1990 in the radiology literature (91) and eventually in the early 2000’s in bone and endocrine fields and beyond (92–102). In sum, high resolution MR based methods are widely used for preclinical and clinical applications, for quantification of white adipose stores, body composition analyses, as well as for quantification of BMAT.
Key limitations of this study include the absence of metabolic and caloric intake measurements, the absence of female sex, the number of animals analyzed via histomorphometry, as well as the lack of additional age groups. In addition to quantification of adipose stores noted, it will be clinically meaningful for future studies to quantify mechanical non-marrow depots in the feet and around the tail in SEIPIN KO, as this was shown to differ in clinical syndromes (23, 103). Our team previously published on the metabolic parameters in the same Bscl2 KO mice; our new findings with regard to effects of exercise on bone formation findings suggest that future studies should be initiated to investigate whether running alters metabolic health in the SEIPIN KO condition. Due to the metabolic dysfunction seen in Bscl2, these measurements are highly relevant and may impact bone and BMAT outcomes. SEIPIN deficient mice, including male mice of similar age, have been extensively documented to exhibit metabolic dysfunction consistent with similar clinical dysfunction documented in CGL patients (31, 104).
In sum, our data provide evidence for BMAT as a unique adipose depot in the context of congenital generalized lipodystrophy. Concomitant with global reduction of white adipose stores, marrow adiposity was reduced in SEIPIN KO, particularly in the proximal femur. Cortical bone geometry was negatively altered in KO, while trabecular bone was unaffected. Exercise-induced trabecular bone was possible, despite lack of attenuation in BMAT, highlighting the likelihood that SEIPIN deficient mice rely on alternative substrates to fuel bone anabolism. The lack of prior research on physical exercise in lipodystrophy, whether clinically or mechanistically, represents a significant knowledge gap. Our work demonstrates a beneficial impact of exercise on bone in a mouse model of severe CGL. Future studies are needed to understand the metabolic benefit of exercise for lipodystrophy and how this relates to musculoskeletal health.
Data Availability Statement
The original contributions presented in the study are included in the article/Supplementary Material. Further inquiries can be directed to the corresponding author.
Ethics Statement
The animal study was reviewed and approved by the University of North Carolina’s Institutional Animal Care and Use Committee (IACUC).
Author Contributions
MS, JR, and RAC contributed to conception and design of the study. CM, JSS, BS, ZX, XZ, MAS, and ELK collected and/or analyzed data. Both CM and SEL-L organized, analyzed data, and drafted portions of the manuscript. MS wrote the final version of the manuscript. All authors contributed to manuscript revision, read, and approved the submitted version.
Funding
Grant Support: NIH awards: MS: R01AR073264 and KL2TR002490, JR: R01AR075803, EK: R01DK107481.
Conflict of Interest
The authors declare that the research was conducted in the absence of any commercial or financial relationships that could be construed as a potential conflict of interest.
Publisher’s Note
All claims expressed in this article are solely those of the authors and do not necessarily represent those of their affiliated organizations, or those of the publisher, the editors and the reviewers. Any product that may be evaluated in this article, or claim that may be made by its manufacturer, is not guaranteed or endorsed by the publisher.
Supplementary Material
The Supplementary Material for this article can be found online at: https://www.frontiersin.org/articles/10.3389/fendo.2021.782194/full#supplementary-material
References
1. Manolagas SC, Kousteni S, Jilka RL. Sex Steroids and Bone. Recent Prog Horm Res (2002) 57:385–409. doi: 10.1210/rp.57.1.385
2. Sen B, Styner M, Xie Z, Case N, Rubin CT, Rubin J. Mechanical Loading Regulates NFATc1 and β-Catenin Signaling Through a GSK3β Control Node*. J Biol Chem (2009) 284:34607–17. doi: 10.1074/jbc.m109.039453
3. Case N, Thomas J, Xie Z, Sen B, Styner M, Rowe D, et al. Mechanical Input Restrains Pparγ2 Expression and Action to Preserve Mesenchymal Stem Cell Multipotentiality. Bone (2013) 52:454–64. doi: 10.1016/j.bone.2012.08.122
4. Uzer G, Thompson WR, Sen B, Xie Z, Yen SS, Miller S, et al. Cell Mechanosensitivity to Extremely Low-Magnitude Signals Is Enabled by a LINCed Nucleus. Stem Cells (2015) 33:2063–76. doi: 10.1002/stem.2004
5. Rubin J, Styner M, Uzer G. Physical Signals May Affect Mesenchymal Stem Cell Differentiation via Epigenetic Controls. Exercise Sport Sci R (2018) 46:42–7. doi: 10.1249/jes.0000000000000129
6. Pagnotti GM, Styner M, Uzer G, Patel VS, Wright LE, Ness KK, et al. Combating Osteoporosis and Obesity With Exercise: Leveraging Cell Mechanosensitivity. Nat Rev Endocrinol (2019) 15:339–55. doi: 10.1038/s41574-019-0170-1
7. Judex S, Donahue LR, Rubin C. Genetic Predisposition to Low Bone Mass Is Paralleled by an Enhanced Sensitivity to Signals Anabolic to the Skeleton. FASEB J (2002) 16:1280–2. doi: 10.1096/fj.01-0913fje
8. Judex S, Boyd S, Qin YX, Turner S, Ye K, Muller R, et al. Adaptations of Trabecular Bone to Low Magnitude Vibrations Result in More Uniform Stress and Strain Under Load. Ann BioMed Eng (2003) 31:12–20. doi: 10.1114/1.1535414
9. Luu YK, Lublinsky S, Ozcivici E, Capilla E, Pessin JE, Rubin CT, et al. In Vivo Quantification of Subcutaneous and Visceral Adiposity by Micro-Computed Tomography in a Small Animal Model. Med Eng Phys (2009) 31:34–41. doi: 10.1016/j.medengphy.2008.03.006
10. Wallace IJ, Pagnotti GM, Rubin-Sigler J, Naeher M, Copes LE, Judex S, et al. Focal Enhancement of the Skeleton to Exercise Correlates With Responsivity of Bone Marrow Mesenchymal Stem Cells Rather Than Peak External Forces. J Exp Biol (2015) 218:3002–9. doi: 10.1242/jeb.118729
11. Laufs U, Werner N, Link A, Endres M, Wassmann S, Jurgens K, et al. Physical Training Increases Endothelial Progenitor Cells, Inhibits Neointima Formation, and Enhances Angiogenesis. Circulation (2004) 109:220–6. doi: 10.1161/01.CIR.0000109141.48980.37
12. Alekos NS, Moorer MC, Riddle RC. Dual Effects of Lipid Metabolism on Osteoblast Function. Front Endocrinol (2020) 11:578194. doi: 10.3389/fendo.2020.578194
13. van Gastel N, Stegen S, Eelen G, Schoors S, Carlier A, Daniels VW, et al. Lipid Availability Determines Fate of Skeletal Progenitor Cells via SOX9. Nature (2020) 579:111–7. doi: 10.1038/s41586-020-2050-1
14. McGrath C, Sankaran JS, Misaghian-Xanthos N, Sen B, Xie Z, Styner MA, et al. Exercise Degrades Bone in Caloric Restriction, Despite Suppression of Marrow Adipose Tissue (MAT). J Bone Miner Res (2020) 35:106–15. doi: 10.1002/jbmr.3872
15. Styner M, Pagnotti GM, McGrath C, Wu X, Sen B, Uzer G, et al. Exercise Decreases Marrow Adipose Tissue Through ß-Oxidation in Obese Running Mice. J Bone Miner Res (2017) 32:1692–702. doi: 10.1002/jbmr.3159
16. Little-Letsinger SE, Pagnotti GM, McGrath C, Styner M. Exercise and Diet: Uncovering Prospective Mediators of Skeletal Fragility in Bone and Marrow Adipose Tissue. Curr Osteoporos Rep (2020) 18:774–89. doi: 10.1007/s11914-020-00634-y
17. Bandeira FF, Miranda CR, Waechter C, Bandeira ME. High Bone Mass Associated With Berardinelli Lipodystrophy. Endocrine practice: Off J Am Coll Endocrinol Am Assoc Clin Endocrinologists (2007) 13:764–9. doi: 10.4158/ep.13.7.764
18. Guell-Gonzalez JR, de Acosta OM, Alavez-Martin E, Arce-Hidalgo B, Navarro-Lauten A, Diaz-Diaz O. Bone Lesions in Congenital Generalised Lipodystrophy. Lancet (1971) 2:104–5. doi: 10.1016/S0140-6736(71)92085-X
19. Miranda DM, Wajchenberg BL, Calsolari MR, Aguiar MJ, Silva JM, Ribeiro MG, et al. Novel Mutations of the BSCL2 and AGPAT2 Genes in 10 Families With Berardinelli-Seip Congenital Generalized Lipodystrophy Syndrome. Clin Endocrinol (2009) 71:512–7. doi: 10.1111/j.1365-2265.2009.03532.x
20. Lima JG, Nobrega LHC, Lima NN, Santos MCFD, Baracho MFP, Bandeira F, et al. Bone Density in Patients With Berardinelli-Seip Congenital Lipodystrophy Is Higher in Trabecular Sites and in Type 2 Patients. J Clin densitometry: Off J Int Soc Clin Densitometry (2018) 21:61–7. doi: 10.1016/j.jocd.2016.10.002
21. Fleckenstein JL, Garg A, Bonte FJ, Vuitch MF, Peshock RM. The Skeleton in Congenital, Generalized Lipodystrophy: Evaluation Using Whole-Body Radiographic Surveys, Magnetic Resonance Imaging and Technetium-99m Bone Scintigraphy. Skeletal Radiol (1992) 21:381–6. doi: 10.1007/BF00241817
22. Garg A, Fleckenstein JL, Peshock RM, Grundy SM. Peculiar Distribution of Adipose Tissue in Patients With Congenital Generalized Lipodystrophy. J Clin Endocrinol Metab (1992) 75:358–61. doi: 10.1210/jcem.75.2.1639935
23. Simha V, Garg A. Phenotypic Heterogeneity in Body Fat Distribution in Patients With Congenital Generalized Lipodystrophy Caused by Mutations in the AGPAT2 or Seipin Genes. J Clin Endocrinol Metab (2003) 88:5433–7. doi: 10.1210/jc.2003-030835
24. Kobashi Y, Schoenbaum A, Hasserjian RP, Rosenthal DI. Berardinelli-Seip Lipodystrophy. Skeletal Radiol (2007) 36:999–1003. doi: 10.1007/s00256-007-0332-4
25. Kim CA, Delepine M, Boutet E, Mourabit HE, Lay SL, Meier M, et al. Association of a Homozygous Nonsense Caveolin-1 Mutation With Berardinelli-Seip Congenital Lipodystrophy. J Clin Endocrinol Metab (2008) 93:1129–34. doi: 10.1210/jc.2007-1328
26. Garg A, Peshock RM, Fleckenstein JL. Adipose Tissue Distribution Pattern in Patients With Familial Partial Lipodystrophy (Dunnigan Variety). J Clin Endocrinol Metab (1999) 84:170–4. doi: 10.1210/jcem.84.1.5383
27. Ducy P, Amling M, Takeda S, Priemel M, Schilling AF, Beil FT, et al. Leptin Inhibits Bone Formation Through a Hypothalamic Relay: A Central Control of Bone Mass. Cell (2000) 100:197–207. doi: 10.1016/S0092-8674(00)81558-5
28. Rubin CT, Capilla E, Luu YK, Busa B, Crawford H, Nolan DJ, et al. Adipogenesis is Inhibited by Brief, Daily Exposure to High-Frequency, Extremely Low-Magnitude Mechanical Signals. Proc Natl Acad Sci United States America (2007) 104:17879–84. doi: 10.1073/pnas.0708467104
29. Zhang Z, Fan J, Long C, He B, Hu Z, Jiang C, et al. Identification and Characterization of the ZRT, IRT-Like Protein (ZIP) Family Genes Reveal Their Involvement in Growth and Kojic Acid Production in Aspergillus Oryzae. J Ind Microbiol Biot (2019) 46:1769–80. doi: 10.1007/s10295-019-02236-9
30. Akune T, Ohba S, Kamekura S, Yamaguchi M, Chung UI, Kubota N, et al. PPARgamma Insufficiency Enhances Osteogenesis Through Osteoblast Formation From Bone Marrow Progenitors. J Clin Invest (2004) 113:846–55. doi: 10.1172/JCI200419900
31. Patni N, Garg A. Congenital Generalized Lipodystrophies-New Insights Into Metabolic Dysfunction. Nat Rev Endocrinol (2015) 11:522–34. doi: 10.1038/nrendo.2015.123
32. Garg A. Clinical Review#: Lipodystrophies: Genetic and Acquired Body Fat Disorders. J Clin Endocrinol Metab (2011) 96:3313–25. doi: 10.1210/jc.2011-1159
33. Garg A. Acquired and Inherited Lipodystrophies. New Engl J Med (2004) 350:1220–34. doi: 10.1056/nejmra025261
34. Magre J, Delepine M, Khallouf E, Maldergem LV, Sobel E, Papp J, et al. Identification of the Gene Altered in Berardinelli-Seip Congenital Lipodystrophy on Chromosome 11q13. Nat Genet (2001) 28:365–70. doi: 10.1038/ng585
35. Salo VT, Belevich I, Li S, Karhinen L, Vihinen H, Vigouroux C, et al. Seipin Regulates ER-Lipid Droplet Contacts and Cargo Delivery. EMBO J (2016) 35:2699–716. doi: 10.15252/embj.201695170
36. Jiang M, Gao M, Wu C, He H, Guo X, Zhou Z, et al. Lack of Testicular Seipin Causes Teratozoospermia Syndrome in Men. Proc Natl Acad Sci United States America (2014) 111:7054–9. doi: 10.1073/pnas.1324025111
37. Pagac M, Cooper DE, Qi Y, Lukmantara IE, Mak HY, Wu Z, et al. SEIPIN Regulates Lipid Droplet Expansion and Adipocyte Development by Modulating the Activity of Glycerol-3-Phosphate Acyltransferase. Cell Rep (2016) 17:1546–59. doi: 10.1016/j.celrep.2016.10.037
38. Chen W, Zhou H, Saha P, Li L, Chan L. Molecular Mechanisms Underlying Fasting Modulated Liver Insulin Sensitivity and Metabolism in Male Lipodystrophic Bscl2/Seipin-Deficient Mice. Endocrinology (2014) 155:4215–25. doi: 10.1210/en.2014-1292
39. Chen W, Chang B, Saha P, Hartig SM, Li L, Reddy VT, et al. Berardinelli-Seip Congenital Lipodystrophy 2/Seipin is a Cell-Autonomous Regulator of Lipolysis Essential for Adipocyte Differentiation. Mol Cell Biol (2012) 32:1099–111. doi: 10.1128/mcb.06465-11
40. Styner M, Thompson WR, Galior K, Uzer G, Wu X, Kadari S, et al. Bone Marrow Fat Accumulation Accelerated by High Fat Diet Is Suppressed by Exercise. Bone (2014) 64:39–46. doi: 10.1016/j.bone.2014.03.044
41. Styner M, Pagnotti GM, Galior K, Wu X, Thompson WR, Uzer G, et al. Exercise Regulation of Marrow Fat in the Setting of Pparγ Agonist Treatment in Female C57BL/6 Mice. Endocrinology (2015) 156:2753–61. doi: 10.1210/en.2015-1213
42. Ocarino NM, Marubayashi U, Cardoso TG, Guimaraes CV, Silva AE, Torres RC, et al. Physical Activity in Osteopenia Treatment Improved the Mass of Bones Directly and Indirectly Submitted to Mechanical Impact. J Musculoskeletal Neuronal Interact (2007) 7:84–93.
43. Pereira LJ, Macari S, Coimbra CC, Pereira T, Barrioni BR, Gomez RS, et al. Aerobic and Resistance Training Improve Alveolar Bone Quality and Interferes With Bone-Remodeling During Orthodontic Tooth Movement in Mice. Bone (2020) 138:115496. doi: 10.1016/j.bone.2020.115496
44. Pagnotti GM, Chan ME, Adler BJ, Shroyer KR, Rubin J, Bain SD, et al. Low Intensity Vibration Mitigates Tumor Progression and Protects Bone Quantity and Quality in a Murine Model of Myeloma. Bone (2016) 90:69–79. doi: 10.1016/j.bone.2016.05.014
45. Yushkevich PA, Piven J, Hazlett HC, Smith RG, Ho S, Gee JC, et al. User-Guided 3D Active Contour Segmentation of Anatomical Structures: Significantly Improved Efficiency and Reliability. Neuroimage (2006) 31:1116–28. doi: 10.1016/j.neuroimage.2006.01.015
46. Joshi S, Davis B, Jomier M, Gerig G. Unbiased Diffeomorphic Atlas Construction for Computational Anatomy. Neuroimage (2004) 23(Suppl 1):S151–60. doi: 10.1016/j.neuroimage.2004.07.068
47. Avants BB, Tustison NJ, Song G, Cook PA, Klein A, Gee JC. A Reproducible Evaluation of ANTs Similarity Metric Performance in Brain Image Registration. Neuroimage (2011) 54:2033–44. doi: 10.1016/j.neuroimage.2010.09.025
48. Fedorov A, Beichel R, Kalpathy-Cramer J, Finet J, Fillion-Robin JC, Pujol S, et al. 3d Slicer as an Image Computing Platform for the Quantitative Imaging Network. Magnetic resonance Imaging (2012) 30:1323–41. doi: 10.1016/j.mri.2012.05.001
49. Longobardi L, Li T, Myers TJ, O’Rear L, Ozkan H, Li Y, et al. TGF-Beta Type II Receptor/MCP-5 Axis: At the Crossroad Between Joint and Growth Plate Development. Dev Cell (2012) 23:71–81. doi: 10.1016/j.devcel.2012.05.004
50. van ‘t Hof RJ, Rose L, Bassonga E, Daroszewska A. Open Source Software for Semi-Automated Histomorphometry of Bone Resorption and Formation Parameters. Bone (2017) 99:69–79. doi: 10.1016/j.bone.2017.03.051
51. Pagnotti GM, Adler BJ, Green DE, Chan ME, Frechette DM, Shroyer KR, et al. Low Magnitude Mechanical Signals Mitigate Osteopenia Without Compromising Longevity in an Aged Murine Model of Spontaneous Granulosa Cell Ovarian Cancer. Bone (2012) 51:570–7. doi: 10.1016/j.bone.2012.05.004
52. Gross TS, Rubin CT. Uniformity of Resorptive Bone Loss Induced by Disuse. J Orthop Res (1995) 13:708–14. doi: 10.1002/jor.1100130510
53. Morton TL, Galior K, McGrath C, Wu X, Uzer G, Uzer GB, et al. Exercise Increases and Browns Muscle Lipid in High-Fat Diet-Fed Mice. Front Endocrinol (2016) 7:80. doi: 10.3389/fendo.2016.00080
54. Styner M, Sen B, Xie Z, Case N, Rubin J. Indomethacin Promotes Adipogenesis of Mesenchymal Stem Cells Through a Cyclooxygenase Independent Mechanism. J Cell Biochem (2010) 111:1042–50. doi: 10.1002/jcb.22793
55. Styner M, Meyer MB, Galior K, Case N, Xie Z, Sen B, et al. Mechanical Strain Downregulates C/Ebpβ in MSC and Decreases Endoplasmic Reticulum Stress. PloS One (2012) 7:e51613. doi: 10.1371/journal.pone.0051613
56. Seip M, Trygstad O. Generalized Lipodystrophy, Congenital and Acquired (Lipoatrophy). Acta Paediatr (1996) 413:2–28. doi: 10.1111/j.1651-2227.1996.tb14262.x
57. Watson SL, Weeks BK, Weis LJ, Harding AT, Horan SA, Beck BR. High-Intensity Resistance and Impact Training Improves Bone Mineral Density and Physical Function in Postmenopausal Women With Osteopenia and Osteoporosis: The LIFTMOR Randomized Controlled Trial. J Bone mineral research: Off J Am Soc Bone Mineral Res (2018) 33:211–20. doi: 10.1002/jbmr.3284
58. Harding AT, Weeks BK, Lambert C, Watson SL, Weis LJ, Beck BR. Effects of Supervised High-Intensity Resistance and Impact Training or Machine-Based Isometric Training on Regional Bone Geometry and Strength in Middle-Aged and Older Men With Low Bone Mass: The LIFTMOR-M Semi-Randomised Controlled Trial. Bone (2020) 136:115362. doi: 10.1016/j.bone.2020.115362
59. Hinton PS, Nigh P, Thyfault J. Effectiveness of Resistance Training or Jumping-Exercise to Increase Bone Mineral Density in Men With Low Bone Mass: A 12-Month Randomized, Clinical Trial. Bone (2015) 79:203–12. doi: 10.1016/j.bone.2015.06.008
60. Harding AT, Weeks BK, Watson SL, Beck BR. The LIFTMOR-M (Lifting Intervention For Training Muscle and Osteoporosis Rehabilitation for Men) Trial: Protocol for a Semirandomised Controlled Trial of Supervised Targeted Exercise to Reduce Risk of Osteoporotic Fracture in Older Men With Low Bone Mass. BMJ Open (2017) 7:e014951. doi: 10.1136/bmjopen-2016-014951
61. Belavy DL, Quittner MJ, Ridgers ND, Shiekh A, Rantalainen T, Trudel G. Specific Modulation of Vertebral Marrow Adipose Tissue by Physical Activity. J Bone mineral research: Off J Am Soc Bone Mineral Res (2018) 33:651–7. doi: 10.1002/jbmr.3357
62. Ozcivici E, Luu YK, Adler B, Qin YX, Rubin J, Judex S, et al. Mechanical Signals as Anabolic Agents in Bone. Nat Rev Rheumatol (2010) 6:50–9. doi: 10.1038/nrrheum.2009.239
63. Menuki K, Mori T, Sakai A, Sakuma M, Okimoto N, Shimizu Y, et al. Climbing Exercise Enhances Osteoblast Differentiation and Inhibits Adipogenic Differentiation With High Expression of PTH/PTHrP Receptor in Bone Marrow Cells. Bone (2008) 43:613–20. doi: 10.1016/j.bone.2008.04.022
64. Mori T, Okimoto N, Sakai A, Okazaki Y, Nakura N, Notomi T, et al. Climbing Exercise Increases Bone Mass and Trabecular Bone Turnover Through Transient Regulation of Marrow Osteogenic and Osteoclastogenic Potentials in Mice. J Bone mineral research: Off J Am Soc Bone Mineral Res (2003) 18:2002–9. doi: 10.1359/jbmr.2003.18.11.2002
65. Jones HH, Priest JD, Hayes WC, Tichenor CC, Nagel DA. Humeral Hypertrophy in Response to Exercise. J Bone Joint Surg Am (1977) 59:204–8. doi: 10.2106/00004623-197759020-00012
66. Friedlander AL, Genant HK, Sadowsky S, Byl NN, Gluer CC. A Two-Year Program of Aerobics and Weight Training Enhances Bone Mineral Density of Young Women. J Bone Mineral Research: Off J Am Soc Bone Mineral Res (1995) 10:574–85. doi: 10.1002/jbmr.5650100410
67. Brown RJ, Araujo-Vilar D, Cheung PT, Dunger D, Garg A, Jack M, et al. The Diagnosis and Management of Lipodystrophy Syndromes: A Multi-Society Practice Guideline. J Clin Endocrinol Metab (2016) 101:4500–11. doi: 10.1210/jc.2016-2466
68. Grevengoed TJ, Klett EL, Coleman RA. Acyl-CoA Metabolism and Partitioning. Annu Rev Nutr (2014) 34:1–30. doi: 10.1146/annurev-nutr-071813-105541
69. Zhao L, Pascual F, Bacudio L, Suchanek AL, Young PA, Li LO, et al. Defective Fatty Acid Oxidation in Mice With Muscle-Specific Acyl-CoA Synthetase 1 Deficiency Increases Amino Acid Use and Impairs Muscle Function. J Biol Chem (2019) 294:8819–33. doi: 10.1074/jbc.ra118.006790
70. Kim SP, Li Z, Zoch ML, Frey JL, Bowman CE, Kushwaha P, et al. Fatty Acid Oxidation by the Osteoblast Is Required for Normal Bone Acquisition in a Sex- and Diet-Dependent Manner. JCI Insight (2017) 2:1–16. doi: 10.1172/jci.insight.92704
71. McIlroy GD, Suchacki K, Roelofs AJ, Yang W, Fu Y, Bai B, et al. Adipose Specific Disruption of Seipin Causes Early-Onset Generalised Lipodystrophy and Altered Fuel Utilisation Without Severe Metabolic Disease. Mol Metab (2018) 10:55–65. doi: 10.1016/j.molmet.2018.01.019
72. Carhuatanta KAK, Demuro G, Tschop MH, Pfluger PT, Benoit SC, Obici S. Voluntary Exercise Improves High-Fat Diet-Induced Leptin Resistance Independent of Adiposity. Endocrinology (2011) 152:2655–64. doi: 10.1210/en.2010-1340
73. Sen B, Paradise CR, Xie Z, Sankaran J, Uzer G, Styner M, et al. β-Catenin Preserves the Stem State of Murine Bone Marrow Stromal Cells Through Activation of EZH2. J Bone Miner Res (2020) 35:1149–62. doi: 10.1002/jbmr.3975
74. Berardinelli W. An Undiagnosed Endocrinometabolic Syndrome: Report of 2 Cases. J Clin Endocrinol Metab (1954) 14:193–204. doi: 10.1210/jcem-14-2-193
75. Seip M. Lipodystrophy and Gigantism With Associated Endocrine Manifestations. A New Diencephalic Syndrome? Acta Paediatr (1959) 48:555–74.
76. Westvik J. Radiological Features in Generalized Lipodystrophy. Acta Paediatr Suppl (1996) 413:44–51. doi: 10.1111/j.1651-2227.1996.tb14265.x
77. Rubin J, Schwartz Z, Boyan BD, Fan X, Case N, Sen B, et al. Caveolin-1 Knockout Mice Have Increased Bone Size and Stiffness. J Bone mineral research: Off J Am Soc Bone Mineral Res (2007) 22:1408–18. doi: 10.1359/jbmr.070601
78. Scheller EL, Khoury B, Moller KL, Wee NK, Khandaker S, Kozloff KM, et al. Changes in Skeletal Integrity and Marrow Adiposity During High-Fat Diet and After Weight Loss. Front Endocrinol (2016) 7:102. doi: 10.3389/fendo.2016.00102
79. Takeda S, Elefteriou F, Levasseur R, Liu X, Zhao L, Parker KL, et al. Leptin Regulates Bone Formation via the Sympathetic Nervous System. Cell (2002) 111:305–17. doi: 10.1016/s0092-8674(02)01049-8
80. Lima JG, Lima NN, Nobrega LH, Jeronimo SM. Conversations Between Insulin and Bone: Potential Mechanism of High Bone Density in Patients With Berardinelli-Seip Congenital Lipodystrophy. Med Hypotheses (2016) 97:94–7. doi: 10.1016/j.mehy.2016.10.025
81. Vu V, Riddell MC, Sweeney G. Circulating Adiponectin and Adiponectin Receptor Expression in Skeletal Muscle: Effects of Exercise. Diabetes Metab Res Rev (2007) 23:600–11. doi: 10.1002/dmrr.778
82. Haque WA, Shimomura I, Matsuzawa Y, Garg A. Serum Adiponectin and Leptin Levels in Patients With Lipodystrophies. J Clin Endocrinol Metab (2002) 87:2395. doi: 10.1210/jcem.87.5.8624
83. Dollet L, Magre J, Joubert M, May CL, Ayer A, Arnaud L, et al. Seipin Deficiency Alters Brown Adipose Tissue Thermogenesis and Insulin Sensitivity in a non-Cell Autonomous Mode. Sci Rep-uk (2016) 6:35487. doi: 10.1038/srep35487
84. Zhou H, Black SM, Benson TW, Weintraub NL, Chen W. Berardinelli-Seip Congenital Lipodystrophy 2/Seipin Is Not Required for Brown Adipogenesis But Regulates Brown Adipose Tissue Development and Function. Mol Cell Biol (2016) 36:2027–38. doi: 10.1128/mcb.01120-15
85. Zhou H, Xu C, Lee H, Yoon Y, Chen W. Berardinelli-Seip Congenital Lipodystrophy 2/SEIPIN Determines Brown Adipose Tissue Maintenance and Thermogenic Programing. Mol Metab (2020) 36:100971. doi: 10.1016/j.molmet.2020.02.014
86. Cypess AM, White AP, Vernochet C, Schulz TJ, Xue R, Sass CA, et al. Anatomical Localization, Gene Expression Profiling and Functional Characterization of Adult Human Neck Brown Fat. Nat Med (2013) 19:635–9. doi: 10.1038/nm.3112
87. Kim DW, Kim BS, Kwon HS, Kim CG, Lee HW, Choi WH, et al. Atrophy of Brown Adipocytes in the Adult Mouse Causes Transformation Into White Adipocyte-Like Cells. Exp Mol Med (2003) 35:518–26. doi: 10.1038/emm.2003.67
88. Lima JG, Nobrega LHC, Lima NN, Santos MCFD, Baracho MFP, Winzenrieth R, et al. Normal Bone Density and Trabecular Bone Score, But High Serum Sclerostin in Congenital Generalized Lipodystrophy. Bone (2017) 101:21–5. doi: 10.1016/j.bone.2017.03.053
89. Cawthorn WP, Scheller EL, Parlee SD, Pham HA, Learman BS, Redshaw CM, et al. Expansion of Bone Marrow Adipose Tissue During Caloric Restriction Is Associated With Increased Circulating Glucocorticoids and Not With Hypoleptinemia. Endocrinology (2016) 157:508–21. doi: 10.1210/en.2015-1477
90. Suchacki KJ, Tavares AAS, Mattiucci D, Scheller EL, Papanastasiou G, Gray C, et al. Bone Marrow Adipose Tissue Is a Unique Adipose Subtype With Distinct Roles in Glucose Homeostasis. Nat Commun (2020) 11:3097. doi: 10.1038/s41467-020-16878-2
91. Moore SG, Dawson KL. Red and Yellow Marrow in the Femur: Age-Related Changes in Appearance at MR Imaging. Radiology (1990) 175:219–23. doi: 10.1148/radiology.175.1.2315484
92. Rosen CJ, Klibanski A. Bone, Fat, and Body Composition: Evolving Concepts in the Pathogenesis of Osteoporosis. Am J Med (2009) 122:409–14. doi: 10.1016/j.amjmed.2008.11.027
93. Fazeli PK, Bredella MA, Misra M, Meenaghan E, Rosen CJ, Clemmons DR, et al. Preadipocyte Factor-1 is Associated With Marrow Adiposity and Bone Mineral Density in Women With Anorexia Nervosa. J Clin Endocrinol Metab (2010) 95:407–13. doi: 10.1210/jc.2009-1152
94. Griffith JF, Yeung DK, Ahuja AT, Choy CW, Mei WY, Lam SS, et al. A Study of Bone Marrow and Subcutaneous Fatty Acid Composition in Subjects of Varying Bone Mineral Density. Bone (2009) 44:1092–6. doi: 10.1016/j.bone.2009.02.022
95. Trudel G, Payne M, Madler B, Ramachandran N, Lecompte M, Wade C, et al. Bone Marrow Fat Accumulation After 60 Days of Bed Rest Persisted 1 Year After Activities Were Resumed Along With Hemopoietic Stimulation: The Women International Space Simulation for Exploration Study. J Appl Physiol (2009) 107:540–8. doi: 10.1152/japplphysiol.91530.2008
96. Shen W, Scherzer R, Gantz M, Chen J, Punyanitya M, Lewis CE, et al. Relationship Between MRI-Measured Bone Marrow Adipose Tissue and Hip and Spine Bone Mineral Density in African-American and Caucasian Participants: The CARDIA Study. J Clin Endocrinol Metab (2012) 97:1337–46. doi: 10.1210/jc.2011-2605
97. Gao Y, Zong K, Gao Z, Rubin MR, Chen J, Heymsfield SB, et al. Magnetic Resonance Imaging-Measured Bone Marrow Adipose Tissue Area is Inversely Related to Cortical Bone Area in Children and Adolescents Aged 5-18 Years. J Clin Densitometry: Off J Int Soc Clin Densitometry (2015) 18:203–8. doi: 10.1016/j.jocd.2015.03.002
98. Woods GN, Ewing SK, Sigurdsson S, Kado DM, Ix JH, Hue TF, et al. Chronic Kidney Disease Is Associated With Greater Bone Marrow Adiposity. J Bone Mineral Research: Off J Am Soc Bone Mineral Res (2018) 33:2158–64. doi: 10.1002/jbmr.3562
99. Blom-Hogestol IK, Mala T, Kristinsson JA, Hauge EM, Brunborg C, Gulseth HL, et al. Changes in Bone Marrow Adipose Tissue One Year After Roux-En-Y Gastric Bypass: A Prospective Cohort Study. J Bone mineral research: Off J Am Soc Bone Mineral Res (2019) 34:1815–23. doi: 10.1002/jbmr.3814
100. Polineni S, Resulaj M, Faje AT, Meenaghan E, Bredella MA, Bouxsein M, et al. Red and White Blood Cell Counts Are Associated With Bone Marrow Adipose Tissue, Bone Mineral Density, and Bone Microarchitecture in Premenopausal Women. J Bone mineral research: Off J Am Soc Bone Mineral Res (2020) 35:1031–9. doi: 10.1002/jbmr.3986
101. Rajapakse CS, Johncola AJ, Batzdorf AS, Jones BC, Mukaddam MA, Sexton K, et al. Effect of Low-Intensity Vibration on Bone Strength, Microstructure, and Adiposity in Pre-Osteoporotic Postmenopausal Women: A Randomized Placebo-Controlled Trial. J Bone Miner Res (2020) 36:673–84. doi: 10.1002/jbmr.4229
102. Whitney DG, Devlin MJ, Alford AI, Modlesky CM, Peterson MD, Li Y, et al. Test-Retest Reliability and Correlates of Vertebral Bone Marrow Lipid Composition by Lipidomics Among Children With Varying Degrees of Bone Fragility. Jbmr Plus (2020) 4:e10400. doi: 10.1002/jbm4.10400
103. Saydam O, Saydam BO, Adiyaman CS, Ince MS, Eren MA, Keskin FE, et al. Diabetic Foot Ulcers: A Neglected Complication of Lipodystrophy. Diabetes Care (2020) 43:e149–51. doi: 10.2337/dc20-1655. (10AD).
Keywords: exercise, endocrinology and metabolism, congenital lipodystrophy, bone, SEIPIN, BSCL2, anabolism, bone marrow adipose tissue (BMAT)
Citation: McGrath C, Little-Letsinger SE, Sankaran JS, Sen B, Xie Z, Styner MA, Zong X, Chen W, Rubin J, Klett EL, Coleman RA and Styner M (2022) Exercise Increases Bone in SEIPIN Deficient Lipodystrophy, Despite Low Marrow Adiposity. Front. Endocrinol. 12:782194. doi: 10.3389/fendo.2021.782194
Received: 27 September 2021; Accepted: 20 December 2021;
Published: 25 January 2022.
Edited by:
Michaela Tencerova, Academy of Sciences of the Czech Republic (ASCR), CzechiaReviewed by:
Jocelyne Magré, Institut National de la Santé et de la Recherche Médicale (INSERM), FranceSamantha Costa, Maine Medical Center Research Institute, United States
Copyright © 2022 McGrath, Little-Letsinger, Sankaran, Sen, Xie, Styner, Zong, Chen, Rubin, Klett, Coleman and Styner. This is an open-access article distributed under the terms of the Creative Commons Attribution License (CC BY). The use, distribution or reproduction in other forums is permitted, provided the original author(s) and the copyright owner(s) are credited and that the original publication in this journal is cited, in accordance with accepted academic practice. No use, distribution or reproduction is permitted which does not comply with these terms.
*Correspondence: Maya Styner, bXN0eW5lckB1bmMuZWR1
†ORCID ID: Cody McGrath, orcid.org/0000-0003-0176-4240
Sarah E. Little-Letsinger, orcid.org/0000-0001-5818-9676
Janet Rubin, orcid.org/0000-0003-3534-8667
Eric L. Klett, orcid.org/0000-0002-8000-6810
Maya Styner, orcid.org/0000-0001-9790-8645