 Yi Zhang1,2
 Konosuke Otomaru3Kazunaga Oshima4Yuji Goto4Ichiro Oshima1
 Susumu Muroya5Mitsue Sano6Sanggun Roh7
 Takafumi Gotoh1,2*
- 1Faculty of Agriculture, Kagoshima University, Kagoshima, Japan
- 2Kuju Agricultural Research Center, Kyushu University, Taketa, Japan
- 3Joint Faculty of Veterinary Medicine, Kagoshima University, Kagoshima, Japan
- 4Western Region Agricultural Research Center, National Agriculture and Food Research Organization (NARO), Oda, Japan
- 5Institute of Livestock and Grassland Science, National Agriculture and Food Research Organization (NARO), Tsukuba, Japan
- 6Department of Nutrition, School of Human Cultures, The University of Shiga Prefecture, Hikone, Japan
- 7Graduate School of Agricultural Science, Tohoku University, Sendai, Japan
We hypothesized that maternal low or high nutrition would give unique effects to morphological and molecular dynamics in adipose tissue of fetus of fatty breed Wagyu (Japanese Black) cattle which produce highly marbled beef. This study aimed to determine the effects of maternal energy intake in Wagyu cows, during gestation on fetal adipose tissue development, histochemical properties, and gene and microRNA (miRNA) expression. Cows were allocated to one of two nutritional energy groups: 120% (HIGH) or 60% nutritional requirements of (LOW). Fetuses (n = 6 per treatment) were removed from pregnant cows by cesarean section at fetal age 260 ± 8 days and euthanized. Subcutaneous adipose tissue (SAT), thoracic cavity visceral adipose tissue (TVAT), and perirenal adipose tissue (PAT) were collected for analysis. In histochemical analysis, in SAT and PAT, HIGH fetuses had greater diameter of adipocytes than LOW fetuses (P<0.05). Only in SAT, LOW fetuses had more Leptin (LEP) mRNA and tended to have more Peroxisome Proliferator-Activated Receptor gamma (PPARG) CCAAT-enhancer-binding proteins alpha (CEBPA) and Glucose transporter (GLUT) 4 mRNA(P<0.10). In all SAT, TVAT, and PAT, LOW fetuses had higher levels of the brown adipose tissue (BAT) biomarkers Uncoupling Protein (UCP) 1 and PPARG coactivator (PGC) 1α mRNA than HIGH fetuses (P<0.08). Meanwhile, in the other adipose tissue, LOW fetuses had lower PPARG, CEBPA, and Zinc Finger Protein (ZFP) 423 (in TVAT and PAT), FASN (in TVAT), LEP and GLUT4 mRNA (in PAT; P<0.10). In particular, in TVAT and PAT, LOW fetuses exhibited lower expression of WAT biomarkers (PPARG and ZFP423). Differential expression of various miRNAs related to adipogenesis between the LOW and HIGH fetuses was detected in an adipose tissue-specific manner (P<0.10). Based on adipose tissue-specific effects of maternal nutrition, these findings suggested that poor maternal nutrition in Wagyu cattle increased BAT development in SAT, TVAT and PAT, while elevated maternal nutrition stimulated fetal SAT development compared with that of TVAT and PAT.
Introduction
Through its major contribution as a source of protein in people’s diets, beef plays an important role in human health. To improve meat quality-related factors such as juiciness and flavor, intramuscular adipose tissue is crucial (1, 2). However, adipose tissue in carcasses, that is, SAT, renal adipose tissue, and intermuscular adipose tissue, is basically useless or wasted adipose tissue from the perspective of human consumption. Actually, we partly use Wagyu adipose tissue as a material for processed beef in Japan, however a huge amount of wasted adipose tissue is still abandoned. Wagyu (Japanese Black) cattle have not only a greater percentage of intramuscular fat but also a greater mass of carcass adipose tissue than European cattle (3). Although Wagyu is a unique animal model regarding obesity and intramuscular fat accumulation, we would like to shift the focus on its development from increasing intramuscular fat to instead reducing wasted adipose tissue. However, the molecular mechanism behind the accumulation of such adipose tissue in cattle is unknown.
Adipose tissue is scattered throughout the body but comprises 5% to 35% of cattle body mass, depending on age, genotype, and nutrition (4). In terms of the anatomically distinct sites where adipose tissue develops, there are three major sites of accumulation, visceral, subcutaneous, and intermuscular, which are further subdivided into smaller depots defined by anatomical location. The formation of discernible adipocytes begins mid-gestation in beef cattle (4–6). Prior and Laster (7) confirmed that the maternal period during mid- to late gestation in cattle is crucial for adipose tissue development. Additionally, during fetal muscle development, a small portion of the progenitor cells differentiate into adipocytes, which also form intramuscular fat and marbling in the offspring (8). Some studies have demonstrated that the manipulation of maternal nutrition, including over- and undernutrition during gestation, impacts on adipose tissue development and the expression of adipogenesis marker genes in fetuses (4, 9, 10). This suggests that maternal nutrition during gestation plays an important role in adipose tissue development in fetuses.
There are two types of adipose tissue in mammals, white adipose tissue (WAT) and brown adipose tissue (BAT), which have markedly different morphological roles and biological functions (11). In newborns, BAT is essential for ensuring effective adaptation to the extrauterine environment, and the growth of both WAT and BAT during gestation is largely dependent on the supply of nutrients from mother to fetus (12). There are differences of depots place between rodents (interscapular), large mammals and human (around the central organs and supraclavicular region; 12). Change in maternal nutrition at defined stages of gestation would ultimately have long-term adverse effects on the offspring by modifying normal profiles of adipose development. For example, suboptimal maternal nutrition during early to mid-gestation was reported to result in excess macrophage accumulation and the onset of insulin resistance in an adipose tissue depot-specific manner in offspring (12).
At the molecular level, many important factors involved in adipogenesis have been found (PPARG, CEBPA, Stearoyl-CoA desaturase (SCD), Fatty acid synthase (FASN), Fatty acid binding protein (FABP) 4, LEP, TNFα, and ZFP423) (13–17), and in recent years factors involved in the development of brown adipocytes (Uncoupling protein (UCP) 1, PR/SET domain (PRDM) 16, and PGC1α have also been identified (18). Factors related to adipocyte development and metabolism (IGF1, IGF2 GLUT4, INSR, IRS1 PI3K, AKT1, AKT2, and mTOR1) have been considered (19–22). Furthermore, as another factors affecting these genes expression, miRNAs (miRNA-15b, 16 b, 19b, 27b, 33a, 101, 130a, 148a, 152, 196a, 204, 296-3p, and 378) have been noticed (23–33). It has been still unclear how maternal nutrition affects these factors in fetal adipose tissues of Wagyu cattle and its differences among different adipose depots.
We also previously demonstrated that Wagyu cows fed diets with reduced [60% of nutritional requirement: Japan Feeding Standard for Beef Cattle (34;JSFBC)] and slightly greater than required nutritional content (120% of nutritional requirement: JSFBC) from pre-conception to gestational day 260 produced fetuses with phenotypic differences, including fetuses from the latter group having greater adipose tissue mass (2.12-fold), muscle mass (1.42-fold), bone mass (1.24-fold), and fetal body weight (1.39-fold; 35). Several ruminant groups were used to examine the impacts of under- and overnutrition on fetal development; few phenotypic differences in fetuses were identified, although there were differences in gene expression in muscle (36–40). Fetuses with different phenotypes were obtained by different maternal nutrition during gestation (35), these differences might alter the metabolic rate of the whole fetus and change adipose tissue metabolism. We hypothesized that inadequate maternal energy status would alter fetal adipose tissue development in an adipose tissue depot-specific manner in Wagyu fetuses. The objective of this study was thus to determine the consequences of higher or lower maternal energy status throughout gestation on Wagyu fetuses as follows: 1) on the morphology of adipocytes in SAT, and PAT; and 2) on the expression of genes and miRNAs related to growth, adipogenesis, and glucose metabolism in SAT, TVAT, and PAT.
Materials and Methods
Animals, Diets, and Experimental Design
The animal study was reviewed and approved by Kagoshima University Animal Care and Use Committee (A18007). Written informed consent was obtained from the owners of the animals for their participation in this study. The experimental details were previously reported elsewhere (35). Briefly, multiparous Wagyu cows (n = 32) were obtained from Kagoshima University Iriki farm (n = 12) and Western Region Agricultural Research Center (n = 20). The cows were randomly assigned to two dietary treatment groups matched for body mass: diets formulated to meet either 60% (LOW) or 120% (HIGH) of their Japan Feeding Standard for Beef Cattle (34)-predicted energy requirements using formula feed. All cows were housed in a drylot, and diets were individually provided twice daily for 2 months prior to and throughout gestation using stanchions that locked each cow in until all feed had been consumed.
The total mixed ration consisted of whole-crop silage, composed of rice plants, dried timothy grass, rye straw, brown rice, beer lees, sugar cane pellets, tofu lees, soy sauce cake, sugar cane bagasse, rice bran, corn steep liquor, condensed sweet potato distillers’ solubles, rice trienol, calcium, and water. The final crude nutrient composition of mixed feed, on a dry-matter basis, was 56.1% NDF, 36.0% ADF, 11.1% ash, 8.00% crude protein, 0.60% calcium, and 0.30% phosphate. The metabolizable energy provided by the feed was 8.56 MJ/kg dry matter.
All cows were synchronized using a controlled internal drug release device (Easybreed, InterAg Co. Ltd., Hamilton, New Zealand). All cows were inseminated with frozen male-sorted semen from the same sire (Yurikatsuyasu, Kedaka line) to produce half-brothers and to minimize other influencing effects except for nutritional status. After breeding, six cows from each group became pregnant.
Slaughter and Sample Collection
Maternal body weight was measured every month from the start of the study until cows were transported to Kagoshima University Veterinary Teaching Hospital on day 260 ± 8.3 of gestation. Fetuses were obtained by cesarean section and euthanized. The fetal body weight, and weights of carcass muscle, carcass bone, and adipose tissue depots including SAT, TVAT, and PAT were measured as described by Zhang et al. (35).
Sample Processing
SAT was collected from total adipose tissue between skin and the outermost parts of skeletal muscle from the right carcass to measure the weight. SAT samples for histochemical and molecular analysis were taken from adipose tissue located around between forelimb and body trunk. TVAT was collected from the thoracic and visceral cavity of the right-side carcass, and PAT was taken from adipose tissue covering the left kidney. The fetal adipose tissue was dissected free of other connective tissue and these samples for histological analysis were immediately covered with Tissue Tek (tissue freezing medium; Sakura Fine Technical, Tokyo, Japan), rinsed in ice-cold saline, snap-frozen in liquid nitrogen, and stored at −80°C until use.
Histochemical and Immunohistochemical Analyses
A 1-cm3 core of adipose tissue from SAT, TVAT and PAT, immediately covered with tissue freezing medium (Tissue Tek; Sakaura Fine Technical, Tokyo, Japan), snap-frozen in liquid nitrogen, and stored at −80°C until analysis. Adipose tissue samples were sectioned at 10-µm thickness using a cryostat microtome CM3050 S (Leica, Bensheim, Germany). These sections were fixed by 10% formaldehyde and stained by using Harris Modified Hematoxylin (Fisher Scientific, Fair Lawn, NJ, USA) and Eosin Y (EMD Chemicals, Gibbstown, NJ, USA).
Rabbit polyclonal antibody to human Ucp1 (ab10983) was obtained from Abcam (Cambridge, MA, UK) to examine immunolocalization in the SAT, TVAT, and PAT. According to the manufacturer, this antibody was predicted to recognize bovine Ucp1 (41). Endogenous peroxidase was blocked using BLOXALL™ Endogenous Peroxidase and Alkaline Phosphatase Blocking Solution (Vector Laboratories, Inc., Burlingame, CA, USA) for 10 min at room temperature. The sections were washed with PBS and treated using VECTASTAIN ABC Kit, Peroxidase (Rabbit IgG) (Vector Laboratories, Inc.). In accordance with the manufacturer’s instructions, normal goat serum blocking solution was applied for 20 min at room temperature. After washing with PBS, the sections were incubated with the anti-Ucp1 antibody (diluted 1:400) overnight at 4°C. The sections were then washed with PBS and incubated with a biotinylated goat anti-rabbit secondary antibody for 30 min at room temperature. After washing with PBS, the sections were incubated with peroxidase-conjugated streptavidin for 30 min at room temperature. After washing with PBS, the DAB substrate kit (Nichirei Biosciences, Tokyo, Japan) was applied to the sections for 5 min at room temperature, followed by counterstaining with hematoxylin. The sections were then dehydrated and mounted. The experiments were repeated at least three times and the positive staining was reproducibly detected. The sections were captured with an BZ-X800 ALL-IN-ONE fluorescence microscope (Keyence, Tokyo, Japan) under the same microscope objective (30×), and five randomly chosen fields were taken per section for a total of 20 images per animal. Images were randomly selected for analysis, the diameter of adipocytes based on the average of maximum dimension of the long axis and that of the axis perpendicular to the long axis was calculated for at least 50 cells per field area, and at least 250 adipocytes were measured per animal via image analysis using CELL image analysis software (Keyence, Tokyo, Japan) and the cross-sectional area (CSA) of adipocyte was calculated by using the average of the diameter.
Total RNA Extraction and Real-Time qPCR
Total RNA from each adipose tissue was extracted from less than 100 mg of tissue using miniRNeasy Lipid Tissue Kit (Qiagen, Germantown, MD, USA), in accordance with the manufacturer’s instructions. Total RNA samples were quantified using a spectrophotometer (ND-1000; NanoDrop, Wilmington, DE, USA). The purity of RNA (A260/A280) for all samples was above 1.9 and the RNA was stored at −80°C until cDNA synthesis. Total RNA (500 ng) from each individual calf and tissue was reverse-transcribed with the High-Capacity cDNA Reverse Transcription Kit (Life Technologies Inc., Carlsbad, CA, USA), in accordance with the manufacturer’s instructions. The RT products (cDNA) were stored at −30°C for relative quantification by PCR.
The primers were designed using Primer Express 3.0 with a minimum amplicon size of 80 bp (when possible, amplicons of 100–200 bp were chosen), and aligned against publicly available databases using BLASTN (Basic Local Alignment Sequence Tool for Nucleic Acid) at the website of the National Center for Biotechnology Information (NCBI; Bethesda, MD, USA; Table 1). Before qPCR, primers were tested in a 20 µl PCR reaction using the same protocol as described for qPCR except for the final dissociation protocol. For primer testing, we used a universal reference cDNA (RNA mixture from four different bovine tissues) to ensure identification of the desired genes. A total of 5 μl of the PCR product was run in a 2% agarose gel stained with ethidium bromide (2 µl). The remaining 15 µl was cleaned using the QIAquick PCR Purification Kit (Qiagen). Only those primers that did not present as a primer-dimer, had a single band at the expected size in the gel, and had the right amplification product (verified by sequencing) were used for qPCR. The accuracy of each primer pair was also evaluated by the presence of a unique peak during the dissociation step at the end of quantitative PCR (qPCR).
Real-time PCR analysis was performed in triplicate using 100 ng of cDNA in 96-well fast plates using the SYBR Fast Master Mix ABI Prism (D-Mark Biosciences, Toronto, Canada) and the Step-One Plus Real-time PCR system (Life Technologies Inc.). A blank sample and a minus RT were added to control for nonspecific amplification. Relative standard curves, made from a serial dilution of pooled cDNA from the tissue of interest and ranging from 20 to 0.02 ng, were used to determine the relative quantity of each sample. The amplification efficiency for each gene was determined using serial dilution of tissue-specific cDNA and was found to be 100 ± 10% for all genes. The resulting qPCR amplicons were also sequenced to confirm their identity. For each tissue, two to four endogenous controls were tested and the best individual or combination of endogenous control was chosen using NormFinder. Therefore, Ribosomal protein L32 (RPL32) and Ribosomal protein S18 (RPS18) were used as endogenous controls (Table 1) to correct for RNA extraction and reverse-transcription efficiency in the adipose tissues (SAT, TVAF, and PAT, respectively). The endogenous controls were also tested for any treatment effect and were found to be stable among samples within each tissue type, confirming their usefulness as suitable endogenous controls. Sequence-specific products were identified by generating a melting curve in which the Cycle Threshold (CT) value represented the cycle number at which a fluorescent signal was statistically greater than the background. The relative mRNA expression was quantified using the 2–ΔΔCt method and thereby the fold change was calculated (Supplementary Tables).
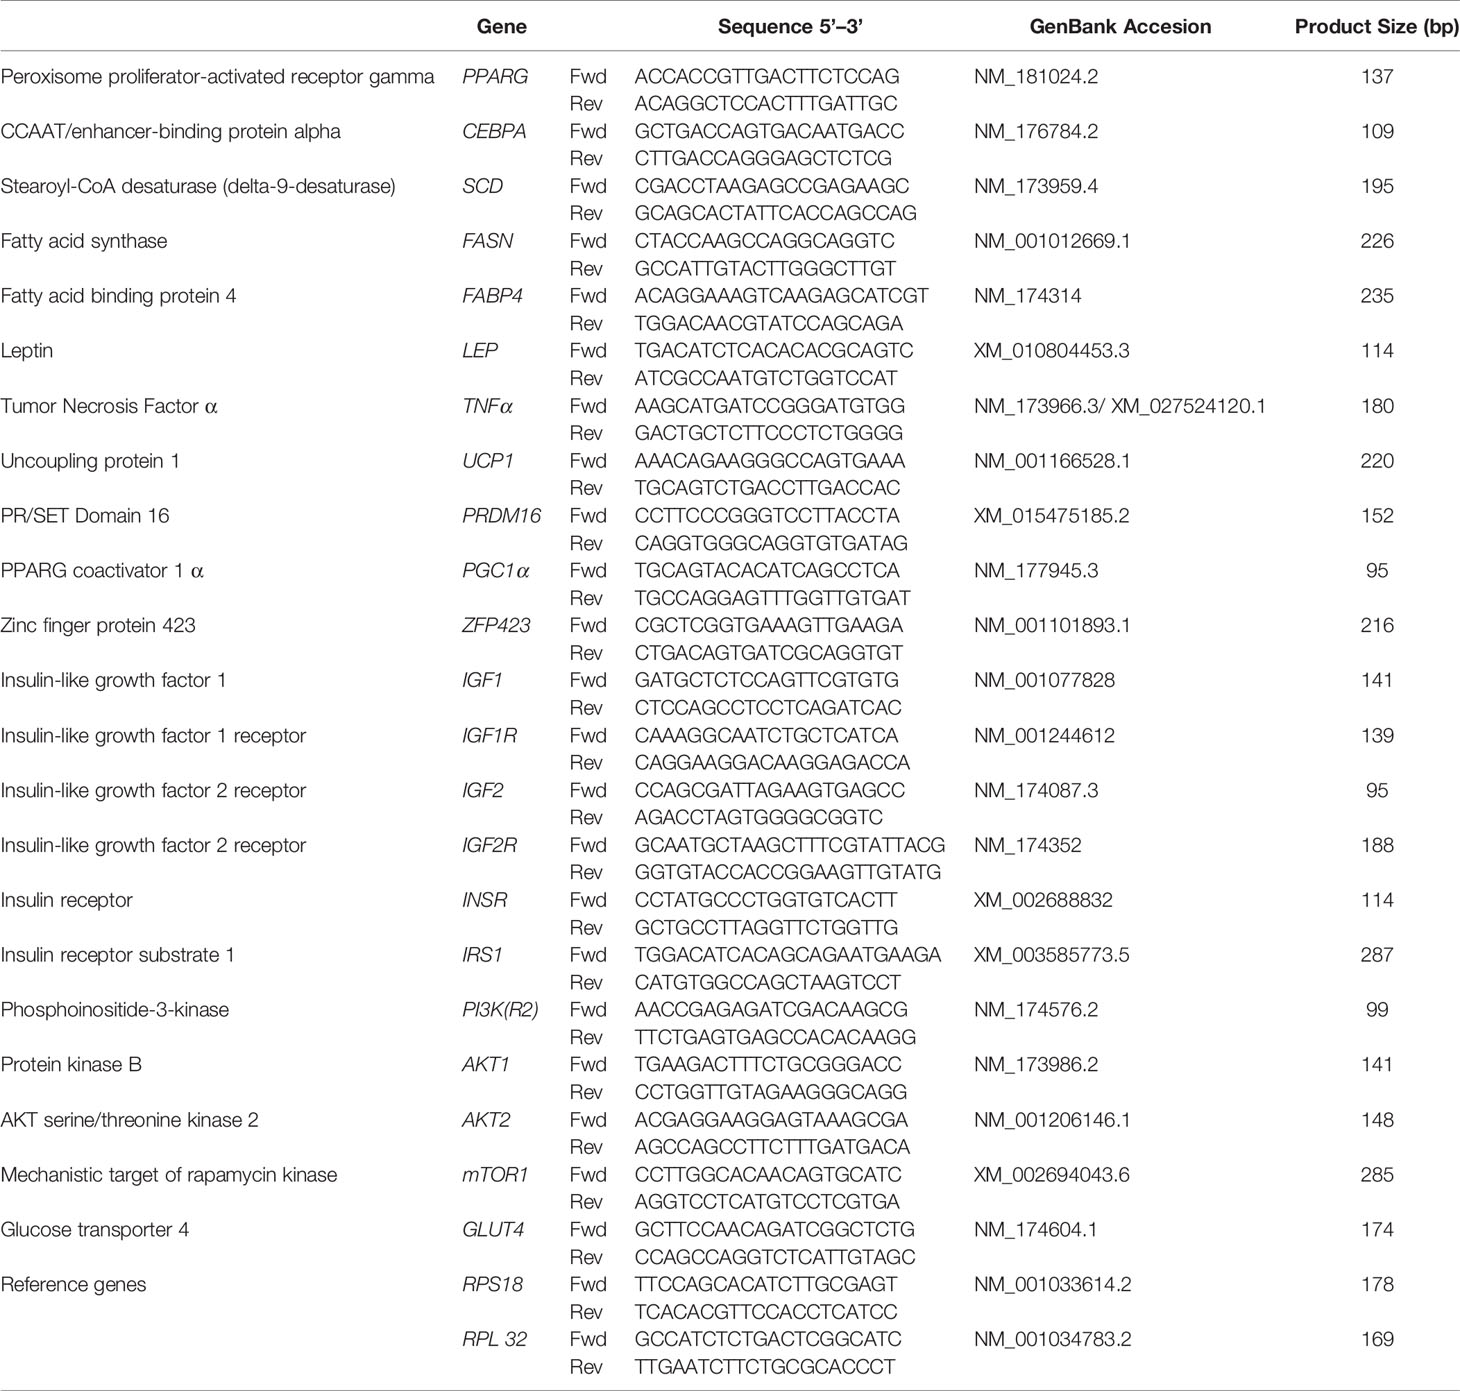
Table 1 Primer sequences for gene expression measured by real-time PCR.
Quantitative RT-PCR Analysis for MicroRNA
Total RNA from each adipose tissue was extracted from less than 100 mg of adipose tissue using the miRNeasy Kit (Qiagen, Germantown, MD, USA), in accordance with the manufacturer’s instructions. Following that, all total RNA samples were quantified using a spectrophotometer (ND-1000; NanoDrop, Wilmington, DE, USA). The purity of RNA (A260/A280) for all samples was above 1.9, and total RNA from each individual calf and tissue was reverse-transcribed with Mir-X miRNA First-Strand Synthesis Kit (Takara Bio USA, Inc.), in accordance with the manufacturer’s instructions. Briefly, cDNAs were reverse-transcribed from 100 ng of total RNA using 2× mRQ buffer and mRQ enzyme miRNA assay. This was performed in a thermal cycler, in which the tube was incubated for 1 h at 37°C, followed by termination at 85°C for 5 min to inactivate the enzymes. After that, 90 µl of ddH2O was added to bring the total volume to 100 µl. Next, the reverse-transcription product was amplified with TB Green qRT-PCR miRNA assay, in accordance with the manufacturer’s instructions, while fluorescence signal was detected with a Plus-one Real-time PCR System Detector® (Applied Biosystems). U6 snRNA was selected as reference miRNA in this study due to its stable expression among all animals and treatments. In the current study, the expression of miRNAs (miR-15b, 16b, 19b, 27b, 33a, 101, 130a, 148a, 152, 196a, 204, 296-3p, and 378) was analyzed (Table 2). The relative quantification of miRNA (or miR) was performed using the 2–ΔΔCT method (Supplementary Tables).
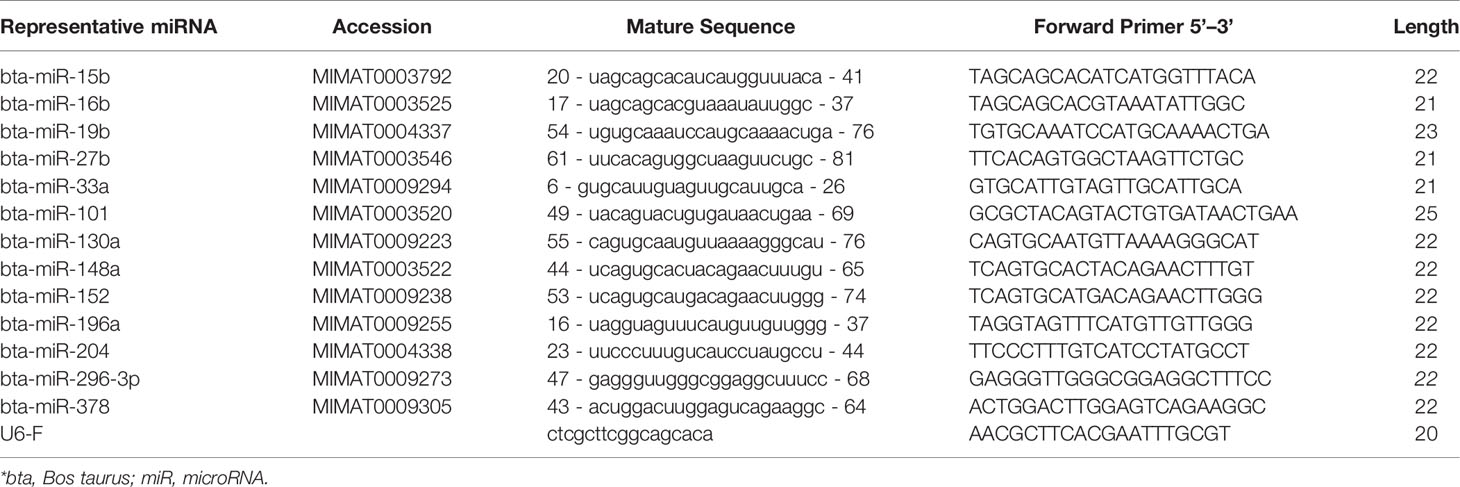
Table 2 Primer sequences for miRNA expression measured by real-time PCR.
Statistical Analysis
Data were analyzed as a randomized complete block design with cow as the experimental unit. The fixed effect was maternal treatment and the random effect included maternal farm of origin. Data were analyzed using SAS (Version 9.2, SAS Institute, Inc. Carey, NC, USA) and treatment means were compared using the PDIFF option. Expression differences of mRNA and microRNA between three kinds of adipose tissue depots (SAT, TVAT, and PAT) were determined using Dunnett’s modified Tukey-Kramer pairwise multiple comparison test (DTK). Differences were considered significant at p < 0.05 and trends were considered at 0.05 < p < 0.10.
Results
Phenotypic Data
The fetuses obtained in this experiment at slaughter (day 260 ± 8.3) showed marked differences between the LOW and HIGH groups, as reported by Zhang et al. (35; Table 3). The body, carcass muscle, carcass adipose tissue, and carcass bone weights of LOW fetuses were lower than those of HIGH fetuses (p < 0.05). Regarding the specific adipose depots, the weights of SAT (3.03-fold), TVAT (1.47-fold), and PAT (1.45-fold) were greater in HIGH fetuses than in LOW fetuses, as shown in Table 3 (35).
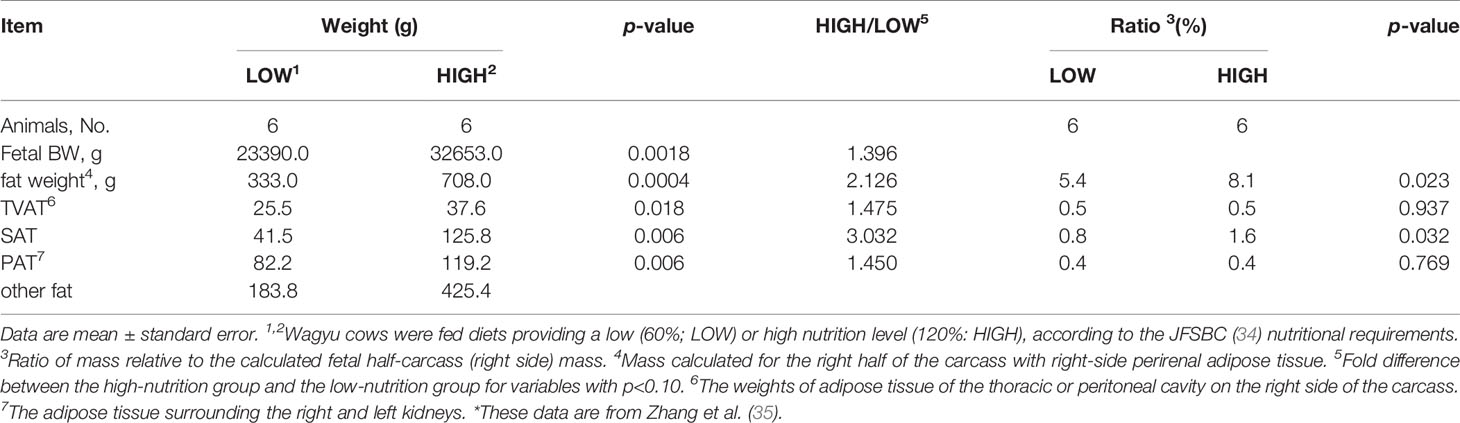
Table 3 Effects of LOW or HIGH maternal nutrition of Wagyu cows during the entirety of gestation on the fetal BW and fat weight.
Adipose Tissue Morphology
The frequency of adipocytes CSA in SAT showed similar patterns between LOW and HIGH fetuses, however, the relative frequency of 201-400 μm2 adipocyte CSA was somewhat higher in LOW fetuses (Figure 1, S-1). The frequency of adipocyte CSA in TVAT showed higher frequency of 801-1000 μm2 adipocyte CSA in LOW fetuses and, on the other hand, there were two peaks of relative frequencies (601-800 μm2 and 1201-1400 μm2) in HIGH fetuses (Figure 1, T-1). The frequency of adipocyte CSA in PAT showed the highest at 801-1000 μm2 in LOW fetuses, and meanwhile at 1001-1200 μm2in HIGH fetuses (Figure 1, P-1). In SAT (p < 0.01) and PAT (p < 0.05), the average adipocyte diameter was greater in HIGH fetuses than in LOW ones (Figure 1, S-2, P-2). Consistent with these results, the adipocyte number/unit area of SAT (p < 0.05) and PAT (p < 0.01) was greater in LOW fetuses than in HIGH ones (Figure 1, S-3, P-3). There were no differences in adipocyte diameter and adipocyte number/unit area in TVAT between the treatment groups (Figure 1, T-1, 2 and 3).
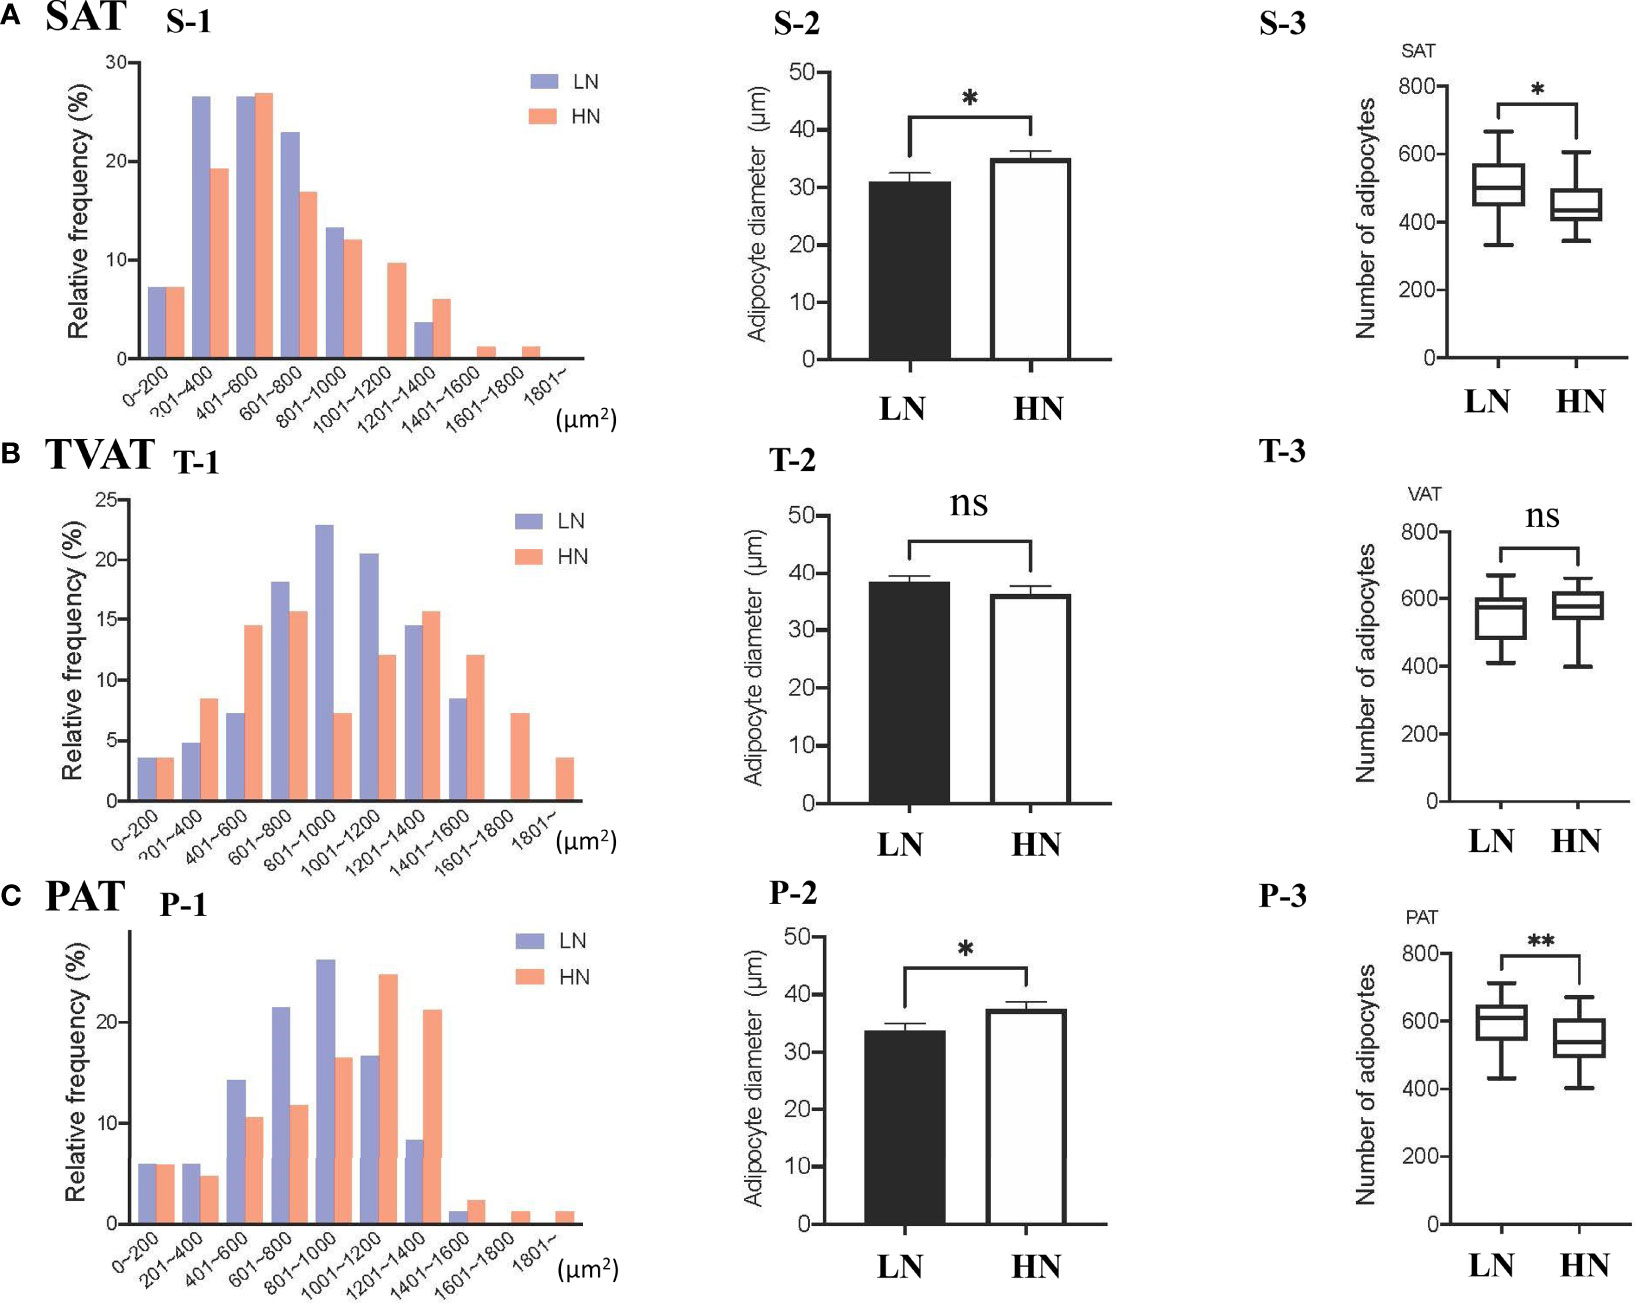
Figure 1 (A) Relative frequency distribution of SAT CSA (S-1), diameter (S-2), and number of adipocytes within the same area (S-3) in subcutaneous adipose tissue (SAT) between LOW and HIGH fetuses. (B) Relative frequency distribution of TVAT CSA (T-1), diameter (T-2), and number of adipocytes in the same area (T-3) in thoracic cavity visceral adipose tissue (TVAT) between LOW and HIGH fetuses. (C) Relative frequency distribution of PAT CSA (P-1), diameter (P-2), and number of adipocytes within the same area (P-3) in perirenal adipose tissue (PAT) between LOW and HIGH fetuses. Fetuses: 260 ± 8.3 days of fetal age. LOW: n=6. HIGH: n=6. Values are means with standard errors. Significant differences between fetal groups are denoted by *p < 0.05 and **p < 0.01.
mRNA Expression
In SAT, LOW fetuses had a higher level of LEP (p = 0.045) and tended to have higher PPARG (p = 0.078), CEBPA (p = 0.098), UCP1 (p = 0.072), PGC1 (p = 0.053), IGF2 (p = 0.098), AKT2 (p = 0.087), and GlUT4 (p = 0.092) mRNA levels than HIGH fetuses (Figures 2A, B).
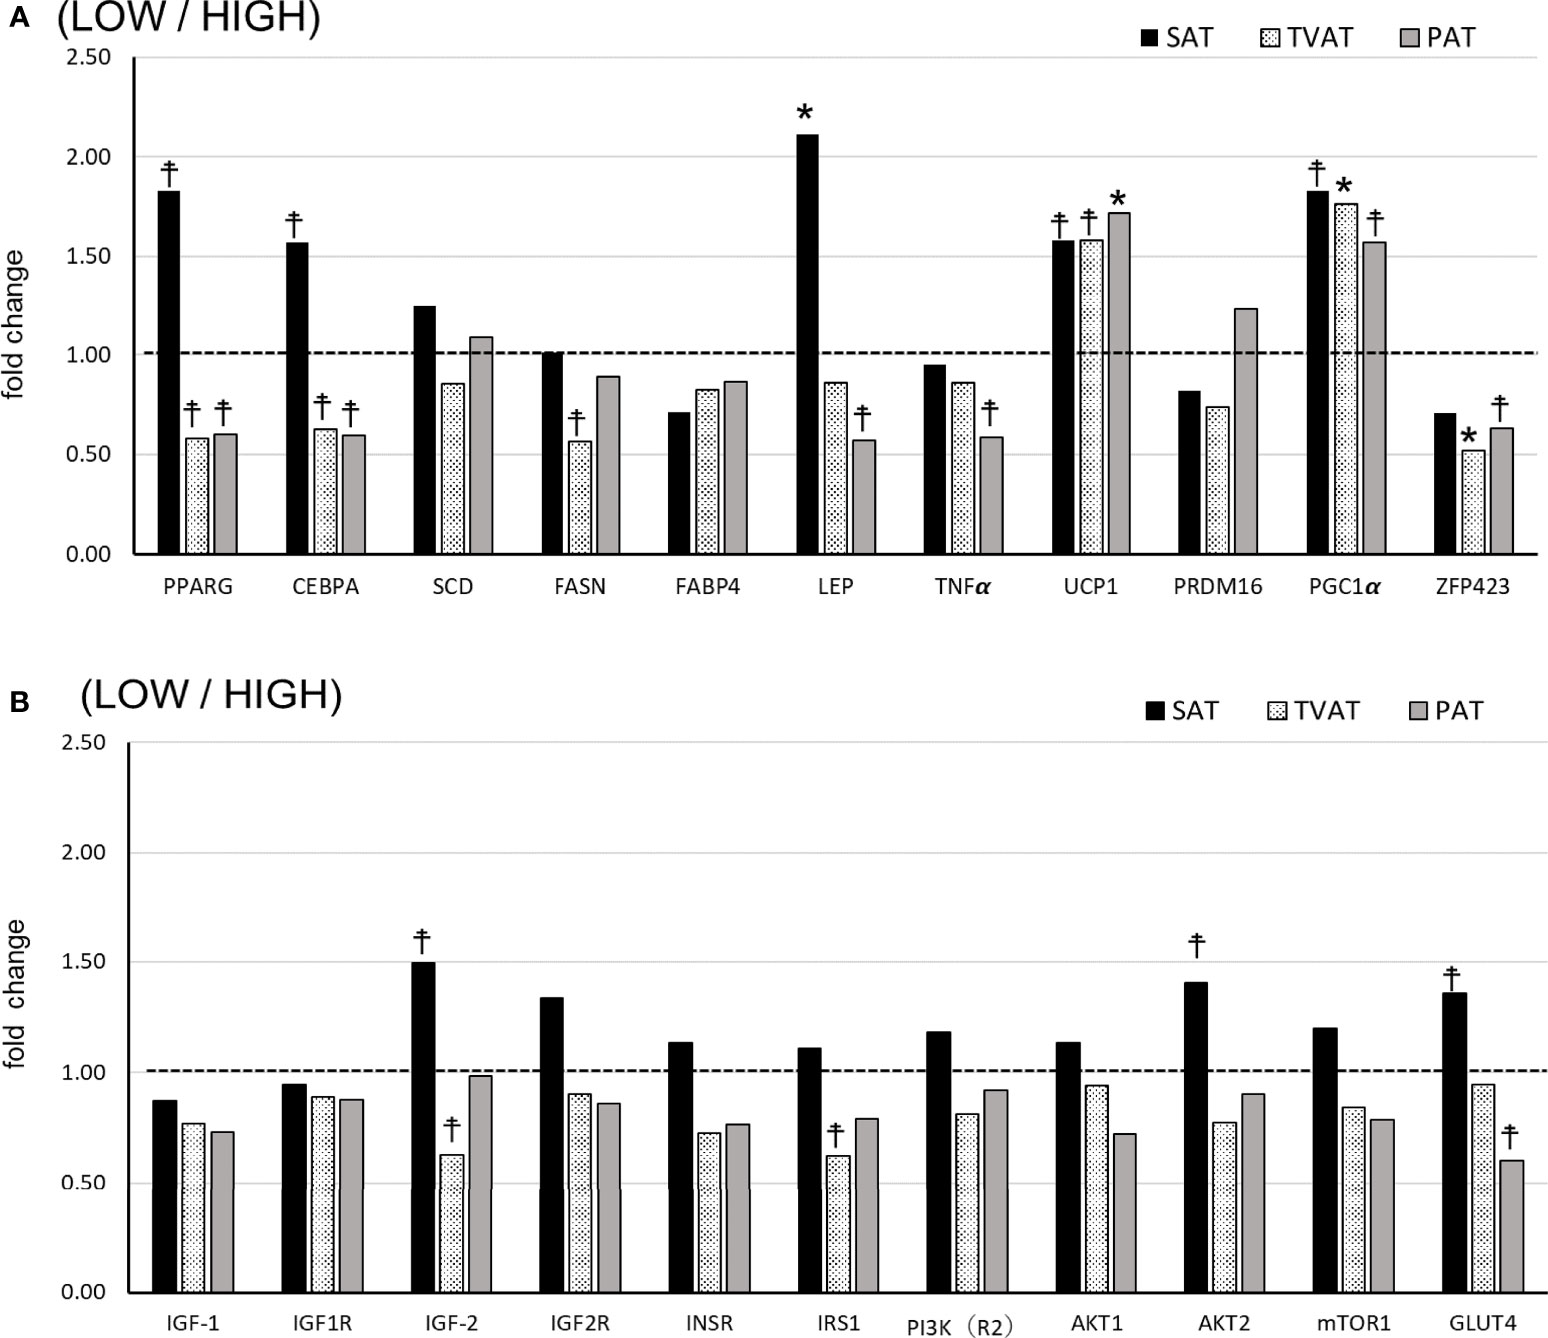
Figure 2 Comparison of fold change of mRNA abundance in subcutaneous (SAT), thoracic cavity visceral (TVAT), and perirenal adipose tissues (PAT) between LOW and HIGH fetuses in Wagyu cattle. (A) Adipogenesis including brown adipose tissues (LOW/HIGH), (B) growth factors, and glucose metabolism (LOW/HIGH). The horizontal dotted line (at the value “1”) showed the relative mRNA expression of the HIGH fetuses. The foldchange was calculated as the relative expression based on the mean of the target gene Ct value of LOW and HIGH fetuses. Fetuses: 260 ± 8.3 days of fetal age. LOW: n=6. HIGH: n=6. *Significant difference and ☨trend (p < 0.05 and p < 0.1, respectively) between LOW and HIGH fetuses.
In TVAT, LOW fetuses had higher PGC1α (p = 0.045) and lower ZFP423 (p =0.042) mRNA levels, and tended to have a higher UCP1 (p = 0.067) mRNA level than HIGH fetuses (Figure 2A). Meanwhile, LOW fetuses had lower PPARG(p = 0.059), CEBPA (p = 0.053), FASN (p = 0.086), IGF2 (p = 0.069), and IRS1 (p = 0.071) mRNA levels than HIGH fetuses (Figure 2A, B).
In PAT, LOW fetuses had a higher UCP1 (p = 0.046) mRNA level and tended to have a higher PGC1α (p = 0.073) mRNA level than HIGH fetuses. Conversely, LOW fetuses had lower PPARG (p = 0.066), CEBPA (p = 0.052), LEP (p = 0.068), TNFα (p = 0.079), ZFP423 (p = 0.078), and GLUT4 (p = 0.054) mRNA levels than HIGH fetuses (Figure 2A, B).
The expression of PPARG (both LOW and HIGH), CEBPA (both LOW and HIGH), IGF2 (both LOW and HIGH), and AKT2 (HIGH) mRNAs was greater in SAT than in TVAT and PAT (p < 0.05) with no significant difference in the TVAT and PAT (Figure 3). The expression of SCD (LOW) and IGF2R (LOW) mRNAs was greatest in SAT and least in PAT (p < 0.05). The expression of LEP(LOW), TNFα (HIGH), and PI3K (LOW) mRNAs was greater in SAT and TVAT relative to PAT (p < 0.05) without significant difference in the SAT and the TVAT. The expression of UCP1 (LOW) mRNA was greatest in PAT and least in TVAT (p < 0.05). The expression of UCP1 (HIGH), PRDM16 (LOW), PGC1 (both LOW and HIGH), ZFP423 (HIGH), IGF1 (HIGH), IGF2R (HIGH), PI3K (HIGH), mTOR1 (HIGH), and GLUT4 (HIGH) mRNAs was greater in SAT and PAT than in TVAT (p < 0.05), whereas in the SAT and the PAT, they showed no significant difference. Conversely, the expression of IGF1 (LOW) and IGF1R (LOW) m RNAs was greater in TVAT than in SAT and PAT (p < 0.05) without significant difference in the SAT and the PAT. The expression of IGF1R (HIGH) mRNA was greater in PAT than in SAT and TVAT (p < 0.05) without significant difference in the SAT and the TVAT. No significant difference was observed between SAT, TVAT and PAT in the expression of other genes in the nutritional treatment groups not shown so far (Figure 3).
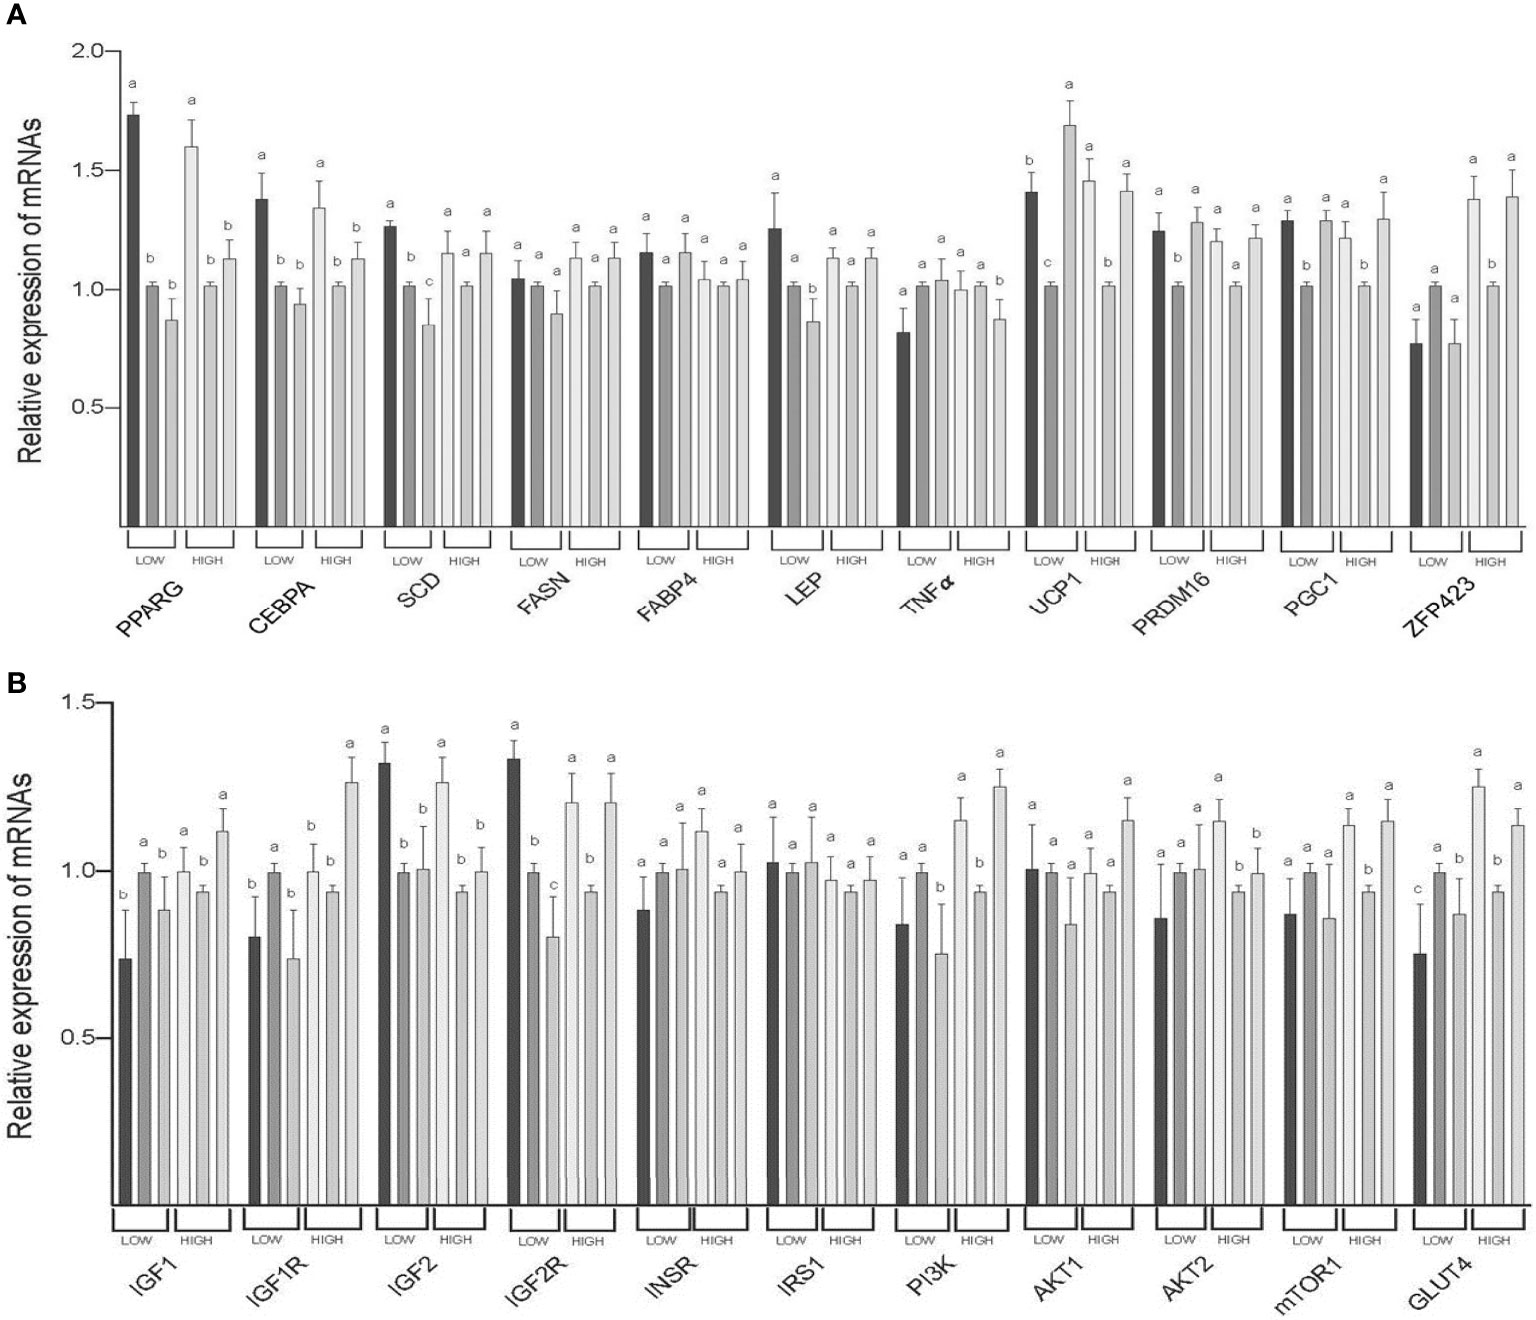
Figure 3 Comparison of mRNA abundance among subcutaneous (SAT), thoracic cavity visceral (TVAT), and perirenal adipose tissues (PAT) in the LOW and the HIGH fetuses in Wagyu cattle. (A) Adipogenesis including brown adipose tissues (LOW/HIGH), (A) growth factors, and glucose metabolism (LOW/HIGH). Fetuses: 260 ± 8.3 days of fetal age. LOW: n=6. HIGH: n=6. a,b,cSignificant difference (p < 0.05) among SAT, TVAT, and PAT in the LOW and the HIGH fetuses.
Immunohistochemistry
Immunohistochemical analysis of SAT, TVAT, and PAT revealed UCP1-positive staining as a marker of brown adipocytes in both LOW and HIGH fetuses (Figure 4).
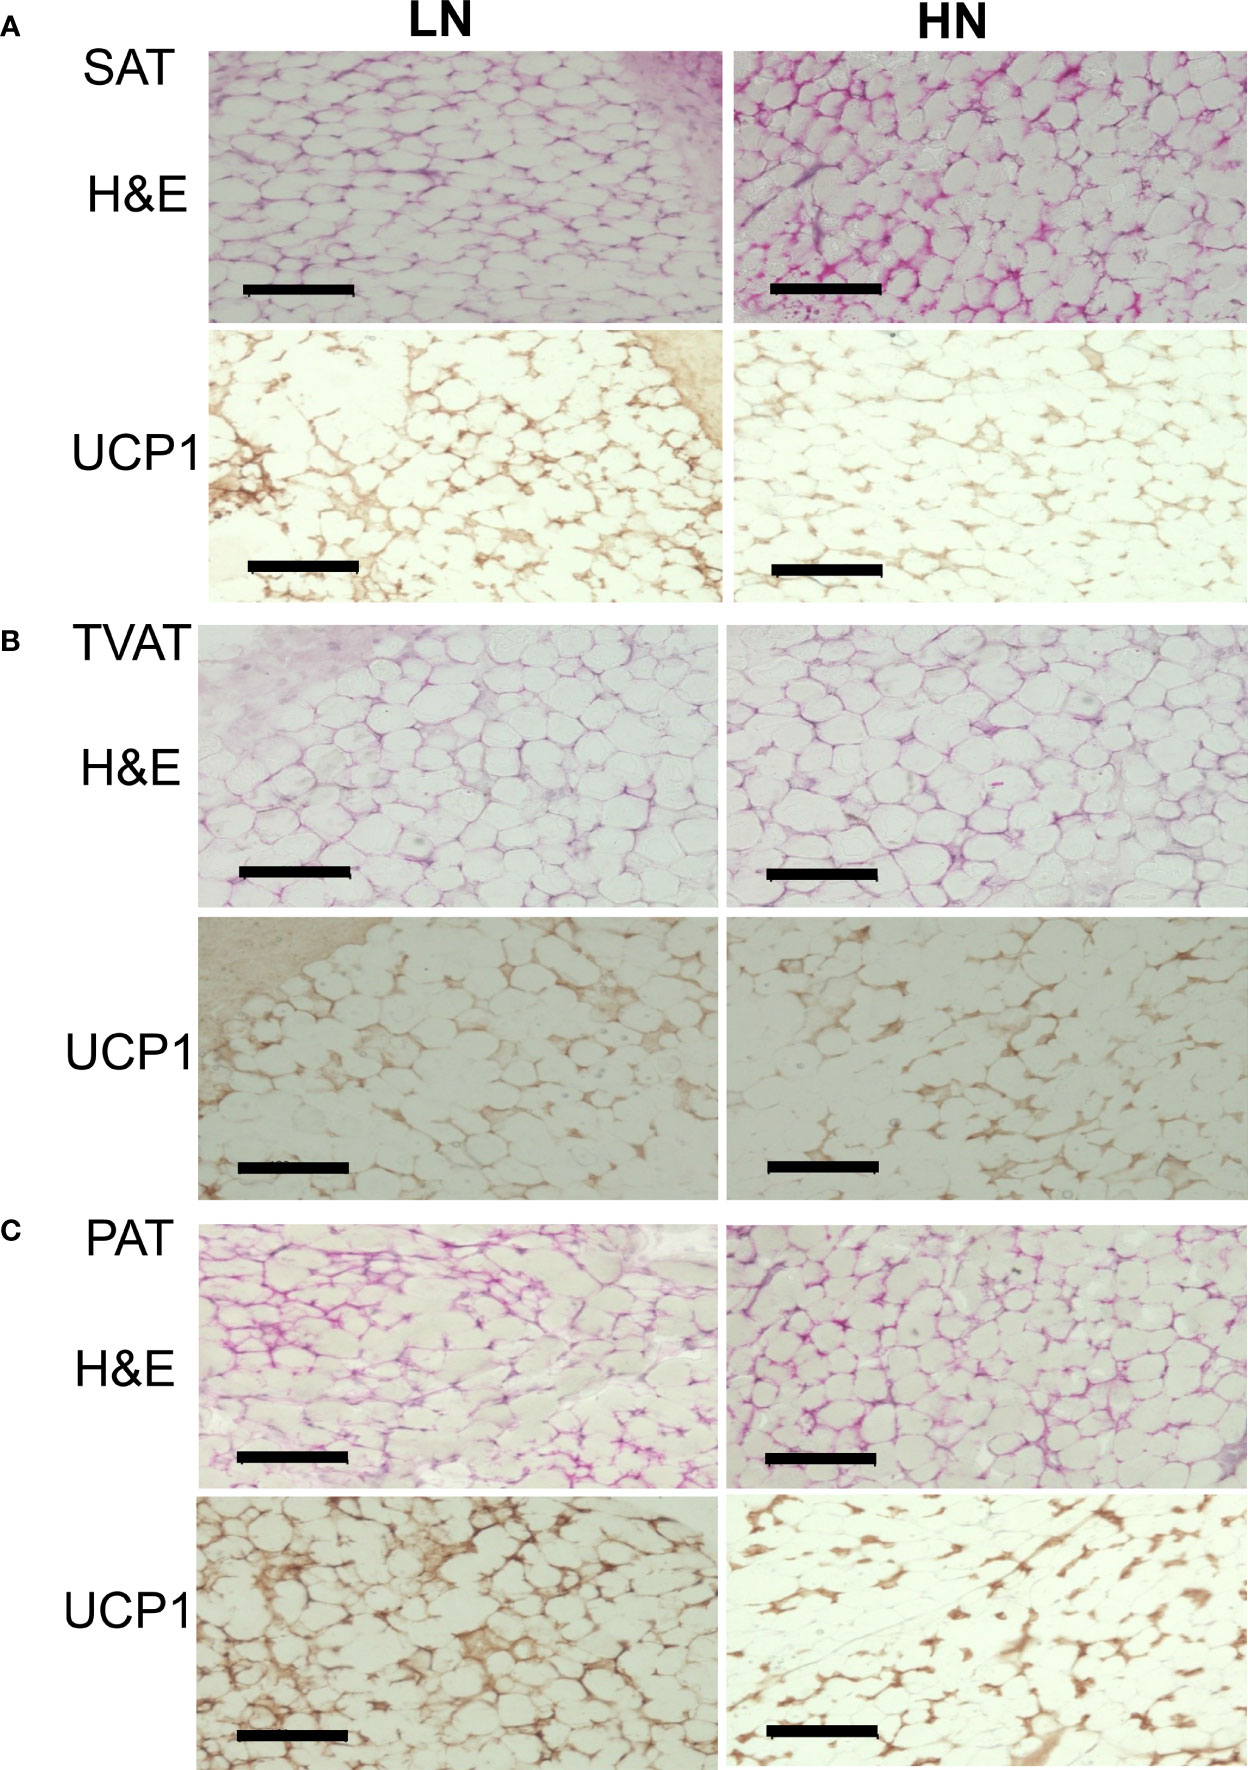
Figure 4 Representative images of H&E staining and immunohistochemical staining of UCP1 in LOW and HIGH fetuses. UCP1: uncoupling protein 1. SAT: subcutaneous adipose tissue (A, SAT). TVAT: thoracic cavity visceral adipose tissue (B, TVAT). PAT: perirenal adipose tissue (C, PAT) in Wagyu fetuses. Fetuses: 260 ± 8.3 days of fetal age. LOW: n=6. HIGH: n=6. Black scale bar represents 100 μm. Magnification: 30×.
miRNA Expression
In SAT, Low fetuses had a higher level of miR-15b (p = 0.021) and tended to have higher levels of miR-33a (p = 0.057) and miR-196a (p = 0.054; Figure 5). Conversely, LOW fetuses had a lower level of miR-378 (p = 0.042) and tended to have a lower level of miR-152 (p = 0.088).
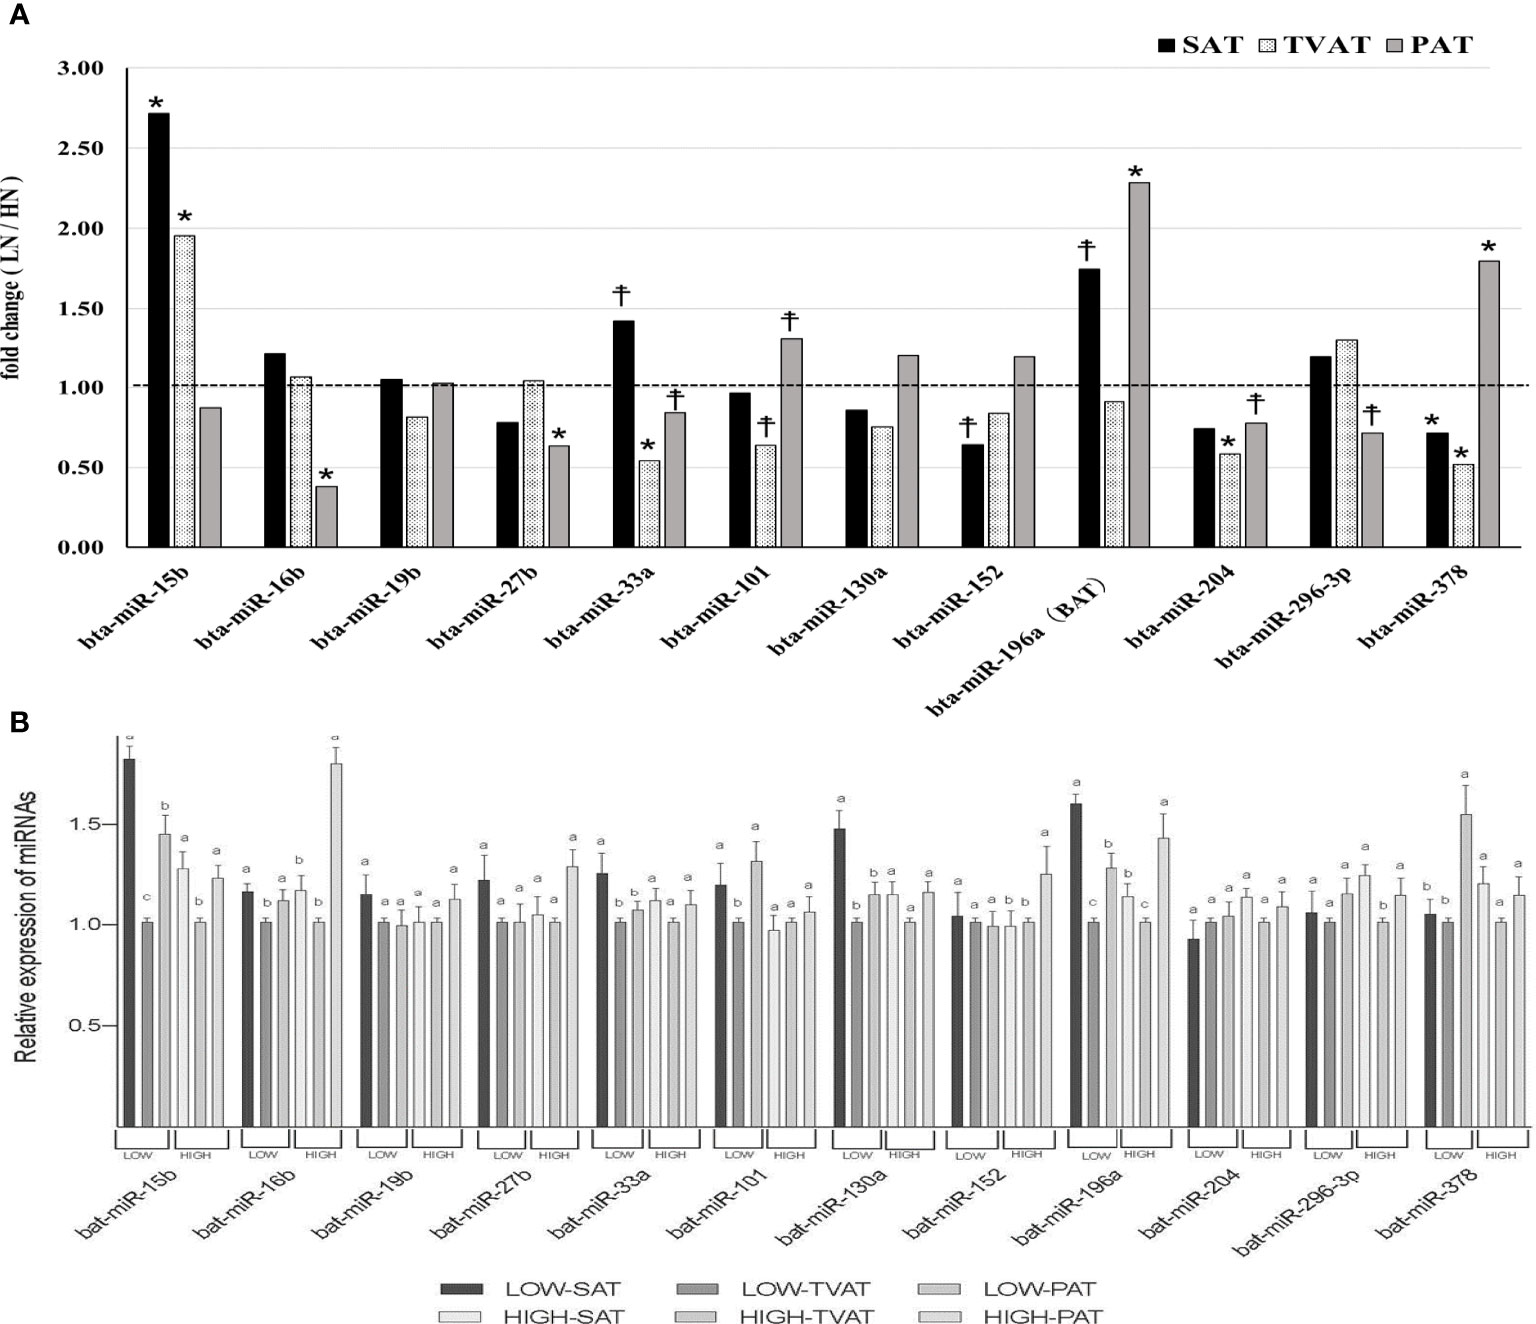
Figure 5 Comparison of miRNAs in adipose tissues. (A) Comparison of fold change (LOW/HIGH) of miRNA abundance in subcutaneous (SAT), thoracic cavity visceral (TVAT), and perirenal adipose tissues (PAT) between LOW and HIGH fetuses in Wagyu cattle. The horizontal dotted line (at the value “1”) showed the relative miRNA expression of the HIGH fetuses. The foldchange was calculated as the relative expression based on the mean of the target gene Ct value of LOW and HIGH fetuses. (B) Comparison of mRNA abundance between SAT, TVAT, and PAT in the LOW and the HIGH fetuses in Wagyu cattle. Fetus age: Fetuses: 260 ± 8.3 days of fetal age. LOW: n=6. HIGH: n=6. *Significant difference and ☨trend (p < 0.05 and p < 0.1, respectively) between LOW and HIGH fetuses. a,b,c Significant difference (p < 0.05) between SAT, TVAT, and PAT in the LOW and the HIGH fetuses.
In TVAT, LOW fetuses had a higher level of miR-15b (p = 0.011). Meanwhile, LOW fetuses had lower levels of miR-33a (p = 0.014), miR-204 (p = 0.022), and miR-378 (p = 0.009) and tended to have a lower level of miR-101 (p = 0.059; Figure 5A).
In PAT, LOW fetuses had higher levels of miR-196a (p = 0.018) and miR-378 (p = 0.047) than HIGH fetuses. Similarly, LOW fetuses tended to have a higher level of miR-101 (p = 0.072). Conversely, LOW fetuses had lower levels of miR-16b (p = 0.013) and miR-27b (p = 0.034) than HIGH fetuses. Simultaneously, LOW fetuses tended to have lower levels of miR-33a (p = 0.064), miR-204 (p = 0.053), and miR-296-3p (p = 0.069; Figure 5A).
The expression of miR-33a (LOW) and 130a (LOW) was greater in SAT than in TVAT and PAT (p < 0.05) with no significant difference in the TVAT and the PAT (Figure 5B). The expression of miR-15b (LOW) and 196a (LOW) was greatest in SAT and least in TVAT (p < 0.05). The expression of miR-15b (HIGH), 16b (LOW), 101 (LOW), and 296-3p (HIGH) was greater in SAT and PAT relative to TVAT (p < 0.05) without significant difference in the SAT and the PAT. The expression of miR-16b (HIGH), 152 (HIGH), and 378 (LOW) was greater in PAT than in SAT and TVAT (p < 0.05) with no significant difference in the SAT and the TVAT. The expression of miR-196a (HIGH) was greatest in TVAT and least in SAT (p < 0.05). No significant difference was observed between SAT, TVAT and PAT in the expression of other miRNAs in the nutritional treatment groups not shown so far (Figure 5B).
Discussion
The function of adipose tissue changes with development. In the newborn, BAT is needed to ensure an effective response to the extrauterine environment. Overall adipose tissue mass increases during late gestation, with a mixture of white and brown adipocytes. After that, during postnatal life, some, but not all, adipose depots are replaced by white adipocytes. The changes in maternal nutrition at the mid and the late gestation modify adipose tissue development profiles (12, 42). The gene expression change occurs in an adipose tissue depot-specific manner in offspring born to mothers fed lower nutrition from early to mid-gestation in cattle (43). Maternal low nutrition decreased the expression of Adipocyte Protein (AP) 2 and GLUT4 mRNAs and increased the expression of Cluster of Differentiation (CD) 36 mRNAs in PAT, but not in SAT of offspring in crossbred Angus cattle (43). However, the detailed differential-responses and its relationships of mass and molecular dynamics between SAT, TVAT and PAT in fetuses of different maternal nutrition have not been examined well in cattle. In this study, we demonstrated that lower or higher maternal nutrition during gestation could alter adipose tissue mass, adipocyte size, and gene expression in an adipose-tissue-specific manner in fetuses of Wagyu cattle. In all adipose tissue of LOW fetuses, gene expression analysis indicated enhanced BAT development. In addition, gene expression related to WAT differed between SAT and the other adipose tissues (TVAT and PAT), suggesting the different susceptibility of adipose tissue to maternal nutrition.
There is a need to develop an efficient feeding system because the cost of feeding cattle is increasing. Although the body adipose tissue of beef cattle is not only for energy storage but also an endocrine organ affecting metabolism (44) as well as meat quality and quantity (3), in the beef industry carcass adipose tissue is practically and economically wasted, apart from intramuscular adipose tissue (45). Regulating the development of adipose tissue in cattle could lead to the development of an efficient feeding system. In cows, not only growth but also reproduction and maintenance of body functions require adequate nutrition. Animals use energy and nutrients obtained from feed in various ways. Ferrell and Jenkins (46) reported that, in mature beef cows, maintenance requirements represent approximately 70% to 75% of the total annual energy requirements. In this study, we established two nutritional groups allocated 60% and 120% of nutritional requirements during gestation and identified clear phenotypic differences in fetuses between them (35). Chronic restriction of maternal nutrition has been indicated to reduce basal metabolic rate (47, 48) and to impact fetal development (42, 49). In this study, differences in the development of adipocytes of SAT, TVAT, and PAT between LOW and HIGH fetuses were shown, that namely, adipose tissue mass increased in HIGH fetuses. The expression of UCP1 and PGC1α mRNA increased or tended to increase in SAT, TVAT, and PAT of LOW fetuses and only in SAT of LOW fetuses had more LEP mRNA and tended to have more PPARG, CEBPA, and GLUT4 mRNA. Thus Maternal nutrition would thus strongly affect the accumulation of adipocytes and the activation of their gene expression in the fetus.
As an endocrine organ, adipose tissue is not only involved in energy storage but also acts as a complex, important, and metabolically active part of the body (44). Adipose tissue is scattered throughout the whole body, but makes up 5% to 35% of cattle body mass, which is dependent on age, genotype, and nutrition (4). In adipose tissue, there are three major depot locations, visceral, subcutaneous, and intermuscular depots, which can be further subdivided into smaller depots defined by anatomical location (perirenal and omental) (4). In Wagyu cattle, with growth and fattening, subcutaneous and visceral adipose tissue exhibits particular development that differs from the findings in European breeds such as Holstein, German Angus, and Belgian Blue cattle (3). In mammals including cattle, adipose tissue has been classified into two distinct types: one is white adipose tissue, which has a major function in energy storage; and the other is brown adipose tissue, which is specialized for energy expenditure (4). In recent time, beige adipose tissue, which is a mixture of brown and white adipocyte, was identified. Beige adipocyte is transdifferentiated from WAT and has many similar morphological and functional properties with brown adipocyte (50).
In cattle, the perirenal adipose tissue starts to appear in fetuses from around day 80 of gestation, followed by visceral, subcutaneous, and intermuscular adipose tissue from day 180 of gestation onward, whereas intramuscular adipocytes in fetus muscles starts to develop from mid- and late-gestation (6, 8), and discernible intramuscular adipocytes filled with lipid develop after birth in earnest (4). Considering the results obtained in this study, given the specific functions and different distributions of individual adipose tissue depots, nutritional interventions during gestation could impact on fetal adipose tissue development in diverse ways. However, few studies focusing on ruminants have evaluated the effects of suboptimal maternal nutrition on the development of fetal adipose tissue. Jennings et al. (51) found that maternal high (146% nutrition requirement) and low (72% nutrition requirement) nutrition during mid-gestation did not affect the expression of genes related to adipogenesis in subcutaneous adipose tissue of Angus crossbred fetuses at d 180. These results suggest that fetal growth characteristics are not affected by the level of maternal nutritional manipulation imposed in the study during mid-gestation. While, Long et al. (43) fattened the offspring exposed to 55% maternal nutrition during early gestation, indicated no differences in distribution of subcutaneous and perirenal adipose tissue compared with the control offspring, but the expression of AP2, CD36, and GLUT4 in the perirenal adipose tissue was suppressed in low nutrition group. Regardless of the animal species, the effects of maternal nutrition on fetal development are supposed to be affected by the timing of treatment during gestation (49, 52), although here we manipulated maternal nutrition during the entirety of gestation.
In this study, the adipocyte diameters of SAT and PAT were greater in HIGH fetuses, while there were no differences in adipocyte diameter in TVAT between LOW and HIGH fetuses. This suggested that specific adipose tissue depots showed different responses to suboptimal maternal nutrition during pregnancy. Moreover, it was also suggested that the adipocytes of SAT and PAT were more sensitive to nutritional deficiencies. In calves born from dams fed a restricted level of protein, the mass weight of perirenal adipose tissue, adipocyte size, and lipogenic activities were reported to be similar to those in control calves at birth (53).
We estimated the number of adipocytes (Figure 6) based on the adipocyte diameter and mass of adipose tissue in SAT, TVAT, and PAT (35). In this simulation, we used 0.92 g/cm3 as the adipose tissue density (54) and assumed that the adipocytes were spherical for this calculation. The results showed that the numbers of adipocytes in SAT (2.3-fold), TVAT (1.6-fold) were greater in HIGH fetuses than in LOW ones (p < 0.01; Figure 6). This suggests that maternal nutrition would alter the number of adipocytes in adipose tissue, with SAT and TVAT being particularly sensitive to this. However, the number of adipocytes could be increased after birth by proliferation (55).
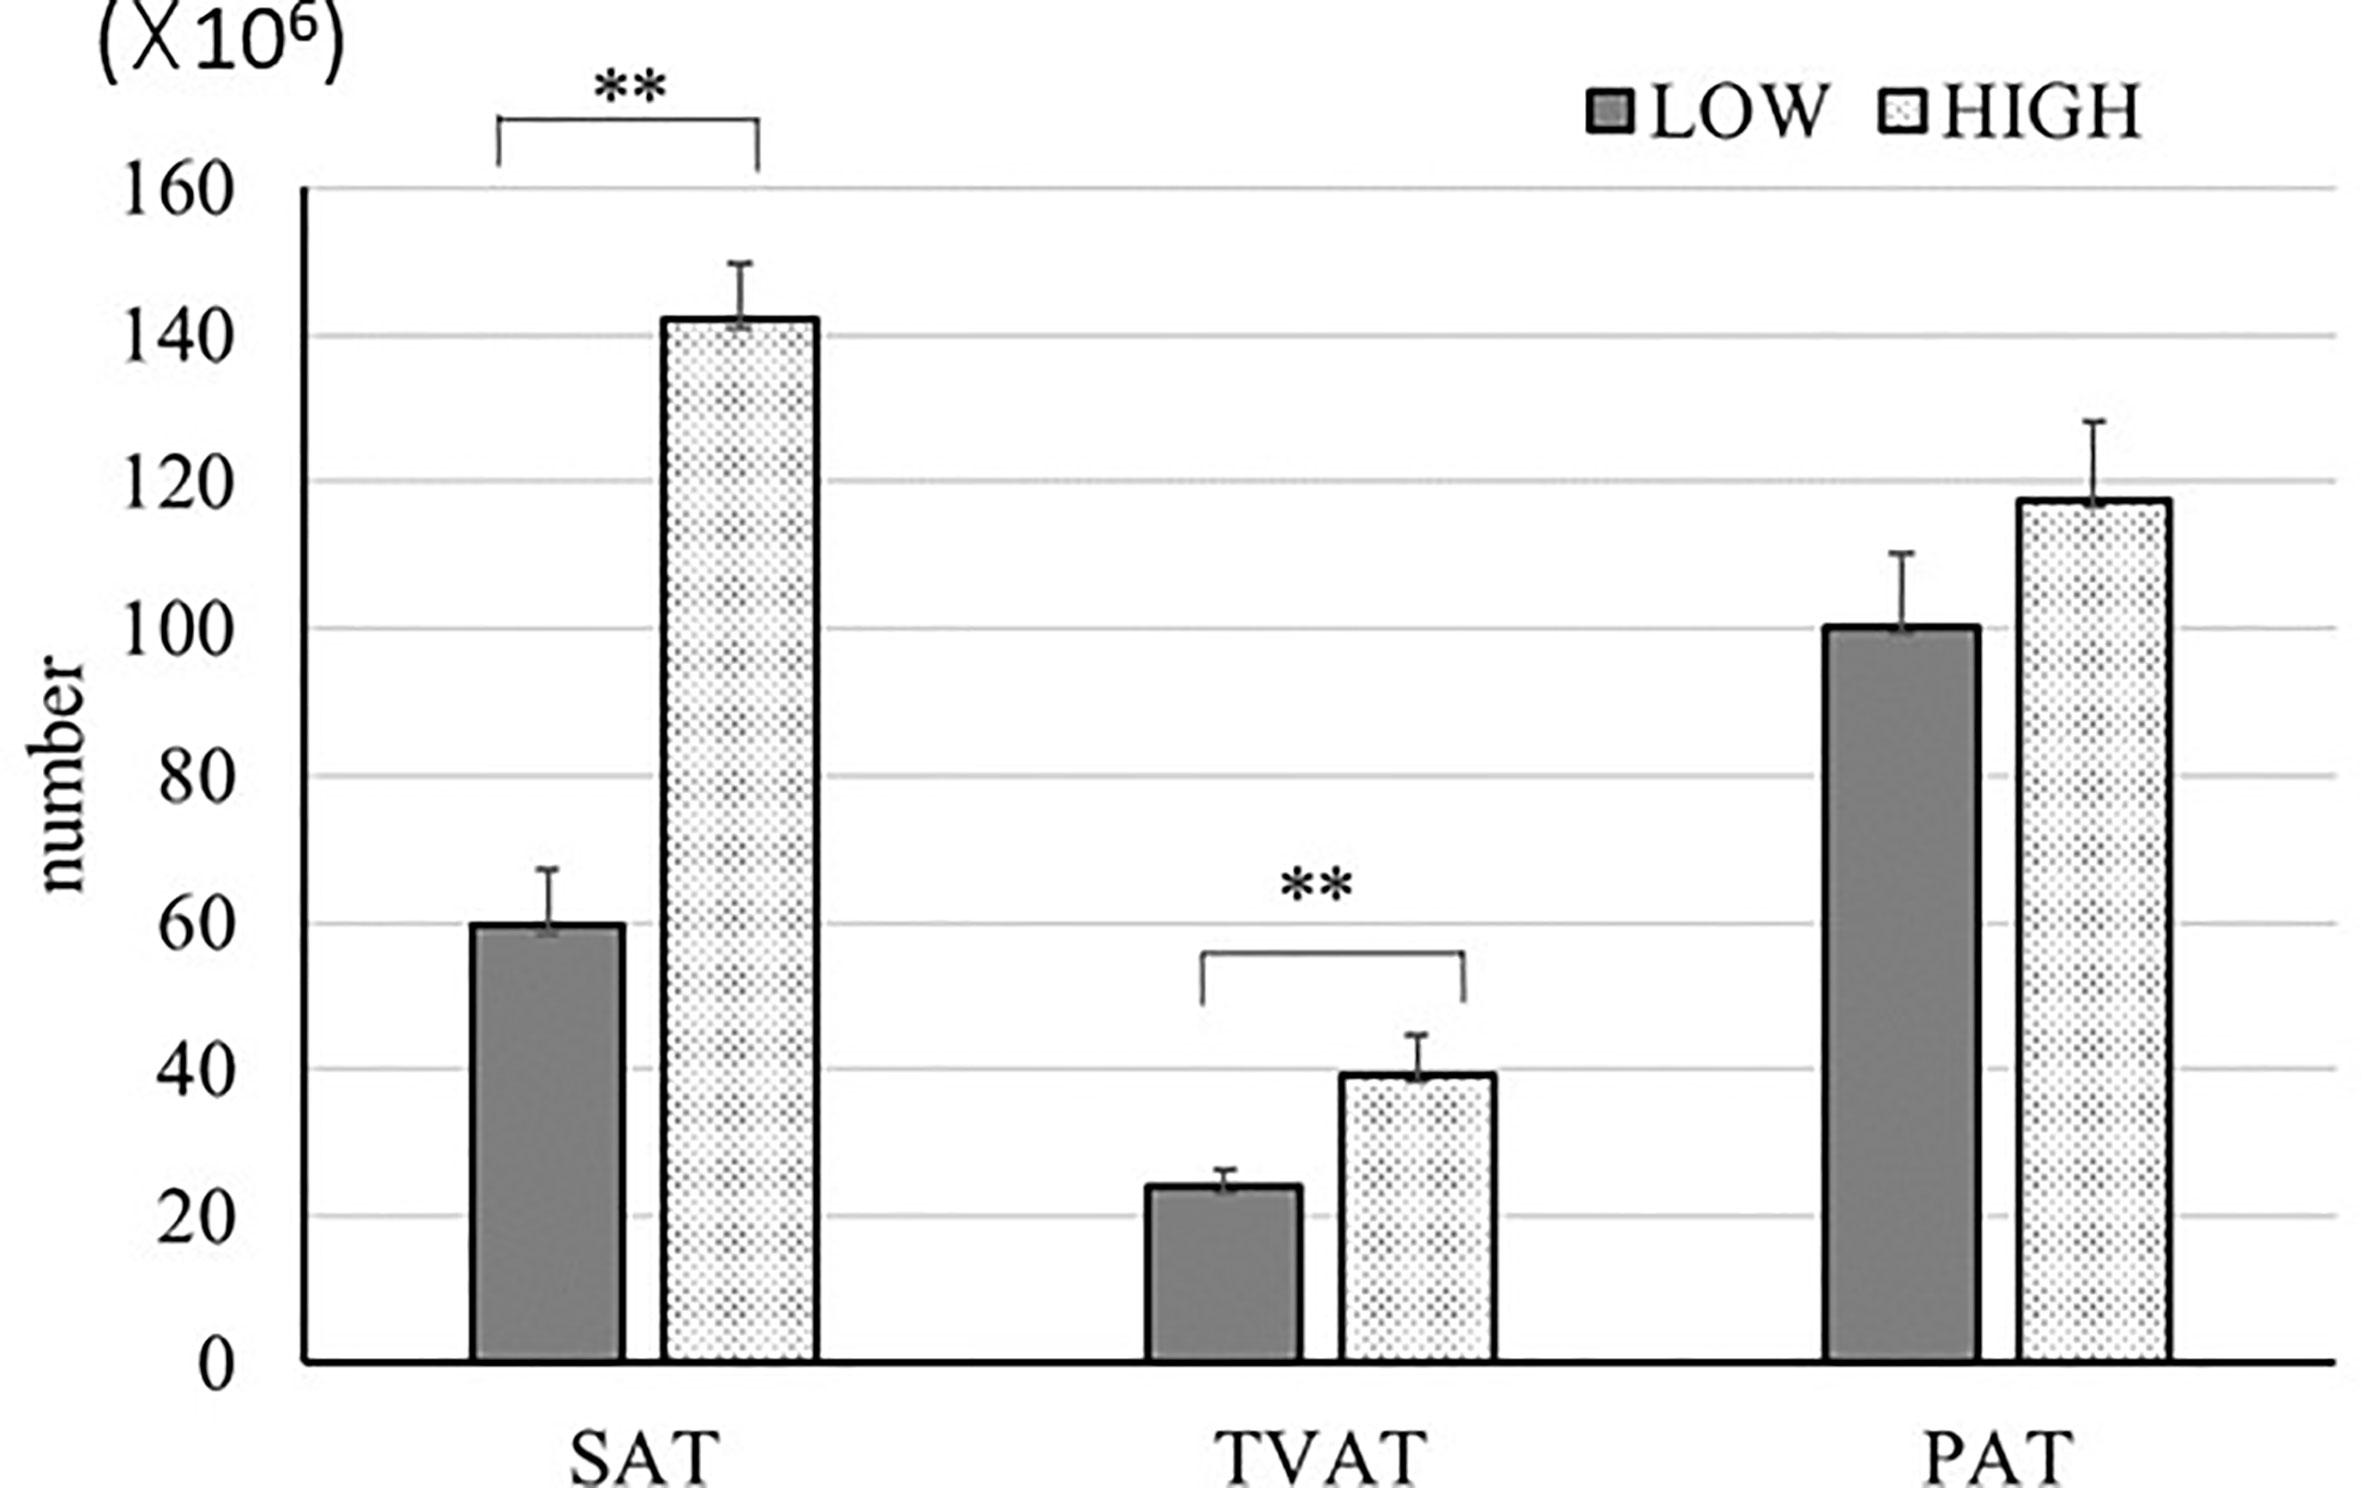
Figure 6 Estimation of adipocyte number in SAT, TVAT, and PAT of LOW and HIGH fetuses. Values were calculated based on the values from adipocyte diameter analysis (Figure 1) and data of each adipose tissue mass. Adipose tissue density: 0.92 g/cm3 (54). Fetuses: 260 ± 8.3 days of fetal age. LOW: n=6. HIGH: n=6. Values are means with standard errors. Significant differences between fetal groups are denoted by **p < 0.01.
In the immunohistochemical observation on UCP1-positive status, SAT, TVAT, and PAT seemed to show greater numbers of brown adipocytes in LOW fetuses than in HIGH fetuses. These findings are supported by the higher UCP1 mRNA expression in SAT, TVAT, and PAT (Figure 4). This suggested that maternal overnutrition could suppress brown adipocyte development during gestation. Similar to this result, when the dams consumed a suboptimal amount of nutrients during the final month of gestation, birth weight and adipose tissue mass were reduced, but this is highly likely to reflect a reduction in adipose tissue stores rather than a reduction in the amount of brown adipose tissue in mammals (12). Intriguingly, the reduced amount of adipose tissue present in newborns has a greater capacity to maintain UCP1 as a BAT biomarker, which could be indicative of a protective mechanism against subsequent exposure to some environment with temperature change or an obesogenic environment in human (12). Furthermore, enhanced maternal nutrition from mid- to late gestation could accelerate the activity of glucocorticoids and a series of inflammatory responses in newborns when key inflammatory genes were upregulated (56). However, maternal overfeeding (150% of control) during mid- to late gestation did not affect the weight of perirenal BAT or the adipocyte diameter of fetuses, but increased some adipogenic factor, PPARG, and in lipoprotein lipase, adiponectin, and LEP mRNA expression in PAT (57).
In the adipogenesis, PPARG, CEBPA, SCD, FASN, FABP 4, ZFP423, and LEP have the crucial role (13–17). The changes in the expression of various mRNAs in this study suggested that the adipogenesis of Wagyu fetuses could be susceptible to change due to maternal nutritional status during gestation in a manner dependent on each particular adipose tissue depot. The formation and composition of adipose tissue in cattle are derived from a complex process. They are controlled by multiple parameters including genetic factors, nutritional status, feeding system, species, and sex in cattle (58). In this study, the pattern of gene expression in SAT differed from those in TVAT and PAT. Regarding SAT, HIGH fetuses had 3-fold greater mass than LOW fetuses, while for TVAT and PAT, HIGH fetuses had only 1.4-fold greater mass (35). In addition, SAT from LOW fetuses had greater expression of PPARG, CEBPA, and LEP mRNA, which might suggest that they were trying to develop WAT because the formation of WAT was delayed due to maternal lower nutrition compared with that from HIGH fetuses. Moreover, only in SAT, LOW fetuses tended to have higher levels of IGF2, AK2, and GLUT4 mRNA. Thus, in SAT, depending on the maternal nutritional level, LOW fetuses showed different patterns of mRNA expression related to genes involved in growth and glucose metabolism compared with the findings for TVAT and PAT. Enhanced LEP mRNA expression indicates elevated insulin sensitivity (59), while enhanced GLUT4 expression indicates elevated glucose intake (60). In addition, increased expression of PPARG and CEBPA mRNA in SAT indicates that adipocyte differentiation is activated (61, 62).
Conversely, in TVAT and PAT, LOW fetuses tended to have lower expression of PPARG and CEBPA mRNA and, in PAT, also tended to have lower expression of LEP mRNA, showing the opposite tendency to SAT. SAT is a layer of subcutaneous fat is located between the dermis and the underlying fascia on the outer muscle. SAT is not only serving as a reserve source of energy for the body, but also SAT helps to physically insulate the body from cold (63) and radiates heat in the case of containing BAT in a part of SAT. Moreover, in all of SAT, TVAT, and PAT, LOW fetuses had higher levels of UCP1 and PGC1α mRNA, indicating that brown adipocyte formation was activated in LOW fetuses. Heat-producing adipocytes, brown adipocytes, drive heat production through the close coordination of substrate supply with the mitochondrial oxidative machinery and effectors that control the rate of substrate oxidation (64, 65). Brown adipocyte as a heat production effector specifically expresses UCP1, which is the best characterized marker of BAT (66). With regard to adipose tissue mass, LOW fetuses had only half the carcass mass of HIGH fetuses (35), resulting in the heat-producing ability also being lower. Landis et al. (67) reported the expression of UCP mRNA in the tail-head subcutaneous adipose tissue of cross-bred fetuses though the gene expression level was low. These dynamics of gene expression suggested that, in LOW fetuses, brown adipocytes are activated more for thermogenesis to increase the potential for survival.
In this study, in PAT, LOW fetuses tended to have a lower level of GLUT4 mRNA. Undernutrition during late pregnancy in sheep was reported to reduce the expression of GLUT4 protein in renal adipose tissue and simultaneously generate glucose resistance in offspring at 1 year of age (68). However, the renal and omental adipose tissue mass levels of nutrient restricted group during late gestation were increased compared with those of control group (68). Further research is needed to investigate whether LOW fetuses exhibit an increase in mass later in life. In PAT, lower maternal nutrition increased the levels of PPARG and UCP1 mRNAs in fetuses compared with higher maternal nutrition and a positive correlation between the levels of PPARG and UCP1 mRNAs was reported in sheep (69). These findings were not consistent with our results showing decreased abundance of PPARG mRNA and increased abundance of UCP1 mRNA in LOW fetuses.
Wagyu (Japanese Black) cattle is a unique breed with a high capacity to produce marbled meat. In Wagyu, not only did intramuscular adipose tissue increase 12-fold (2.18% to 26.77%) but also SAT increased 14-fold (3.11% to 44.26%) during fattening (8 to 26 months of age), which contrasts with the finding for PAT (5.25-fold: 4.58% to 24.07%; 3). Conceivably, this ability could be revealed during the fetal development period, and this potential is likely to be influenced by maternal nutrition during gestation. In this study, the sensitivity of fetal SAT to maternal nutrition was quite high.
Notably, studies in mice have shown that ZFP423 is a transcription factor responsible for the adipogenic commitment of progenitor cells (70). The expression of ZFP423 commits progenitor cells to the adipogenic lineage and ensures their differentiation into pre-adipocytes, subsequently inducing PPARG expression, which results in their terminal differentiation (15). The importance of ZFP423 in bovine adipogenesis was further confirmed (16). Shao et al. (71) reported that Fetal development of subcutaneous white adipose tissue is dependent on ZFP423. In this study, in TVAT and PAT, LOW fetuses had a lower expression level of ZFP423 mRNA than HIGH fetuses (p<0.10). On the other hand, it was suggested that LOW fetuses activated white adipose tissue formation in SAT because of increased ZFP423 expression.
The brown adipocytes originate primarily from cells in the dermomyotome expressing engrailed 1 (En1), myogenic factor 5 (Myf5), and paired-box protein 7 (Pax7), which can also give rise to muscle cells during the fetal period (72, 73). Thus, the fate of myogenesis during fetal development might be associated with brown adipocytes, which could in turn be affected by maternal nutrition. Although in mouse, Yang et al. (74) previously observed that maternal overnutrition increased the white adipogenesis of progenitors in highly nourished fetuses, while high maternal nutrition during lactation also impaired the thermogenic function of BAT in offspring (75). Therefore, accompanied by lower levels of UCP1, PRDM16, and PGC1α mRNAs in HIGH fetuses, it is suggested that the manipulation of maternal nutrition, especially long-term maternal overnutrition, might adversely affect brown adipose tissue mass and its function in adipose depots of the fetus.
MicroRNAs have been shown to be important for various biological processes including adipose tissue development. This time we have chosen miRNAs which powerfully affect gene expression related adipogenesis. It has been demonstrated that microRNAs play a critical role in regulating differentiation and function in both WAT and BAT (76, 77). In this study, similar to the results of mRNA expression, differential expression of miRNAs was observed among adipocytes of SAT, TVAT, and PAT (Figure 5A). These findings suggested that the manipulation of maternal nutrition throughout gestation could change the miRNA expression dynamics and differentially regulate the development of each adipocyte depot.
miR-15b expression increased in SAT and TVAT of LOW fetuses, but not in PAT. miR-15b has been found to regulate lipid metabolism negatively in adipocytes (regulating DLK1 as a target gene; 25). Increased miR-15b expression in SAT and TVAT of LOW fetuses might reduce lipid metabolism and lead to decreases in lipid content in adipocytes and adipocyte differentiation by reducing the amount of DLK1 (25).
A number of key transcription factors including PPARG and CEBPA/B are known to regulate adipocyte terminal differentiation and lipid metabolism (78), while miRNAs have been demonstrated to regulate adipocyte differentiation through both direct and indirect targeting of these critical transcription factors, as well as their downstream targets (77). PPARG is considered the master regulator of adipocyte differentiation and is a direct target of miR-27a/b (79) and miR-130 (80). Although PPARG mRNA exhibited different expression in adipose tissue among SAT, TVAT, and PAT, miR-27b decreased the expression only in PAT and miRNA-130a did not show any differences in expression in each adipose tissue depot. This suggested that maternal nutrition could affect adipose tissue development, but not through these miRNAs in fetuses. Meanwhile, the inhibition of miR-27b in glucocorticoid-treated mice was found to increase energy expenditure, reduce body weight, and improve the regulation of glucose homeostasis (31). These effects are likely mediated through the targeting of PRDM16, although numerous other factors are involved in promoting BAT function, including PPARA and PPARG coactivator 1-beta (PGC-1β), which have also been identified as targets of miR-27 (81).
Interestingly, miR-196a plays an essential role in BAT progenitor cells and induces the “browning” of WAT, with enhanced expression of BAT genes, inducing PRDM16, UCP1, and PGC-1α (18: rodent). Moreover, miR-196a promotes “browning” by directly binding and suppressing Homeobox C8 (HoxC8), a determinant of white adipogenesis (82: vertebrate; 28: mouse). Because the development of BAT in TVAT of LOW fetuses is promoted with no change of miR-196a expression between LOW and HIGH fetuses, it was suggested that miR-196a was not responsible for promoting BAT development.
miR-378 has been characterized as another positive regulator of BAT (26). In transgenic mice, miR-378 is associated with increased BAT mass and decreased WAT mass, which might be caused by BAT expansion and increased energy expenditure (26). miR-378 was shown to be increased in PAT of LOW fetuses, while UCP1 and PGC-1α mRNA expression was also increased in PAT. It appears that malnutrition could promote BAT development in PAT of LOW fetuses. However, the expression of miR-378 in SAT and TVAT indicated the opposite trend to that in PAT, so it seems that the biological function of miR-378 in PAT differs from those in SAT and TVAT, which is altered by maternal nutrition.
miR-204 showed a lower level in TVAT and PAT of LOW fetuses, but not in SAT. Indeed, miR- has been found to target runt-related transcription factor 2 (RUNX2), which is considered the master regulator of osteoblast differentiation and is one of the main sites of miRNA-mediated adipocyte/osteoblast cell fate determination, resulting in impaired osteogenesis and improved adipogenesis (24). It is suggested that malnutrition during gestation might influence adipose development through downregulating miR-204.
miR-16b regulates metabolism, cell cycle, and inflammatory stress response (83, 84). miR-33a suppresses UCP1 mRNA expression by regulating target genes in BAT (32). In SAT, LOW fetuses retained higher UCP1 mRNA expression although miR-33a expression was higher than that in HIGH fetuses. Meanwhile, there was reasonable interaction between TVAT and PAT, indicating decreased miR-33a and enhanced UCP1 mRNA expression. miR-101 inhibits cell differentiation and induces apoptosis (33). There were different expression patterns of miR-101 expression between TVAT and PAT. miR-152 was previously reported to downregulate preadipocyte proliferation and upregulate differentiation in an in vitro experiment using 3T3-L1 (29). Only in SAT, LOW fetuses had a lower abundance of miR-152. This suggests that adipocyte differentiation might be activated more in SAT. miR296-3p enhances angiogenesis and cellular proliferation and conversely downregulates apoptosis (27). Only in PAT, decreased expression of miR-296-3p was observed in LOW fetuses, suggesting that angiogenesis and cellular proliferation might be activated in PAT. However, more recently, updated information regarding these miRNAs has been reported (85). We have to carefully examine the related information and verify the relationship between the obtained data and adipose tissue development in bovine fetuses.
Finally, when comparing the differences in gene expression between adipose tissue depots, 10 genes showed a similar relationship between LOW and HIGH fetuses (Figure 3). However, other genes showed different patterns of gene expression between LOW and HIGH fetuses. In particular, the expression of PPARG, CEBPA, and IGF2 mRNA was higher in SAT than in TVAT and PAT in both LOW and HIGH fetuses, and it was speculated that WAT formation and development were enhanced in SAT. On the other hand, UCP1 as a marker of Brown adipose tissue has higher expression in PAT than TVAT, suggesting that PAT has more Brown adipocytes. In general, it was suggested that the molecule dynamics in SAT and PAT were more activated compared with the TVAT. When comparing the differences in miRNA expression between the adipose tissue depots, no differences of half miRNAs expression were observed between SAT, TVAT, and PAT, and the related pattern was different between the LOW and HIGH fetuses (Figure 5B). There seems to be many cases of higher miRNA expression in the SAT and PAT than in TVAT. However, further studies are needed regarding these reasons.
Conclusion
The present study revealed that maternal nutrition during gestation affected the development of adipose tissue by changing not only mass but also mRNA and miRNA expression in an adipose depot-specific manner in fetuses of fatty breed, Wagyu cattle (Figure 7). These findings suggest that low maternal nutrition would lead to the development of BAT in fetal adipose tissues and this BAT activation in LOW fetuses might be a priority and delayed WAT formation due to lower nutrition. Intriguingly, more significant differences in mRNA expression were observed in SAT and PAT than in TVAT. Moreover, in SAT and PAT, HIGH fetuses had a greater diameter of adipocytes than LOW fetuses. Meanwhile, the findings also suggested that lower maternal nutrition during gestation could suppress the WAT development in TVAT and PAT, but would accelerate that in SAT. The sensitivity of fetuses to low maternal nutrition in SAT would differ from that in TVAT and PAT. Various miRNAs showed significant differences between the LOW and HIGH fetuses in an adipose tissue-specific manner.
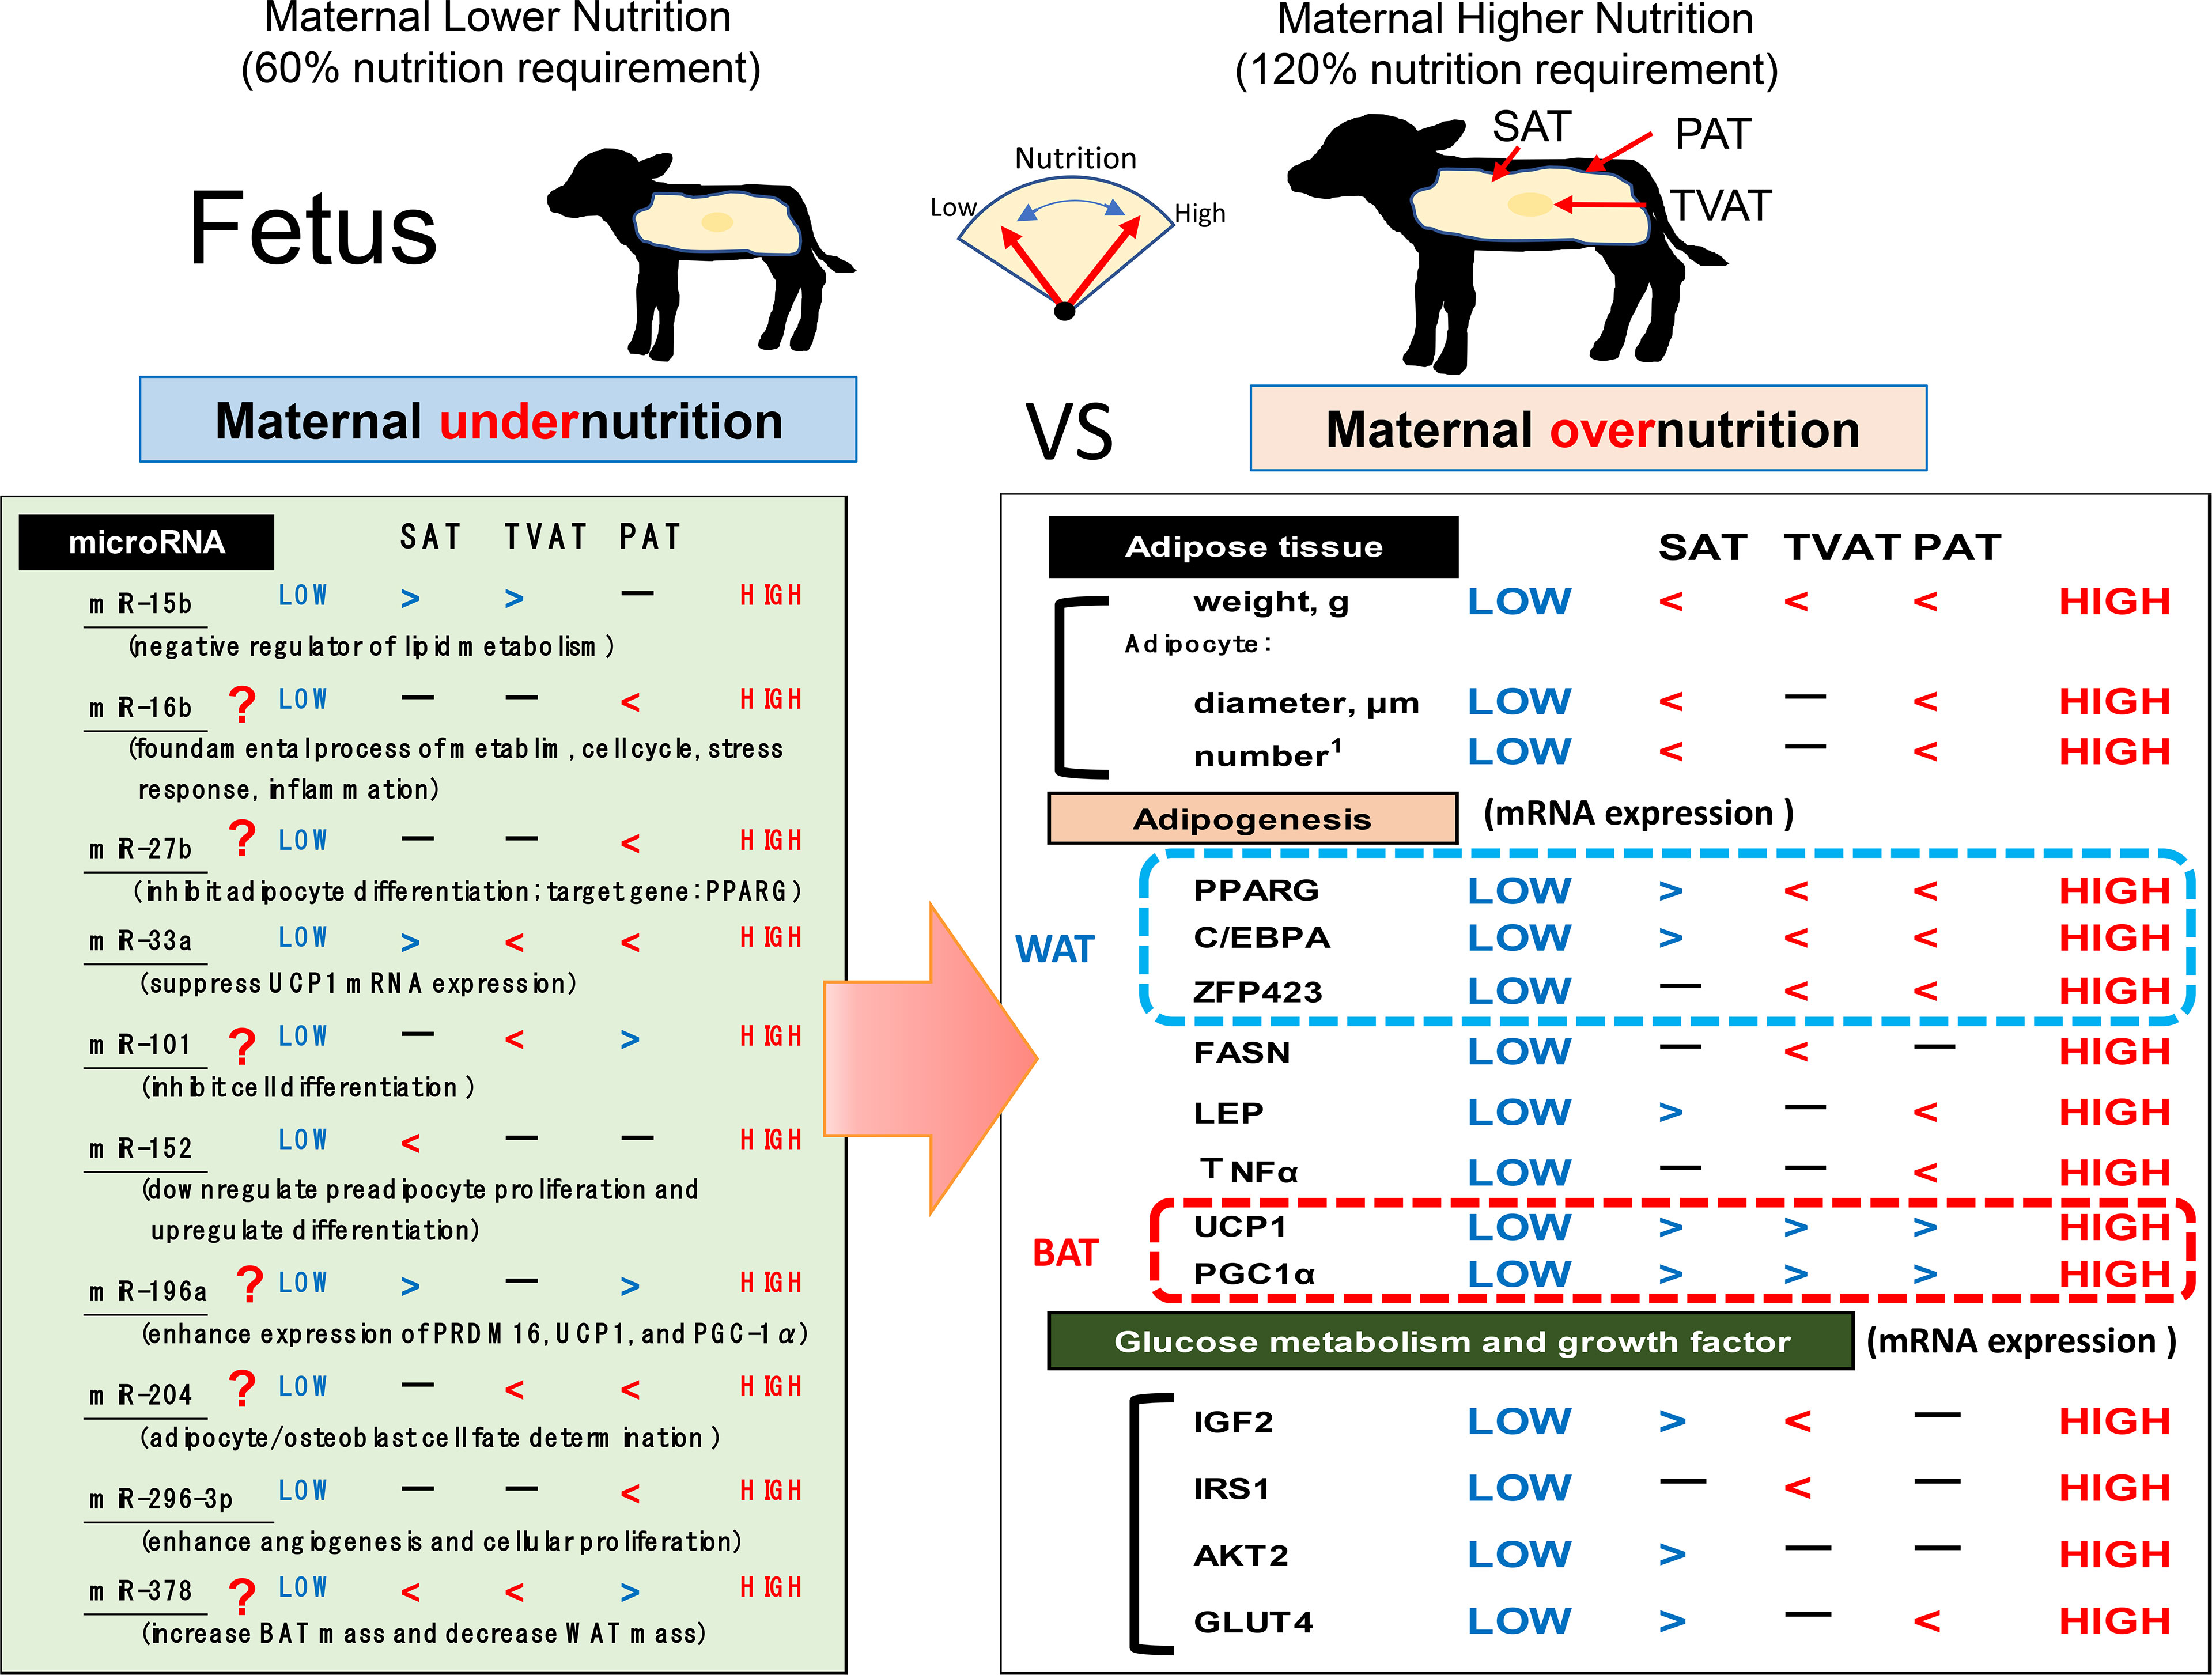
Figure 7 Hypothetical scheme of the influences of maternal under- or overnutrition on the associations between fetal SAT, TVAT, and PAT development in weight, histochemical properties, gene expression (related to adipogenesis, growth factors, and glucose metabolism), and miR expression. Inequality sign is based on p < 0.10.
Data Availability Statement
The data sets presented in this study can be found in online repositories. The names of the repository/repositories and accession number(s) can be found in the article/Supplementary Material.
Ethics Statement
The animal study was reviewed and approved by Kagoshima University Animal Care and Use Committee (A18007).
Author Contributions
YZ: Conceptualization, methodology, software, writing—original draft preparation. KoO: Surgery management, animal care, data curation/investigation/validation. KaO: Reproduction management, animal care, data curation investigation validation. YG: Reproduction management, animal care, data curation/investigation/validation. IO: Reproduction management, data curation/investigation/validation. SM: Data curation/investigation/validation. MS: Data curation/investigation/validation. SR: Physiological data curation, methodology writing—review and editing. TG: Supervision, conceptualization, funding acquisition, writing—review and editing. All authors contributed to the article and approved the submitted version.
Funding
This study received funding from Leave a Nest Co., Ltd., the Canon Foundation (R15-0089), Japan Racing Association and Kakenhi (No. 26310312 and19KT0013) from the Japan Society for the Promotion of Science. The authors declare that the funders had no role in study design, data collection and analysis, decision to publish, or preparation of the manuscript.
Conflict of Interest
The authors declare that the research was conducted in the absence of any commercial or financial relationships that could be construed as a potential conflict of interest.
Publisher’s Note
All claims expressed in this article are solely those of the authors and do not necessarily represent those of their affiliated organizations, or those of the publisher, the editors and the reviewers. Any product that may be evaluated in this article, or claim that may be made by its manufacturer, is not guaranteed or endorsed by the publisher.
Acknowledgments
The authors wish to thank Aoi Kinoshita, Rena Saneshima, Yukiko Nagao, Yasuko Okamura, and Makoto Futohashi for their technical assistance with the sampling. The authors also thank Edanz (https://jp.edanz.com/ac) for editing the English text of a draft of this manuscript.
Supplementary Material
The Supplementary Material for this article can be found online at: https://www.frontiersin.org/articles/10.3389/fendo.2021.797680/full#supplementary-material
References
1. Hornstein I, Wasserman A. Sensory Characteristics of Meat. Part 2-Chemistry of Meat Flavor. In: Price JF, Schweigert BS, editors. The Science of Meat and Meta Products, 3rd ed. Westport, CT: Food and Nutrition Press (1987). p. 329–47.
2. Wheeler TL, Cundiff LV, Koch M. Effect of Marbling Degree on Beef Palatability in Bos Taurus and Bos Indicus Cattle. J Anim Sci (1994) 72:3145–51. doi: 10.2527/1994.72123145x
3. Gotoh T, Albrecht E, Teuscher F, Kawabata K, Sakashita K, Iwamoto H, et al. Differences in Muscle and Fat Accretion in Japanese Black and European Cattle. Meat Sci (2009) 82:300–8. doi: 10.1016/j.meatsci.2009.01.026
4. Bonnet M, Cassar-Malek I, Chilliard Y, Picard B. Ontogenesis of Muscle and Adipose Tissues and Their Interactions in Ruminants and Other Species. Animal (2010) 4:1093–109. doi: 10.1017/S1751731110000601
5. Fève B. Adipogenesis: Cellular and Molecular Aspects. Best Pract Res Clin Endocrinol Metab (2005) 19:483–99. doi: 10.1016/j.beem.2005.07.007
6. Du M, Tong J, Zhao J, Underwood KR, Zhu M, Ford SP, et al. Fetal Programming of Skeletal Muscle Development in Ruminant Animals. J Anim Sci (2010) 88(13 Suppl):E51–60. doi: 10.2527/jas.2009-2311
7. Prior RL, Laster DB. Development of the Bovine Fetus. J Anim Sci (1979) 48:1546–53. doi: 10.2527/jas1979.4861546x
8. Albrecht E, Kuzinski J, Komolka K, Gotoh T, Maak S. Localization and Abundance of Early Markers of Fat Cell Differentiation in the Skeletal Muscle of Cattle During Growth Are DLK1-positive Cells the Origin of Marbling Flecks? Meat Science (2015) 100:237–45. doi: 10.1016/j.meatsci.2014.10.012
9. Ford SP, Hess BW, Schwope MM, Nijland MJ, Gilbert JS, Vonnahme KA, et al. Maternal Undernutrition During Early to Mid-Gestation in the Ewe Results in Altered Growth, Adiposity, and Glucose Tolerance in Male Offspring. J Anim Sci (2007) 85:1285–94. doi: 10.2527/jas.2005-624
10. Funston RN, Larson DM, Vonnahme KA. Effects of Maternal Nutrition on Conceptus Growth and Offspring Performance: Implications for Beef Cattle Production. J Anim Sci (2010) 88:E205–15. doi: 10.2527/jas.2009-2351
11. Rodríguez A, Ezquerro S, Méndez-Giménez L, Becerril S, Frühbeck G. Revisiting the Adipocyte: A Model for Integration of Cytokine Signaling in the Regulation of Energy Metabolism. Am J Physiol Endocrinol Metab (2015) 309:E691–714. doi: 10.1152/ajpendo.00297.2015
12. Symonds ME, Pope M, Sharkey D, Budge H. Adipose Tissue and Fetal Programming. Diabetologia (2012) 55:1597–606. doi: 10.1007/s00125-012-2505-5
13. Hotamisligil GS, Shargill NS, Spiegelman BM. Adipose Expression of Tumor Necrosis Factor-Alpha: Direct Role in Obesity-Linked Insulin Resistance. Science (1993) 259:87–91. doi: 10.1126/science.7678183
14. Zhang J, Fu M, Cui T, Xiong C, Xu K, Zhong W, et al. Selective Disruption of Pparγ2 Impairs the Development of Adipose Tissue and Insulin Sensitivity. Proc Natl Acad Sci (2004) 101:10703–8. doi: 10.1073/pnas.0403652101
15. Gupta RK, Mepani RJ, Kleiner S, Lo JC, Khandekar MJ, Cohen P, et al. Zfp423 Expression Identifies Committed Preadipocytes and Localizes to Adipose Endothelial and Perivascular Cells. Cell Metab (2012) 15:230–9. doi: 10.1016/j.cmet.2012.01.010
16. Huang Y, Zhao JX, Yan X, Zhu MJ, Long NM, McCormick RJ, et al. Maternal Obesity Enhances Collagen Accumulation and Cross-Linking in Skeletal Muscle of Ovine Offspring. PloS One (2012) 7:e31691. doi: 10.1371/journal.pone.0031691
17. De Jager N, Hudson NJ, Reverter A, Barnard R, Café LM, Greenwood PL, et al. Gene Expression Phenotypes for Lipid Metabolism and Intramuscular Fat in Skeletal Muscle of Cattle. J Anim Sci (2013) 91:1112–28. doi: 10.2527/jas.2012-5409
18. Mori M, Nakagami H, Rodriguez-Araujo G, Nimura K, Kaneda Y. Essential Role for miR-196a in Brown Adipogenesis of White Fat Progenitor Cells. PloS Biol (2012) 10:e1001314. doi: 10.1371/journal.pbio.1001314
19. Menghini R, Marchetti V, Cardellini M, Hribal ML, Mauriello A, Lauro D, et al. Phosphorylation of GATA2 by Akt Increases Adipose Tissue Differentiation and Reduces Adipose Tissue-Related Inflammation: A Novel Pathway Linking Obesity to Atherosclerosis. Circulation (2005) 111:1946–53. doi: 10.1161/01.CIR.0000161814.02942.B2
20. Khan AH, Pessin JE. Insulin Regulation of Glucose Uptake: A Complex Interplay of Intracellular Signaling Pathways. Diabetologia (2002) 45:1475–83. doi: 10.1007/s00125-002-0974-7
21. Fernyhough ME, Okine E, Hausman G, Vierck JL, Dodson MV. PPARgamma and GLUT-4 Expression as Developmental Regulators/Markers for Preadipocyte Differentiation Into an Adipocyte. Domest Anim Endocrinol (2007) 33:367–78. doi: 10.1016/j.domaniend.2007.05.001
22. Lee P, Jung SM, Guertin DA. The Complex Roles of mTOR in Adipocytes and Beyond. Trends Endocrinol Metab (2017) 28:319–39. doi: 10.1016/j.tem.2017.01.004
23. McGregor RA, Choi MS. microRNAs in the Regulation of Adipogenesis and Obesity. Curr Mol Med (2011) 11:304–16. doi: 10.2174/156652411795677990
24. Huang J, Zhao L, Xing L, Chen D. MicroRNA-204 Regulates Runx2 Protein Expression and Mesenchymal Progenitor Cell Differentiation. Stem Cells (2010) 28:357–64. doi: 10.1002/stem.288
25. Andersen DC, Jensen CH, Schneider M, Nossent AY, Eskildsen T, Hansen JL, et al. MicroRNA-15a Fine-Tunes the Level of Delta-Like 1 Homolog (DLK1) in Proliferating 3T3-L1 Preadipocytes. Exp Cell Res (2010) 316:1681–91. doi: 10.1016/j.yexcr.2010.04.002
26. Pan D, Mao C, Quattrochi B, Friedline RH, Zhu L, Jung DY, et al. MicroRNA-378 Controls Classical Brown Fat Expansion to Counteract Obesity. Nat Commun (2014) 5:4725. doi: 10.1038/ncomms5725
27. Li H, Ouyang XP, Jiang T, Zheng XL, He PP, Zhao GJ. MicroRNA-296: A Promising Target in the Pathogenesis of Atherosclerosis? Mol Med (2018) 24:12. doi: 10.1186/s10020-018-0012-y
28. Schulz TJ, Huang TL, Tran TT, Zhang H, Townsend KL, Shadrach JL, et al. Identification of Inducible Brown Adipocyte Progenitors Residing in Skeletal Muscle and White Fat. Proc Natl Acad Sci USA (2011) 108:143–8. doi: 10.1073/pnas.1010929108
29. Fan Y, Gan M, Tan Y, Chen L, Shen L, Niu L, et al. Mir-152 Regulates 3t3-L1 Preadipocyte Proliferation and Differentiation. Molecules (2019) 24:3379. doi: 10.3390/molecules24183379
30. Shi C, Zhang M, Tong M, Yang L, Pang L, Chen L, et al. miR-148a is Associated With Obesity and Modulates Adipocyte Differentiation of Mesenchymal Stem Cells Through Wnt Signaling. Sci Rep (2015) 22:9930. doi: 10.1038/srep09930
31. Kong X, Yu J, Bi J, Qi H, Di W, Wu L, et al. Glucocorticoids Transcriptionally Regulate miR-27b Expression Promoting Body Fat Accumulation via Suppressing the Browning of White Adipose Tissue. Diabetes (2015) 64:393–404. doi: 10.2337/db14-0395
32. Afonso MS, Verma N, Solingen CV, Cyr Y, Sharma M, Perie L, et al. MicroRNA-33 Inhibits Adaptive Thermogenesis and Adipose Tissue Beiging. Arteriosclerosis Thrombosis Vasc Biol (2021) 41:1360–73. doi: 10.1161/ATVBAHA.120.315798
33. Guan H, Dai Z, Ma Y, Wang Z, Liu X, Wang X. MicroRNA-101 Inhibits Cell Proliferation and Induces Apoptosis by Targeting EYA1 in Breast Cancer. Int J Mol Med (2016) 37:1643–51. doi: 10.3892/ijmm.2016.2557
34. National Agriculture and Food Research Organization (NARO). Japanese Feeding Standard for Beef Cattle (JFSBC). Tokyo: Japan Livestock Industry Association, corporation (2008).
35. Zhang Y, Otomaru K, Oshima K, Goto Y, Oshima I, Muroya S, et al. Effects of Low and High Levels of Maternal Nutrition Consumed for the Entirety of Gestation on the Development of Muscle, Adipose Tissue, Bone, and the Organs of Wagyu Cattle Fetuses. Anim Sci J (2021) 92:e13600. doi: 10.1111/asj.13600
36. Zhu MJ, Han B, Tong J, Ma C, Kimzey JM, Underwood KR, et al. AMP-Activated Protein Kinase Signaling Pathways are Down Regulated and Skeletal Muscle Development Impaired in Fetuses of Obese, Over-Nourished Sheep. J Physiol (2008) 586:2651–64. doi: 10.1113/jphysiol.2007.149633
37. Tong JF, Yan X, Zhu MJ, Ford SP, Nathanielsz PW, Du M. Maternal Obesity Downregulates Myogenesis and Beta-Catenin Signaling in Fetal Skeletal Muscle. Am J Physiol Endocrinol Metab (2009) 296:E917–24. doi: 10.1152/ajpendo.90924.2008
38. Paradis F, Wood KM, Swanson KC, Miller SP, McBride BW, Fitzsimmons C. Maternal Nutrient Restriction in Mid-to-Late Gestation Influences Fetal mRNA Expression in Muscle Tissues in Beef Cattle. BMC Genomics (2017) 18:632. doi: 10.1186/s12864-017-4051-5
39. Martin DM, Jones AK, Pillai SM, Hoffman ML, McFadden KK, Zinn SA, et al. Maternal Restricted- and Over-Feeding During Gestation Result in Distinct Lipid and Amino Metabolite Profiles I the Longissimus Muscle of the Offspring. Front Physiol (2019) 10:515. doi: 10.3389/fphys.2019.00515
40. Gauvin MC, Pillai MS, Reed SA, Stevens JR, Hoffman ML, Jones AK, et al. Poor Maternal Nutrition During Gestation in Sheep Alters Prenatal Muscle Growth and Development in Offspring. J Anim Sci (2020) 98:skz388. doi: 10.1093/jas/skz388
41. Asano H, Yamada T, Hashimoto O, Umemoto T, Sato R, Ohwatari S, et al. Diet-Induced Changes in Ucp1 Expression in Bovine Adipose Tissues. Gen Comp Endocrinol (2013) 184:87–92. doi: 10.1016/j.ygcen.2013.01.006
42. Du M, Wang B, Fu X, Yang Q, Zhu MJ. Fetal Programming in Meat Production. Meat Sci (2015) 109:40–7. doi: 10.1016/j.meatsci.2015.04.010
43. Long NM, Prado-Cooper MJ, Krehbiel CR, DeSilva U, Wettemann RP. Effects of Nutrient Restriction of Bovine Dams During Early Gestation on Postnatal Growth, Carcass and Organ Characteristics, and Gene Expression in Adipose Tissue and Muscle. J Anim Sci (2010) 88:3251–61. doi: 10.2527/jas.2009-2512
44. Kershaw EE, Flier JS. Adipose Tissue as an Endocrine Organ. J Clin Endocrinol Metab (2004) 89:2548–56. doi: 10.1210/jc.2004-0395
45. Albrecht EA, Schering L, Liu Y, Komolka K, Kühn C, Wimmers K, et al. Factors Influencing Bovine Intramuscular Adipose Tissue Development and Cellularity. J Anim Sci (2017) 95:2244–54. doi: 10.2527/jam2016-0786
46. Ferrell CL, Jenkins TG. Cow Type and the Nutritional Environment: Nutritional Aspects. J Anim Sci (1985) 61:725–41. doi: 10.2527/jas1985.613725x
47. Blaxter KL, Wainman FW, Davidson JL. The Voluntary Intake of Food by Sheep and Cattle in Relation to Their Energy Requirements for Maintenance. Anim Prod (1966) 8:75–83. doi: 10.1017/S0003356100037739
48. Labussière E, van Milgen J, de Lange CFM, Noblet J. Maintenance Energy Requirements of Growing Pigs and Calves Are Influenced by Feeding Level. J Nutr (2011) 141:1855–61. doi: 10.3945/jn.111.141291
49. Symonds ME, Stephenson T, Gardner DS, Budge H. Long-Term Effects of Nutritional Programming of the Embryo and Fetus: Mechanisms and Critical Windows. Reprod Fertil Dev (2007) 19:53–63. doi: 10.1071/rd06130
50. Cheng L, Wang J, Dai H, Duan Y, An Y, Shi L, et al. Brown and Beige Adipose Tissue: A Novel Therapeutic Strategy for Obesity and Type 2 Diabetes Mellitus. Adipocyte (2021) 10(1):48–65. doi: 10.1080/21623945.2020.1870060
51. Jennings TD, Gonda MG, Underwood KR, Wertz-Lutz AE, Blair AD. The Influence of Maternal Nutrition on Expression of Genes Responsible for Adipogenesis and Myogenesis in the Bovine Fetus. Animal (2016) 10:1697–705. doi: 10.1017/S1751731116000665
52. Redmer DA, Wallace JM, Reynolds LP. Effect of Nutrient Intake During Pregnancy on Fetal and Placental Growth and Vascular Development. Domest Anim Endocrinol (2004) 27:199–217. doi: 10.1016/j.domaniend.2004.06.006
53. Martin GS, Carstens GE, Taylor TL, Sweatt CR, Eli AG, Lunt DK, et al. Prepartum Protein Restriction Does Not Alter Norepinephrine-Induced Thermogenesis or Brown Adipose Tissue Function in Newborn Calves. J Nutr (1997) 127:1929–37. doi: 10.1093/jn/127.10.1929
54. Farvid MS, Ng TWK, Chan DC, Barrett PHR, Watts GF. Association of Adiponectin and Resistin With Adipose Tissue Compartments, Insulin Resistance and Dyslipidaemia. Diabetes Obes Metab (2005) 7:406–13. doi: 10.1111/j.1463-1326.2004.00410.x
55. Robelin J. Cellularity of Bovine Adipose Tissues: Developmental Changes From 15 to 65 Percent Mature Weight. J Lipid Res (1981) 22:452–7. doi: 10.1016/S0022-2275(20)34959-2
56. Gnanalingham MG, Mostyn A, Symonds ME, Stephenson T. Ontogeny and Nutritional Programming of Adiposity in Sheep: Potential Role of Glucocorticoid Action and Uncoupling Protein-2. Am J Physiol Regul Integr Comp Physiol (2005) 289:R1407–15. doi: 10.1152/ajpregu.00375.2005
57. Muhlhausler BS, Duffield JA, McMillen IC. Increased Maternal Nutrition Stimulates Peroxisome Proliferator Activated Receptor-Gamma, Adiponectin, and Leptin Messenger Ribonucleic Acid Expression in Adipose Tissue Before Birth. Endocrinology (2007) 148:878–85. doi: 10.1210/en.2006-1115
58. Ladeira MM, Schoonmaker JP, Gionbelli MP, Dias JCO, Gionbelli TRS, Carvalho JRR, et al. Nutrigenomics and Beef Quality: A Review About Lipogenesis. Int J Mol Sci (2016) 17:918. doi: 10.3390/ijms17060918
59. Yau SW, Henry BA, Russo VC, McConell GK, Clarke IJ, Werther GA, et al. Leptin Enhances Insulin Sensitivity by Direct and Sympathetic Nervous System Regulation of Muscle IGFBP-2 Expression: Evidence from Nonrodent Models. Endocrinology (2014) 155:2133–43. doi: 10.1210/en.2013-2099
60. Carvalho E, Kotani K, Peroni OD, Kahn BB. Adipose-Specific Overexpression of GLUT4 Reverses Insulin Resistance and Diabetes in Mice Lacking GLUT4 Selectively in Muscle. Am J Physiol Endocrinol Metab (2005) 289:E551–61. doi: 10.1152/ajpendo.00116.2005
61. Clarke SL, Robinson CE, Gimble JM. CAAT/enhancer Binding Proteins Directly Modulate Transcription From the Peroxisome Proliferator-Activated Receptor Gamma 2 Promoter. Biochem Biophys Res Commun (1997) 240:99–103. doi: 10.1006/bbrc.1997.7627
62. Wu Z, Rosen ED, Brun R, Hauser S, Adelmant G, Troy AE, et al. Cross-Regulation of C/EBP Alpha and PPAR Gamma Controls the Transcriptional Pathway of Adipogenesis and Insulin Sensitivity. Mol Cell (1999) 3:151–8. doi: 10.1016/s1097-2765(00)80306-8
63. Lawrence TLJ, Fowler VR, Novakofski JE. Chapter 4. Tissues: Basic Structure and Growth. In: Growth, Growth of Farm Animals, 3rd Ed. London, UK: CAB International (2012). p. 139–73.
64. Wang GX, Meyer JG, Cai W, Softic S, Li ME, Verdin E, et al. Regulation of UCP1 and Mitochondrial Metabolism in Brown Adipose Tissue by Reversible Succinylation. Mol Cell (2019) 74:844–57. doi: 10.1016/j.molcel.2019.03.021
65. Ikeda K, Maretich P, Kajimura S. The Common and Distinct Features of Brown and Beige Adipocytes. Trends Endocrinol Metab (2018) 29:191–200. doi: 10.1016/j.tem.2018.01.001
66. Chouchani ET, Kazak L, Spiegelman BM. New Advances in Adaptive Thermogenesis: UCP1 and Beyond. Cell Metab (2019) 29:27–37. doi: 10.1016/j.cmet.2018.11.002
67. Landis MD, Cars tens GE, MPhil EG, Randal RD, Green KK, Slay L, et al. Ontogenic Development of Brown Adipose Tissue in Angus and Brahman Fetal Calves. J Anim Sci (2002) 80:591–601. doi: 10.2527/2002.803591x
68. Gardner DS, Tingey K, Van Bon BW, Ozanne SE, Wilson V, Dandrea J, et al. Programming of Glucose-Insulin Metabolism in Adult Sheep After Maternal Undernutrition. Am J Physiol Regul Integr Comp Physiol (2005) 289:R947–54. doi: 10.1152/ajpregu.00120.2005
69. Bispham J, Gardner DS, Gnanalingham MG, Stephenson T, Symonds ME, Budge H. Maternal Nutritional Programming of Fetal Adipose Tissue Development: Differential Effects on Messenger Ribonucleic Acid Abundance for Uncoupling Proteins and Peroxisome Proliferator-Activated and Prolactin Receptors. Endocrinology (2005) 146:3943–9. doi: 10.1210/en.2005-0246
70. Gupta RK, Arany Z, Seale P, Mepani RJ, Ye L, Conroe HM, et al. Transcriptional Control of Preadipocyte Determination by Zfp423. Nature (2010) 464:619–23. doi: 10.1038/nature08816
71. Shao M, Hepler C, Vishvanath L, MacPherson KA, Busbuso NC, Gupta RK. Fetal Development of Subcutaneous White Adipose Tissue is Dependent on Zfp423. Mol Metab (2017) 6:111–24. doi: 10.1016/j.molmet.2016.11.009
72. Seale P, Bjork B, Yang W, Kajimura S, Chin S, Kuang S, et al. PRDM16 Controls a Brown Fat/Skeletal Muscle Switch. Nature (2008) 454:961–7. doi: 10.1038/nature07182
73. Lepper C, Fan CM. Inducible Lineage Tracing of Pax7-Descendant Cells Reveals Embryonic Origin of Adult Satellite Cells. Genesis (2010) 48:424–36. doi: 10.1002/dvg.20630
74. Yang QY, Liang JF, Rogers CJ, Zhao JX, Zhu MJ, Du M. Maternal Obesity Induces Epigenetic Modifications to Facilitate Zfp423 Expression and Enhance Adipogenic Differentiation in Fetal Mice. Diabetes (2013) 62:3727–35. doi: 10.2337/db13-0433
75. Liang X, Yang Q, Zhang L, Maricelli JW, Rodgers BD, Zhu MJ, et al. Maternal High-Fat Diet During Lactation Impairs Thermogenic Function of Brown Adipose Tissue in Offspring Mice. Sci Rep (2016) 6:34345. doi: 10.1038/srep34345
76. Hilton C, Neville MJ, Karpe F. MicroRNAs in Adipose Tissue: Their Role in Adipogenesis and Obesity. Int J Obes (Lond) (2013) 37:325–32. doi: 10.1038/ijo.2012.59
77. Price NL, Fernández-Hernando C. miRNA Regulation of White and Brown Adipose Tissue Differentiation and Function. Biochim Biophys Acta (2016) 1861:2104–10. doi: 10.1016/j.bbalip.2016.02.010
78. Spiegelman BM, Puigserver P, Wu Z. Regulation of Adipogenesis and Energy Balance by PPARgamma and PGC-1. Int J Obes Relat Metab Disord (2000) 4:S8–10. doi: 10.1038/sj.ijo.0801492
79. Lin Q, Gao Z, Alarcon RM, Ye J, Yun Z. A Role of miR-27 in the Regulation of Adipogenesis. FEBS J (2009) 276:2348–58. doi: 10.1111/j.1742-4658.2009.06967.x
80. Lee EK, Lee MJ, Abdelmohsen K, Kim W, Kim MM, Srikantan S, et al. miR-130 Suppresses Adipogenesis by Inhibiting Peroxisome Proliferator-Activated Receptor Gamma Expression. Mol Cell Biol (2011) 31:626–38. doi: 10.1128/MCB.00894-10
81. Sun L, Trajkovski M. MiR-27 Orchestrates the Transcriptional Regulation of Brown Adipogenesis. Metabolism (2014) 63(2):272–82. doi: 10.1016/j.metabol.2013.10.004
82. Gesta S, Tseng YH, Kahn CR. Developmental Origin of Fat: Tracking Obesity to its Source. Cell (2007) 131:242–56. doi: 10.1016/j.cell.2007.10.004
83. Yan X, Zhu MJ, Dodson MV, Du M. Developmental Programming of Fetal Skeletal Muscle and Adipose Tissue Development. J Genom (2013) 1:29–38. doi: 10.7150/jgen.3930
84. Burak K, Lamoureux L, Boese A, Majer A, Saba R, Niu Y, et al. MicroRNA-16 Targets mRNA Involved in Neurite Extension and Branching in Hippocampal Neurons During Presymptomatic Prion Disease. Neurobiol Dis (2018) 112:1–13. doi: 10.1016/j.nbd.2017.12.011
Keywords: maternal nutrition, Wagyu fetus, adipose tissue, gene expression, histochemical property
Citation: Zhang Y, Otomaru K, Oshima K, Goto Y, Oshima I, Muroya S, Sano M, Roh S and Gotoh T (2022) Maternal Nutrition During Gestation Alters Histochemical Properties, and mRNA and microRNA Expression in Adipose Tissue of Wagyu Fetuses. Front. Endocrinol. 12:797680. doi: 10.3389/fendo.2021.797680
Received: 19 October 2021; Accepted: 15 December 2021;
Published: 01 February 2022.
Edited by:
Takahiro Nemoto, Nippon Medical School, JapanReviewed by:
Elke Albrecht, Leibniz Institute for Farm Animal Biology (FBN), GermanyStephen Brent Smith, Texas A&M University, United States
Copyright © 2022 Zhang, Otomaru, Oshima, Goto, Oshima, Muroya, Sano, Roh and Gotoh. This is an open-access article distributed under the terms of the Creative Commons Attribution License (CC BY). The use, distribution or reproduction in other forums is permitted, provided the original author(s) and the copyright owner(s) are credited and that the original publication in this journal is cited, in accordance with accepted academic practice. No use, distribution or reproduction is permitted which does not comply with these terms.
*Correspondence: Takafumi Gotoh, Z290b2hAYWdyaS5rYWdvc2hpbWEtdS5hYy5qcA==