 Ying-Chen Chen
 Bing-Ze Lu
 Yu-Chen Shu
 Yuan-Ting Sun
- 1Department of Medical Imaging, National Cheng Kung University Hospital, College of Medicine, National Cheng Kung University, Tainan, Taiwan
- 2Department of Radiology, Kaohsiung Municipal United Hospital, Kaohsiung, Taiwan
- 3Department of Mathematics, College of Science, National Cheng Kung University, Tainan, Taiwan
- 4Department of Neurology, National Cheng Kung University Hospital, College of Medicine, National Cheng Kung University, Tainan, Taiwan
- 5Department of Medical Genomics, National Cheng Kung University Hospital, College of Medicine, National Cheng Kung University, Tainan, Taiwan
Aims: Diabetes-related cerebral microangiopathy can manifest as cerebral small vessel disease (CSVD) and exhibit cognitive decline. To find the early change of function in advance, this study examined the spatiotemporal dynamics of cerebral vascular permeability (Ktrans) in the progression of type 2 diabetes mellitus (T2DM).
Methods: Ktrans was cross-sectionally measured in T2DM and non-diabetes groups with or without CSVD using dynamic contrast-enhanced MRI (DCE-MRI).
Results: In all patients with T2DM, the Ktrans of white matter (WM) was increased, whereas the Ktrans of gray matter (GM) was increased only in T2DM with CSVD. The involvement of WM was earlier than GM and was before the CSVD features could be visualized on MRI. Among the commonly available four CSVD items of MRI, microbleeds were the most sensitive, indicating the increased permeability in all patients. Increased Ktrans in T2DM was more associated with moderate WM hyperintensity but less with the presence of lacunae or multiple perivascular spaces, in contrast to patients without diabetes. The differential correlation suggested distinct mechanisms underlying diabetes-related CSVD and other CSVDs.
Conclusions: This study highlights the early development of cerebral microangiopathy with increased BBB leakage in T2DM, before the CSVD features can be visualized on MRI. The results may increase the proactivity of clinicians in recognizing the subsequent neurological comorbidities.
Introduction
Cerebral small vessel disease (CSVD) represents a heterogeneous group of disorders. The hypothetical etiologies include microatheroma, endothelial dysfunction, inflammation, and altered microvascular blood–brain barrier (BBB) integrity (1). Type 2 diabetes mellitus (T2DM) is highly associated with CSVD (2–4) that can manifest as symptomatic or silent lacunar infarcts and cognitive decline. T2DM-related CSVD can be diabetic microangiopathy involving the brain. Given the increasing global prevalence of diabetes, CSVD and the accompanying neurological disability are considerable challenges for healthcare systems (5) and thus are becoming increasingly crucial (4–7).
Vascular permeability was recently reported as a critical mechanism underlying dementia (8). Diabetes triggers various vascular pathologies, including increased vascular permeability that may contribute to cognitive decline and other morbidities such as ischemic stroke (9, 10). Therefore, the increase in BBB permeability in patients with T2DM might be an early tissue-level dysfunction associated with subsequent cognitive decline.
This study hypothesized that the increase in vascular permeability would present early in patients with T2DM, even before the development of CSVD features on MRI. This temporal evolution may be unique to T2DM-related CSVD that represents cerebral microangiopathy similar to other target organs in diabetes. To test the hypothesis, we performed dynamic contrast-enhanced MRI (DCE-MRI) to examine the spatiotemporal dynamics of cerebral vascular permeability (11) in T2DM patients with or without CSVD. Then, we correlated the CSVD items of conventional MRI with cerebral permeability and compared the findings with CSVD patients without diabetes to identify the unique features of the T2DM-specific cerebral microangiopathy in a heterogeneous CSVD group.
Subjects, Materials, and Methods
Study Design
This study was carried out at the National Cheng Kung University Hospital (Tainan, Taiwan) and Kaohsiung Municipal United Hospital (Kaohsiung, Taiwan). The local Institutional Review Board approved the protocol (Approval No. A-BR-106-081). Four groups of subjects, T2DM without CSVD, T2DM with CSVD, patients with CSVD but without T2DM, and controls (individuals without T2DM, without CSVD), were recruited from the neurology outpatient clinic in National Cheng Kung University Hospital. Demographic data, permeability, and CSVD scores on MRI between the four groups were analyzed cross-sectionally.
Participants
In recruiting subjects, the diagnosis of T2DM, followed by the American Diabetes Association (12–14), should exist on medical records for at least 5 years. The stages of chronic kidney disease (CKD) followed the guidance from the National Kidney Foundation (15). Hypertension, if it exists, should be well controlled (16). The presence of CSVD was defined as a total CSVD score of >1 on MRI (17). Patients with intracranial tumor, cerebral venous thrombosis, hemorrhagic stroke, immune-mediated neuroinflammatory disease, hydrocephalus, >50% stenosis in any large intracranial vessel, hereditary neurodegenerative disorder, advanced CKD (>stage III), liver cirrhosis, history of posterior reversible encephalopathy syndrome, and acute infection were ineligible for this study. Demographic data, dementia, hypertension, hyperlipidemia, levels of HbA1c, total cholesterol, low-density lipoprotein cholesterol, and creatinine were collected. Patients with a Mini-Mental Status Examination score of ≤26 or a Clinical Dementia Rating score of ≥0.5 were considered to have dementia.
Imaging Protocol
Structural Imaging
All participants underwent conventional structural imaging and then DCE-MRI on an MRI system (Ingenia 3.0 T, Philips Healthcare, the Netherlands). Conventional structural sequences contained axial T1-weighted images, axial T2-weighted fat-saturation images, and axial T2-weighted fluid-attenuated inversion recovery (FLAIR) images, as well as susceptibility-weighted images to evaluate microbleeding.
DCE-MRI
To examine vascular permeability on MRI, two reference series using axial T1-weighted fast-field echo (T1-FFE) with flip angles of 5° and 15° were initially performed. Subsequently, DCE-MRI of the whole brain was performed using axial T1-FFE with a flip angle of 8° (repetition time/echo time, 2.8/1.32 ms; slice width, 3 mm; no slice gap; field of view, 230 × 202 × 108 mm3; matrix, 116 × 115). An intravenous bolus injection of a gadolinium-based contrast agent, gadoterate meglumine (Gd-DOTA), was administered after the first imaging of this series at a dose of 0.1 mmol/kg. The DCE-MRI sequence was repeated 63 times over a 25-min acquisition period. The details of imaging intervals are as follows: an imaging interval of 4 s during a postcontrast injection of 0–1 min, an imaging interval of 6 s during a postcontrast injection of 1–3 min, an imaging interval of 8 s during a postcontrast injection of 3–4 min, and an imaging interval of 1 min during a postcontrast injection of 4–25 min (Figure 1A).
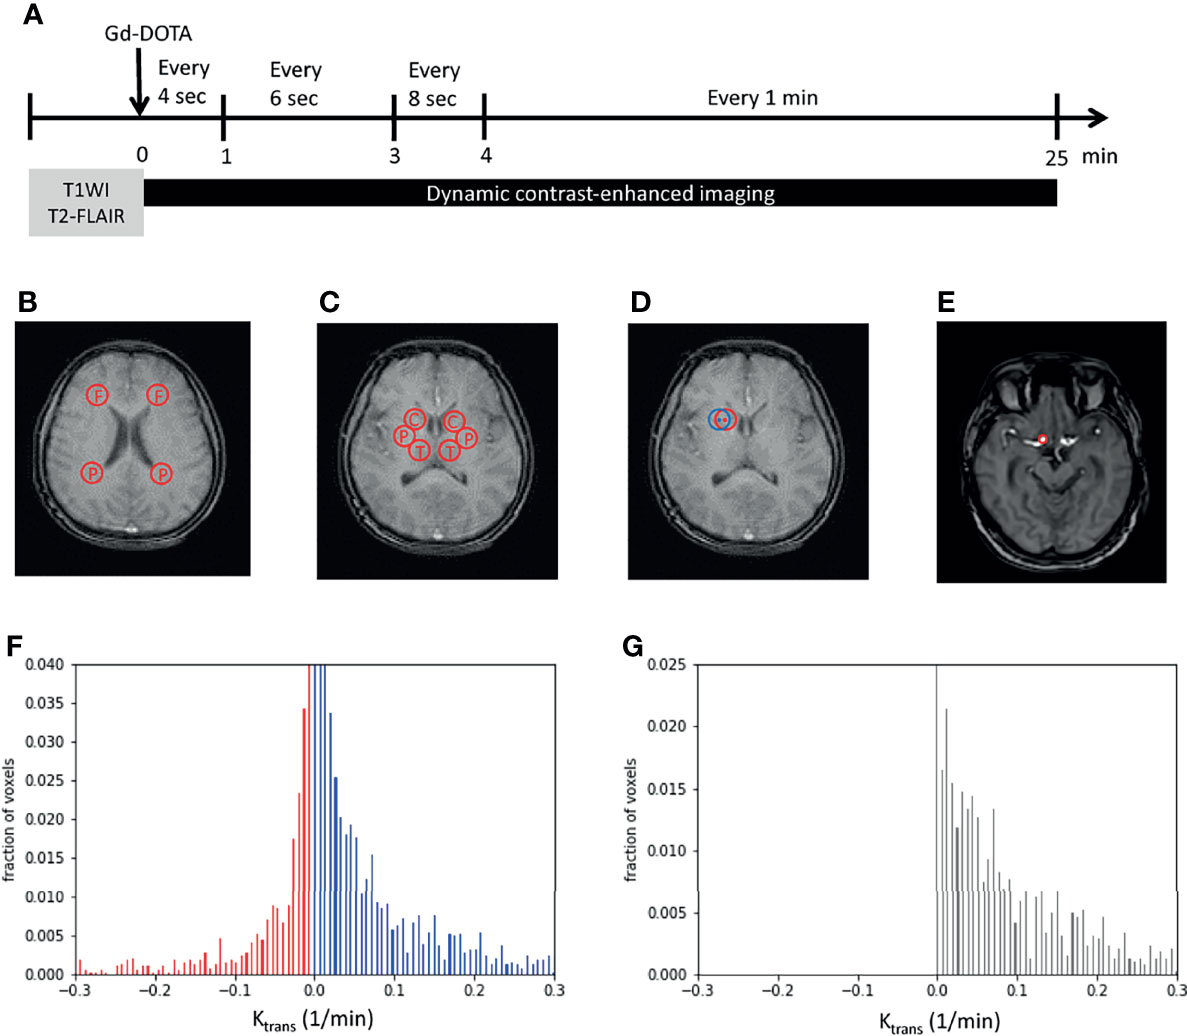
Figure 1 Image processing. (A) Imaging protocols included structural images (T1WI and T2-FLAIR images) and dynamic imaging. The time bar shows dynamic imaging intervals during the 25-min acquisition time. (B, C) Examples show the two regions of interest (ROIs) in the white matter (WM) (B), namely, the frontal and parietal WM, and three ROIs in the gray matter (C), namely, the caudate head, putamen, and thalamus. (D) An example shows the perturbation of ROIs. The center and radius of the initial ROI (in red) randomly oscillated within three pixels to obtain another ROI (in blue) that was near to the initially examined ROI (in red). (E) The internal carotid artery was selected and set as the region of plasma in Patlak analysis. (F, G) The Ktrans of each pixel was plotted as a histogram. Red bars indicated negative Ktrans values and were considered as noise (F). The noise was supposed to exist with the same distribution on the positive side. By subtracting noise (red bars) from the original histogram (blue bars), tissue permeability was observed (black bars in G). x-axis, Ktrans; y-axis, the fraction of voxels. F, frontal; P, parietal; C, caudate head; P, putamen; T, thalamus; Gd-DOTA, gadoterate meglumine; T1WI, T1-weighted image; T2-FLAIR, T2-weighted fluid-attenuated inversion recovery.
Image Analysis
To overcome the subtle inhomogeneity between T1 images, we used the intensity of the fat tissue near the constant brightness of each image as a reference for the following calibration. The averaged intensity of the three regions of fat around the eyes was adjusted to a value of 1 in each image. Five regions of interest (ROIs) were chosen: frontal WM, parietal WM, caudate head (CH), putamen, and thalamus. The frontal and parietal WM measurements were obtained using an axial view image at the level above the CH. The centers of the ROIs were laterally next to the frontal and parietal horns of the lateral ventricles (Figure 1B). The CH, putamen, and thalamus measurements were obtained using an axial view image at the central thalamus and Sylvian fissure (Figure 1C). To avoid bias caused by the inhomogeneity of the selected ROIs, the center and radius of each ROI were randomly oscillated within 3 pixels to obtain six ROIs close to the chosen ROI (Figure 1D) initially. The intensities of the six corresponding oscillated regions were averaged to represent the selected ROI initially.
Determination of BBB Permeability (Ktrans)
A Patlak graphical analysis technique was adopted to determine pixel-wise BBB permeability (Ktrans) in an ROI under the assumption of the irreversible uptake pharmacokinetics of Gd-DOTA (18). In a compartment model, the relative concentration C(r, t) was modeled in terms of the contrast of the initial intensity as follows:
where Te is the echo time, K is the concentration constant, and S(r, t) is the intensity of the pixel location r at time t after Gd-DOTA injection. The concentration Ci(r, t) in the ROI was estimated using the following equation:
where V(r) is the distribution of Gd-DOTA in the vessels, Cp(t) is the concentration of Gd-DOTA in the plasma, and Ktrans(r) is the rate at which Gd-DOTA enters the brain parenchyma, indicating permeability. We obtained the plasma Gd-DOTA intensity by marking the internal carotid artery as the region of plasma (ROP; Figure 1E). In addition, we perturbed the selected ROP to reduce the inhomogeneity between pixel values. The averaged relative concentration of ROP was calculated using the following equation:
Noise Elimination
To minimize noise produced by imaging procedures, a noise elimination method that involved plotting the histogram of Ktrans in an ROI was applied (19). After all the Ktrans values of each pixel were computed, normalization preprocessing was performed to obtain the pixel-wise proportion of each Ktrans. The cumulative sum of all Ktrans values was set as 1. Subsequently, all Ktrans values were plotted pixel-wise on a histogram, with the proportion of the pixel in an ROI presented on the y-axis (Figure 1F). Because Ktransin the model refers to the rate of entry into an irreversible compartment, a negative value representing an opposite direction of the movement of Gd-DOTA from the parenchyma to the vessel was considered noise (red bars in Figure 1F). In addition, the noise was supposed to be present on the positive part of the histogram with a mirror distribution of the negative part. After subtracting the estimated noise (red bars, Figure 1F) from the positive Ktrans histogram (blue bars, Figure 1F), the remaining cumulative sum of the bars was identified as the approximate Ktrans in an ROI (Figure 1G).
CSVD Scoring
The presence of CSVD was determined by viewing structural MRI images. The CSVD score was obtained by summating the four parameters raised by Staals et al. (17), which had been applied and validated in multiple fields of neurology (20–22): lacunes, microbleeds, perivascular space (PVS), and grading of periventricular leukoaraiosis, namely, WM hyperintensity (WMH) (17). The WMH was graded from 0 to 3 using the Fazekas scale. Patients were considered to have CSVD if their CSVD score was >1.
Software and Statistical Analysis
The total Ktrans represented an average from Ktrans of WM and Ktrans of GM. Ktrans of WM was an average from Ktrans of frontal and parietal WM. Ktrans of GM was an average from Ktrans of CH, putamen, and thalamus. The imaging processing and scientific computing of Ktrans were performed using MATLAB (2019b, The MathWorks, Natick, Massachusetts, USA) and the Python programming language (version 3.7). Statistical analyses were performed using Prism (version 6; GraphPad Software, La Jolla, CA, USA) and the R programming language (version 4.0.4). Unpaired Student’s t-test, Mann–Whitney U test, Fisher’s exact test, one-way analysis of variance (ANOVA), or Kruskal–Wallis test were used according to data type and group number. Normality tests were conducted for continuous data before comparisons. To test the correlation, Kendall’s tau was used for ordinal data, and a permutation-based linear model with 10,000 random shufflings was used for continuous numerical data. Significance was set at p < 0.05.
Results
Thirty-one patients with T2DM and 14 individuals without diabetes were enrolled. Seven were excluded because of numerous motion artifacts on their MRI. Finally, 25 patients with T2DM (11 women, 49–88 years old) and 12 individuals without T2DM (8 women, 21–81 years old) were included in the analysis. The demographic data of the excluded subjects were not different from the study subjects. Patients with T2DM were further divided into two groups based on the MRI-based CSVD score: T2DM without CSVD (n = 12, 7 female, 49–78 years old) and T2DM with CSVD (n = 13, 4 female, 63–88 years old) (Table 1). The distribution of sex and the prevalence of hypertension did not differ among the three groups (p = 0.25 and 0.18, respectively, Fisher’s exact test). Subjects of T2DM with CSVD were older (p = 0.004, one-way ANOVA with the multiple comparisons test), had a higher proportion of dementia (p = 0.034, Fisher’s exact test), and had a more advanced stage of CKD (p = 0.036, Kruskal–Wallis test). Among patients with T2DM, the HbA1c level was equal (p = 0.22, Student’s t-test) between the CSVD and non-CSVD groups. The scores of individual CSVD items and the total CSVD score did not differ between the control and T2DM without CSVD groups (total score, p = 0.301; lacune, p = 0.9; PVS, p = 0.39; WMH, p = 0.62; microbleeds, p = 0.195; Mann–Whitney U test).
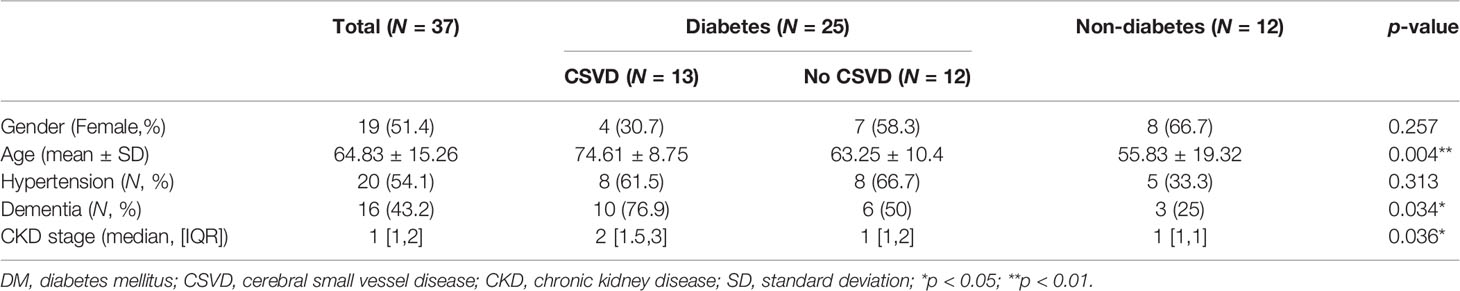
Table 1 Demographic data of patients with and without diabetes.
Temporal Dynamics: T2DM Showed an Impact on the Increase in Ktrans in Addition to the Effect of Aging, Particularly in Diabetes With CSVD Group
In all subjects, the total Ktrans, Ktrans of WM, and Ktrans of GM all increased with age (Figures 2A–D), approximately following the equation of total Ktrans = (0.2517 * age − 4.254)/1000 (R2 = 0.3638, p = 0.0379) in the control group and total Ktrans= [0.1768 * age + 12.73]/1,000 in the T2DM group. Before the adjustment for age, the T2DM group had increased total Ktrans, Ktrans of WM, and Ktrans of GM (p = 0.0258, 0.0199, and 0.0319, respectively, Student’s t-test, Figures 2E–G). In order to adjust the effect of aging, a permutation-based linear model with 10,000 random shufflings of patients and healthy controls was performed to test the correlation. A significant effect of diabetes on the Ktrans of WM (p = 0.048, Figure 2F) but not on total Ktrans and Ktrans of GM was found (p = 0.128, p = 0.132, respectively, Figures 2E–G) between T2DM and the control group.
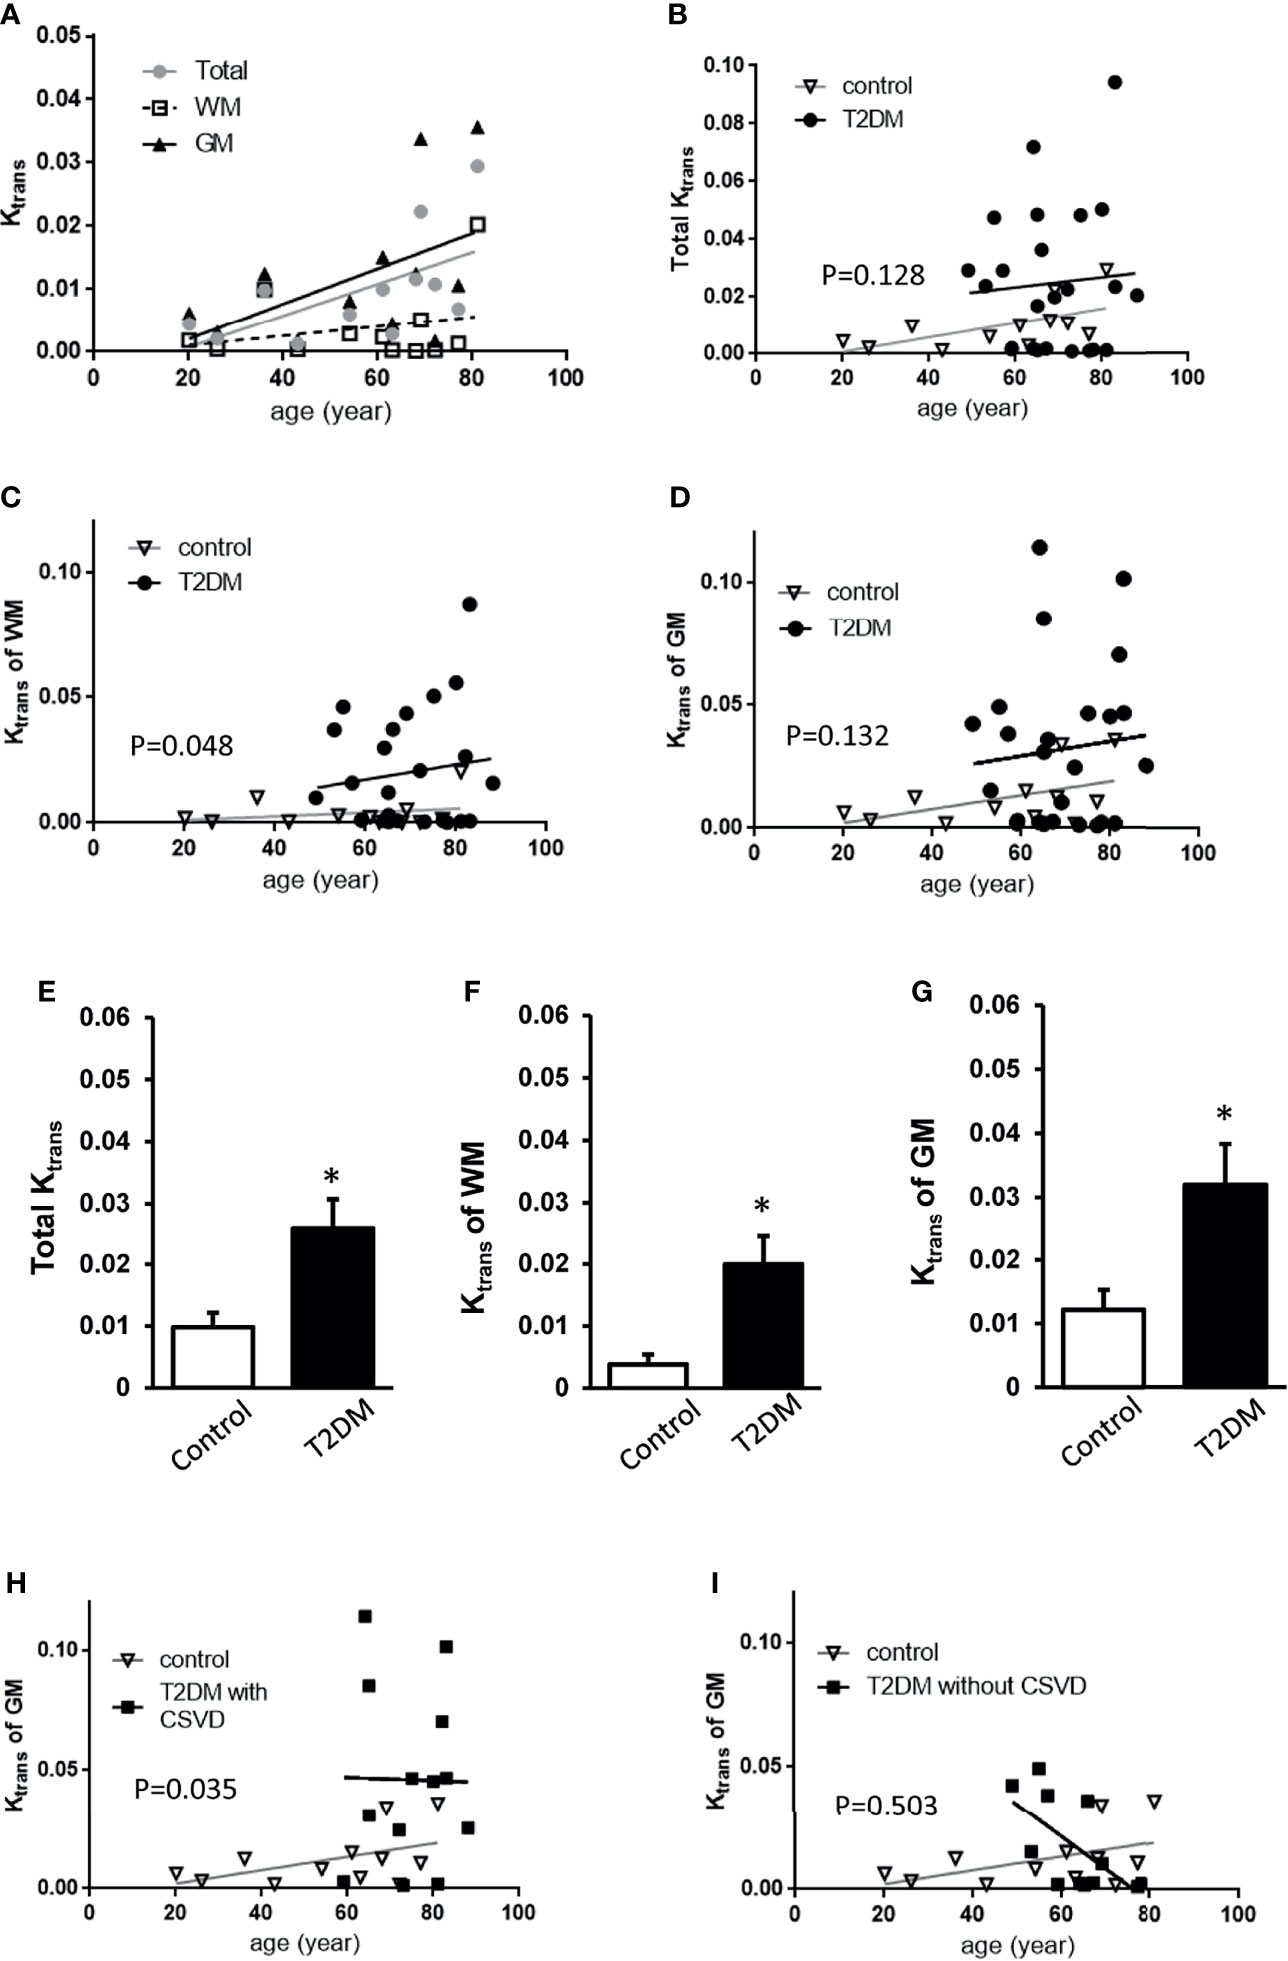
Figure 2 Comparisons of Ktrans among control, T2DM, and T2DM with CSVD groups. (A) The averaged total Ktrans, Ktrans of the WM, and GM plotted against age in the control group (N = 12). (B–D) The total Ktrans (B), Ktrans of the WM (C), and GM (D) plotted against age in T2DM (N = 25) and control groups (N = 12). (E–G) Comparisons of total Ktrans (E), Ktrans of the white matter (WM) (F), and Ktrans of the gray matter (GM) (G) between patients with T2DM and controls. Unpaired t-test. *p < 0.05. (H, I) The Ktrans of the GM plotted against age in T2DM with CSVD and the control group (H) and in T2DM without CSVD and the control group (I). A permutation-based linear model with 10,000 random shufflings. x-axis, age; y-axis, Ktrans. WM, white matter; GM, gray matter; T2DM, type 2 diabetes mellitus; CSVD, cerebral small vessel disease.
Based on the assumption that CSVD features on MRI represented a more advanced stage of T2DM than no CSVD features on MRI (23), T2DM patients were further divided into T2DM with CSVD and T2DM without CSVD. The effect of diabetes on Ktrans of GM after age adjustment was shown in the T2DM with CSVD group (p = 0.035, permutation test for 10,000 random resamples, Figure 2H) but not in the T2DM without CSVD group (p = 0.503, permutation test for 10,000 random resamples, Figure 2I). Figures 3A–C show the Ktrans of each cerebral area in the control (A), T2DM without CSVD (B), and T2DM with CSVD (C) groups. The increase of Ktrans was found in every ROI in the T2DM with CSVD group (Figure 3C). The higher averaged total Ktrans of T2DM patients shown in Figure 2E was mainly contributed by T2DM patients with CSVD (p = 0.008, Student’s t-test, Figure 3D). No statistical difference was found between control and T2DM without CSVD, or between T2DM with or without CSVD (p = 0.24 and 0.093, respectively, Student’s t-test, Figure 3D).
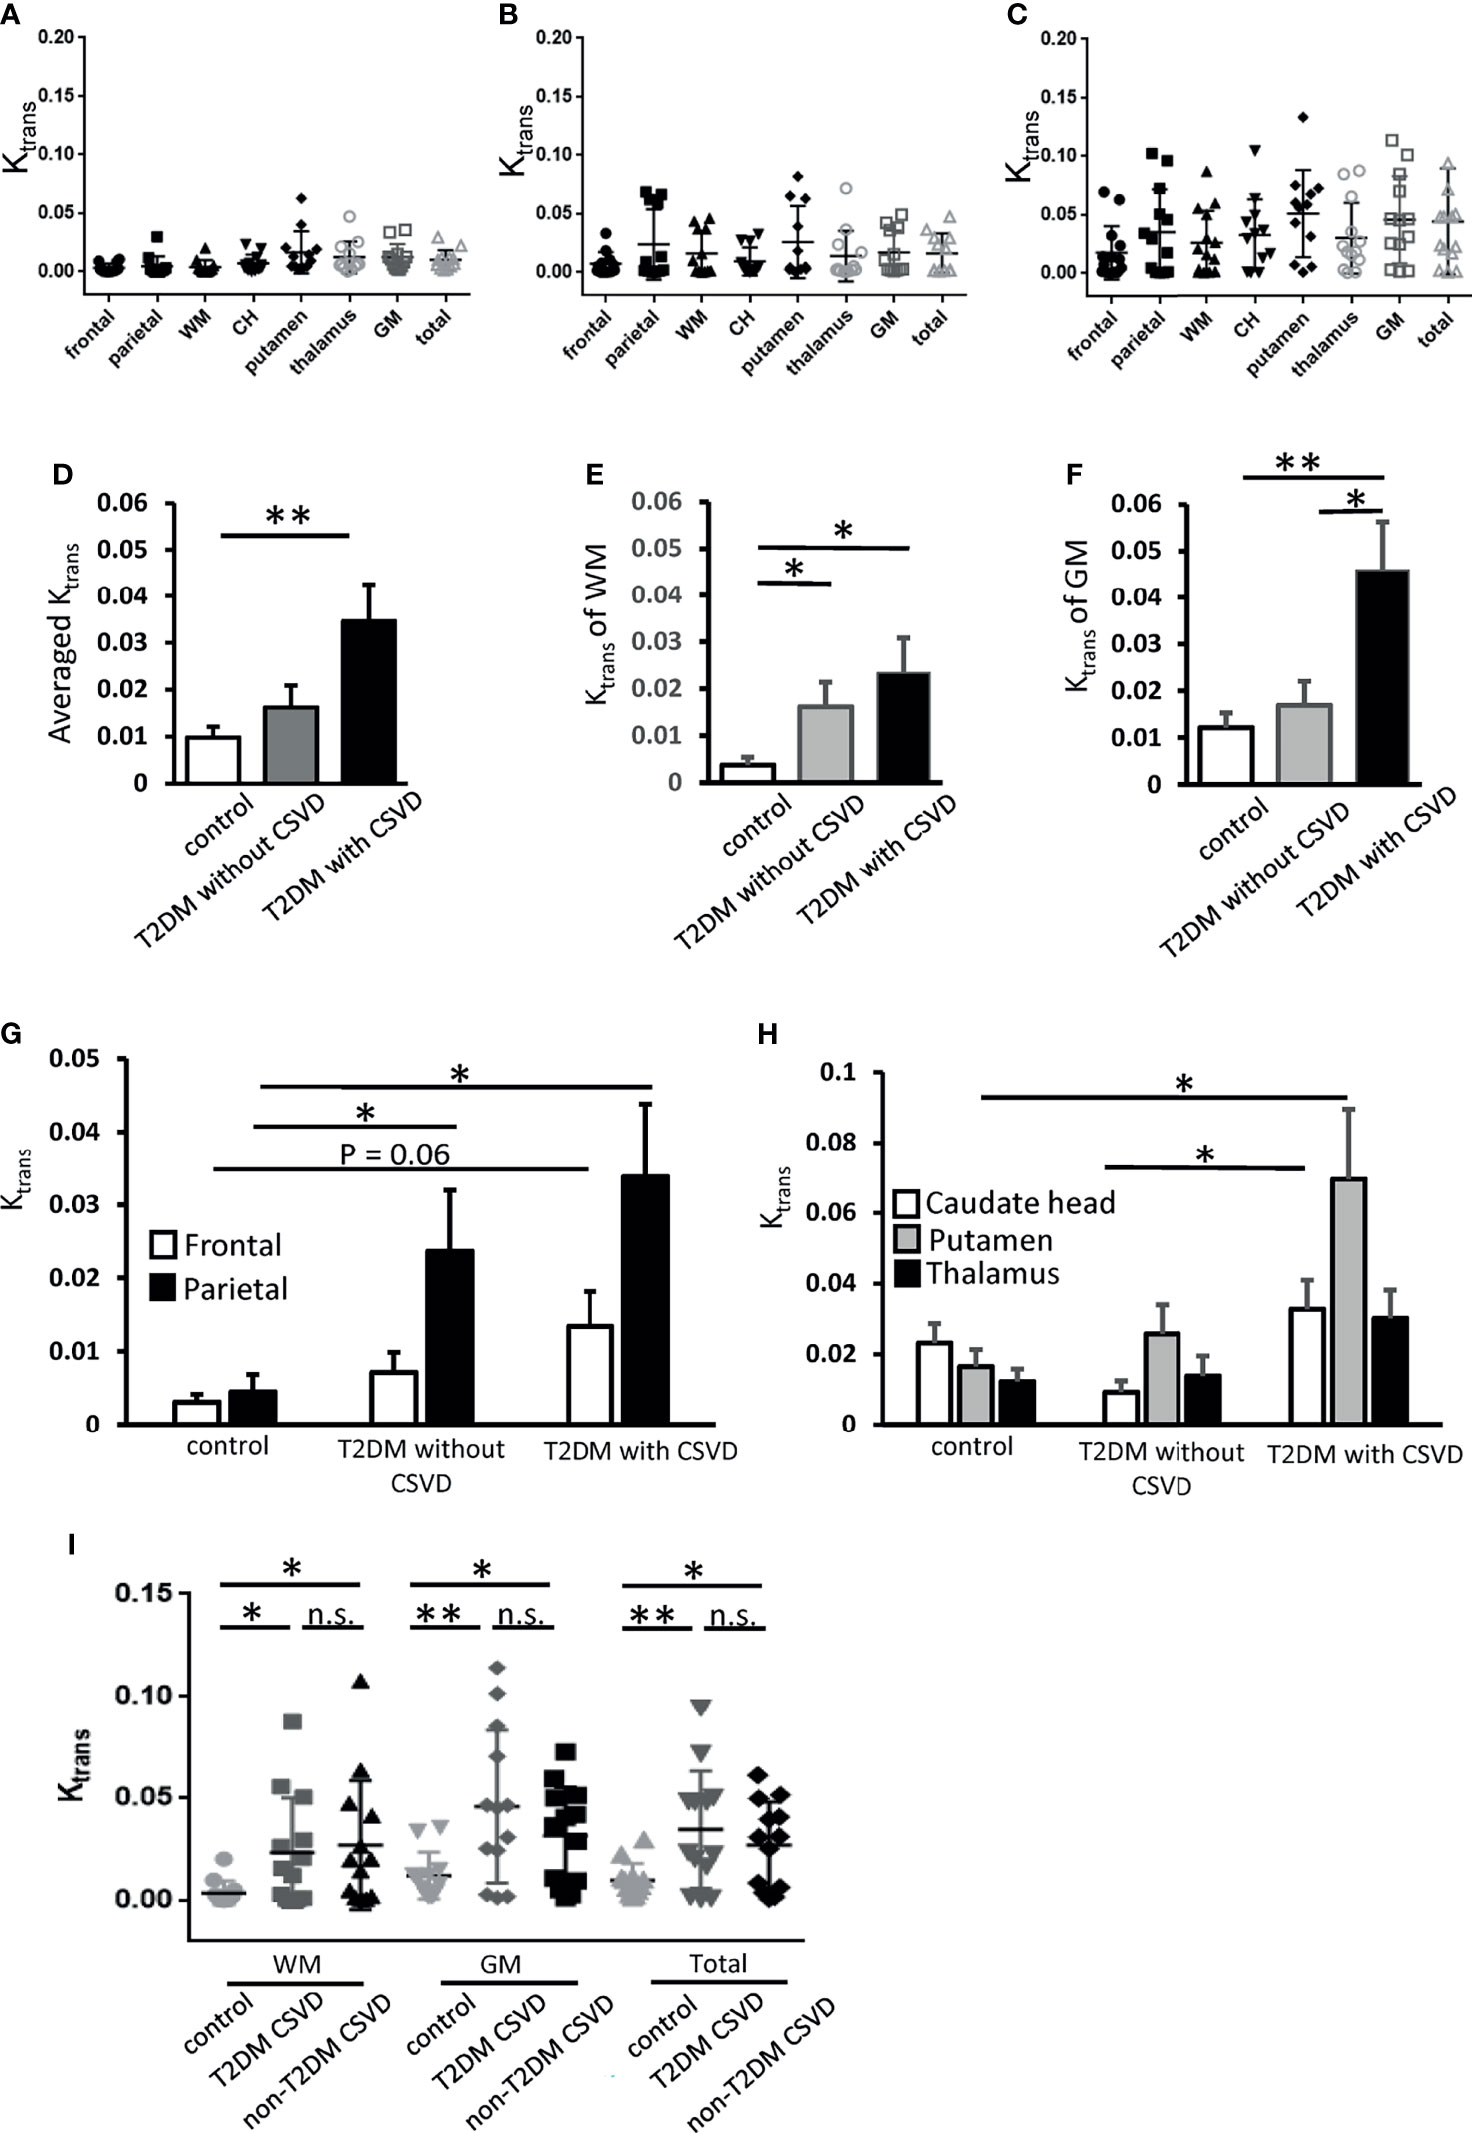
Figure 3 Ktrans of each cerebral area in the control, T2DM, and T2DM with CSVD groups. (A–C) Ktrans of each area in the control (N = 12) (A), T2DM without CSVD (N = 12) (B), and T2DM with CSVD groups (N = 13) (C). (D–F) Comparisons of the averaged total Ktrans (D), Ktrans of the WM (E), and Ktrans of the GM (F) among control, T2DM without CSVD, and T2DM with CSVD groups. (G, H) Comparisons of Ktrans in the frontal and parietal WM (G) and Ktrans in the caudate head (CH), putamen, and thalamus (H) between control, T2DM without CSVD, and T2DM with CSVD groups. (I) Comparisons of Ktrans in the WM, GM, and total Ktrans between the control group, CSVD patients with T2DM, and CSVD patients without T2DM. Unpaired t-test. NS, no significance; *p < 0.05; **p < 0.01. WM, white matter; GM, gray matter; CH, caudate head; T2DM, type 2 diabetes mellitus; CSVD, cerebral small vessel disease.
Spatial Dynamics: Ktrans of WM Was Increased in All Patients With T2DM, Whereas Ktrans of GM Was Increased Only in Patients With T2DM and CSVD
To examine the spatial dynamics of Ktrans in T2DM, the Ktrans values of WM and GM were analyzed separately. The Ktrans of the WM was increased in all patients with T2DM, irrespective of the absence or presence of CSVD (p = 0.04 and 0.02, respectively, Student’s t-test, Figure 3E). The Ktrans of the GM was only increased in the T2DM with CSVD group that had an advanced diabetes status (p = 0.006, Student’s t-test, Figure 3F). In addition, among all patients with T2DM, the Ktrans of the GM was higher in the T2DM with CSVD group than in the T2DM without CSVD group (p = 0.023, Student’s t-test, Figure 3F).
Regarding the WM, parietal region showed an increase in Ktrans in all patients with T2DM (T2DM without CSVD vs. control, p = 0.04; T2DM with CSVD vs. control, p = 0.016; Student’s t-test, Figure 3G), whereas frontal WM only showed a marginal statistical significance (p = 0.06, Student’s t-test, Figure 3G). Regarding the GM, the Ktrans of the putamen and CH were higher in the T2DM with CSVD group (T2DM with CSVD vs. control, p = 0.027; T2DM with CSVD vs. T2DM without CSVD, p = 0.021, Student’s t-test, Figure 3H). In summary, in the T2DM group, the increased Ktrans of the WM was most prominent in the parietal area, and the increased Ktrans of the GM was mainly found in the CH and putamen.
Ktrans Was Not Correlated With the HbA1c Level
The HbA1c level, an averaged status of recent glycemic control, in patients who underwent DCE-MRI was not correlated with the Ktrans of the WM or GM (r2 = 0.0157 and 0.0176, respectively, Pearson’s correlation). Even analyzing T2DM without CSVD and T2DM with CSVD groups separately, the correlation between the HbA1c level and Ktrans was not observed. We further divided patients with T2DM according to their recent glycemic control into two groups, HbA1c < 8 and HbA1c ≥ 8. The Ktrans of the WM or GM did not significantly differ between the two groups (p = 0.235 and 0.173, respectively, Student’s t-test).
High CSVD Score Correlated With the Increased Ktrans in All Patients With CSVD
We further clarify whether the increase in Ktrans generally presents in all CSVDs or is a specific feature for T2DM-related CSVD. Nondiabetic patients with CSVD were enrolled (n = 13 [7 men and six women], aged 74.9 ± 11 years). Their sex, age, the prevalence of hypertension or dementia, the stage of CKD, the total CSVD score, the scores of individual CSVD items, and the Ktrans values of the five ROIs did not differ from the T2DM patients with CSVD (Table 2). In both T2DM CSVD and non-diabetes CSVD groups, their Ktrans of WM, GM, and total Ktrans were higher than the control group (Figure 3I), suggesting the increase in Ktrans present in all CSVDs.
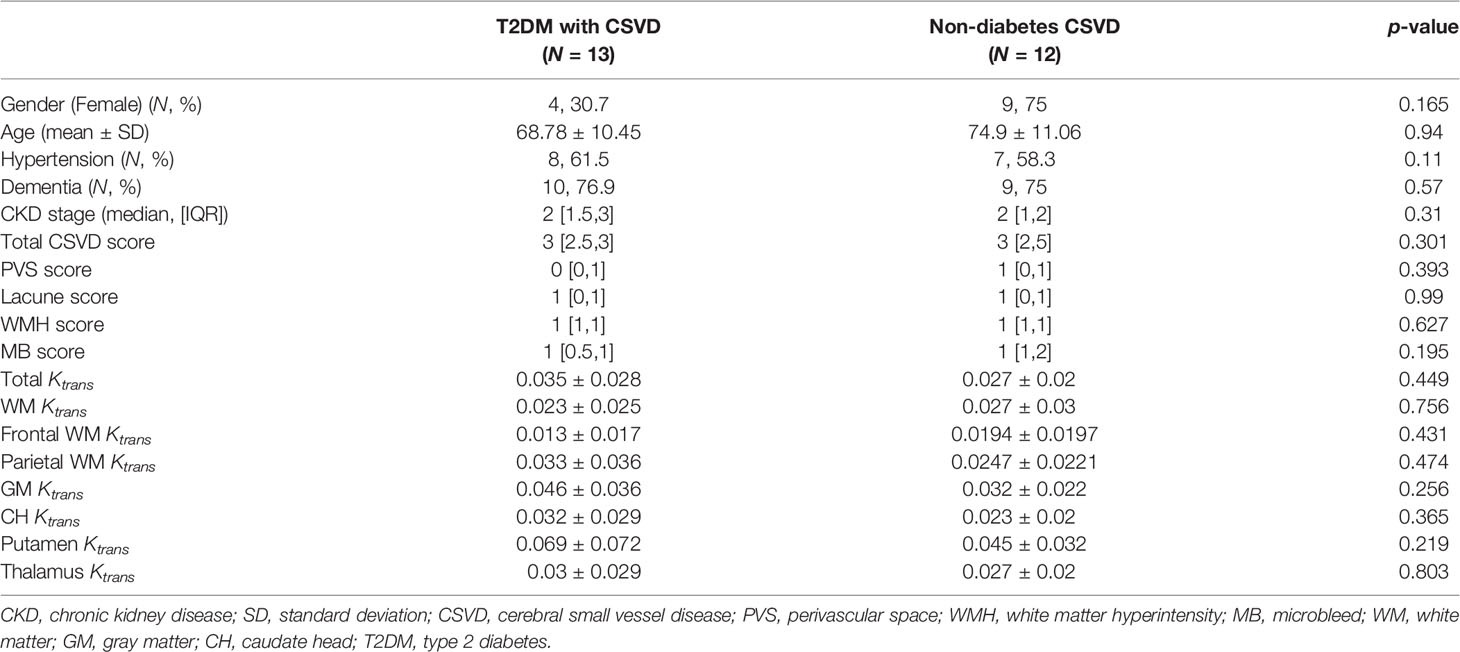
Table 2 Comparisons of demographic data between patients with CSVD with and without T2DM.
The Increased Ktrans in T2DM and Non-T2DM CSVD Correlated With Distinct CSVD Items
Because the DCE-MRI protocol is time-consuming, it may not be routinely used in conventional medical practice. In addition, DCE-MRI is highly dependent on patients’ cooperation and is challenging to perform in patients with moderate to severe dementia. To improve the accessibility and applicability of the estimation of BBB permeability, we utilized the individual items of MRI CSVD scores, which are more generally available, to indicate the increase in Ktrans.
Initially, in recruiting subjects, CSVD was defined as MRI CSVD score >1. Any of the 4 CSVD items can contribute a positive score. However, the correlation between an individual item and Ktrans was low and varied (Kendall’s tau between total Ktrans and lacune numbers, total Ktrans and PVS numbers, 0.218 and −0.22, respectively). Thus, we tried to find better combinations of each MRI CSVD item with different thresholds to indicate Ktrans.
For patients with T2DM, all of them were reclassified according to the various cutoff points of each CSVD item. For instance, patients with T2DM were reclassified into two groups, according to WMH < 1 and WMH ≥ 1. Subsequently, the Ktrans values of the newly generated two groups were compared. For the four CSVD items, WMH values were assigned four grades (WMH = 0, 1, 2, or 3). The PVS ranged from 0 to >20, microbleeds ranged from 0 to >15, and lacunes ranged from 0 to 5. The combinations of the aforementioned items with various cutoff values generated 4,500 classification criteria, including the criterion of a single item and the criteria of ≥2 combined items. Among 4,500 criteria, any one generated two groups with extremely uneven sample sizes (n < 8 in one group) was discarded. Finally, 76 classification criteria remained. After dividing patients with T2DM using any of the 76 criteria, and comparing the Ktrans of the five ROIs between two groups, finally only six criteria generated two groups of statistically different Ktrans.
Among the four MRI features of CSVD, the presence of microbleeds was the most sensitive indicator for a significantly increased Ktrans in multiple brain regions, including the CH, putamen, and parietal WM (Table 3). The addition of other CSVD items to the microbleeds, including PVS ≥ 2 and WMH ≥ 2, did not change the statistical result. In patients with no microbleeds on MRI, WMH ≥ 2 alone showed marginal significance in suggesting an increased Ktrans in the putamen and parietal WM (p = 0.065 and p = 0.055, respectively). The presence of the PVS or lacune alone did not indicate an increased Ktrans in patients with T2DM.
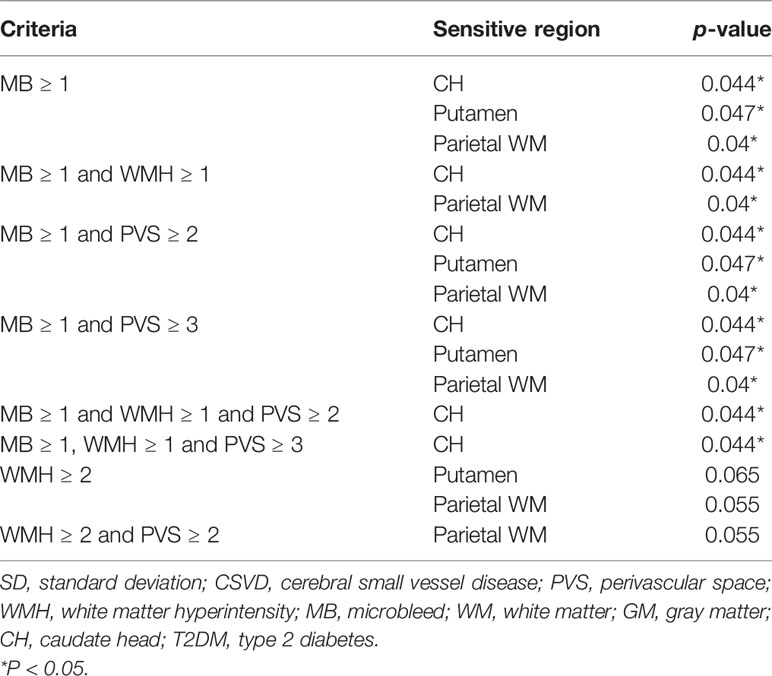
Table 3 Statistical power of various combinations of CSVD items in determining Ktransamong patients with T2DM.
Ktrans Correlated With Distinct CSVD Features in Patients Without T2DM
To test the hypothesis that T2DM-related CSVD may have distinct pathophysiology from non-diabetes CSVD, the aforementioned methods were also applied to patients without diabetes. Similar to T2DM patients, the presence of microbleeds suggested an increase in Ktrans in non-T2DM patients with CSVD (Table 4). In contrast to the T2DM group, the presence of lacune alone or multiple PVSs (≥6) alone indicated an increase in Ktrans in non-T2DM patients with CSVD. Although moderate WMH (≥2) showed marginal significance in indicating Ktrans in the T2DM group, it was not an indicator in the non-diabetes group.
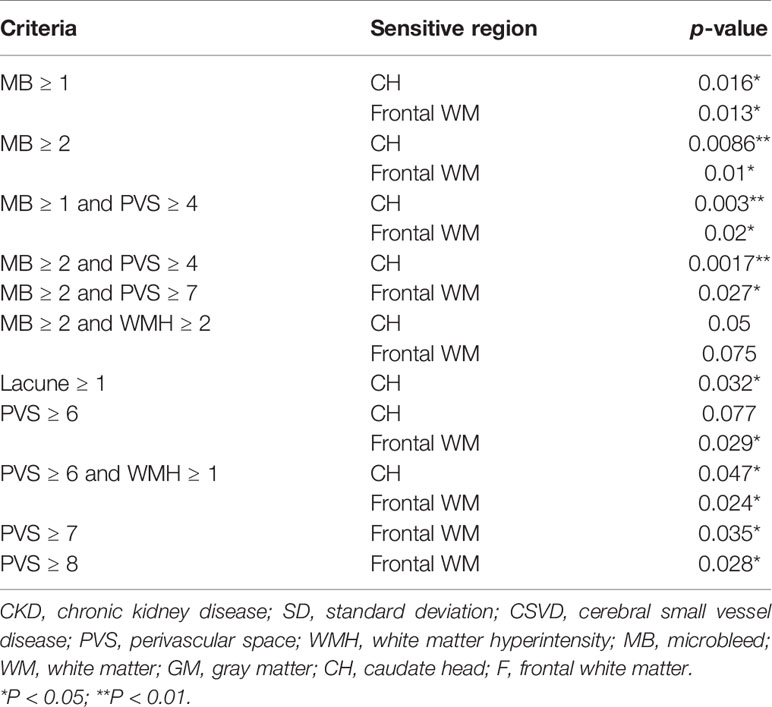
Table 4 Statistical power of various combinations of CSVD items in determining the Ktrans in nondiabetes group.
Discussion
This study demonstrated the early presence of cerebral microangiopathy in T2DM, with distinct mechanisms from other CSVD. The following evidence supported this conclusion: First, the increased Ktrans in WM was prior to the presence of visible CSVD features on MRI. Second, the increased Ktrans in GM developed in advanced T2DM. Third, the increased Ktrans was more associated with the long-lasting progress of T2DM, less with the recent glycemic control. Fourth, among the four CSVD features on MRI, the presence of microbleeds indicated the increased Ktrans in all CSVDs. Fifth, the presence of lacunae or PVS alone was not a good indicator for the increased Ktrans in T2DM-related CSVD but can be suitable for non-T2DM CSVDs. The differential correlations between Ktrans and each CSVD item of MRI suggested the distinct pathophysiology between T2DM-related CSVD and other CSVDs and supported the high heterogeneity in all CSVDs.
The heterogeneity of CSVD and the dysfunction of BBB were also reported by Zhang et al. Although CSVD is a widespread dysfunction of BBB, the various leakage rates between patients with lacunar stroke and patients with mild vascular cognitive impairment suggested that different pathophysiology exists (24). In their cohort, patients with T2DM accounted for 16% of subjects. Since diabetes-related CSVD is a manifestation of microangiopathy involving the brain (4), this study particularly focused on the effect of T2DM on cerebral permeability. The results also suggested that distinct pathophysiology from other CSVDs exists after eliminating the effects of aging on the breakdown of BBB.
Aging affects BBB integrity in animals (25) and the human brain, particularly in the hippocampus (26). An increase of soluble pericyte marker in the cerebrospinal fluid was found parallel to the BBB leakage, suggesting the critical role of pericyte in maintaining BBB integrity (26). In T2DM, loss of pericyte is an early manifestation of diabetic retinopathy (27). In addition, the normal cellular function of the cerebral pericyte was impaired by T2DM (28). These phenomena possibly resulted in T2DM having an additional negative effect on the maintenance of BBB integrity beyond aging.
In the aspect of T2DM, our results supported the notion that the brain might be involved concurrently with other target organs, as early as the retina and kidneys (4, 29–31). A microvascular leakage in the brain might be similar to the extravasation of the retinal vessels. These target organ damages may share similar mechanisms, by which reactive oxygen species, dysregulation of vascular endothelial growth factor, and other growth factors lead to endothelial dysfunction and subsequently result in damages of filtration barrier and sclerosis (32–34). Increased BBB permeability enables toxic molecules to enter the brain parenchyma, thus initiating multiple pathways of neurodegeneration (35). Subsequently, cognitive decline can develop. In our subjects, a higher prevalence of dementia was found in the T2DM with CSVD group than in the non-CSVD group, supporting the epidemiological observation of the increased risk of cognitive decline in the progression of diabetes (6, 36).
Although the dysfunction of BBB is of generalized nature (24), spatial differences exist. In patients with T2DM, the dysfunction of the BBB in the GM occurred later than that in the WM. This finding is compatible with evolutionary biology concepts: the deep GM that governs instinctive behaviors is usually more protected and less vulnerable to injuries than the WM. In our study, although the three ROIs present in the deep GM had distinct blood supply, all showed similar temporal trends of permeability in patients with advanced T2DM. However, the two ROIs in the WM, namely the frontal and parietal WM, had varying degrees of BBB dysfunction. The parietal WM was affected more than the frontal WM. Although differences in vascular autonomic innervation and myogenic responses between anterior and posterior cerebral circulation have been reported (37–39), additional studies were required to confirm the primary mechanism.
The design of this study was based on the assumption that the presence of CSVD features on MRI represented a more advanced T2DM than no CSVD features on MRI (23). Although we have set the inclusion criteria as an existing T2DM diagnosis on medical records for at least 5 years, the exact duration of T2DM was hard to clarify in real-world clinical practice. Some parameters can be used to support the chronicity of the group of DM with CSVD, such as higher stages of CKD and higher prevalence of dementia (Table 1).
Although all CSVDs shared similar features on conventional MRI, DCE-MRI enabled us to visualize early differences in functions between various subtypes of CSVDs. However, the DCE-MRI protocol was time-consuming and highly dependent on patient cooperation. Any motion artifact compromised the accuracy of measurements. Sedative drugs were not used in this study, considering the uncertainty of their effects on BBB permeability. Therefore, patients with moderate to severe dementia were not examined. In addition, patients with advanced CKD, which represented a more advanced diabetes status, were excluded from the DCE-MRI examination considering the risk of gadolinium nephrotoxicity. These limited the generality of the results.
In brain images with too many lacunae or PVSs, the estimation of the parenchymal intensity was difficult because no homogeneous ROI without any fluid space could be observed. Thus, these patients were excluded from our analysis. To overcome the limitations above and broaden the applicability of cerebral permeability using current commonly available methods for patients who cannot undergo DCE-MRI, CSVD items of conventional MRI may help physicians assess the BBB integrity.
In conclusion, this study demonstrated that the increase of cerebral permeability occurred before the image features of CSVD could be visualized on conventional MRI. The increased permeability was associated with long-lasting disease course rather than recent glycemic control. When DCE-MRI is not available, the commonly applicable CSVD features on conventional MRI, such as microbleeds and moderate WMH, can indicate the increased permeability. Cerebral vascular permeability in T2DM and non-T2DM patients with CSVD correlated with different CSVD items, suggesting distinct pathogenesis for diabetic cerebral microangiopathy.
Data Availability Statement
The raw data supporting the conclusions of this article will be made available by the authors, without undue reservation.
Ethics Statement
The studies involving human participants were reviewed and approved by IRB in National Cheng Kung University Hospital. The patients/participants provided their written informed consent to participate in this study.
Author Contributions
Design and conceptualization of the study: Y-TS and Y-CC. Acquisition and analysis of the data: Y-CC and B-ZL. Recruitment of the subjects: Y-TS. Interpretation of the data: Y-CC and Y-TS. Drafting and revising the manuscript: Y-CC, B-ZL, and Y-TS. Visual analysis of the MR images: Y-CC and Y-TS. Processing the MR images and analysis of the data: Y-CC, B-ZL, and Y-CS. All authors contributed to the article and approved the submitted version.
Funding
The Ministry of Science and Technology, Taiwan (MOST 109-2635-B-006-003 and MOST 109-2115-M-006-018-MY2) and National Cheng Kung University Hospital (NCKUH-11004035) supported this study.
Conflict of Interest
The authors declare that the research was conducted in the absence of any commercial or financial relationships that could be construed as a potential conflict of interest.
Publisher’s Note
All claims expressed in this article are solely those of the authors and do not necessarily represent those of their affiliated organizations, or those of the publisher, the editors and the reviewers. Any product that may be evaluated in this article, or claim that may be made by its manufacturer, is not guaranteed or endorsed by the publisher.
Acknowledgments
We thank Dr. Shih-Kai Chu in the Clinical Medicine Research Center, National Cheng Kung University Hospital, for statistics support. We also acknowledge Science College of National Cheng Kung University (NCKU Science) and Ministry of Science and Technology, Taiwan for a fellowship to support BZL’s PhD study.
Abbreviations
CSVD, Cerebral small vessel disease; BBB, blood–brain barrier; T2DM, type 2 diabetes mellitus; DCE-MRI, dynamic contrast-enhanced MRI; IRB, Institutional Review Board; CKD, chronic kidney disease; T1WI, T1-weighted images; FLAIR, fluid-attenuated inversion recovery; T1-FFE, T1-weighted fast-field echo; Gd-DOTA, gadoterate meglumine; WM, white matter; GM, gray matter; ROI, regions of interest; CH, caudate head; PVS, perivascular space; WMH, white matter hyperintensity.
References
1. Ihara M, Yamamoto Y. Emerging Evidence for Pathogenesis of Sporadic Cerebral Small Vessel Disease. Stroke (2016) 47:554–60. doi: 10.1161/STROKEAHA.115.009627
2. Manschot SM, Brands AM, van der Grond J, Kessels RP, Algra A, Kappelle LJ, et al. Brain Magnetic Resonance Imaging Correlates of Impaired Cognition in Patients With Type 2 Diabetes. Diabetes (2006) 55:1106–13. doi: 10.2337/diabetes.55.04.06.db05-1323
3. Funnell C, Doyle-Waters MM, Yip S, Field T. What is the Relationship Between Type 2 Diabetes Mellitus Status and the Neuroradiological Correlates of Cerebral Small Vessel Disease in Adults? Protocol for a Systematic Review. Syst Rev (2017) 6:7. doi: 10.1186/s13643-017-0410-1
4. Umemura T, Kawamura T, Hotta N. Pathogenesis and Neuroimaging of Cerebral Large and Small Vessel Disease in Type 2 Diabetes: A Possible Link Between Cerebral and Retinal Microvascular Abnormalities. J Diabetes Investig (2017) 8:134–48. doi: 10.1111/jdi.12545
5. Chen R, Ovbiagele B, Feng W. Diabetes and Stroke: Epidemiology, Pathophysiology, Pharmaceuticals and Outcomes. Am J Med Sci (2016) 351:380–6. doi: 10.1016/j.amjms.2016.01.011
6. Biessels GJ, Despa F. Cognitive Decline and Dementia in Diabetes Mellitus: Mechanisms and Clinical Implications. Nat Rev Endocrinol (2018) 14:591–604. doi: 10.1038/s41574-018-0048-7
7. Guariguata L, Whiting DR, Hambleton I, Beagley J, Linnenkamp U, Shaw JE. Global Estimates of Diabetes Prevalence for 2013 and Projections for 2035. Diabetes Res Clin Pract (2014) 103:137–49. doi: 10.1016/j.diabres.2013.11.002
8. Raja R, Rosenberg GA, Caprihan A. MRI Measurements of Blood-Brain Barrier Function in Dementia: A Review of Recent Studies. Neuropharmacology (2018) 134:259–71. doi: 10.1016/j.neuropharm.2017.10.034
9. Sanahuja J, Alonso N, Diez J, Ortega E, Rubinat E, Traveset A, et al. Increased Burden of Cerebral Small Vessel Disease in Patients With Type 2 Diabetes and Retinopathy. Diabetes Care (2016) 39:1614–20. doi: 10.2337/dc15-2671
10. Starr JM, Wardlaw J, Ferguson K, MacLullich A, Deary IJ, Marshall I. Increased Blood-Brain Barrier Permeability in Type II Diabetes Demonstrated by Gadolinium Magnetic Resonance Imaging. J Neurol Neurosurg Psychiatry (2003) 74:70–6. doi: 10.1136/jnnp.74.1.70
11. Bergamino M, Bonzano L, Levrero F, Mancardi GL, Roccatagliata L. A Review of Technical Aspects of T1-Weighted Dynamic Contrast-Enhanced Magnetic Resonance Imaging (DCE-MRI) in Human Brain Tumors. Phys Med (2014) 30:635–43. doi: 10.1016/j.ejmp.2014.04.005
12. American Diabetes A. 2. Classification and Diagnosis of Diabetes: Standards of Medical Care in Diabetes-2020. Diabetes Care (2020) 43:S14–31. doi: 10.2337/dc20-S002
13. American Diabetes A. 2. Classification and Diagnosis of Diabetes: Standards of Medical Care in Diabetes-2019. Diabetes Care (2019) 42:S13–28. doi: 10.2337/dc19-S002
14. American Diabetes A. 2. Classification and Diagnosis of Diabetes: Standards of Medical Care in Diabetes-2018. Diabetes Care (2018) 41:S13–27. doi: 10.2337/dc18-S002
15. Levey AS, Coresh J, Balk E, Kausz AT, Levin A, Steffes MW, et al. National Kidney Foundation Practice Guidelines for Chronic Kidney Disease: Evaluation, Classification, and Stratification. Ann Internal Med (2003) 139:137–47. doi: 10.7326/0003-4819-139-2-200307150-00013
16. Tomson CRV, Cheung AK, Mann JFE, Chang TI, Cushman WC, Furth SL, et al. Management of Blood Pressure in Patients With Chronic Kidney Disease Not Receiving Dialysis: Synopsis of the 2021 KDIGO Clinical Practice Guideline. Ann Internal Med (2021) 174(2021):1270–81. doi: 10.7326/M21-0834
17. Staals J, Makin SD, Doubal FN, Dennis MS, Wardlaw JM. Stroke Subtype, Vascular Risk Factors, and Total MRI Brain Small-Vessel Disease Burden. Neurology (2014) 83:1228–34. doi: 10.1212/WNL.0000000000000837
18. Heye AK, Thrippleton MJ, Armitage PA, Valdes MDC, Hernandez SD, Makin A, et al. Tracer Kinetic Modelling for DCE-MRI Quantification of Subtle Blood-Brain Barrier Permeability. Neuroimage (2016) 125:446–55. doi: 10.1016/j.neuroimage.2015.10.018
19. van de Haar HJ, Burgmans S, Jansen JF, van Osch MJ, van Buchem MA, Muller M, et al. Blood-Brain Barrier Leakage in Patients With Early Alzheimer Disease. Radiology (2016) 281:527–35. doi: 10.1148/radiol.2016152244
20. Lau KK, Li L, Schulz U, Simoni KH, Chan SL, Ho RTF, et al. Total Small Vessel Disease Score and Risk of Recurrent Stroke: Validation in 2 Large Cohorts. Neurology (2017) 88:2260–7. doi: 10.1212/WNL.0000000000004042
21. Wardlaw JM, Smith C, Dichgans M. Small Vessel Disease: Mechanisms and Clinical Implications. Lancet Neurol (2019) 18:684–96. doi: 10.1016/S1474-4422(19)30079-1
22. Coolen T, Lolli V, Sadeghi N, Rovai A, Trotta N, Taccone FS, et al. Early Postmortem Brain MRI Findings in COVID-19 Non-Survivors. Neurology (2020) 95:e2016–27. doi: 10.1212/WNL.0000000000010116
23. Del Bene A, Ciolli L, Borgheresi L, Poggesi A, Inzitari D, Pantoni L. Is Type 2 Diabetes Related to Leukoaraiosis? An Updated Review. Acta Neurol Scand (2015) 132:147–55. doi: 10.1111/ane.12398
24. Zhang CE, Wong SM, van de Haar HJ, Staals J, Jansen JF, Jeukens CR, et al. Blood-Brain Barrier Leakage Is More Widespread in Patients With Cerebral Small Vessel Disease. Neurology (2017) 88:426–32. doi: 10.1212/WNL.0000000000003556
25. Bake S, Sohrabji F. 17beta-Estradiol Differentially Regulates Blood-Brain Barrier Permeability in Young and Aging Female Rats. Endocrinology (2004) 145:5471–5. doi: 10.1210/en.2004-0984
26. Montagne A, Barnes SR, Sweeney MD, Halliday MR, Sagare AP, Zhao Z, et al. Blood-Brain Barrier Breakdown in the Aging Human Hippocampus. Neuron (2015) 85:296–302. doi: 10.1016/j.neuron.2014.12.032
27. Rajendran S, Seetharaman S, Dharmarajan A, Kuppan K. Microvascular Cells: A Special Focus on Heterogeneity of Pericytes in Diabetes Associated Complications. Int J Biochem Cell Biol (2021) 134:105971. doi: 10.1016/j.biocel.2021.105971
28. Wang HK, Huang CY, Chen YW, Sun YT. Hyperglycemia Compromises the Ischemia-Provoked Dedifferentiation of Cerebral Pericytes Through P21-SOX2 Signaling in High-Fat Diet-Induced Murine Model. Diabetes Vasc Dis Res (2021) 18:1479164121990641. doi: 10.1177/1479164121990641
29. Lizarraga KJ, Chunga N, Yannuzzi NA, Flynn HW Jr., Singer C, Lang AE. The Retina as a Window to the Basal Ganglia: Systematic Review of the Potential Link Between Retinopathy and Hyperkinetic Disorders in Diabetes. Parkinsonism Relat Disord (2020) 80:194–8. doi: 10.1016/j.parkreldis.2020.10.025
30. Umemura T, Kawamura T. Retinopathy: A Sign of Cerebral Small Vessel Disease in Diabetes? J Diabetes Investig (2017) 8:428–30. doi: 10.1111/jdi.12602
31. Li J, Pan J, Li B, Tian H, Zhu Y, Liao Z, et al. Positive Correlation Between Cognitive Impairment and Renal Microangiopathy in Patients With Type 2 Diabetic Nephropathy: A Multicenter Retrospective Study. J Int Med Res (2018) 46:5040–51. doi: 10.1177/0300060518789299
32. Haj Najeeb B, Simader C, Deak G, Deak C, Vass J, Gamper A, et al. The Distribution of Leakage on Fluorescein Angiography in Diabetic Macular Edema: A New Approach to Its Etiology. Invest Ophthalmol Visual Sci (2017) 58:3986–90. doi: 10.1167/iovs.17-21510
33. Satchell SC, Tooke JE. What is the Mechanism of Microalbuminuria in Diabetes: A Role for the Glomerular Endothelium? Diabetologia (2008) 51:714–25. doi: 10.1007/s00125-008-0961-8
34. Campos A, Campos EJ, Martins J, Ambrosio AF, Silva R. Viewing the Choroid: Where We Stand, Challenges and Contradictions in Diabetic Retinopathy and Diabetic Macular Oedema. Acta Ophthalmol (2017) 95:446–59. doi: 10.1111/aos.13210
35. Sweeney MD, Sagare AP, Zlokovic BV. Blood-Brain Barrier Breakdown in Alzheimer Disease and Other Neurodegenerative Disorders. Nat Rev Neurol (2018) 14:133–50. doi: 10.1038/nrneurol.2017.188
36. Biessels GJ, Staekenborg S, Brunner E, Brayne C, Scheltens P. Risk of Dementia in Diabetes Mellitus: A Systematic Review. Lancet Neurol (2006) 5:64–74. doi: 10.1016/S1474-4422(05)70284-2
37. Roloff EV, Tomiak-Baquero AM, Kasparov S, Paton JF. Parasympathetic Innervation of Vertebrobasilar Arteries: Is This a Potential Clinical Target? J Physiol (2016) 594:6463–85. doi: 10.1113/JP272450
38. Roloff EVL, Walas D, Moraes DJA, Kasparov S, Paton JFR. Differences in Autonomic Innervation to the Vertebrobasilar Arteries in Spontaneously Hypertensive and Wistar Rats. J Physiol (2018) 596:3505–29. doi: 10.1113/JP275973
Keywords: diabetes mellitus, blood–brain barrier, cerebral small vessel disease, permeability, microangiopathy
Citation: Chen Y-C, Lu B-Z, Shu Y-C and Sun Y-T (2022) Spatiotemporal Dynamics of Cerebral Vascular Permeability in Type 2 Diabetes-Related Cerebral Microangiopathy. Front. Endocrinol. 12:805637. doi: 10.3389/fendo.2021.805637
Received: 30 October 2021; Accepted: 13 December 2021;
Published: 11 January 2022.
Edited by:
Vinod Tiwari, Indian Institute of Technology (BHU), IndiaReviewed by:
Rodrigo Azevedo Loiola, Université d’Artois, FranceYao-Wu Liu, Xuzhou Medical University, China
Copyright © 2022 Chen, Lu, Shu and Sun. This is an open-access article distributed under the terms of the Creative Commons Attribution License (CC BY). The use, distribution or reproduction in other forums is permitted, provided the original author(s) and the copyright owner(s) are credited and that the original publication in this journal is cited, in accordance with accepted academic practice. No use, distribution or reproduction is permitted which does not comply with these terms.
*Correspondence: Yuan-Ting Sun, eXRzdW5AbWFpbC5uY2t1LmVkdS50dw==