 Inés Amich1†
 Eduardo Anguita2,3†
 Silvia Escribano-Serrat2Cristina Alvarez4
 Diego Rodríguez-Muñoz5Verónica García6Rocío Bello6José Alberto Peña-Pedrosa6
 Neus Martínez-Micaelo7
 Nuria Amigó7,8Pablo Ortiz5
 María José Torrejón4
 Lisardo Boscá5,9Javier Martín-Sánchez3,10
 Ana Aranda11,12*
 Susana Alemany5*
- 1Department of Emergency, Hospital Príncipe de Asturias, Alcalá de Henares, Madrid, Spain
- 2Department of Hematology, Hospital Clínico San Carlos, Instituto de Medicina de Laboratorio (IML), Instituto de Investigación Sanitaria San Carlos (IdISSC), Madrid, Spain
- 3Department of Medicine, Universidad Complutense de Madrid (UCM), Madrid, Spain
- 4Clinical Analysis Laboratory, IML, IdISSC, Hospital Clínico San Carlos, Madrid, Spain
- 5Department of Metabolism and Cell Signaling, Instituto de Investigaciones Biomédicas “Alberto Sols”, CSIC-UAM, Madrid, Spain
- 6Hospital Pharmacy, IdISSC, Hospital Clínico San Carlos, Madrid, Spain
- 7Biosfer Teslab, Department of Basic Medical Sciences, Institut d'Investigació Sanitària Pere Virgili (IISPV), Reus, Spain
- 8Centro de Investigación Biomédicas en Red de Diabetes y Enfermedades Metabólicas Asociadas (CIBERDEM), Instituto de Salud Carlos III (ISCIII), Madrid, Spain
- 9Centro de Investigación Biomédicas en enfermedades Cardiovasculares (CIBERCV), Instituto de Salud Carlos III (ISCIII), Madrid, Spain
- 10Department of Emergency, IdISSC, Hospital Clínico San Carlos, Madrid, Spain
- 11Department of Endocrine and Nervous System Pathophysiology, Instituto de Investigaciones Biomédicas “Alberto Sols”, CSIC-UAM, Centro de Investigación Biomédicas en Red de Cáncer (CIBERONC), Madrid, Spain
- 12Centro de Investigación Biomédicas de Cáncer (CIBERONC), Instituto de Salud Carlos III (ISCIII), Madrid, Spain
Metabolic reprogramming is required to fight infections and thyroid hormones are key regulators of metabolism. We have analyzed in hospitalized COVID-19 patients: 40 euthyroid and 39 levothyroxine (LT4)-treated patients in the ward and 29 euthyroid and 9 LT4-treated patients in the intensive care unit (ICU), the baseline characteristics, laboratory data, thyroid-stimulating hormone (TSH), free thyroxine (FT4), free triiodothyronine (FT3), the FT3/FT4 ratio, 11 antiviral cytokines and 74 metabolomic parameters. No evidence for significant differences between euthyroid and LT4-treated patients were found in the biochemical, metabolomic and cytokines parameters analyzed. Only TSH (p=0.009) and ferritin (p=0.031) showed significant differences between euthyroid and LT4-treated patients in the ward, and TSH (p=0.044) and FT4 (p=0.012) in the ICU. Accordingly, severity and mortality were similar in euthyroid and LT4-treated patients. On the other hand, FT3 was negatively related to age (p=0.012), independently of sex and body mass index in hospitalized COVID-19 patients. Patients with low FT3 and older age showed a worse prognosis and higher levels of the COVID-19 severity markers IL-6 and IL-10 than patients with high FT3. IL-6 negatively correlated with FT3 (p=0.023) independently of age, body mass index and sex, whereas IL-10 positively associated with age (p=0.035) independently of FT3, body mass index and sex. A metabolomic cluster of 6 parameters defined low FT3 ward patients. Two parameters, esterified cholesterol (p=4.1x10⁻⁴) and small HDL particles (p=6.0x10⁻⁵) correlated with FT3 independently of age, body mass index and sex, whereas 3-hydroxybutyrate (p=0.010), acetone (p=0.076), creatinine (p=0.017) and high-density-lipoprotein (HDL) diameter (p=8.3x10⁻³) were associated to FT3 and also to age, with p-values of 0.030, 0.026, 0.017 and 8.3x10⁻³, respectively. In conclusion, no significant differences in FT3, cytokines, and metabolomic profile, or in severity and outcome of COVID-19, were found during hospitalization between euthyroid patients and hypothyroid patients treated with LT4. In addition, FT3 and age negatively correlate in COVID-19 patients and parameters that predict poor prognosis were associated with low FT3, and/or with age. A metabolomic cluster indicative of a high ketogenic profile defines non-critical hospitalized patients with low FT3 levels.
Introduction
The coronavirus disease (COVID-19) caused by the Severe Acute Respiratory Syndrome type 2 (SARS-CoV-2) was first described in December 2019 in Wuhan, China, and rapidly spread worldwide (1, 2). In severe cases, SARS-CoV-2 causes bilateral pneumonia that progresses to acute respiratory distress syndrome and eventually death (2). Male sex and age, including its underlying comorbidities such as hypertension, diabetes mellitus, vascular, kidney and respiratory diseases, immunosuppressive conditions and cancer, have been described as bad prognostic factors (2, 3). Neutrophil-to-lymphocyte ratio, lactate dehydrogenase (LDH), D-dimer, C-reactive protein, creatinine, hemoglobin, aspartate aminotransferase (ALT), alanine aminotransferase (AST), ferritin, IL-6 and IL-10 among other parameters, indicate the severity of COVID-19 (4–6).
Hypothyroidism can be successfully overcome by Levothyroxine (LT4) sustitutive treatment leading in most cases to normal free triiodothyronine (FT3) levels (7). FT3 is a major endocrine regulator of the metabolic rate, increasing resting energy expenditure by directly regulating different metabolic pathways (reviewed in (8, 9). FT3 tends to be lower with age, a decrease believed to be beneficial in healthy individuals during old age by slowing-down metabolism (10, 11). Severely ill patients can also present a decrease in circulating T3, a condition denominated “non-thyroidal illness syndrome” or “euthryoid low T3 syndrome” (12, 13). Euthryoid low T3 syndrome has been reported in COVID-19 patients, although there is currently some discrepancy on the magnitude of the percentage of COVID-19 patients with low FT3 levels, ranging from 0% to 28% (14–21). Besides, low FT3 levels have been also associated with a poor prognosis in COVID-19 patients (19, 20).
In this study we have analyzed the association of FT3 levels and age, with biochemical data, metabolic parameters and cytokine levels involved in COVID-19 severity both in euthyroid patients and in hypothyroid patients on LT4 replacement therapy. We found a negative correlation between age and FT3 levels, and determined that increased COVID-19 severity markers are related either to higher age, low FT3 levels, or to both. We also define a specific metabolomic cluster, characteristic of a high ketogenic profile, in non-critical hospitalized COVID-19 patients with low FT3.
Methods
Study design and participants
This is a retrospective study and was approved by the Institutional Ethics Committee of the Hospital Clínico San Carlos (HCSC) (n°=20/397-E_COVID). The Biobank of the HCSC provided the serum samples and clinical data from COVID-19 patients (March 3rd 2020-October 30th 2020). First, we selected consecutive serum samples from LT4-treated COVID-19 patients with doses ≥ 525 mg/week in the ICU (n=9) and in the ward (n=39). Thirty-three % of these patients were athyreotic and the mean LT4 dose was 8.8 ± 2.7 mg/kg/week. Subsequently, samples from euthyroid COVID-19 patients in the ward (n=40) or in the ICU (n=29), matching the date of sampling (± 3-days), sex and age with their corresponding LT4-treated group, were chosen. Pregnant patients, patients with hyperthyroidism, with thyroid disorders not confirmed during hospitalization, with LT4 dose <525 mg/week and patients aged <18 years, were excluded from the study. 16.2% of the analyzed patients died in the hospital from COVID-19, either because of respiratory failure and lack of response to treatment, or because of secondary complications of the required invasive measures. Due to heparin prophylaxis, 2 patients died of hypovolemic shock secondary to rectorrhagia and 1 patient died from thrombosis with diffuse non-revascularized myocardial ischemia.
Additionally, severity parameters and outcome of 1,450 consecutive hospitalized patients registered in the COVID-19_URG-HCSC database were analyzed. The exclusion criteria, which were identical to those used for the choice of serum from COVID-19 patients, are shown in Supplementary Figure 1.
Clinical laboratory tests
COVID-19 was confirmed by RT-PCR of SARS-CoV-2 RNA in nasopharyngeal and oropharyngeal samples performed in a QuantStudio-5 (Applied Biosystems®). Hemograms were performed on a DXH 900® and biochemical parameters on an AU5800® (Beckman-Coulter®). The coefficient of variation for the different parameters are shown in Supplementary Table 1. The cytokines included in the Human Anti-Virus Response Panel (740390, Biolegend®) were determined in serum samples according to the manufacturer´s instructions. Cytokines concentration was calculated using the Legendplex V8.0 software supplied by Biolegend®. TSH, FT4 and FT3 were assessed by chemiluminescence on a DXI-800® (Beckman-Coulter®). A standard curve for each hormone or cytokine was performed in parallel with the analysis of the samples.
1H-NMR spectrophotometry analysis
For the metabolomic analysis by nuclear magnetic resonance spectroscopy (1H-NMR), frozen serum samples (250 μL) were shipped in dry ice to Biosfer Teslab®. 1H-NMR-spectra were recorded on a BrukerAvance III 600 spectrometer, with the following certifications and validations: PCT/EP2014/075873, ISO 9001:2015; IVD-CE, ISO 13485,2015; ISO 13485:2016; Spanish Medicines Agency and Health Products License number 6855-PS, 2016). The quality assurance systems are performed annually by the SGS company, certificate ES19/86886, 2019), and by TÜV Rheinland company, certificate 0.04.15155,2015).
Thirty-two lipoprotein parameters were determined. The analysis of lipoprotein profile was performed by the NMR-based Liposcale® test. The lipid concentrations (i.e. triglycerides and cholesterol), size and particle number of the four main classes of lipoproteins [high-density lipoprotein (HDL), intermediate-density lipoprotein (IDL), low-density lipoprotein (LDL) and very-low-density lipoprotein (VLDL)], as well as the particle number of nine subclasses (large, medium and small VLDL, LDL, or HDL) were determined as previously reported (22, 23). Briefly, particle concentration and diffusion coefficients were obtained from the measured amplitudes and attenuation of their spectroscopically distinct lipid methyl group NMR signals, using the 2D diffusion-ordered 1H NMR spectroscopy (DSTE) pulse. The methyl signal was surface fitted with 9 lorentzian functions associated with each lipoprotein subclasses: large, medium and small of the main lipoprotein classes. The area of each lorentzian function was related to the lipid concentration of each lipoprotein subclass, and the size was calculated from their diffusion coefficient. Each subclass particle concentration was calculated by dividing the lipid volume by the particle volume of a given class. Lipid volumes were determined by using common conversion factors to convert concentration units into volume units (22, 23). The different lipoprotein subclasses correspond to the following diameter size ranges: large VLDL, 68.5 to 95.9 nm; medium VLDL, 47 to 68.5 nm; small VLDL, 32.5 to 47 nm; large LDL, 24 to 32.5 nm; medium LDL, 20.5 to 24 nm; small LDL, 17.5 to 20.5 nm; large HDL, 10.5 to 13.5 nm; medium HDL, 8.5 to 10.5 nm; and small HDL, 7.5 to 8.5 nm. Finally, weighted average VLDL, LDL and HDL particle sizes were calculated from various subclass concentrations by summing the known diameter of each subclass multiplied by its relative percentage of subclass particle number.
We also analyzed the region of the 1H-NMR spectrum where the glycoproteins resonate (2.15-1.90 ppm) using several analytical functions according to a previously published procedure (24). For each function, we determined the total area (proportional to concentration), height, position and bandwidth. The area of GlycA provided the concentration of acetyl groups of protein-bond N-acetylglucosamine and N-acetylgalactosamine, and the area of GlycB those of N- acetylneuraminic acid. GlycF area arises from the concentration of the acetyl groups of N-acetylglucosamine, N-acetylgalactosamine and N-acetylneuraminic acid unbound to proteins (free fraction). H/W ratios of GlycA and GlycB were also reported, being a parameter associated to the aggregation state of the sugar-protein bonds. Height was calculated as the difference from baseline to maximum of the corresponding NMR peaks and the width value corresponds to the peak width at half height. In total 6 glycoprotein parameters were determined.
A target set of 18 low molecular weight metabolites (LMWMs), including: isoleucine, leucine, valine, lactate, alanine, acetate, acetone, pyruvate, glutamine, creatine, creatinine, choline, proline, methanol, glycine, glycerol, serine, glucose, tyrosine, T-methylhistidine and formate, were identified and quantified in the 1D Carr-Purcell-Meiboom-Gill (CPMG) spectra using an adaptation of Dolphin. Each metabolite was identified by checking for all its resonances along the spectra, and then quantified using line–shape fitting methods on one of its signals (25, 26).
Lipophilic extracts were obtained from 200 μL aliquots of freshly thawed plasma using the BUME method (27) with slight modifications. BUME was optimized for batch extractions with di-isopropyl ether (DIPE) replacing heptane as the organic solvent, since the 1H-NMR fingerprint of heptane highly overlaps fatty acid signals. This procedure was performed with a BRAVO liquid handling robot which has capacity to extract 96 samples at once. The upper lipophilic phase was completely dried in Speedvac until evaporation of organic solvents and frozen at -80°C until NMR analysis. Lipid extracts were reconstituted in a solution of CDCl3:CD3OD: D2O (16:7:1, v/v/v) containing Tetramethylsilane (TMS) at 1.18 mM as a chemical shift reference and transferred into 5-mm NMR glass tubes. 1H-NMR spectra were measured at 600.20 MHz. A 90° pulse with water pre-saturation sequence (ZGPR) was used. Quantification of lipid signals in 1H-NMR spectra was carried out with LipSpin (28) an in-house software based on Matlab. Resonance assignments were done on the basis of literature values (29). The 18 lipid species obtained by this NMR approach included: cholesterol (free and esterified), unsaturated fatty acids (omega-6, omega-7, omega-9, omega-3), saturated fatty acids, monounsaturated fatty acids, linoleic acid, docosahexaenoic acid, arachidonic and eicosapentaenoic, glycerides and phospholipids (total cholines, triglycerides, phosphoglycerides, phosphatidylcholine, sphingomyeline and lysophosphatidylcholine).
Identification of relevant metabolites and model building
A three-step multivariate analysis was applied to the 1H-NMR data to identify important metabolites and patterns for distinguishing between groups. In the first step, we applied 4 statistical approaches to identify the variables that make the largest contributions to the discrimination between groups. These approaches include the Wilcoxon rank-sum test correcting for multiple comparisons with the Benjamini-Hochberg procedure, the Spearman’s rank correlation, the Random Forest, and the Partial Least Squares discriminant analysis (PLS-DA). Those variables that resulted significant with a corrected p-value <0.05 were selected as the candidates for the Wilcoxon rank-sum test and the Spearman’s rank correlation. The 10 most important variables were determined by the variable importance score or the variable importance in projection (VIP) score using the Random Forest or the PLSA-DA, respectively. To avoid overfitting, a 10-fold cross-validation was performed. In the second step, using a Venn diagram we selected the most prominent metabolites included in the model, by determining those that overlap in at least three of the four statistical approaches. In the third step, we used a Principal Component Analysis (PCA) as an unsupervised method to visualize the capacity of the selected metabolites to separate the groups. Ellipses in PCA represent 95% confidence intervals around the centroid of each data cluster. Finally, we built a linear fitting model, by computing the area under the curve (AUC) and the 95% confidence interval of a receiver operating characteristics (ROC) curve. We evaluated and quantified how accurately the selected 1H-NMR variables were able to discriminate between groups. Patients were randomly assigned to training (70%) and test (30%) sets. We performed a 10-fold cross-validation with 100 replicates on the training data during the model construction process and tested the model on the hold-out data. Analysis was performed using the R statistical software version 4.1.1.
Quantification and statistical analysis
Data were subjected to normality and lognormality tests. Two groups of unpaired variables with parametric distribution were compared using two-tailed Student’s t test and non-parametric distribution with two-tailed Mann-Whitney test. One-way ANOVA followed by multiple comparisons with Bonferroni test was used for multiple comparisons with unpaired parametric variables and with non-parametric distribution with the Kruskal-Wallis test followed by false discovery rate (FDR) by two-stage linear step-up procedure of Benjamini, Krieger and Yekutieli tests. Parametric data are presented as means ± S.D and non-parametric as medians and interquartile range 1-3 [Q1;Q3]. The X2 or two-sided Fisher’s exact tests were used to evaluate the differences of categorical variables, presented as percentages. Multivariate linear regression models were used to analyze the independent association of FT3 with age and ICU, and with some cytokines and metabolomic parameters, adjusting for sex and body mass index (BMI). Statistics were performed with GraphPad Prism 7.0 or R statistical software. Differences between the groups were considered significant when: *p<0.05, **p<0.01, or ***p<0.001.
Results
Thyroid hormones, cytokines and metabolomic profile in euthyroid and LT4-treated patients during COVID-19 hospitalization
TSH, FT4 and FT3 levels were determined in euthyroid and LT4-treated ward hospitalized COVID-19 patients and in euthyroid and LT4-treated ICU COVID-19 patients. Table 1 shows the baseline characteristics for these 4 groups. The ratio of females to males did not reflect evidence for significant differences among groups. Furthermore, no significant differences in age were observed between the two ward groups and between the two ICU groups, although both groups of ward patients were significantly older than those in the ICU (euthyroid p=0.006, LT4-treated p=0.004). Among the comorbidities analyzed, hypertension tended to be higher in ward LT4-treated patients and chronic renal disease was higher in all LT4-treated patients. Biochemical laboratory data obtained on the day of blood sampling for hormones determination, revealed that the only significant difference detected between the two ward groups was a lower ferritin value in the LT4-treated group (p=0.031). No evidence for statistical differences was found between the two ICU groups. The comparison between ward and ICU groups reflected a more severe biochemical COVID-19 profile in the ICU patients. The euthyroid ward patients presented a lower count of leukocytes (p=0.0008), neutrophils (p=0.001), neutrophil-to-lymphocyte ratio (p=0.004) and platelets (p=0.018) than the euthyroid ICU group. The euthyroid ward group also displayed lower levels of ALT (p=0.006), C-reactive protein (p=0.015) and fibrinogen (p=0.012) than the euthyroid ICU group (Table 1). Fewer statistical differences between LT4-treated ward and ICU groups were found, most likely due to the low number of patients in the LT4-treated ICU group. The percentage of patients taking medication that might affect thyroid function (30, 31) on the day before blood sampling for hormones was high and with no evidence for significant differences between groups (Supplementary Table 2).
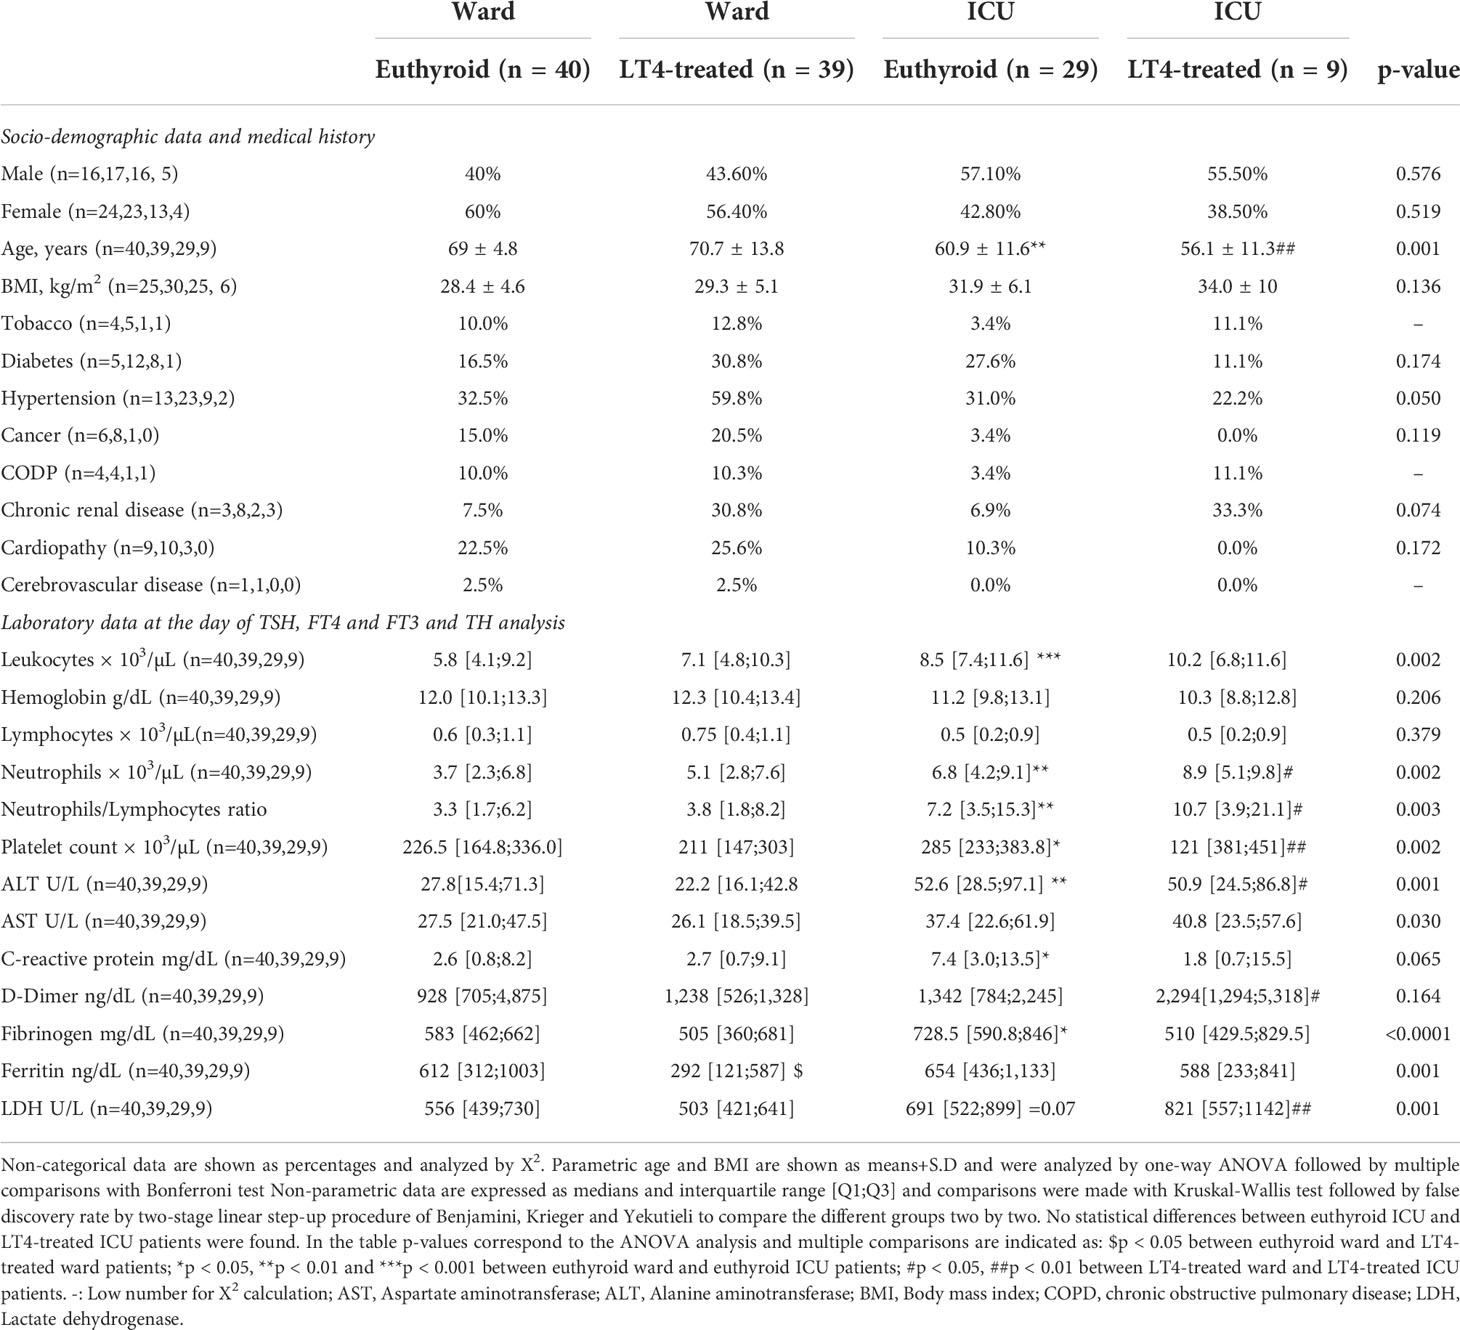
Table 1 Baseline characteristic and laboratory data in hospitalized COVID-19 patients.
TSH levels were higher in LT4-treated groups than in euthyroid groups, either in the ward (p=0.009) or in the ICU (p=0.044). We found no evidence for significant differences in FT4 and FT3 levels or in the FT3/FT4 ratio between euthyroid and LT4-treated patients in the ward, but LT4-treated ICU patients displayed lower FT4 than their euthyroid counterparts (p=0.014) (Figure 1A; Supplementary Table 3). FT3 decreased with age in COVID-19 patients. Multivariate linear regression analysis showed that FT3 remained a significant variable related to age (p=0.012), independently of being in the ward or ICU (interaction p= 0.198), as well as of sex and BMI (Figure 1B; Table 2).
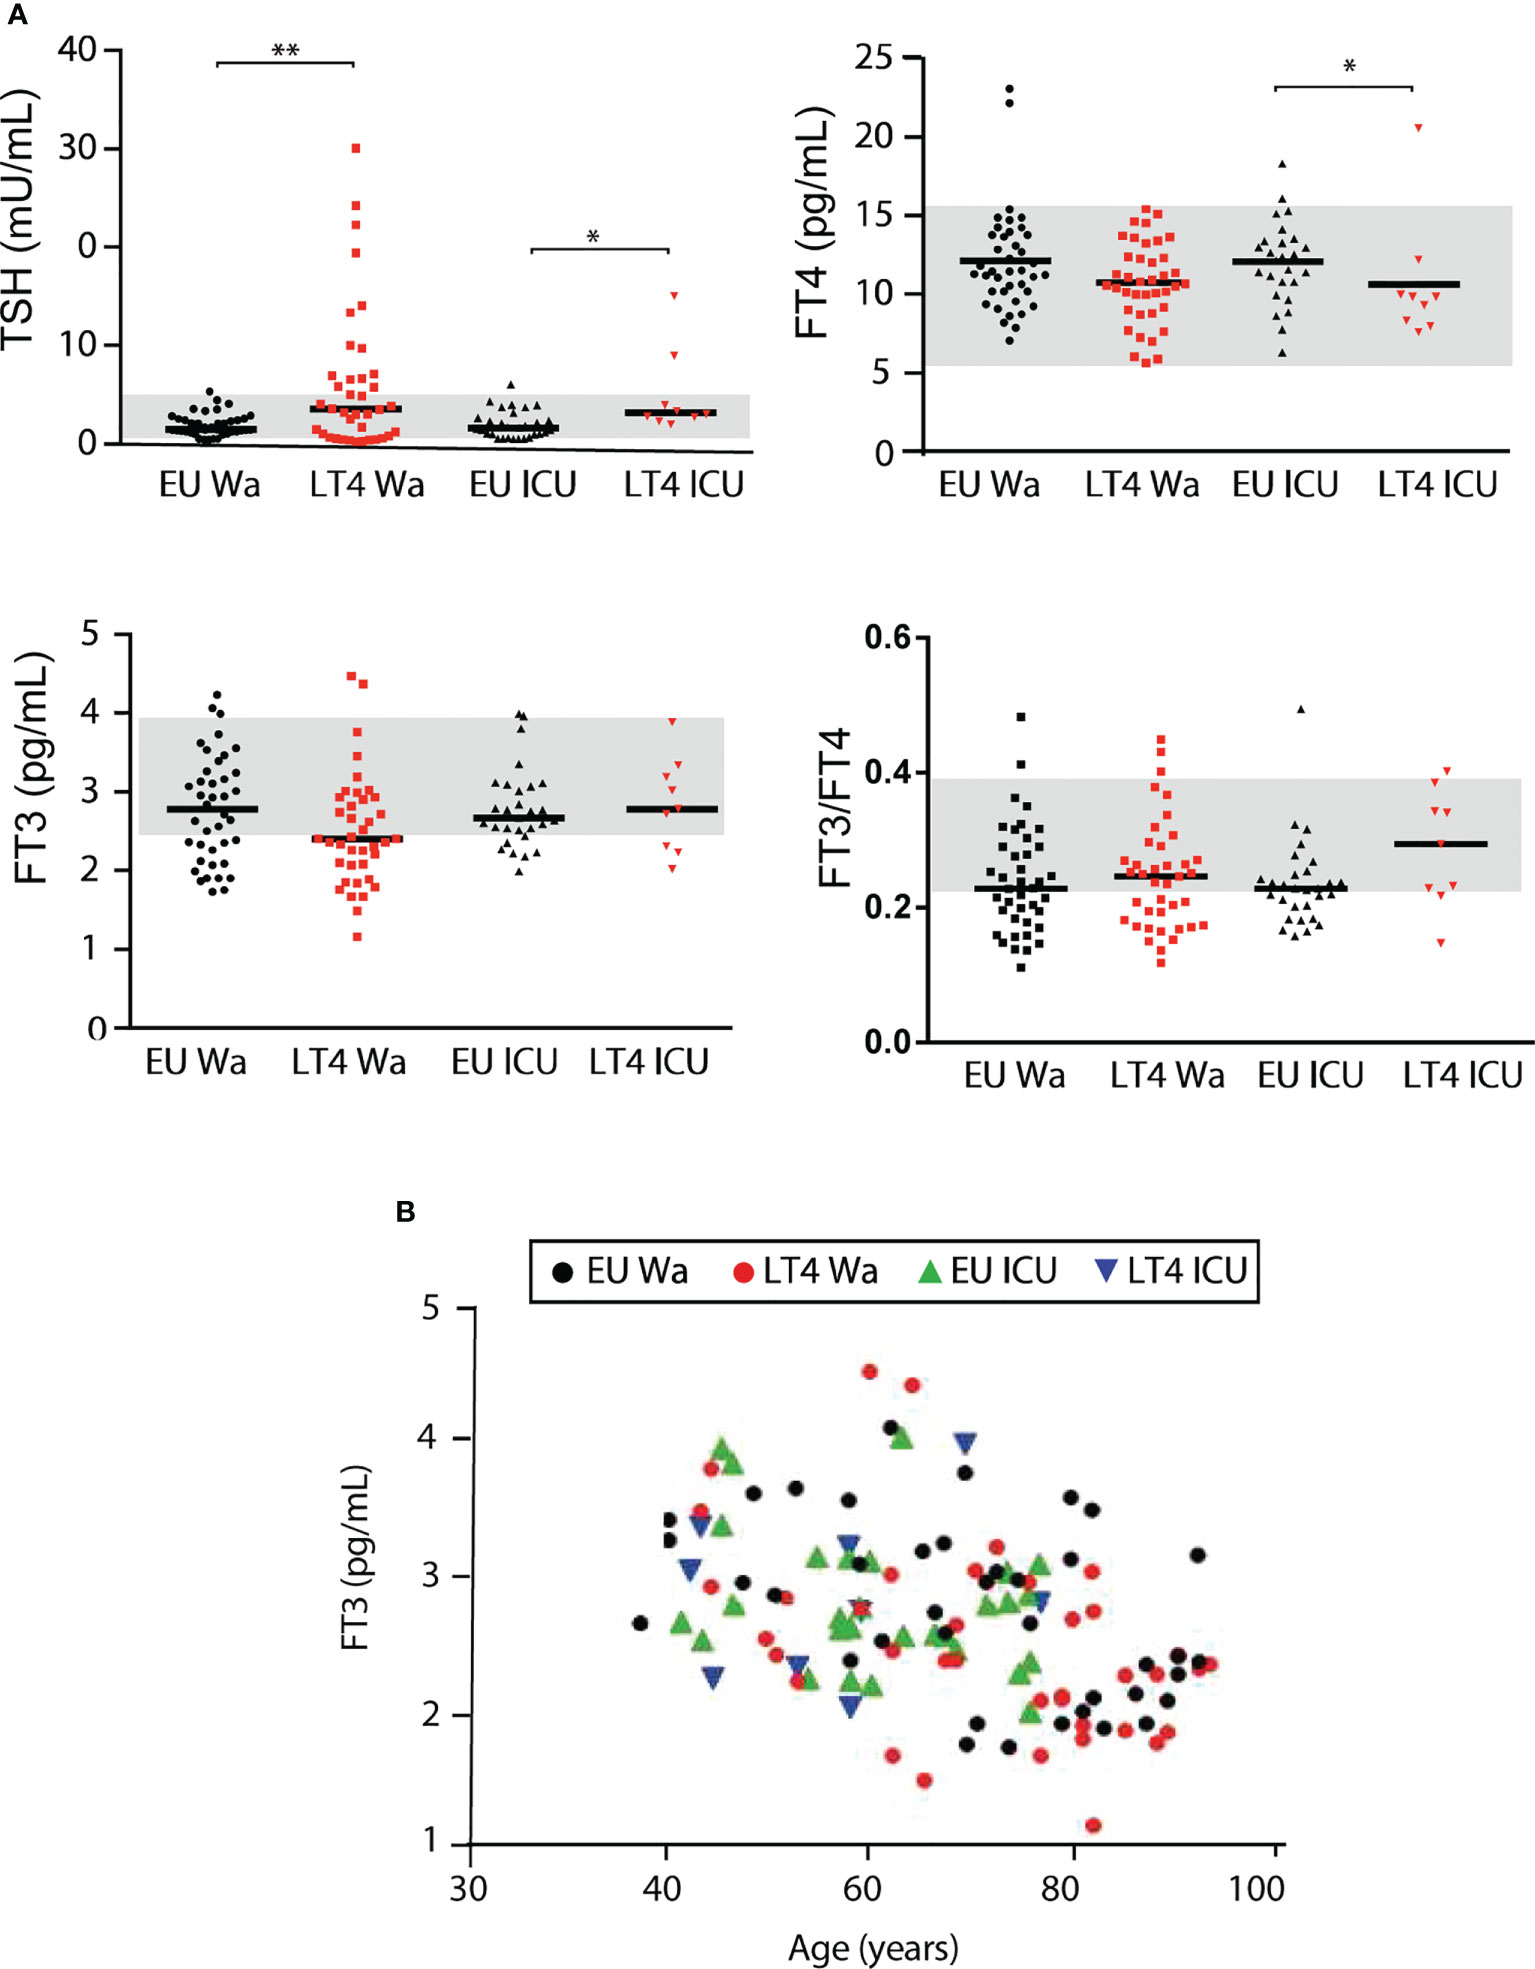
Figure 1 TSH, FT4 and FT3 levels in euthyroid and LT4-treated patients during COVID-19 hospitalization. (A) TSH, FT4, FT3 and FT3/FT4 in euthyroid and LT4-treated (> 525 mg/week) COVID-19 hospitalized patients. Comparisons were made with Kruskal-Wallis test followed by FDR by two-stage linear step-up procedure of Benjamini, Krieger and Yekutieli. Only statistical differences between both ward or ICU groups, or between the two euthyroid or LT4-treated groups were considered. Grey bands represent physiological hormone range. ∗p < 0.05, ∗∗p < 0.001. (B) Correlation FT3 versus age in the groups indicated in A.
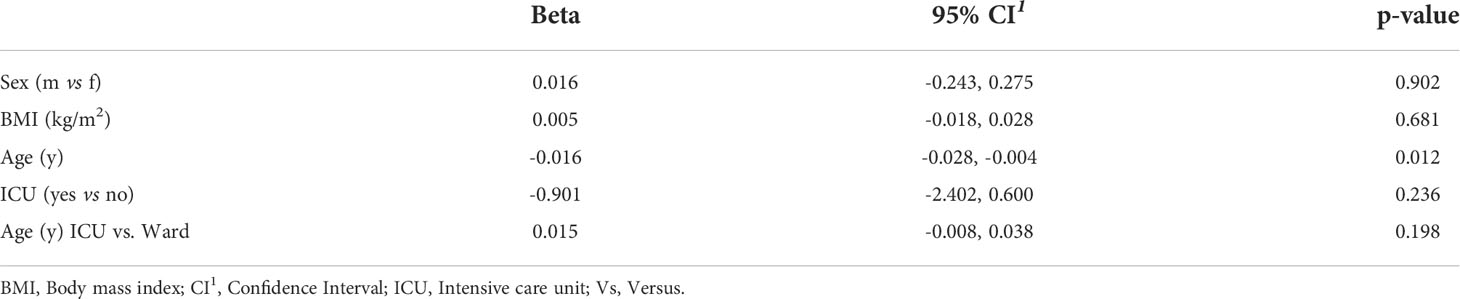
Table 2 Multivariate linear regression analysis of FT3 with age, ICU and their interaction-term, adjusted for sex and BMI in hospitalized COVID-19 patients.
Analysis of 11 antiviral-related serum cytokines indicated no evidence for significant differences between euthyroid and LT4-treated patients either in the ward or in the ICU. However, euthyroid and LT4-treated patients in the ward displayed significantly higher levels of IL-1β and lower levels of IP-10, IFN-β, IFN-γ and GM-CSF than the corresponding ICU groups. IL-8 and IL-12 p70 were only significantly higher in the euthyroid ward group, probably due to the low number of patients in the ICU LT4-treated group (Table 3).
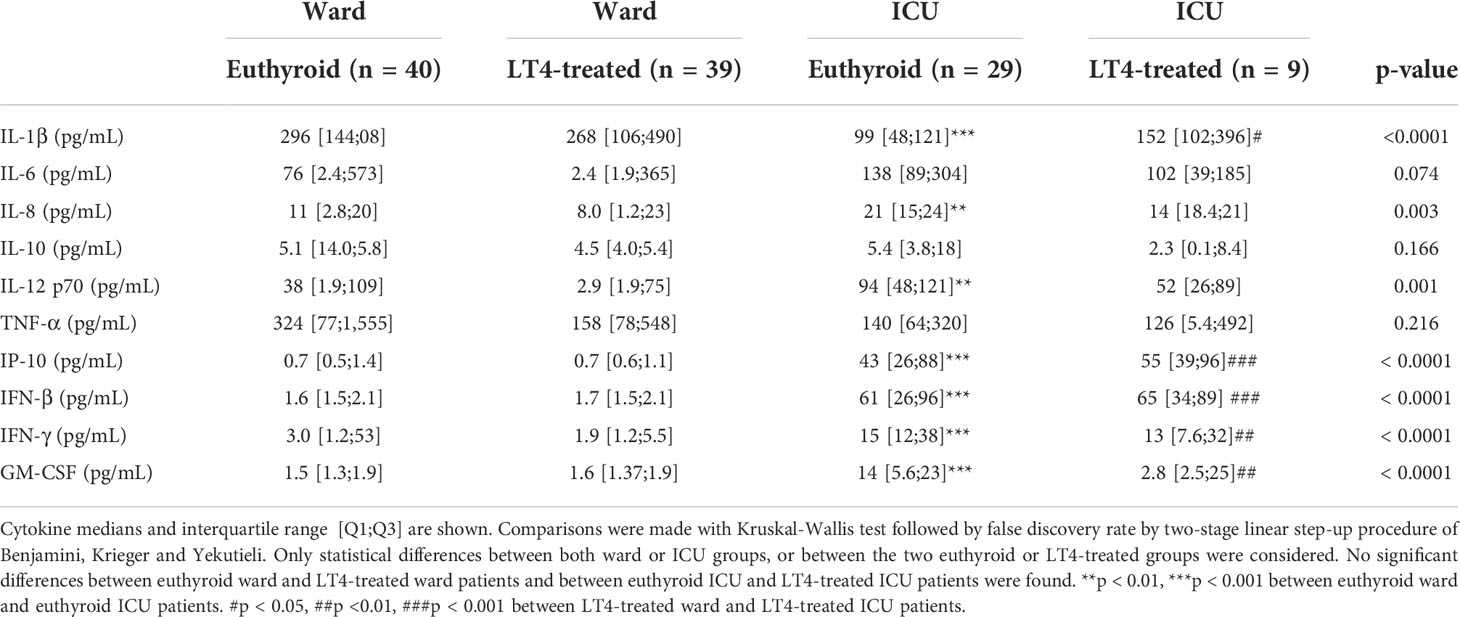
Table 3 Circulating antiviral cytokine levels in hospitalized COVID-19 patients.
We detected 18 low molecular weight metabolites, 18 lipids, 32 lipoproteins and 6 glycoprotein parameters by 1H-NMR in serum from ward and ICU COVID-19 patients (Supplementary Table 4). There was no evidence for significant differences in the metabolomic profile between euthyroid and LT4-treated ward hospitalized patients or between the two ICU groups. The main differences were found between euthyroid ward and ICU groups and again statistical differences between both LT4-treated groups in some of these parameters were not obtained, likely due to the low number of LT4-treated ICU patients. The levels of the low molecular weight metabolites glucose, threonine, valine and leucine were significantly lower in the euthyroid ward group than in the euthyroid ICU group (p-values <0.0001, 0.001, 0.001 and 0.024, respectively). Free cholesterol and linoleic acid were the lipid metabolites that showed statistical differences between the euthyroid groups in the ward and in the ICU (p=0.025 and p=0.001, respectively). Concerning the lipoprotein profile, euthyroid ICU patients presented higher levels of intermediate density lipoprotein (IDL)-cholesterol (p=0.006) and IDL-triglycerides (TGs) (p=0.009) than euthyroid ward patients. Glycoprotein A and their high/width ratio were also increased in the euthyroid ICU group with respect to the ward group (p=0.0071, p=0.0028, respectively) (Figure 2; Supplementary Table 4).
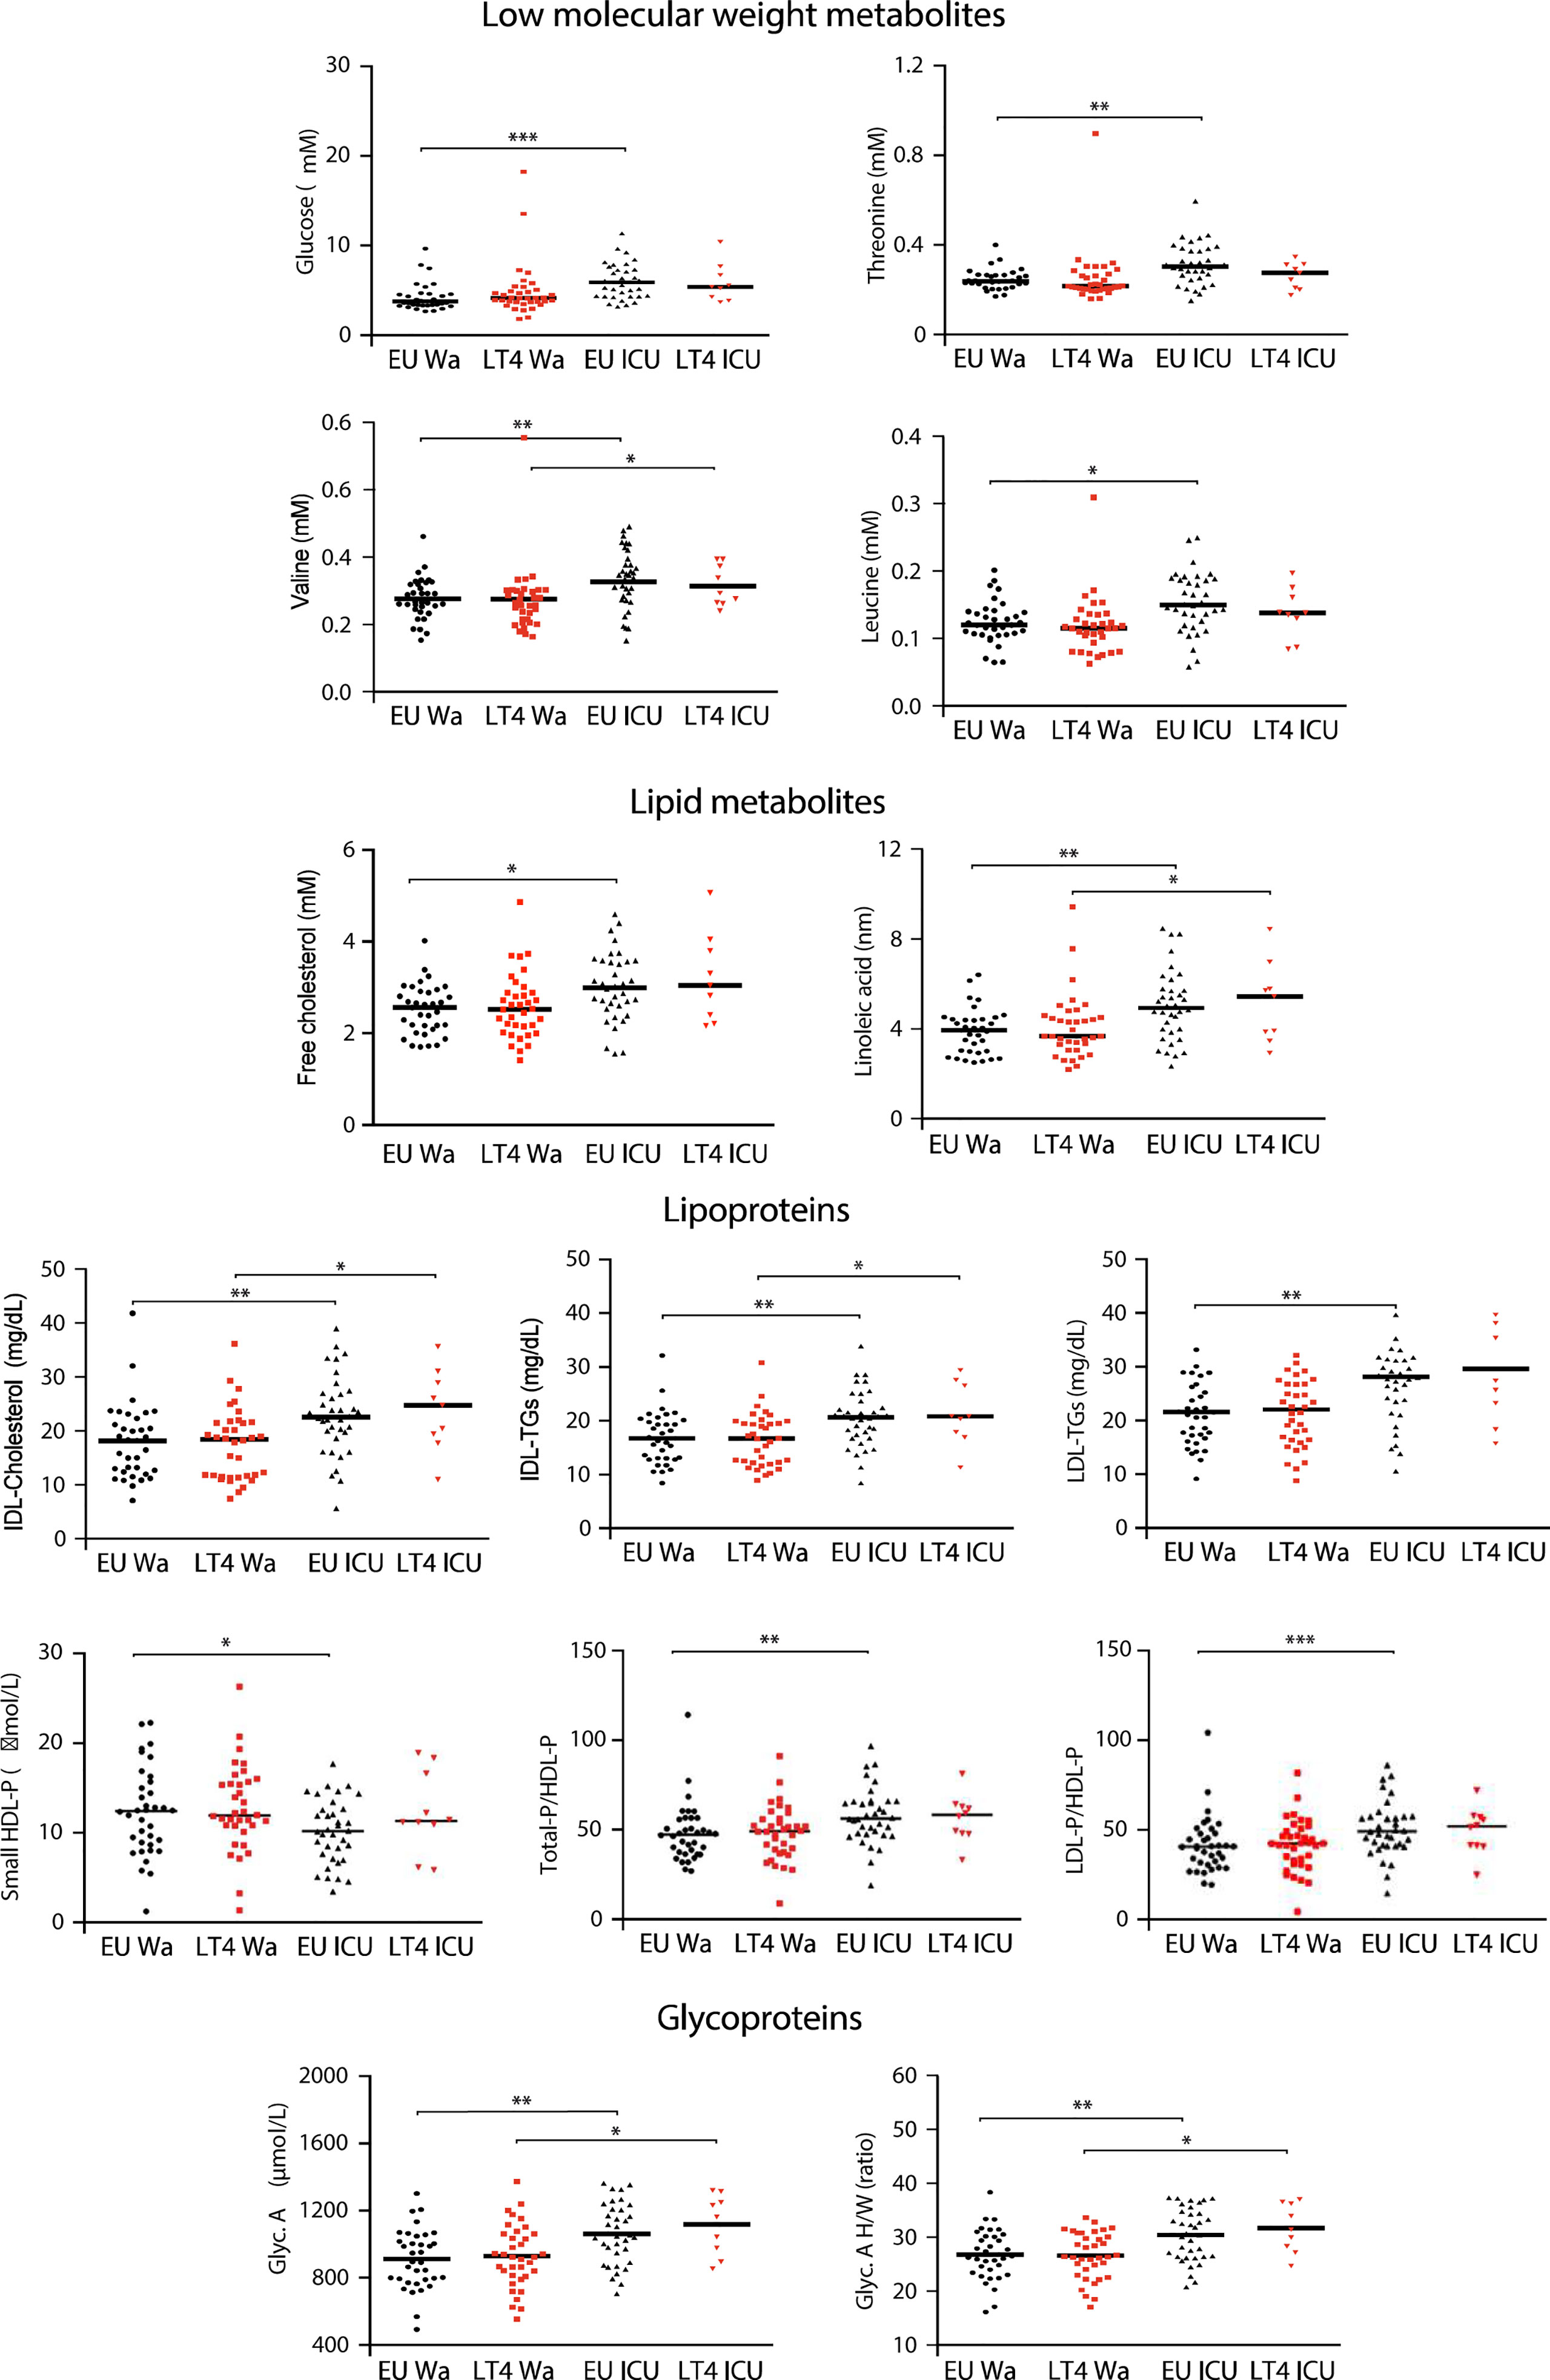
Figure 2 Serum metabolomic profile of euthyroid and LT4-treated hospitalized COVID-19 patients. Metabolomic parameters with statistically significant differences between groups found in Supplementary Table 4. Comparisons were made with Kruskal-Wallis test followed by FDR by two-stage linear step-up procedure of Benjamini, Krieger and Yekutieli. Only statistical differences between both ward or ICU groups, or between the two euthyroid or LT4-treated groups were considered. *p<0.05, **p < 0.01, ***p < 0.001. IDL, Intermediate density lipoprotein; TGs, Triglycerides; LDL, Low density lipoprotein; HDL-P, High density lipoprotein-particle; Glyc, Glycoprotein; H/W, High/width.
All these data indicate no evidence for significant differences between patients treated with LT4 or not, in terms of the cytokine and metabolomic profiles tested. To further confirm the similarity between euthyroid patients and patients under LT4 treatment, we compared COVID-19 severity and outcome of 1,266 euthyroid patients and 85 LT4-treated patients out of a total of 1,450 patients with laboratory-confirmed COVID-19, admitted consecutively to the Hospital Emergency Department (Supplementary Figure 1). The higher prevalence of the thyroid disease in females reflected their higher percentage in the LT4-treated group (p=<0.0001), with no evidence for statistical differences in age. Related to the severity of COVID-19 during hospitalization, there was no evidence for significant differences in pneumonia consolidation and oxygen therapy requirements between both groups. More importantly, between euthyroid and LT4-treated patients there was no evidence for significant differences in 60-day and 30-day all-cause hospital mortality and in severity score, measured as ICU admission/in-hospital mortality/high oxygen requirement rate (Table 4).
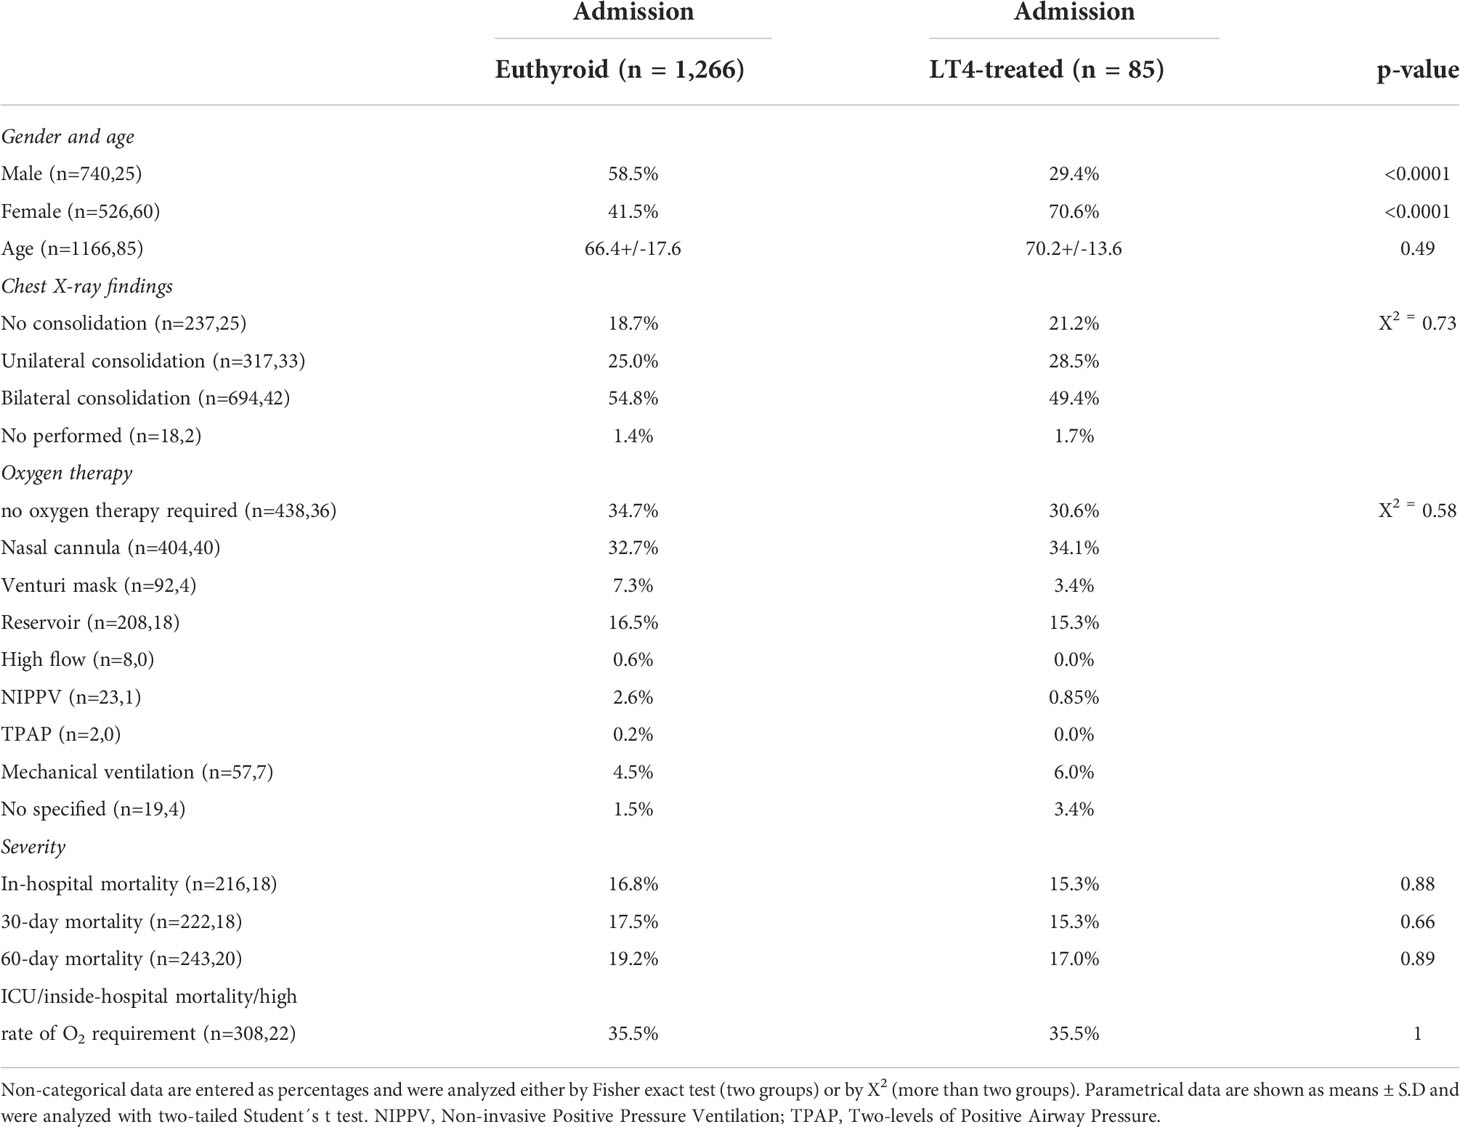
Table 4 Gender, age, severity and mortality within 30 and 60 days in hospitalized COVID-19 patients.
Influence of FT3 levels in the cytokine and metabolomic profiles in non-critical hospitalized COVID-19 patients
Low FT3 levels have been associated with a poor prognosis in COVID-19 (19, 20). To study the impact of FT3 levels on disease severity, as well as on the cytokine and metabolomic profiles during non-critical COVID-19 hospitalization, euthyroid and LT4-treated ward patients were clustered according to their circulating FT3 levels. The low-FT3 group (<2.1 pg/mL) consisted of 18 ward patients, 9 of them euthyroid; while the high-FT3 group (>3.0 pg/mL) comprised 17 ward patients, 12 of them euthyroid. No evidence for significant differences in TSH and FT4 values between both groups were found, while the statistical difference for FT3 levels or FT3/FT4 ratio was p=<0.0001 (Supplementary Figure 2). In agreement with the negative association between age and FT3 levels, the low-FT3 group was 15 years older on average (p=0.007) and presented a higher incidence of diabetes (p=0.045), hypertension (p=0.017) and cardiopathy (p=0.004), lower hemoglobin (p=0.046) and lymphocyte count (p=0.006), as well as a higher neutrophil-to-lymphocyte ratio (p=0.037) and C-reactive protein levels (p=0.013). Other severity parameters also tended to be more elevated in patients with low-FT3, including the percentage of exitus, which was 3 times higher, although the difference did not reach statistical significance, most likely due to the small number of patients (Table 5).
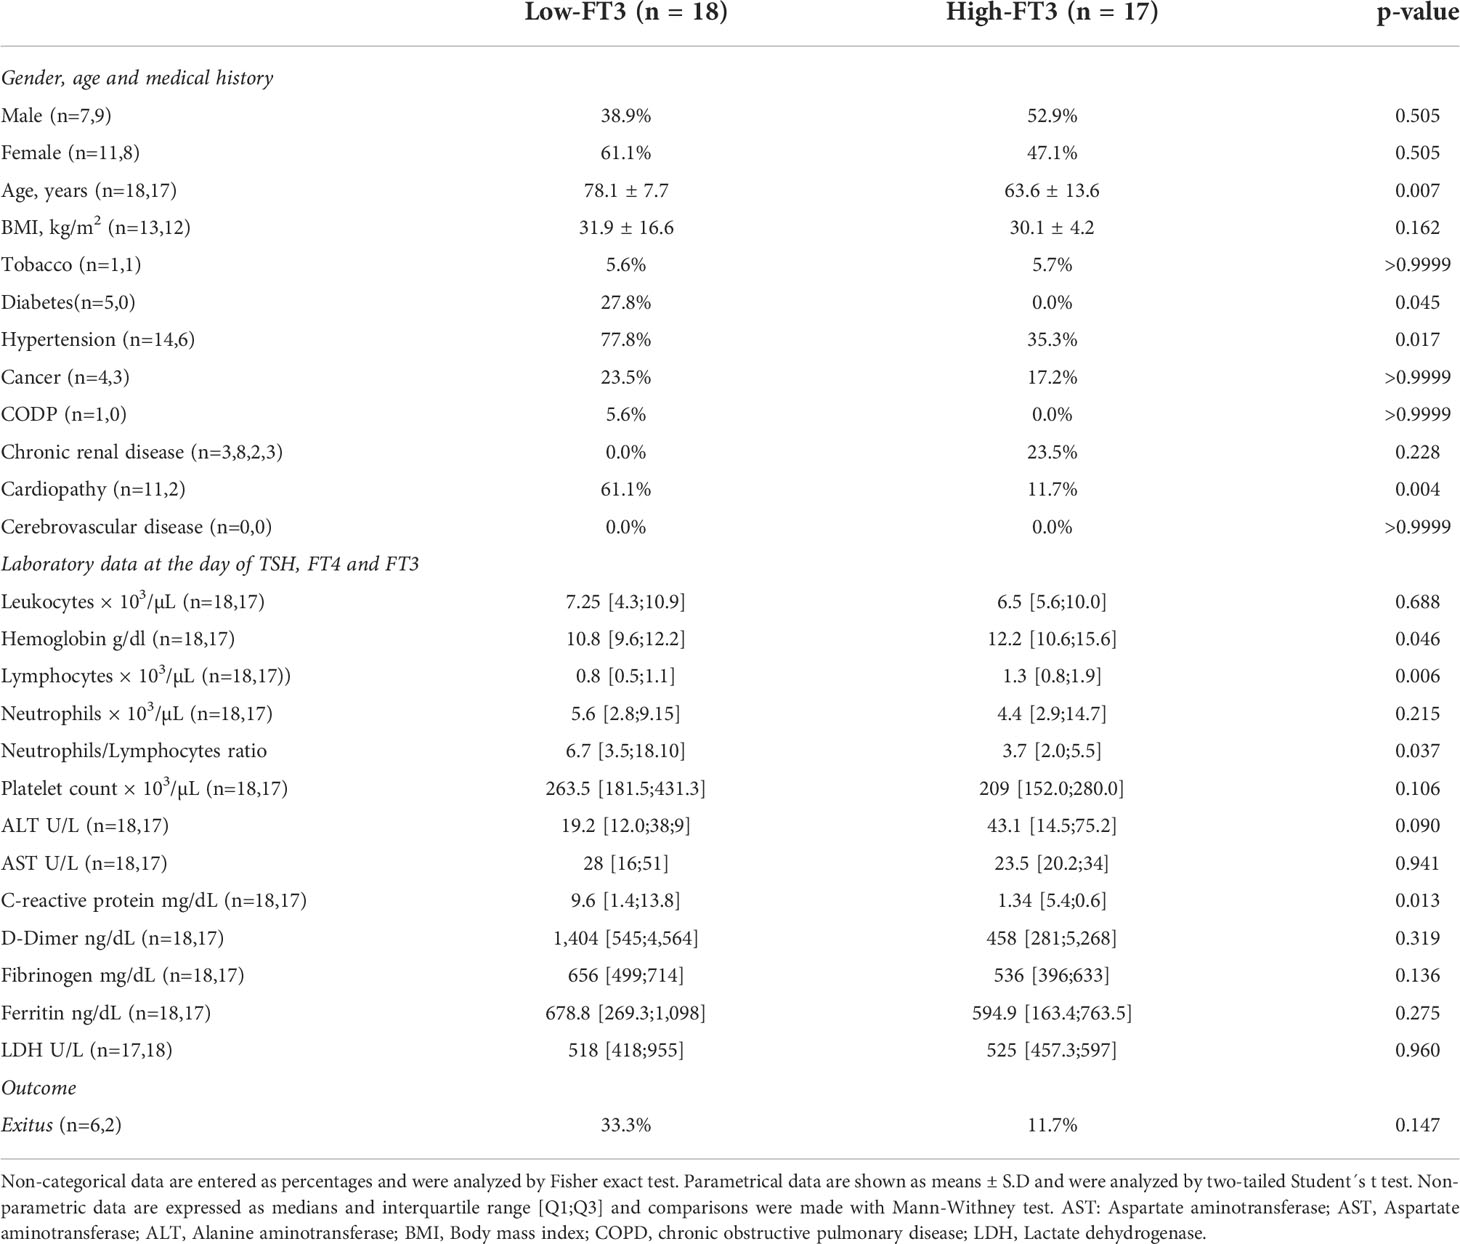
Table 5 Baseline characteristics, laboratory data and outcome in ward hospitalized COVID-19 patients.
The FT3/FT4 ratio has been found to be associated with poor prognosis in several diseases (32–34), including COVID-19 (17, 35). Thus, we also clustered the ward patients into high and low FT3/FT4 groups to compare COVID-19 severity. The. low FT3/FT4 group with a ratio <0.172 consisted of 18 patients, 9 of which were on LT4 treatment, and the high FT3/FT4 group with a ratio >0.303, was composed of 17 patients, 8 of which were on LT4 treatment. The low-FT3/FT4 group was significantly older (p<0.001) and had an elevated neutrophil-to-lymphocyte ratio (p<0.001), as well as higher levels of C-reactive protein (p=0.047) and D-dimer (p=0.015). The percentage of exitus in the low FT3/FT4 group was of 27.8% and in the high FT3/FT4 group was of 5.8% but, as in the case of the low-FT3 patients, this difference did not reach statistical significance. (Supplementary Table 5).
In the analysis of the antiviral cytokines, only two cytokines were significantly higher in the low-FT3 group, IL-6 (p=0.016) and IL-10 (p=0.015) (Table 6), both defined as markers of COVID-19 severity (6). IL-6 levels were also higher (<0.049) in the low FT3/FT4 group (Supplementary Table 5). Multilinear regression analysis revealed that only IL-6 was negatively associated with FT3 (p=0.023) independently of age, sex and BMI, whereas IL-10 was positively associated with age (p=0.035) independently of sex, BMI and FT3 (Table 7).
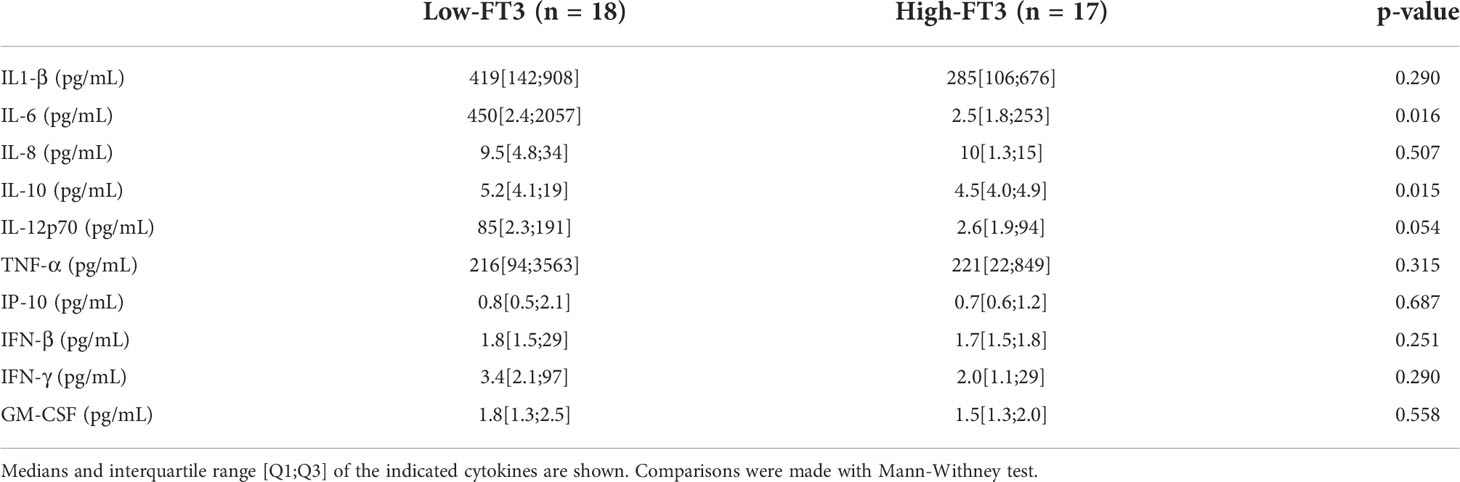
Table 6 Circulating antiviral cytokines levels in ward hospitalized Covid-19 patients.
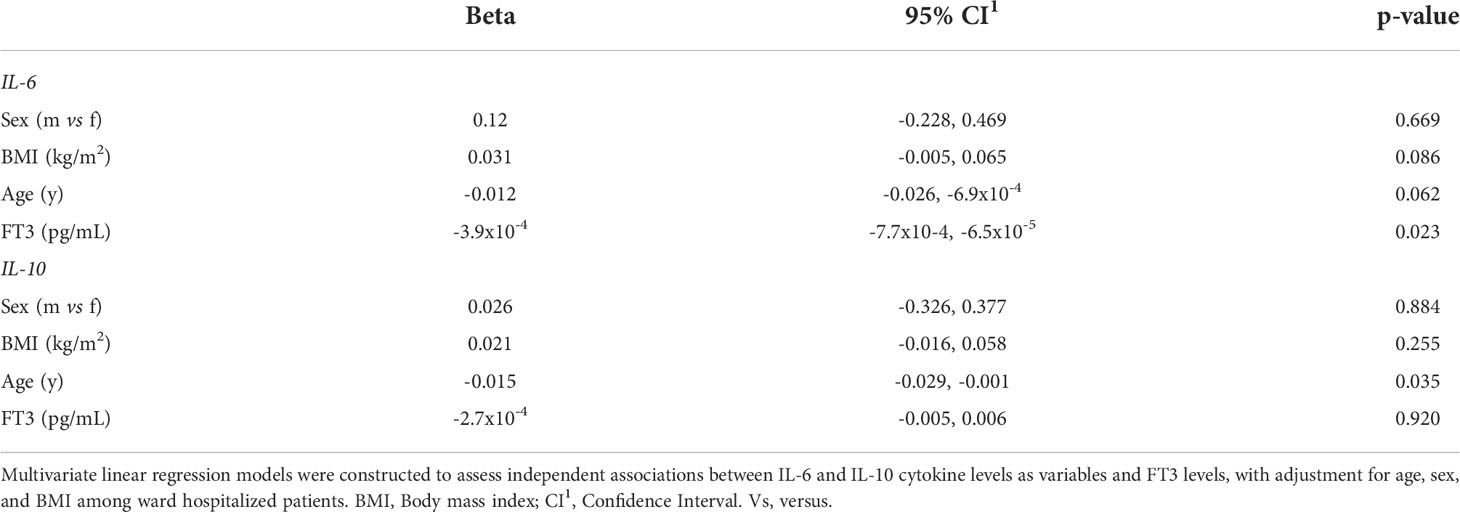
Table 7 Multivariate linear regression analysis of IL-6 and IL-10 according to FT3 with adjustment for age, sex, and BMI in ward hospitalized COVID-19 patients.
To identify whether variations in circulating FT3 levels also correlated with changes in the metabolomic pattern of non-critical hospitalized COVID-19 patients, a three-step data analysis was performed on the metabolomic parameters obtained from the low-FT3 and high-FT3 groups (Supplementary Table 6). In a first step, we applied 4 statistical approaches to identify the variables that make the largest contributions to the discrimination between groups (Figure 3A). In the second step, using a Venn diagram, we selected the metabolites that overlap in at least three of the four statistical approaches. Six variables: 3-hydroxybutyrate, acetone, creatinine, esterified cholesterol, HDL-Z, and small HDL-P were obtained (Figure 3B). In the third step, this cluster was further visualized by PCA, which presented different PC1 and PC2. The evaluation of the model performance by a ROC curve showed an AUC of 0.92 (95% CI = 0.74-1). In addition, the accuracy of the obtained model was 78.0% (accuracy>no information rate) p=0.157 and an out-of-bag error (OOB) of p=0.27. All these data indicate a robust association of the metabolomic cluster constituted by 3-hydroxybutyrate, acetone, creatinine, esterified cholesterol, and HDL-Z with the non-critical hospitalized low-FT3 group compared to the high-FT3 group (Figure 3C). Multivariate linear regression models with all the ward hospitalized patients were constructed to assess independent associations between FT3 and these metabolomic variables, after adjustment for age, sex and BMI. Using these models, FT3 was directly related to the levels of esterified cholesterol (p=4.1x10⁻⁴) and small HDL particles (6.0x10⁻⁵), while an inverse association was found for 3-hydroxybutyrate (p=0.010), creatinine (p=0.017), HDL-Z (p=3.6x10⁻⁴) and acetone (p=0.076). Age also remained a significant variable for creatinine (p=0.012), HDL-Z (p=8.3x10⁻³), acetone (p=0.026) and 3-hydroxybutyrate (p=0.030) in ward patients (Table 8).
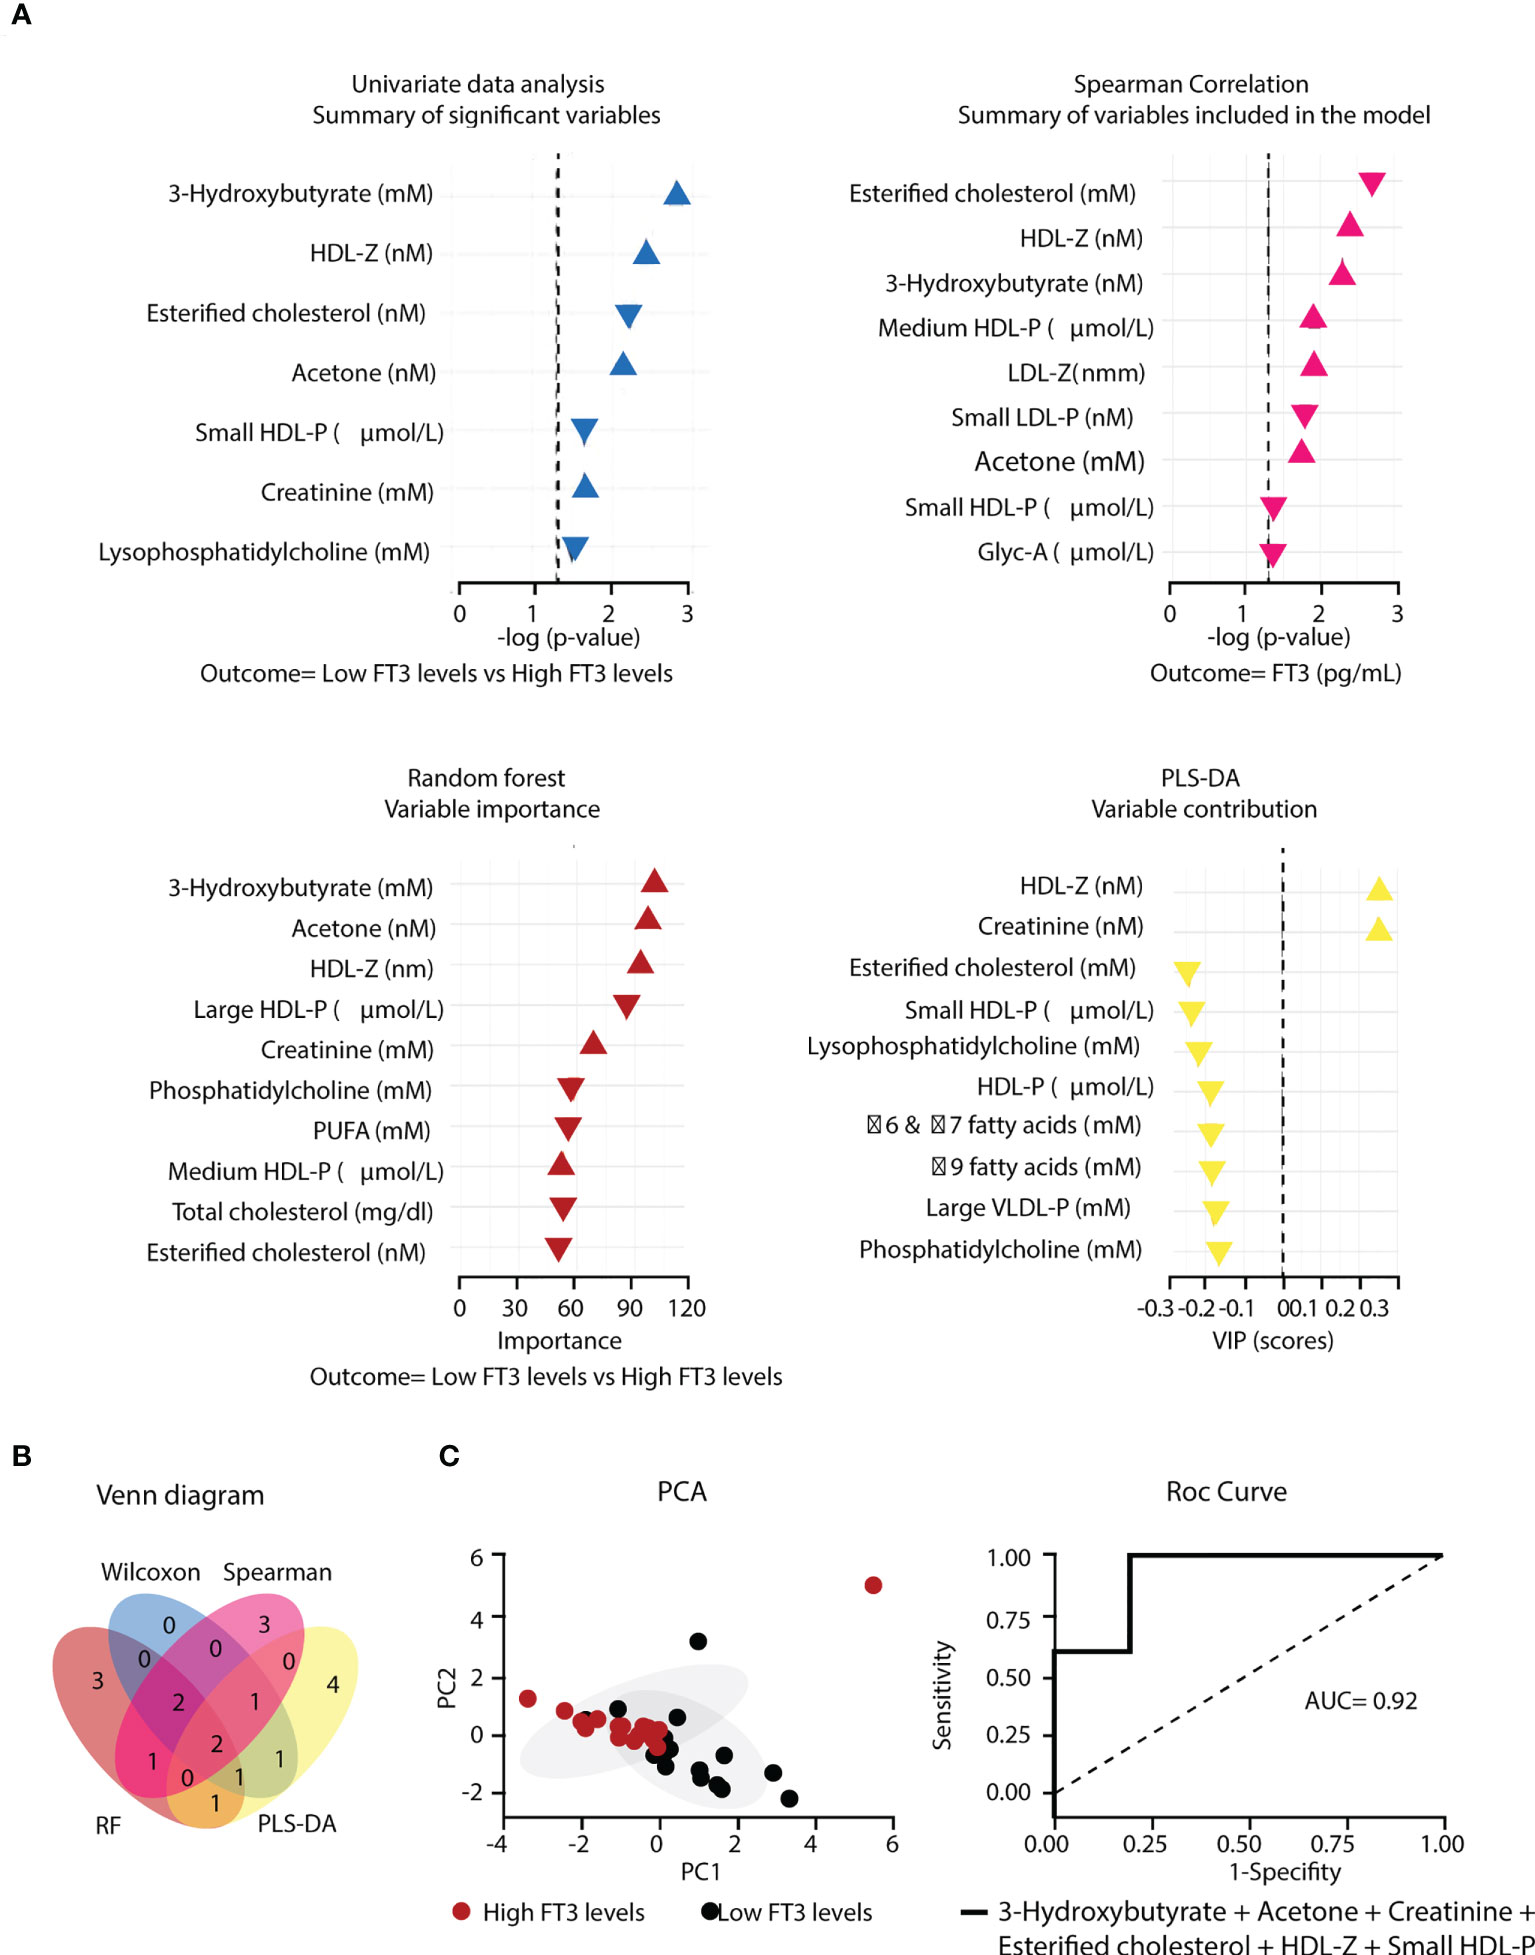
Figure 3 Metabolomic cluster associated to low FT3 in COVID-19 ward hospitalized patients. (A) Variables differently expressed in the low-FT3 group (n=18) and high-FT3 group (n=17) determined by four different methods. (B) Venn diagram describing the overlapping metabolomic parameters from the 4 statistical models. (C) PCA based on two principal components using the metabolomic cluster resulting from the previous steps, and Roc curve showing the accuracy (AUC). Gly, Glycoprotein; P, Particles; PUFA Polyunsaturated fatty acids (four PUFA signals); ω, Omega; Z, Diameter.
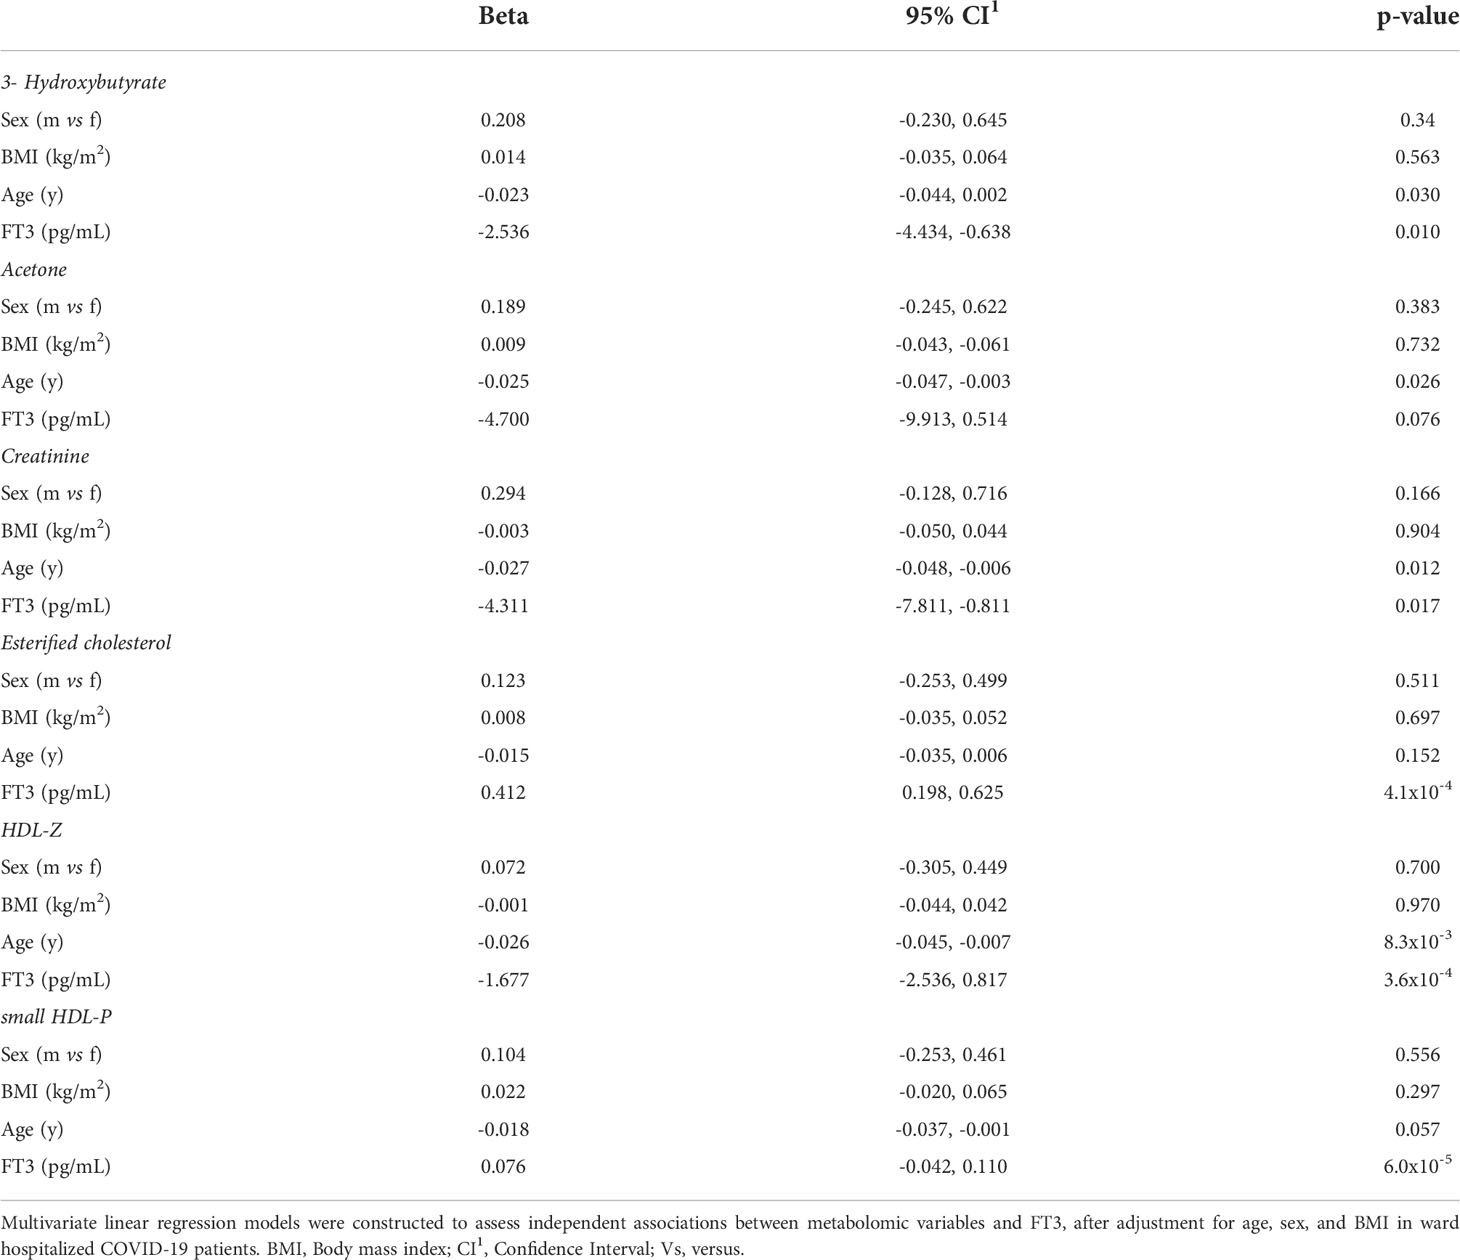
Table 8 Multivariate linear regression analysis of metabolomic variables according to FT3, with adjustment for age, sex and BMI.
We then compared the correlation of these 6 metabolic parameters with FT3 for all ward patients and also for all ICU patients. Acetone and 3-hydroxybutyrate were the only two metabolites that correlated differently with FT3 in ward and in ICU, negatively with FT3 in ward patients but positively in ICU patients (Figure 4). The interaction analysis, by testing the slopes in the ward and ICU against each other, revealed that the slopes in ward and ICU were statistically different for both 3-hydroxybutyrate (p=0.001) and acetone (p=0.019). Multiple linear regression analysis of these two metabolites with FT3 in ICU patients showed a relationship with FT3 (3-hydroxybutyrate p=0.002 and acetone p=0.007), independently of age, sex or BMI.
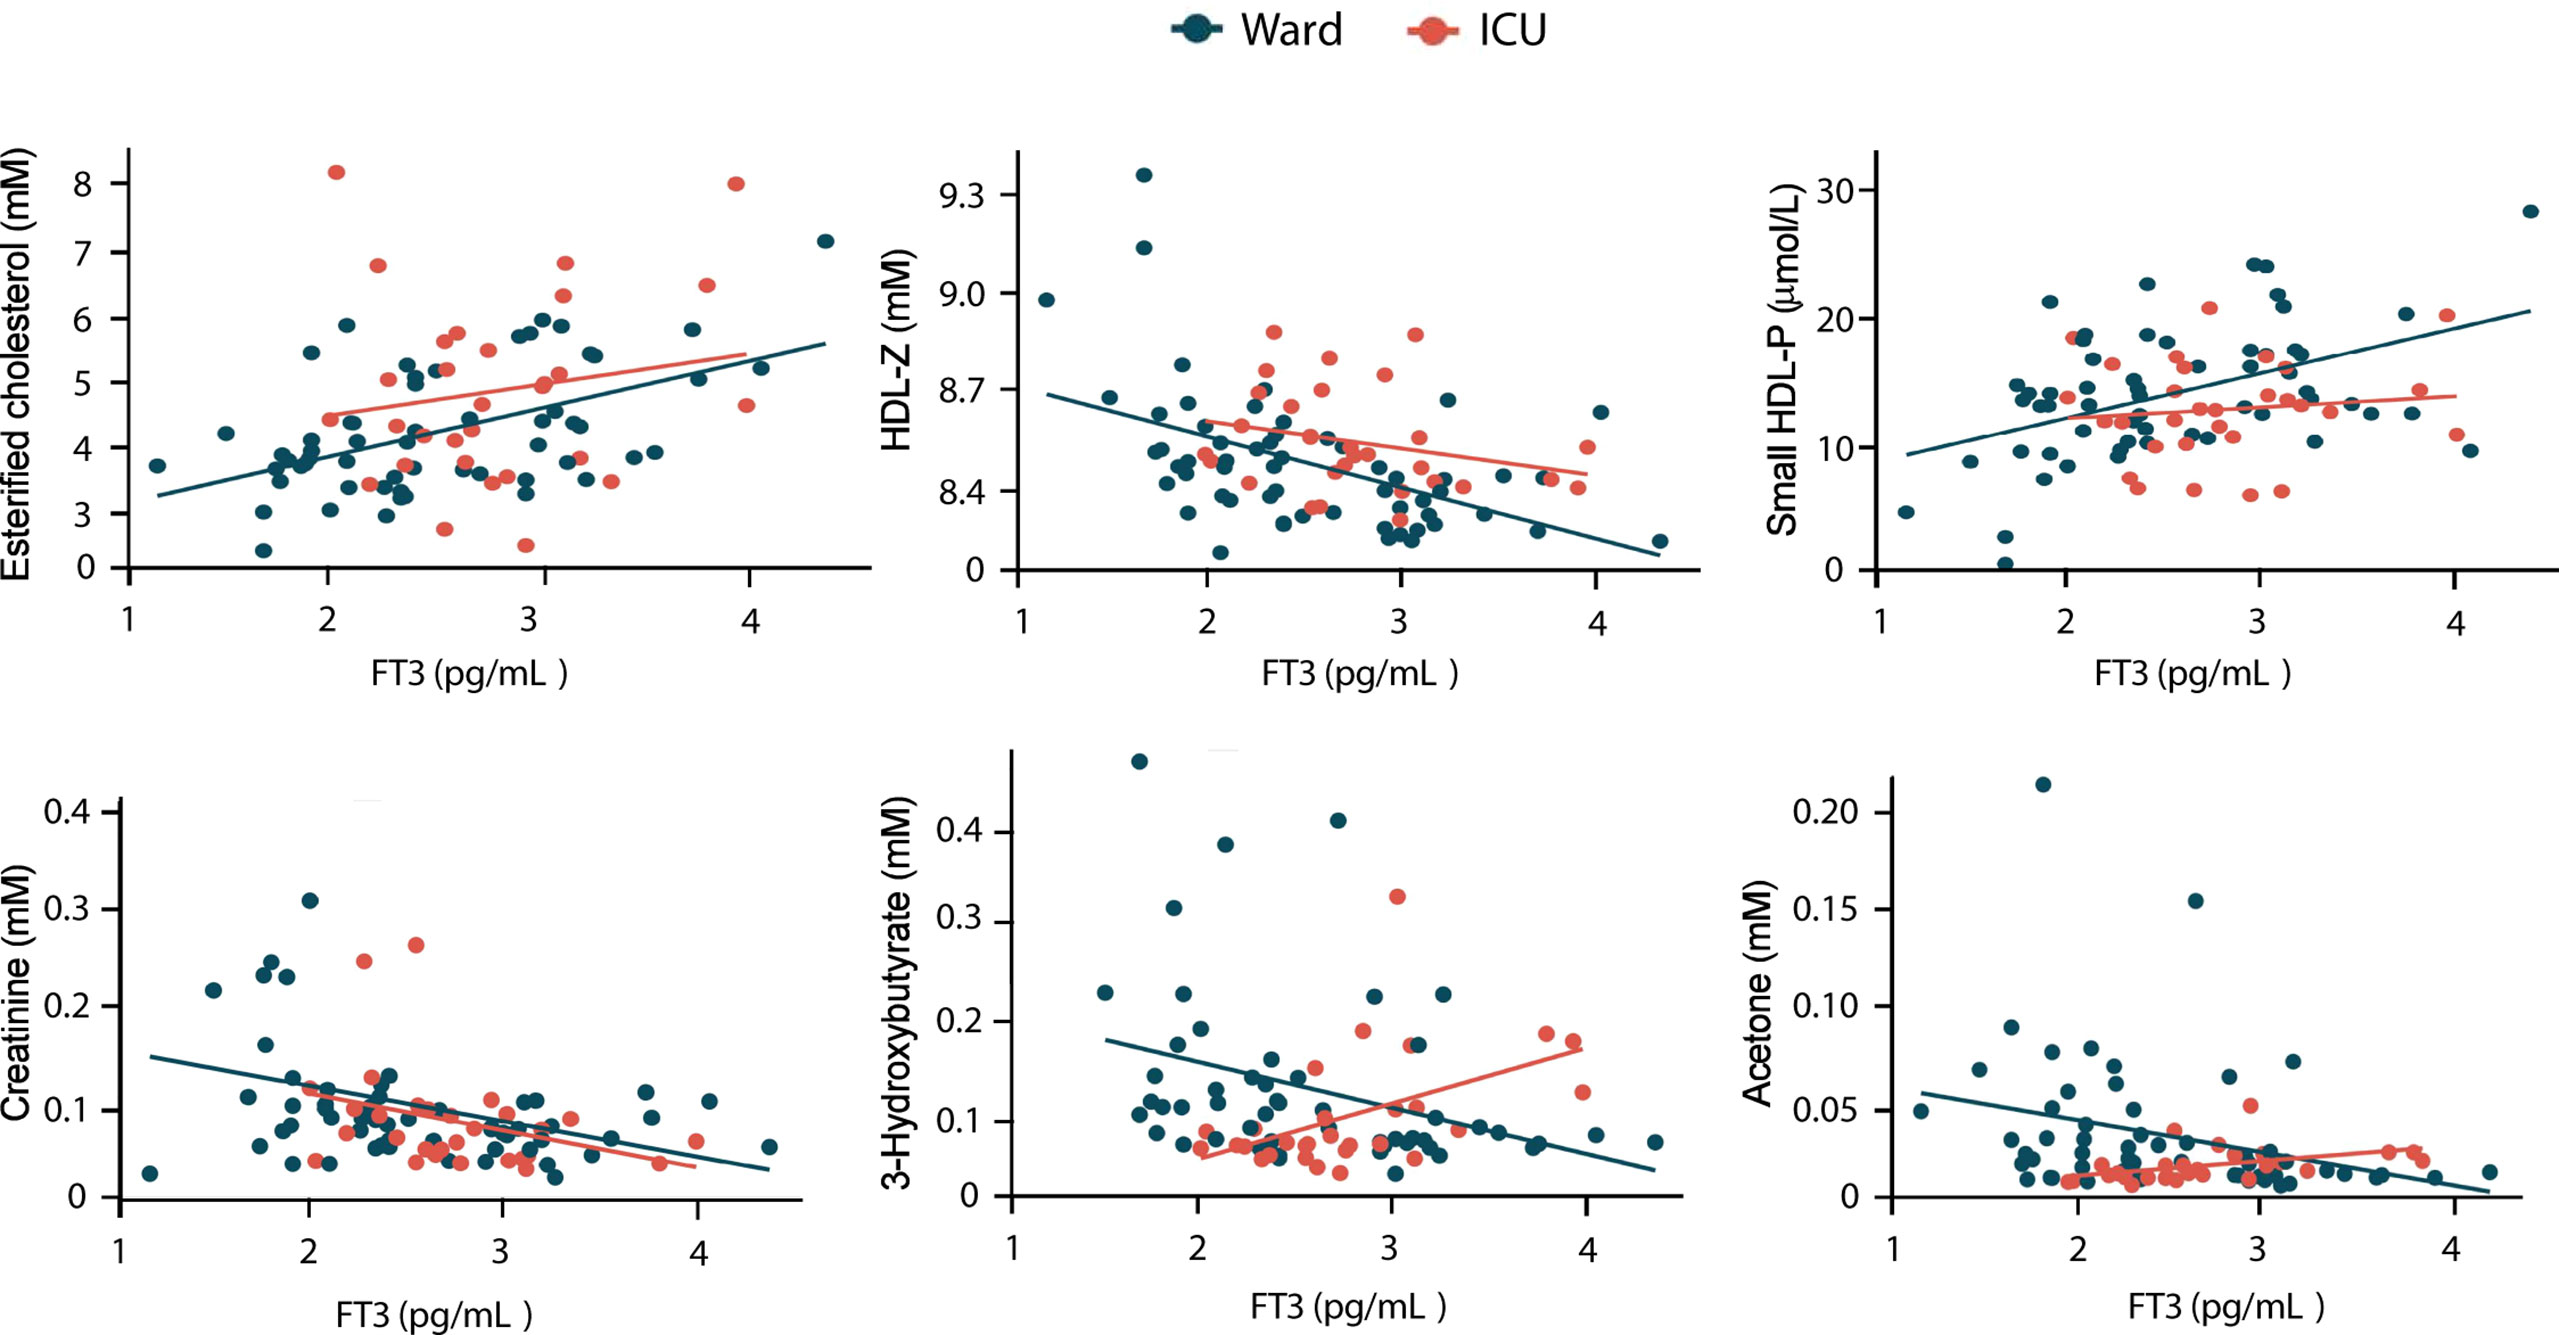
Figure 4 Correlation of metabolomic parameters with FT3 levels in hospitalized COVID-19 patients. Univariate linear regression analysis of the indicated metabolomic parameters in ward and ICU patient is shown.
Discussion
Previous studies, confirmed by our data, concluded that euthyroid and LT4-treated patients do not show significant differences in terms of COVID-19 severity and outcome (36, 37). After analysis of the different biochemical, hormonal, cytokine and metabolomic parameters between euthyroid and LT4-treated patients in the ward and in the ICU, significant differences were only found in TSH and ferritin between the two ward hospitalized groups and in TSH and FT4 between the two ICU groups. Thus, the continued administration of the usual LT4 dose allows hypothyroid patients to achieve median FT3 levels around physiological values, with no evidence for significant differences with respect to euthyroid patients during COVID-19 hospitalization. Accordingly, euthyroid and LT4-treated patients did not show evidence for significant differences in parameters such as IL-6 or some metabolites described here as FT3 dependent.
COVID-19 patients have been reported to present an euthyroid low T3 syndrome (14–21), and low FT3 has been associated to poor prognosis in COVID-19 (19, 20). In addition, age, with a higher incidence of comorbidity factors, is a poor prognosis factor in COVID-19 (2, 3). Here we show that age and FT3 levels are negatively correlated in COVID-19 patients and that parameters that predict poor prognosis are associated with low FT3, and/or with age. Therefore, age should be considered before contemplating that SARS-CoV-2 causes a low T3 syndrome. Among the different antiviral cytokines, elevated levels of IL-10 and IL-6 are predictors of COVID-19 severity (6). Both show a statistical increase in the low-FT3 group, on average 15 years older than the high-FT3 group, but only IL-6 is negatively associated to FT3 independently of age, BMI and sex, whereas IL-10 is positively related to age and independent of FT3.
It has been reported that T4 conversion to T3 in LT4 treated patients may be inefficient, especially in LT4-athyreotic patients treated with high LT4 doses, which can display a diminished FT3/FT4 ratio compared to euthyroid patients (7, 38, 39). However, our data did not show statistically significant differences in the FT3/FT4 ratio between the 4 groups of COVID-19 patients. In contrast, a significantly lower FT3/FT4 ratio was found in the low-FT3 group compared to the high-FT3 group in non-critical patients, and the low FT3/FT4 patients also show an increase of parameters that predict a worse outcome. It should be again considered that the cohorts of COVID-19 patients studied here presented a different mean age, as the patients with the lower FT3/FT4 ratio were also significantly older. This would be consistent with data previously obtained in aged patients and may reflect a decrease in T4 to T3 conversion with age, which may be part of the aging process (40).
Energy homeostasis changes dramatically during infection. The metabolic pathways sense this pathological situation producing changes in their status, as an activation of the immune system is required to mount the defense strategy. Dietary and metabolic adaptations modulated in the context of infection may increase survival of the host (41, 42). A cluster of 6 metabolic parameters, esterified cholesterol, HDL-Z, creatinine, small HDL-P, acetone and 3-hydroxybutyrate defines the metabolomic profile of non-critical hospitalized Covid-19 patients with low FT3. The higher levels of esterified cholesterol, small HDL-P HDL and lower diameter (Z) in low FT3 patients in both ward and ICU patients agrees with the fact that hypothyroidism is one the most common causes of secondary dyslipidemia (43, 44). However, acetone and 3-hydroxybutyrate, two ketogenic metabolites, showed a negative correlation with FT3 levels and also with age in non-critical hospitalized patients, but showed a positive correlation with FT3 levels not associated with age, in critical patients. The ketone bodies, acetoacetate, 3-hydroxybutyrate and acetone, a spontaneous breakdown product of acetoacetate, are products of the fatty acid metabolism serving during states of energy deficit as an alternative source of ATP (45), which is required for a proper activation of the host immune response (46). 3-Hydroxybutyrate is generated in different scenarios such as low food intake (fasting), carbohydrate restrictive diets, starvation and prolonged intense exercise (11, 47). The parental/enteral nutrition in the ICU patients should modify the source of nutrients and metabolites used to generate basal energy expenditure and to cope with the infection. 3-hydroxybutyrate is an important metabolic substrate for energy production during prolonged fasting and the generation of ketone bodies is strongly related to the amount and type of caloric intake. Caloric restriction, low FT3 and high 3-hydroxybutyrate have been proposed to be highly beneficial for adequate ageing in healthy individuals (10, 11, 47). However, in the context of an infectious process, nutrient restriction may have both pathogenic and beneficial effects. In this respect, it has been shown that different metabolic states of the host are required for an optimal response to infection, with a difference between bacterial and viral pathogens (42, 48). Here we show that in elderly COVID-19 patients with low levels of FT3, high levels of 3-hydroxybutyrate may not be a good prognostic factor.
In summary, here we show that maintaining the LT4 replacement therapy to hypothyroid patients during COVID-19 hospitalization allows them to display FT3 and FT3-dependent parameters, disease severity and outcome, with no detectable statistical differences with respect to euthyroid patients. We also evidence an inverse age-FT3 relationship in COVID-19 independent of sex and BMI. In addition, we found that non-critical hospitalized COVID-19 patients with low FT3 show higher IL-6 levels and a specific metabolomic profile with higher ketogenesis.
Data availability statement
The raw data supporting the conclusions of this article will be made available by the authors, without undue reservation.
Ethics statement
The studies involving human participants were reviewed and approved by the Institutional Ethics Committee of the Hospital Clínico San Carlos (HCSC) (n°=20/397-E_COVID). The patients/participants provided their written informed consent to participate in this study.
Author contributions
IA and JM-S collected the data from COVID-19_URG-HCSC registry. EA, SE-S, MT and SA analyzed the biobank data. VG, RB, JP-P and PO confirmed and analyzed the drug administration to the patients. CA, MT, DR-M, NA and NM-M analyzed the hormone, metabolomic and cytokine. IA, LB, AA and SA wrote the manuscript. NA, AA and SA were involved in acquisition of funding. All authors contributed to the article and approved the submitted version.
Funding
ID2020-116146RB-I00 from the Ministerio de Ciencia e Innovación with European Regional Development Funds (FEDER), BMD-3724 from the Comunidad de Madrid, 202020E169 from the CSIC, 2020PANDE00082 from the Generalitad de Cataluña and Fundación Hay Esperanza.
Acknowledgments
We thank to Elena Molina (Biobank), Henar Gonzalez (Unidad de Innovación) and to Irene Garcia (Investigación) for their involvement in this manuscript and data and to the different professionals carefully dedicated to the patients included in this study. We acknowledge support of the publication fee by the CSIC Open Access Publication Support Initiative through its Unit of Information Resources for Research (URICI).
Conflict of interest
The authors declare that the research was conducted in the absence of any commercial or financial relationships that could be construed as a potential conflict of interest.
Publisher’s note
All claims expressed in this article are solely those of the authors and do not necessarily represent those of their affiliated organizations, or those of the publisher, the editors and the reviewers. Any product that may be evaluated in this article, or claim that may be made by its manufacturer, is not guaranteed or endorsed by the publisher.
Supplementary material
The Supplementary Material for this article can be found online at: https://www.frontiersin.org/articles/10.3389/fendo.2022.1025032/full#supplementary-material
References
1. Guan WJ, Ni ZY, Hu Y, Liang WH, Ou CQ, He JX, et al. Clinical characteristics of coronavirus disease 2019 in China. N Engl J Med (2020) 382(18):1708–20. doi: 10.1056/NEJMoa2002032
2. Bhaskaran K, Bacon S, Evans SJ, Bates CJ, Rentsch CT, MacKenna B, et al. Factors associated with deaths due to covid-19 versus other causes: Population-based cohort analysis of uk primary care data and linked national death registrations within the opensafely platform. Lancet Reg Health Eur (2021) 6:100109. doi: 10.1016/j.lanepe.2021.100109
3. Williamson EJ, Walker AJ, Bhaskaran K, Bacon S, Bates C, Morton CE, et al. Factors associated with covid-19-Related death using opensafely. Nature (2020) 584(7821):430–6. doi: 10.1038/s41586-020-2521-4
4. Mudatsir M, Fajar JK, Wulandari L, Soegiarto G, Ilmawan M, Purnamasari Y, et al. Predictors of covid-19 severity: A systematic review and meta-analysis. F1000Res (2020) 9:1107. doi: 10.12688/f1000research.26186.2
5. Kong M, Zhang H, Cao X, Mao X, Lu Z. Higher level of neutrophil-to-Lymphocyte is associated with severe covid-19. Epidemiol Infect (2020) 148:e139. doi: 10.1017/S0950268820001557
6. Han H, Ma Q, Li C, Liu R, Zhao L, Wang W, et al. Profiling serum cytokines in covid-19 patients reveals il-6 and il-10 are disease severity predictors. Emerg Microbes Infect (2020) 9(1):1123–30. doi: 10.1080/22221751.2020.1770129
7. Ettleson MD, Bianco AC. Individualized therapy for hypothyroidism: Is T4 enough for everyone? J Clin Endocrinol Metab (2020) 105(9):1–15. doi: 10.1210/clinem/dgaa430
8. Mullur R, Liu YY, Brent GA. Thyroid hormone regulation of metabolism. Physiol Rev (2014) 94(2):355–82. doi: 10.1152/physrev.00030.2013
9. Yavuz S, Salgado Nunez Del Prado S, Celi FS. Thyroid hormone action and energy expenditure. J Endocr Soc (2019) 3(7):1345–56. doi: 10.1210/js.2018-00423
10. Gauthier BR, Sola-Garcia A, Caliz-Molina MA, Lorenzo PI, Cobo-Vuilleumier N, Capilla-Gonzalez V, et al. Thyroid hormones in diabetes, cancer, and aging. Aging Cell (2020) 19(11):e13260. doi: 10.1111/acel.13260
11. Stekovic S, Hofer SJ, Tripolt N, Aon MA, Royer P, Pein L, et al. Alternate day fasting improves physiological and molecular markers of aging in healthy, non-obese humans. Cell Metab (2019) 30(3):462–76.e6. doi: 10.1016/j.cmet.2019.07.016
12. Boelen A, Kwakkel J, Fliers E. Beyond low plasma T3: Local thyroid hormone metabolism during inflammation and infection. Endocr Rev (2011) 32(5):670–93. doi: 10.1210/er.2011-0007
13. Fliers E, Bianco AC, Langouche L, Boelen A. Thyroid function in critically ill patients. Lancet Diabetes Endocrinol (2015) 3(10):816–25. doi: 10.1016/S2213-8587(15)00225-9
14. Muller I, Cannavaro D, Dazzi D, Covelli D, Mantovani G, Muscatello A, et al. Sars-Cov-2-Related atypical thyroiditis. Lancet Diabetes Endocrinol (2020) 8(9):739–41. doi: 10.1016/S2213-8587(20)30266-7
15. Lania A, Sandri MT, Cellini M, Mirani M, Lavezzi E, Mazziotti G. Thyrotoxicosis in patients with covid-19: The thyrcov study. Eur J Endocrinol (2020) 183(4):381–7. doi: 10.1530/EJE-20-0335
16. Khoo B, Tan T, Clarke SA, Mills EG, Patel B, Modi M, et al. Thyroid function before, during, and after covid-19. J Clin Endocrinol Metab (2021) 106(2):e803–e11. doi: 10.1210/clinem/dgaa830
17. Gao W, Guo W, Guo Y, Shi M, Dong G, Wang G, et al. Thyroid hormone concentrations in severely or critically ill patients with covid-19. J Endocrinol Invest (2021) 44(5):1031–40. doi: 10.1007/s40618-020-01460-w
18. Lui DTW, Lee CH, Chow WS, Lee ACH, Tam AR, Fong CHY, et al. Thyroid dysfunction in relation to immune profile, disease status, and outcome in 191 patients with covid-19. J Clin Endocrinol Metab (2021) 106(2):e926–e35. doi: 10.1210/clinem/dgaa813
19. Chen M, Zhou W, Xu W. Thyroid function analysis in 50 patients with covid-19: A retrospective study. Thyroid (2021) 31(1):8–11. doi: 10.1089/thy.2020.0363
20. Dutta A, Jevalikar G, Sharma R, Farooqui KJ, Mahendru S, Dewan A, et al. Low Ft3 is an independent marker of disease severity in patients hospitalized for covid-19. Endocr Connect (2021) 10(11):1455–62. doi: 10.1530/EC-21-0362
21. Llamas M, Garo ML, Giovanella L. Low free-T3 serum levels and prognosis of covid-19: Systematic review and meta-analysis. Clin Chem Lab Med (2021) 59(12):1906–13. doi: 10.1515/cclm-2021-0805
22. Mallol R, Amigo N, Rodriguez MA, Heras M, Vinaixa M, Plana N, et al. Liposcale: A novel advanced lipoprotein test based on 2d diffusion-ordered 1h nmr spectroscopy. J Lipid Res (2015) 56(3):737–46. doi: 10.1194/jlr.D050120
23. Jeyarajah EJ, Cromwell WC, Otvos JD. Lipoprotein particle analysis by nuclear magnetic resonance spectroscopy. Clin Lab Med (2006) 26(4):847–70. doi: 10.1016/j.cll.2006.07.006
24. Fuertes-Martin R, Taverner D, Vallve JC, Paredes S, Masana L, Correig Blanchar X, et al. Characterization of (1)H nmr plasma glycoproteins as a new strategy to identify inflammatory patterns in rheumatoid arthritis. J Proteome Res (2018) 17(11):3730–9. doi: 10.1021/acs.jproteome.8b00411
25. Gomez J, Brezmes J, Mallol R, Rodriguez MA, Vinaixa M, Salek RM, et al. Dolphin: A tool for automatic targeted metabolite profiling using 1d and 2d (1)H-nmr data. Anal Bioanal Chem (2014) 406(30):7967–76. doi: 10.1007/s00216-014-8225-6
26. Wishart DS, Feunang YD, Marcu A, Guo AC, Liang K, Vazquez-Fresno R, et al. Hmdb 4.0: The human metabolome database for 2018. Nucleic Acids Res (2018) 46(D1):D608–D17. doi: 10.1093/nar/gkx1089
27. Lofgren L, Stahlman M, Forsberg GB, Saarinen S, Nilsson R, Hansson GI. The bume method: A novel automated chloroform-free 96-well total lipid extraction method for blood plasma. J Lipid Res (2012) 53(8):1690–700. doi: 10.1194/jlr.D023036
28. Barrilero R, Gil M, Amigo N, Dias CB, Wood LG, Garg ML, et al. Lipspin: A new bioinformatics tool for quantitative (1)H nmr lipid profiling. Anal Chem (2018) 90(3):2031–40. doi: 10.1021/acs.analchem.7b04148
29. Vinaixa M, Rodriguez MA, Rull A, Beltran R, Blade C, Brezmes J, et al. Metabolomic assessment of the effect of dietary cholesterol in the progressive development of fatty liver disease. J Proteome Res (2010) 9(5):2527–38. doi: 10.1021/pr901203w
30. Barbesino G. Drugs affecting thyroid function. Thyroid (2010) 20(7):763–70. doi: 10.1089/thy.2010.1635
31. Laji K, Rhidha B, John R, Lazarus J, Davies JS. Abnormal serum free thyroid hormone levels due to heparin administration. QJM (2001) 94(9):471–3. doi: 10.1093/qjmed/94.9.471
32. Hong J, Liu WY, Hu X, Chen WW, Jiang FF, Xu ZR, et al. Free triiodothyronine and free triiodothyronine to free thyroxine ratio predict all-cause mortality in patients with diabetic foot ulcers. Diabetes Metab Syndr Obes (2022) 15:467–76. doi: 10.2147/DMSO.S354754
33. Pasqualetti G, Calsolaro V, Bernardini S, Linsalata G, Bigazzi R, Caraccio N, et al. Degree of peripheral thyroxin deiodination, frailty, and long-term survival in hospitalized older patients. J Clin Endocrinol Metab (2018) 103(5):1867–76. doi: 10.1210/jc.2017-02149
34. Yuan D, Jia S, Zhu P, Zhang C, Liu Y, Liu R, et al. Usefulness of Ft3 to Ft4 ratio to predict mortality in euthyroid patients with prior cardiovascular events undergoing pci: Five-year findings from a Large single-center cohort study. Front Endocrinol (Lausanne) (2021) 12:700349. doi: 10.3389/fendo.2021.700349
35. Ilera V, Delfino LC, Zunino A, Glikman P, Drnovsek M, Reyes A, et al. Correlation between inflammatory parameters and pituitary-thyroid axis in patients with covid-19. Endocrine (2021) 74(3):455–60. doi: 10.1007/s12020-021-02863-2
36. Brix TH, Hegedus L, Hallas J, Lund LC. Risk and course of sars-Cov-2 infection in patients treated for hypothyroidism and hyperthyroidism. Lancet Diabetes Endocrinol (2021) 9(4):197–9. doi: 10.1016/S2213-8587(21)00028-0
37. van Gerwen M, Alsen M, Little C, Barlow J, Naymagon L, Tremblay D, et al. Outcomes of patients with hypothyroidism and covid-19: A retrospective cohort study. Front Endocrinol (Lausanne) (2020) 11:565. doi: 10.3389/fendo.2020.00565
38. Hoermann R, Midgley JE, Larisch R, Dietrich JW. Homeostatic control of the thyroid-pituitary axis: Perspectives for diagnosis and treatment. Front Endocrinol (Lausanne) (2015) 6:177. doi: 10.3389/fendo.2015.00177
39. Hoermann R, Midgley JE, Larisch R, Dietrich JW. Integration of peripheral and glandular regulation of triiodothyronine production by thyrotropin in untreated and thyroxine-treated subjects. Horm Metab Res (2015) 47(9):674–80. doi: 10.1055/s-0034-1398616
40. Strich D, Karavani G, Edri S, Gillis D. Tsh enhancement of Ft4 to Ft3 conversion is age dependent. Eur J Endocrinol (2016) 175(1):49–54. doi: 10.1530/EJE-16-0007
41. Kotas ME, Medzhitov R. Homeostasis, inflammation, and disease susceptibility. Cell (2015) 160(5):816–27. doi: 10.1016/j.cell.2015.02.010
42. Medzhitov R, Schneider DS, Soares MP. Disease tolerance as a defense strategy. Science (2012) 335(6071):936–41. doi: 10.1126/science.1214935
43. Rizos CV, Elisaf MS, Liberopoulos EN. Effects of thyroid dysfunction on lipid profile. Open Cardiovasc Med J (2011) 5:76–84. doi: 10.2174/1874192401105010076
44. Tsimihodimos V, Bairaktari E, Tzallas C, Miltiadus G, Liberopoulos E, Elisaf M. The incidence of thyroid function abnormalities in patients attending an outpatient lipid clinic. Thyroid (1999) 9(4):365–8. doi: 10.1089/thy.1999.9.365
45. Koeslag JH, Noakes TD, Sloan AW. Post-exercise ketosis. J Physiol (1980) 301:79–90. doi: 10.1113/jphysiol.1980.sp013190
46. Qi J, Gan L, Fang J, Zhang J, Yu X, Guo H, et al. Beta-hydroxybutyrate: A dual function molecular and immunological barrier function regulator. Front Immunol (2022) 13:805881. doi: 10.3389/fimmu.2022.805881
47. Newman JC, Verdin E. Beta-hydroxybutyrate: A signaling metabolite. Annu Rev Nutr (2017) 37:51–76. doi: 10.1146/annurev-nutr-071816-064916
Keywords: thyroid hormones, levothyroxine, age, 3-Hydroxybutyrate, cytokines, COVID-19 age, metabolism and COVID-19
Citation: Amich I, Anguita E, Escribano-Serrat S, Alvarez C, Rodríguez-Muñoz D, García V, Bello R, Peña-Pedrosa JA, Martínez-Micaelo N, Amigó N, Ortiz P, Torrejón MJ, Boscá L, Martín-Sánchez J, Aranda A and Alemany S (2022) Free triiodothyronine levels and age influences the metabolic profile and COVID-19 severity parameters in euthyroid and levothyroxine-treated patients. Front. Endocrinol. 13:1025032. doi: 10.3389/fendo.2022.1025032
Received: 22 August 2022; Accepted: 06 October 2022;
Published: 09 November 2022.
Edited by:
James Harper, Sam Houston State University, United StatesReviewed by:
Rosario Le Moli, University of Catania, ItalyDolena Ledee, University of Washington, United States
Copyright © 2022 Amich, Anguita, Escribano-Serrat, Alvarez, Rodríguez-Muñoz, García, Bello, Peña-Pedrosa, Martínez-Micaelo, Amigó, Ortiz, Torrejón, Boscá, Martín-Sánchez, Aranda and Alemany. This is an open-access article distributed under the terms of the Creative Commons Attribution License (CC BY). The use, distribution or reproduction in other forums is permitted, provided the original author(s) and the copyright owner(s) are credited and that the original publication in this journal is cited, in accordance with accepted academic practice. No use, distribution or reproduction is permitted which does not comply with these terms.
*Correspondence: Ana Aranda, YWFyYW5kYUBpaWIudWFtLmVz; Susana Alemany, c2FsZW1hbnlAaWliLnVhbS5lcw==
†These authors share first authorship