 Qingjie Chen
 Ziwen Zhang
- Department of Neurosurgery, The 902nd Hospital of The Chinese People’s Liberation Army, Bengbu, China
Objective: The purpose of this study was to examine the association between the VAI (visceral adiposity index) and stroke prevalence and age at stroke in US adults.
Methods: We examined the association between VAI and stroke prevalence and age at stroke using logistic regression, subgroup analysis, and dose-response curves using participants from the National Health and Nutrition Examination Survey (NHANES) database from 2007-2018.
Results: This study ultimately included 29,337 participants aged >20 years, of whom 1022 self-reported a history of stroke, and after adjusting for all confounders, each unit increase in corrected VAI was associated with a 12% increase in the prevalence of stroke (OR= 1.12, 95% CI: 1.01, 1.24) along with an earlier age at stroke 1.64 years (β= -1.64, 95% CI: -2.84, -0.45), stratified analysis showed that the prevalence of stroke was 20% higher in the female group (OR= 1.20, 95% CI: 1.04, 1.39), black group (OR= 1.22, 95% CI: 1.01, 1.48), age ≤60 years group (OR= 1.25, 95% CI: 1.05, 1.48), hypertensive group (OR=1.15, 95% CI:1.01, 1.31), and diabetic group (OR=1.23, 95% CI:1.02, 1.48) VAI increase was positively correlated with stroke prevalence increase. The dose-response curves showed a positive linear correlation between increased VAI and stroke prevalence, while a negative linear correlation was observed between increased VAI and age at stroke.
Conclusion: Although a causal relationship cannot be proven, higher VAI was positively associated with stroke prevalence and can lead to earlier stroke onset.
1. Introduction
Globally, stroke is the third leading cause of death and the leading contributor to persistent and acquired disability in adults. Approximately 70%-80% of strokes are ischemic strokes, with hemorrhagic strokes accounting for the remainder (1, 2). From 2009 to 2012, a survey of adults aged 20 years or older showed that the overall prevalence was about 2.6% (3). Strokes occur in about 17.8% of people over 45 years old, and asymptomatic cerebral infarction occurs in 6%-28% of those over 45 years old (4). Strokes cost the country and individuals an estimated $45.5 billion each year in 2014-2015 (5), which is a serious economic burden. Public health must take stroke prevention seriously because stroke is a major public health issue.
At present, there is evidence that metabolic syndrome is a combination of risk factors for stroke development, including atherosclerotic dyslipidemia, hypertension, insulin resistance, and obesity, all of which contribute to atherosclerotic vascular disease (6). There is a high risk of stroke and recurrent stroke for people with metabolic syndrome, according to several studies (7–9). With obesity on the rise, the prevalence of metabolic syndrome is expected to rise substantially as obesity increases in the future (10). In turn, this increase in stroke prevalence may place a heavier burden on society due to the close association between metabolic syndrome and obesity. There are limited reliable indicators of obesity that can be used to predict and assess stroke risk despite obesity being strongly associated with stroke.
Adipocytes store triglycerides in adipose tissue, which controls lipid metabolism and glucose homeostasis (11). In addition to storing energy, adipose tissue performs an active endocrine function. Numerous bioactive substances are produced in the body by fat cells, lipid-resident immune cells, and endothelial cells (12). Diabetes, hypertension, cardiovascular disease, and cardiometabolic risk factors are more closely linked to visceral adipose tissue than subcutaneous adipose tissue (13–15). Body fat can be assessed with a variety of methods, including densitometry (dual-energy X-ray absorptiometry, DXA), magnetic resonance imaging (MRI), computed tomography (CT), and mechanical methods. These methods have a high degree of accuracy in assessing body fat, and the first three methods also provide fat imaging and location within the body (16). The costs and time involved in these procedures make them unsuitable for routine use in clinical practice because they are technically complex and expensive.
An adipose tissue function indicator, the visceral adiposity index (VAI) measures the distribution of abdominal fat. Based on waist circumference (WC), body mass index (BMI), triglycerides (TG), and high density lipoprotein (HDL) cholesterol, it is a novel and specific index that indirectly measures visceral adipose function (17). Compared with traditional parameters such as waist circumference and body mass index, the VAI is said to be more sensitive and specific. There has been some progress made in the use of VAI in cardiovascular disease risk assessment associated with obesity (17–19). While it has been reported that VAI is associated with stroke, a study by Zhang et al. (20) found that VAI was positively associated with angina pectoris, heart attack, stroke, hypertension, and coronary artery disease, and a study by Cui et al. (21) found an association between VAI and sudden stroke in Chinese people. However, fewer covariates were included in Zhang and Cui’s study, and more covariates need to be included to assess the relationship. Furthermore, VAI and stroke onset age were included in the study, which has not yet been published. As a result, in this study, we set out to determine if VAI was useful in predicting stroke onset and stroke age in the US adult population.
2. Materials and methods
2.1. Study population
Based on National Health and Nutrition Examination Survey (NHANES) data collected between 2007 and 2018, we evaluated baseline clinical data from only participants over 20 years old who completed the stroke questionnaire, and we analyzed data on participants who explicitly responded to whether they had suffered a stroke. The questionnaire was completed by 59842 people. Exclusion criteria were as follows (Figure 1). Finally, 29337 cases, including 1022 self-reported stroke cases, were included in this study.
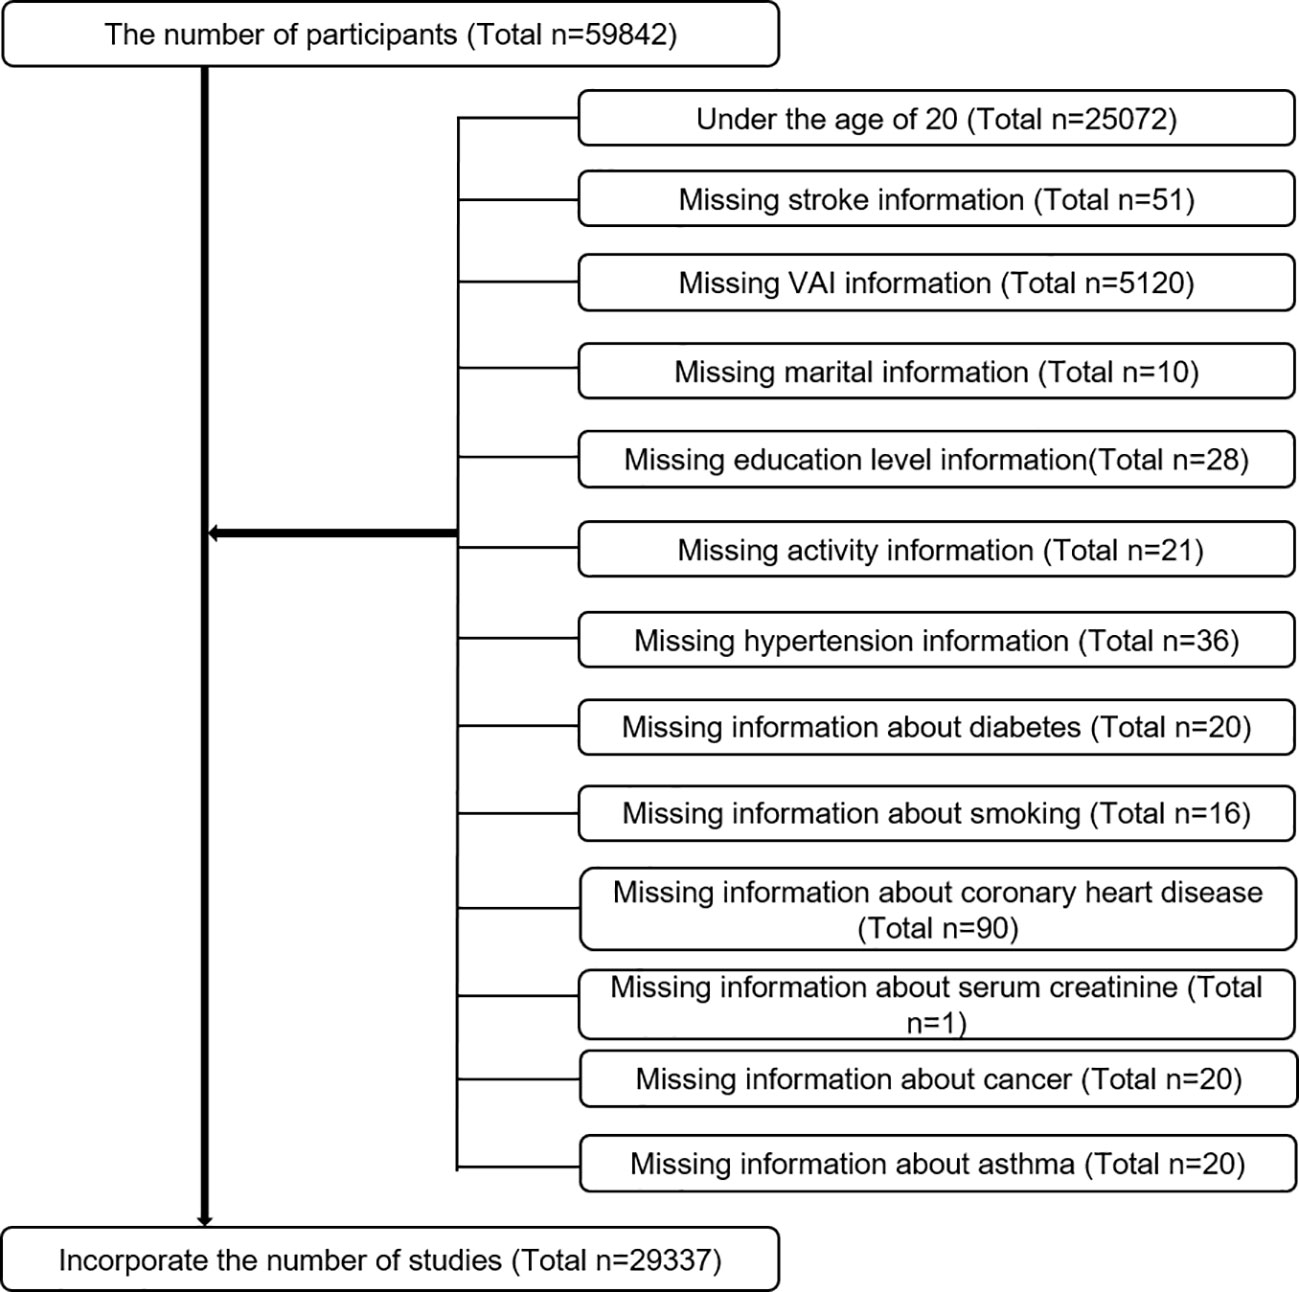
Figure 1 Sample selection process flow chart.
2.2. Data collection and definition
As an exposure variable, VAI was developed. The following sex-specific equations were used to calculate VAI, where the units for WC, BMI, and TG and HDL are cm kg/m2, and mmol/L (22). A biochemical analysis used an enzyme-based method to determine triglyceride concentrations. With the Roche Cobas 6000 chemistry analyzer and Roche Modular P chemistry analyzer, serum triglyceride concentrations were measured. Stroke presence or absence and age at stroke onset were assessed by questionnaires. The presence or absence of stroke and the age at stroke were designed as outcome variables.
Multivariate adjusted models summarized potential covariates that may confound the association between VAI and stroke. Covariates in our study included sex (male/female), age (years), race, education level, poverty to income ratio (PIR), marital status (married or living with partner/single), alcohol consumption (drinking or not), physical activity (vigorous/moderate/below moderate), cholesterol level (mg/dl), fasting glucose (mg/dl), urine protein creatinine ratio (mg/g), smoking status (smoking or not), hypertension (smoking or not), diabetes (smoking or not), coronary heart disease (smoking or not), cancers (yes or not), and dietary intake factors, including energy intake, fat intake, sugar intake, and water intake. All participants in years 2007-2018 with two 24-hour dietary recalls will have their consumption averaged based on the two recalls. The numerical variables with more missing data were converted to categorical variables, and the lowest dichotomous was used as the benchmark. The CDC has posted all detailed measurements of the study variables online at www.cdc.gov/nchs/nhanes/. All NHANES protocols were implemented in accordance with the U.S. Department of Health and Human Services (HHS) Human Research Subject Protection Policy and were reviewed and standardized annually by the NCHS Research Ethics Review Committee. All subjects who participated in the survey signed an informed consent form. All data in this study were released free of charge by NHANES without additional authorization or ethical review.
Smoking status (SMQ020 - Smoked at least 100 cigarettes in life), diabetes (DIQ010 - Doctor told you have diabetes), coronary heart disease (MCQ160C - Ever told you had coronary heart disease), and cancer (MCQ220 - Ever told you had cancer or malignancy) were obtained from the questionnaire data. Participants were considered to have the disease when they answered “yes”. For hypertension using blood pressure monitoring data from the physical examination, NHANES obtained three consecutive blood pressure readings after participants rested quietly in a seated position for 5 minutes and determined the maximum inflation level (MIL), we took the average of the three tests and converted them into categorical variables according to 140/90 mmHg, with missing values forming their own dummy variable group. The activity data was obtained from the activity questionnaire(PAQ605 - Vigorous work activity, PAQ620 - Moderate work activity, PAQ650 - Vigorous recreational activities, PAQ665 - Moderate recreational activities), when there was strenuous work or recreational activity was identified as the strenuous activity group, when there was moderate work or recreational activity was identified as the moderate activity group, and when there was none of the above activities was considered as the inactive group.
When continuous variables have a large number of missing values, we convert them to categorical variables (23, 24), where the missing values form their own group as a dummy variable group.
2.3. Statistical methods
To demonstrate the complex, multi-stage sampling design used in selecting a representative U.S. non-institutionalized population, all statistical analyses were conducted using the sampling weights, stratification, and clustering provided in the NHANES study. A weighted survey mean and 95% confidence intervals are used to express continuous variables, and a weighted survey mean and 95% confidence intervals are used to express categorical variables. Due to the skewed distributions of VAI, LN transformations are applied to transform them into normal distributions. All covariates were screened for variance inflation factor (VIF) covariance, and if the VIF value exceeded 5, the covariate was removed. As per the guidelines, multiple logistic regression models were used to explore the VAI, different VAI triplet groups, and stroke prevalence in three different models based on the Strengthening the Reporting of Observational Studies in Epidemiology (STROBE) statement (25). As far as model 1 is concerned, no adjustment for covariates was made. Several factors were adjusted in model 2, including gender, age, race, marital status, and education. Adjustments were made to all variables in model 3. To further clarify the relationship between VAI and stroke, we used a propensity score method and performed sensitivity analyses. Smoothed curve fitting (penalized spline method) and generalized additive model regression (GAM) were carried out. When a nonlinear relationship was determined to exist, likelihood ratio tests were used to determine inflection point values. Multiple regression analyses were next performed stratified by sex, age, race, hypertension, and diabetes. p < 0.05 was considered statistically significant. All analyses were performed using Empower software www.empowerstats.com (X&Y Solutions, Inc., Boston, Massachusetts, USA) and R version 4.0.2 (http://www.R-project.org, The R Foundation).
3. Results
The demographic characteristics of the included participants are shown in Table 1. The VAI was 0.72 (0.66,0.78) in the stroke group, higher than 0.56 (0.54,0.58) in the normal group, p < 0.0001. There was a significant difference between the stroke group and the normal group in the proportion of blacks, age, prevalence of hypertension, and prevalence of diabetes.
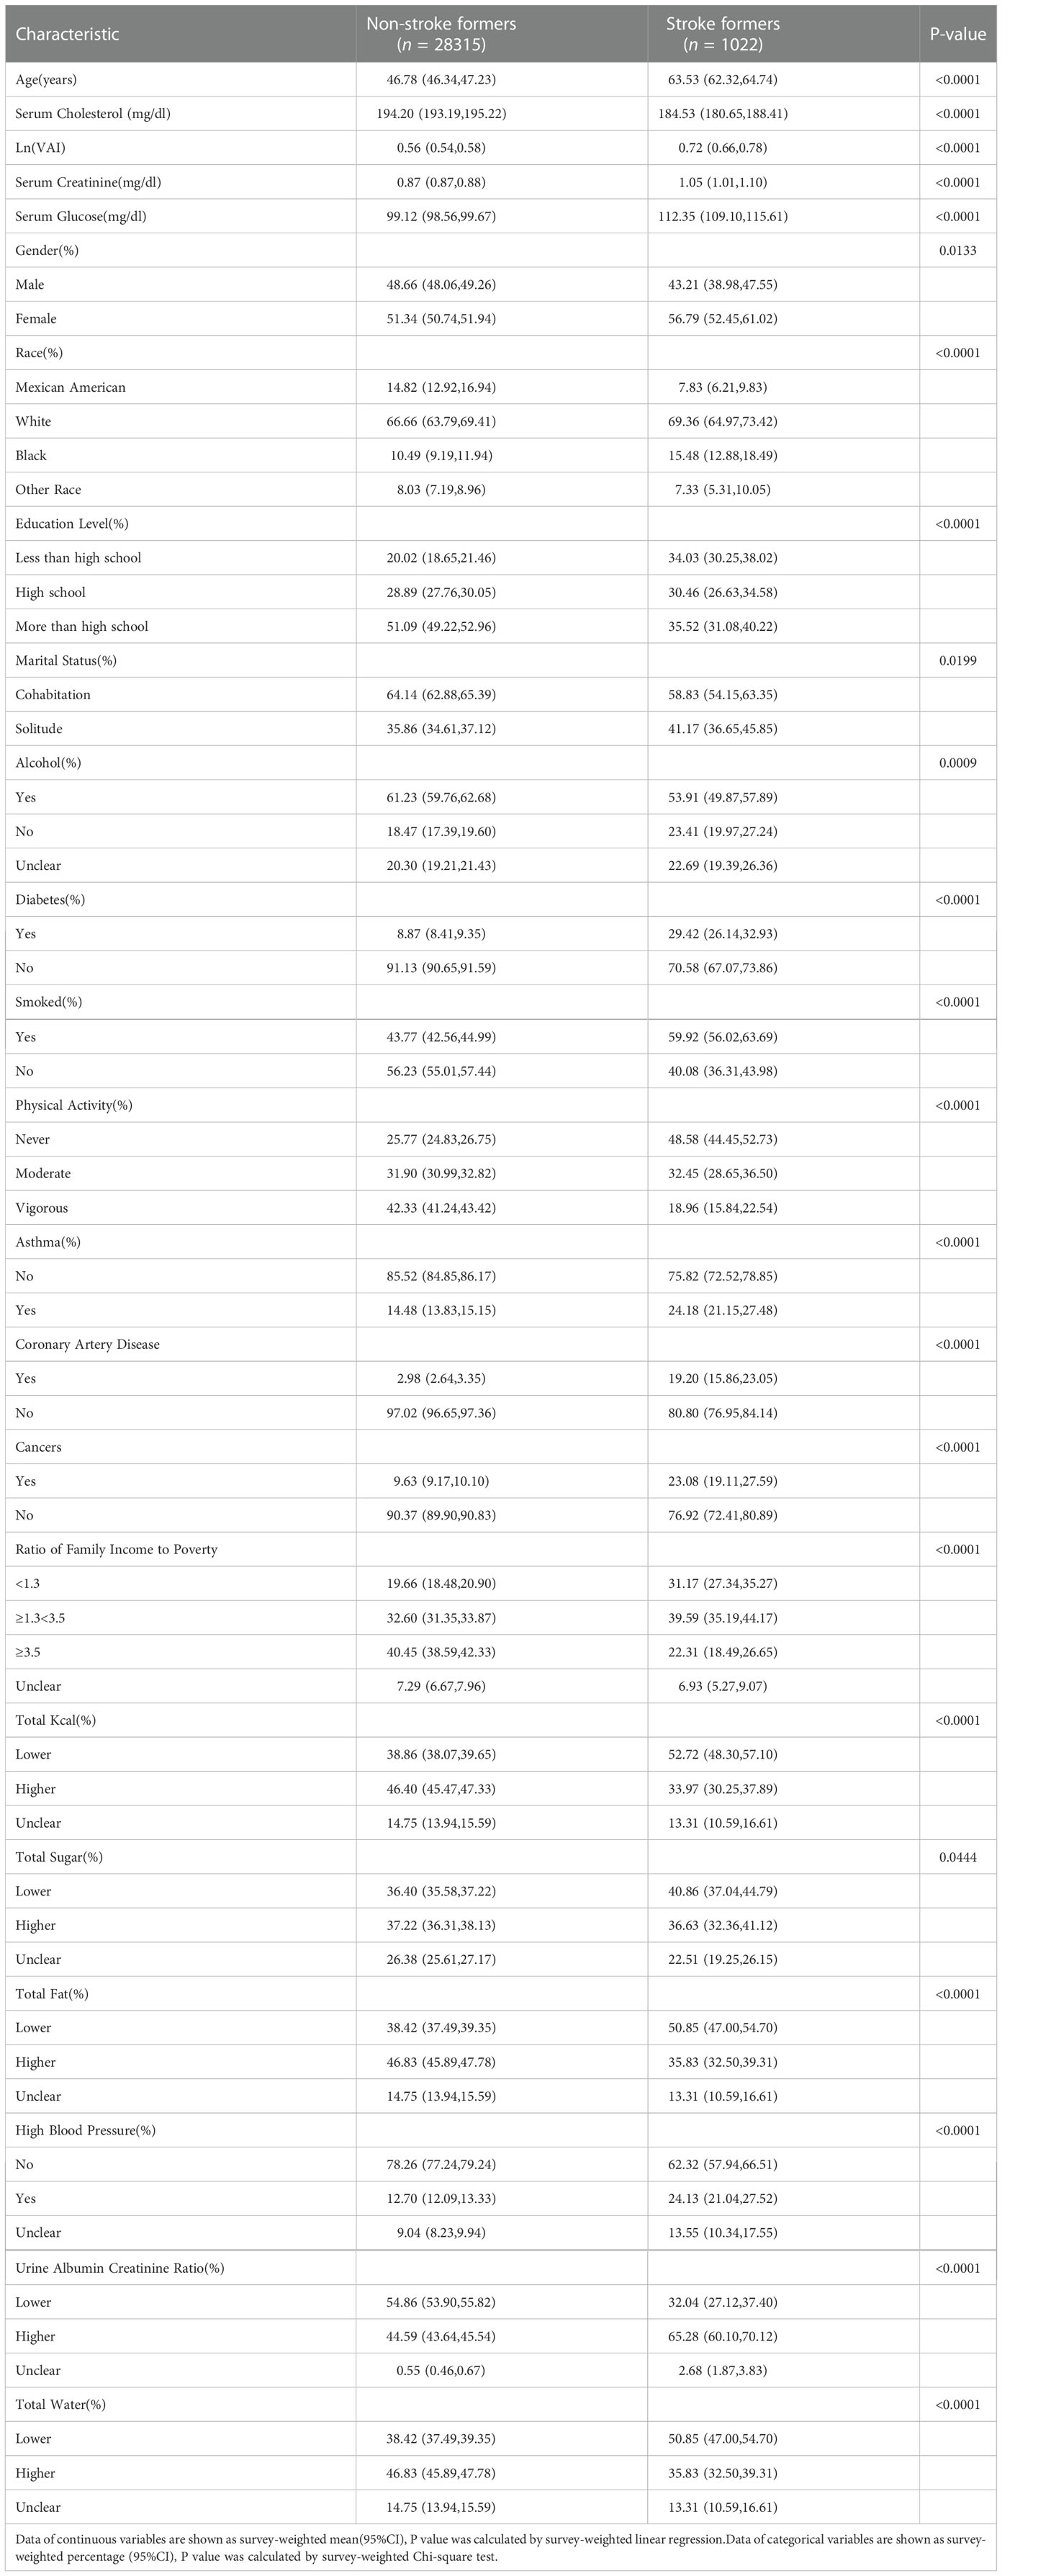
Table 1 Baseline characteristics of participants, weighted.
3.1. A higher VAI is associated with a higher prevalence of stroke
In the final adjusted model, all variables were included if the VIF for each indice was below 5. For stroke, a positive correlation was observed between the VAI and stroke prevalence. Based on the fully adjusted model (model 3), we found a positive association of 1.12 (95% confidence interval: 1.01, 1.21) between the LN-transformed VAI and stroke prevalence of 12%. Furthermore, in order to analyze sensitivity, the VAI was transformed into a categorical variable (dichotomous). Increased prevalence of stroke in high dichotomies compared to the lowest VAI dichotomous group, but there was no effect value (OR=1.10, 95% CI: 0.95, 1.28). (Table 2). Each unit increase in VAI value after propensity matching was associated with a 29% increase in adjusted stroke prevalence (OR=1.29,95% CI:1.14,1.47) (Supplementary Tables 1, 2).
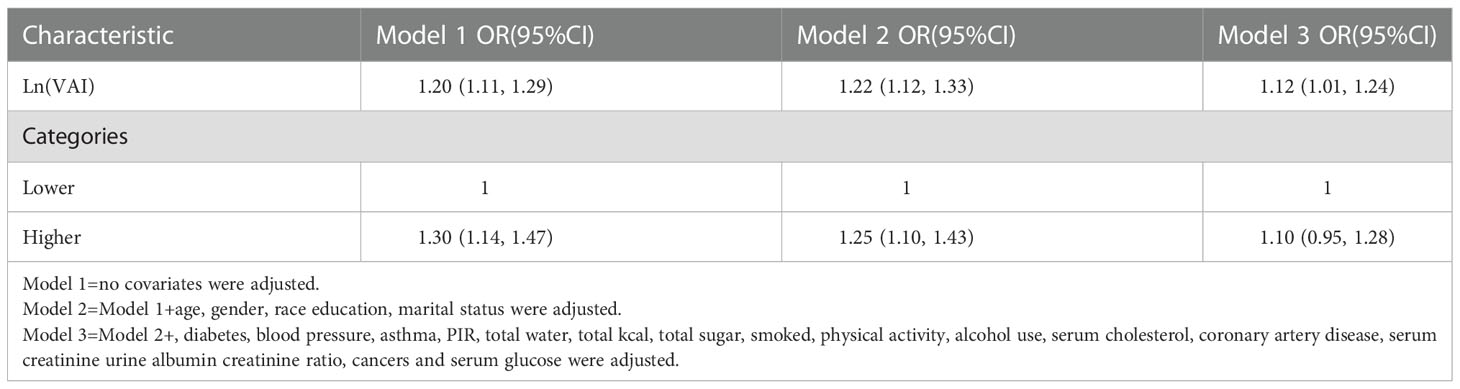
Table 2 Analysis between VAI with stroke prevalence.
3.2. Analysis of the dose-response and threshold effects of VAI on stroke prevalence
A generalized additive model and smoothed curve fitting were used to investigate the relationship between the VAI and stroke prevalence. According to our findings (Figure 2), stroke prevalence was linearly related to the VAI.
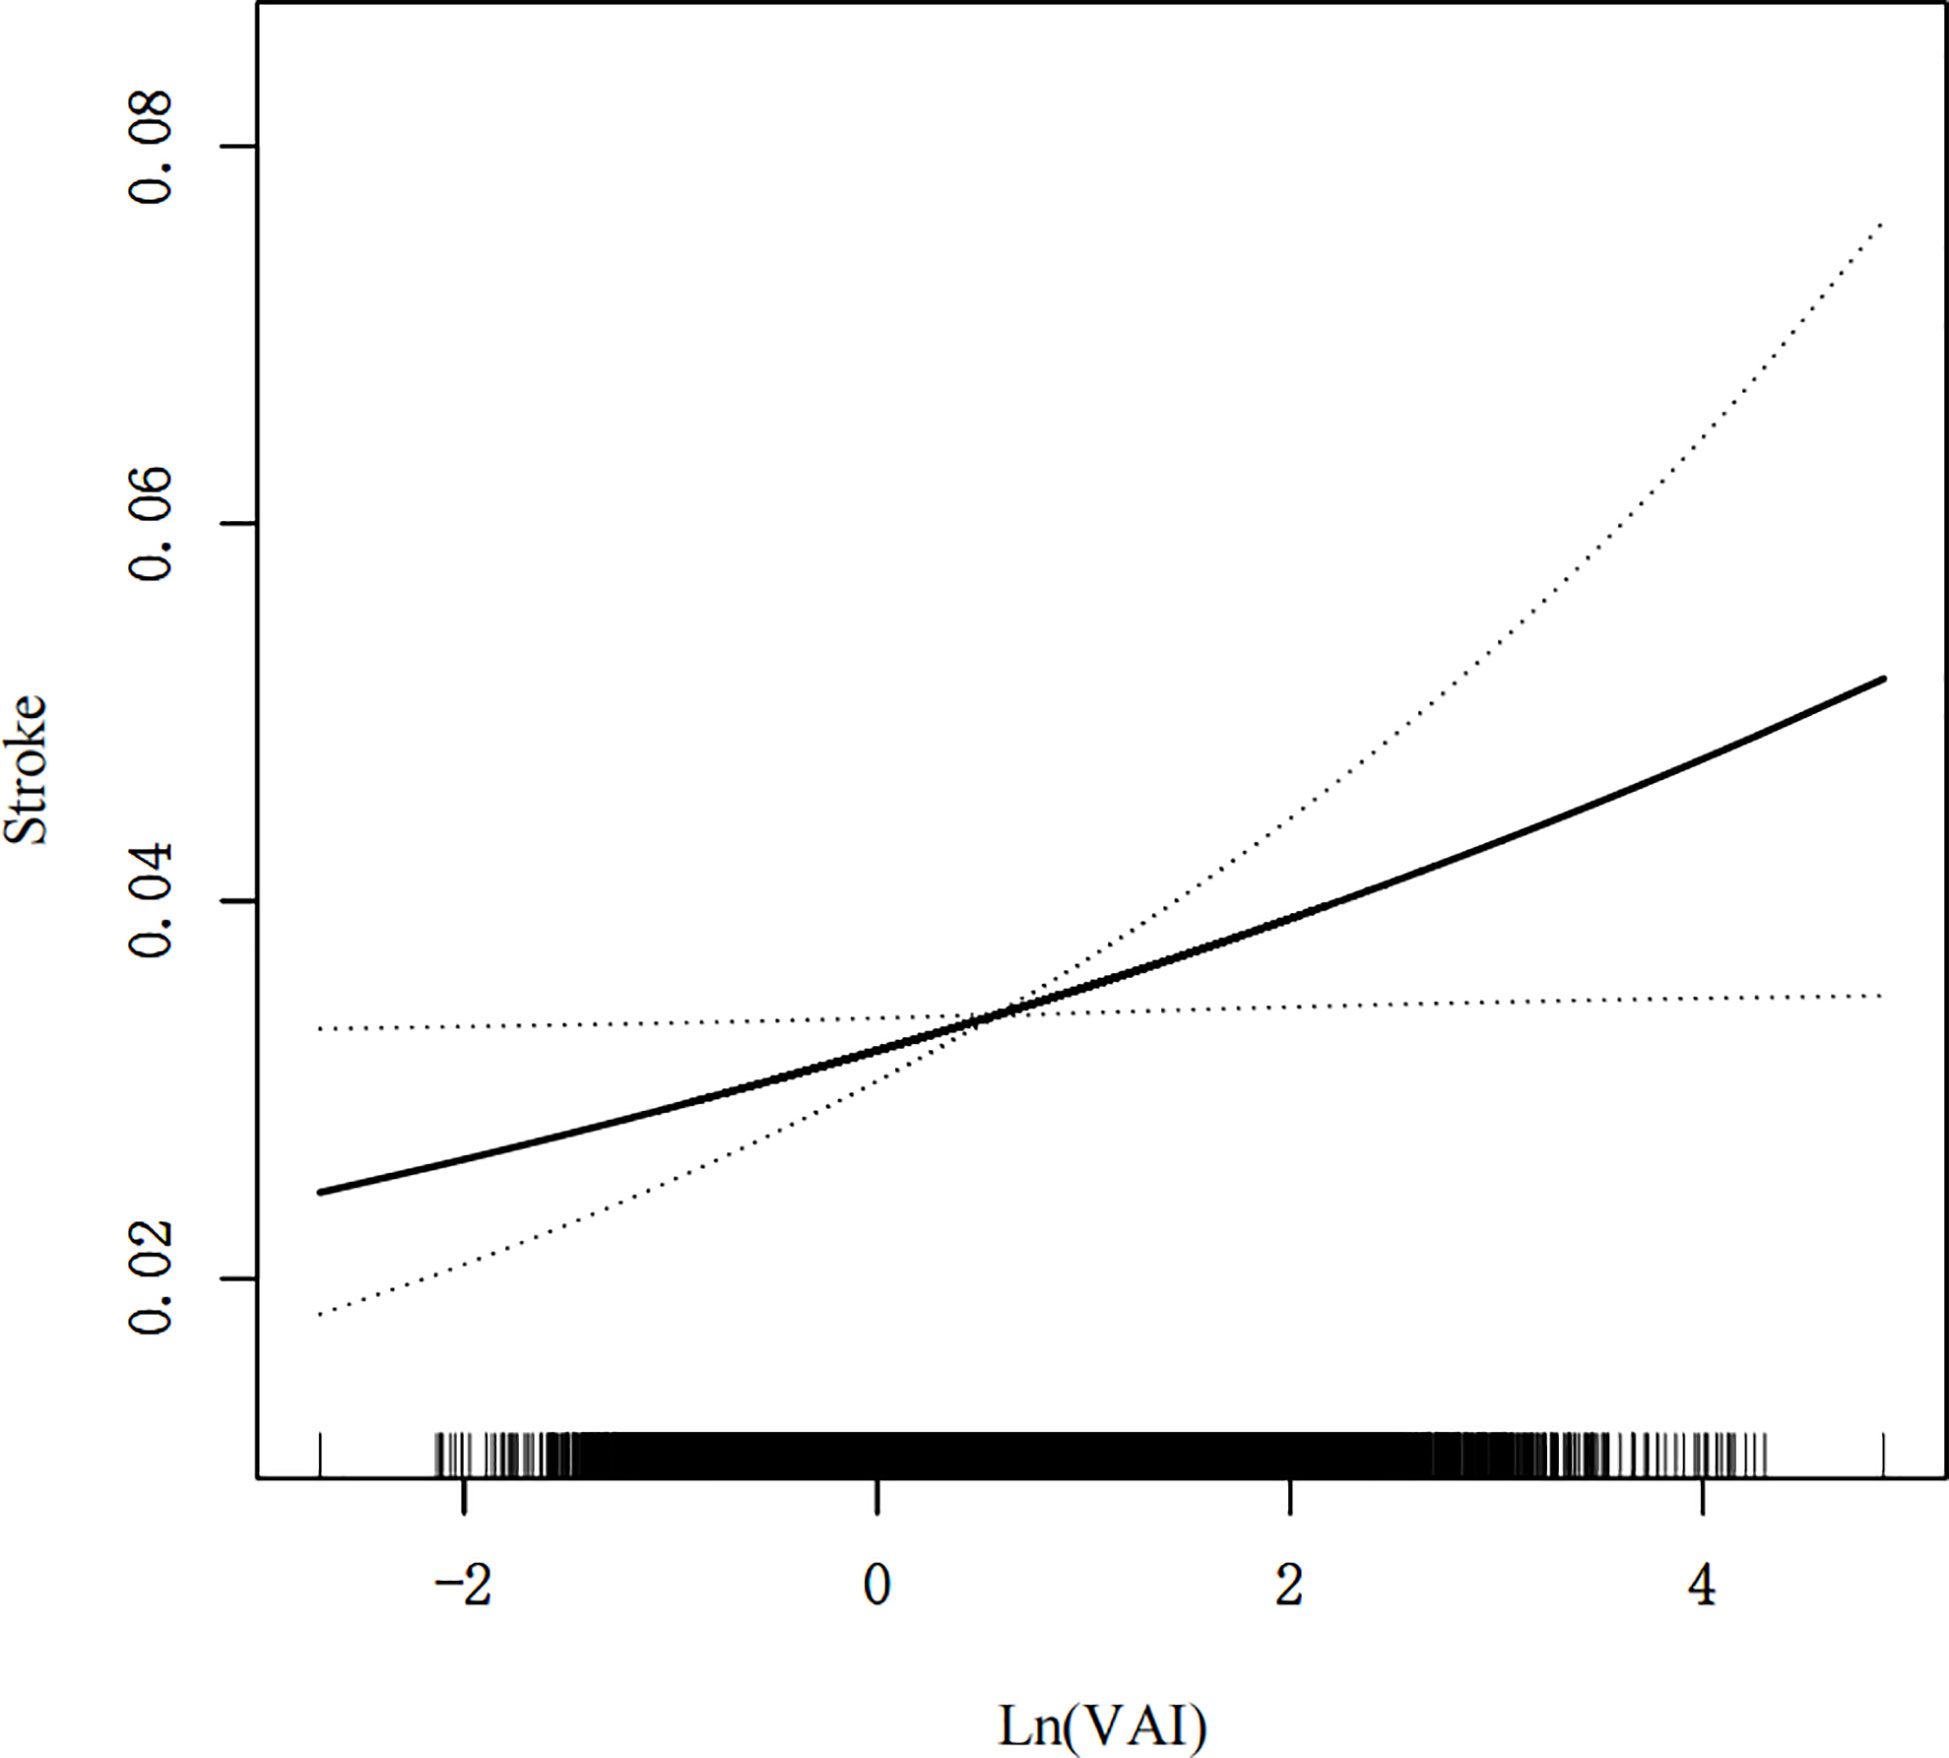
Figure 2 Density dose-response relationship between VAI with stroke prevalence. The area between the upper and lower dashed lines is represented as 95% CI. Each point shows the magnitude of the VAI and is connected to form a continuous line. Adjusted for all covariates except effect modifier.
3.2.1. Subgroup analysis
Subgroup analyses were performed to assess the robustness of the association between VAI and stroke prevalence. The results showed that in the subgroup analysis the VAI indices in the female group (OR=1.15, 95% CI: 1.01, 1.24), black group (OR=1.22, 95% CI:1.01, 1.48), age ≤60 years group (OR=1.25, 95% CI:1.05, 1.48), hypertension group (OR=1.15, 95% CI:1.01, 1.31), and diabetes group (OR=1.23, 95% CI:1.02, 1.48) VAI increase were all positively associated with increased prevalence of stroke. (Table 3).
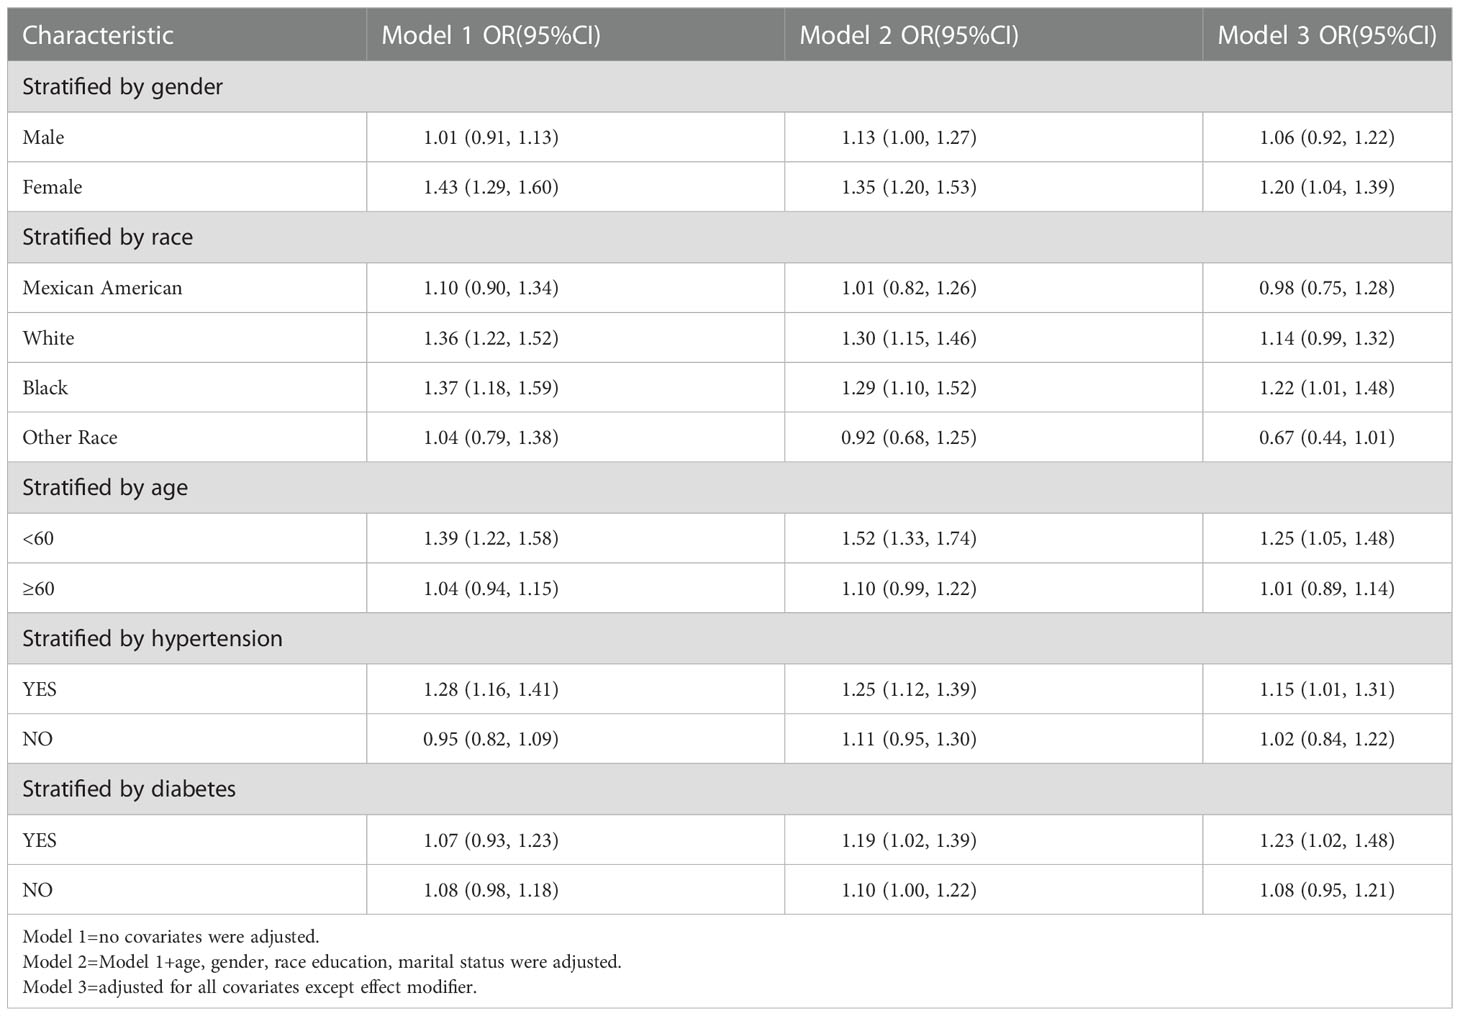
Table 3 Subgroup analysis between VAI with stroke prevalence.
3.3. Elevated VAI and earlier age of stroke onset
Using the fully adjusted model 3, for every one unit increase in Ln (VAI), stroke onset age was 1.64 years earlier (OR=-1.64, 95% CI: -2.84, -0.45) (Table 4).

Table 4 Analysis between VAI with stroke age onset.
3.4. Analysis of the dose response and threshold effect of VAI on age at stroke onset
A generalized additive model and smoothed curve fitting were used to examine the relationship between the VAI and age at stroke onset. Based on our results, VAI increased with increasing age at stroke onset in a negative linear relationship (Figure 3).
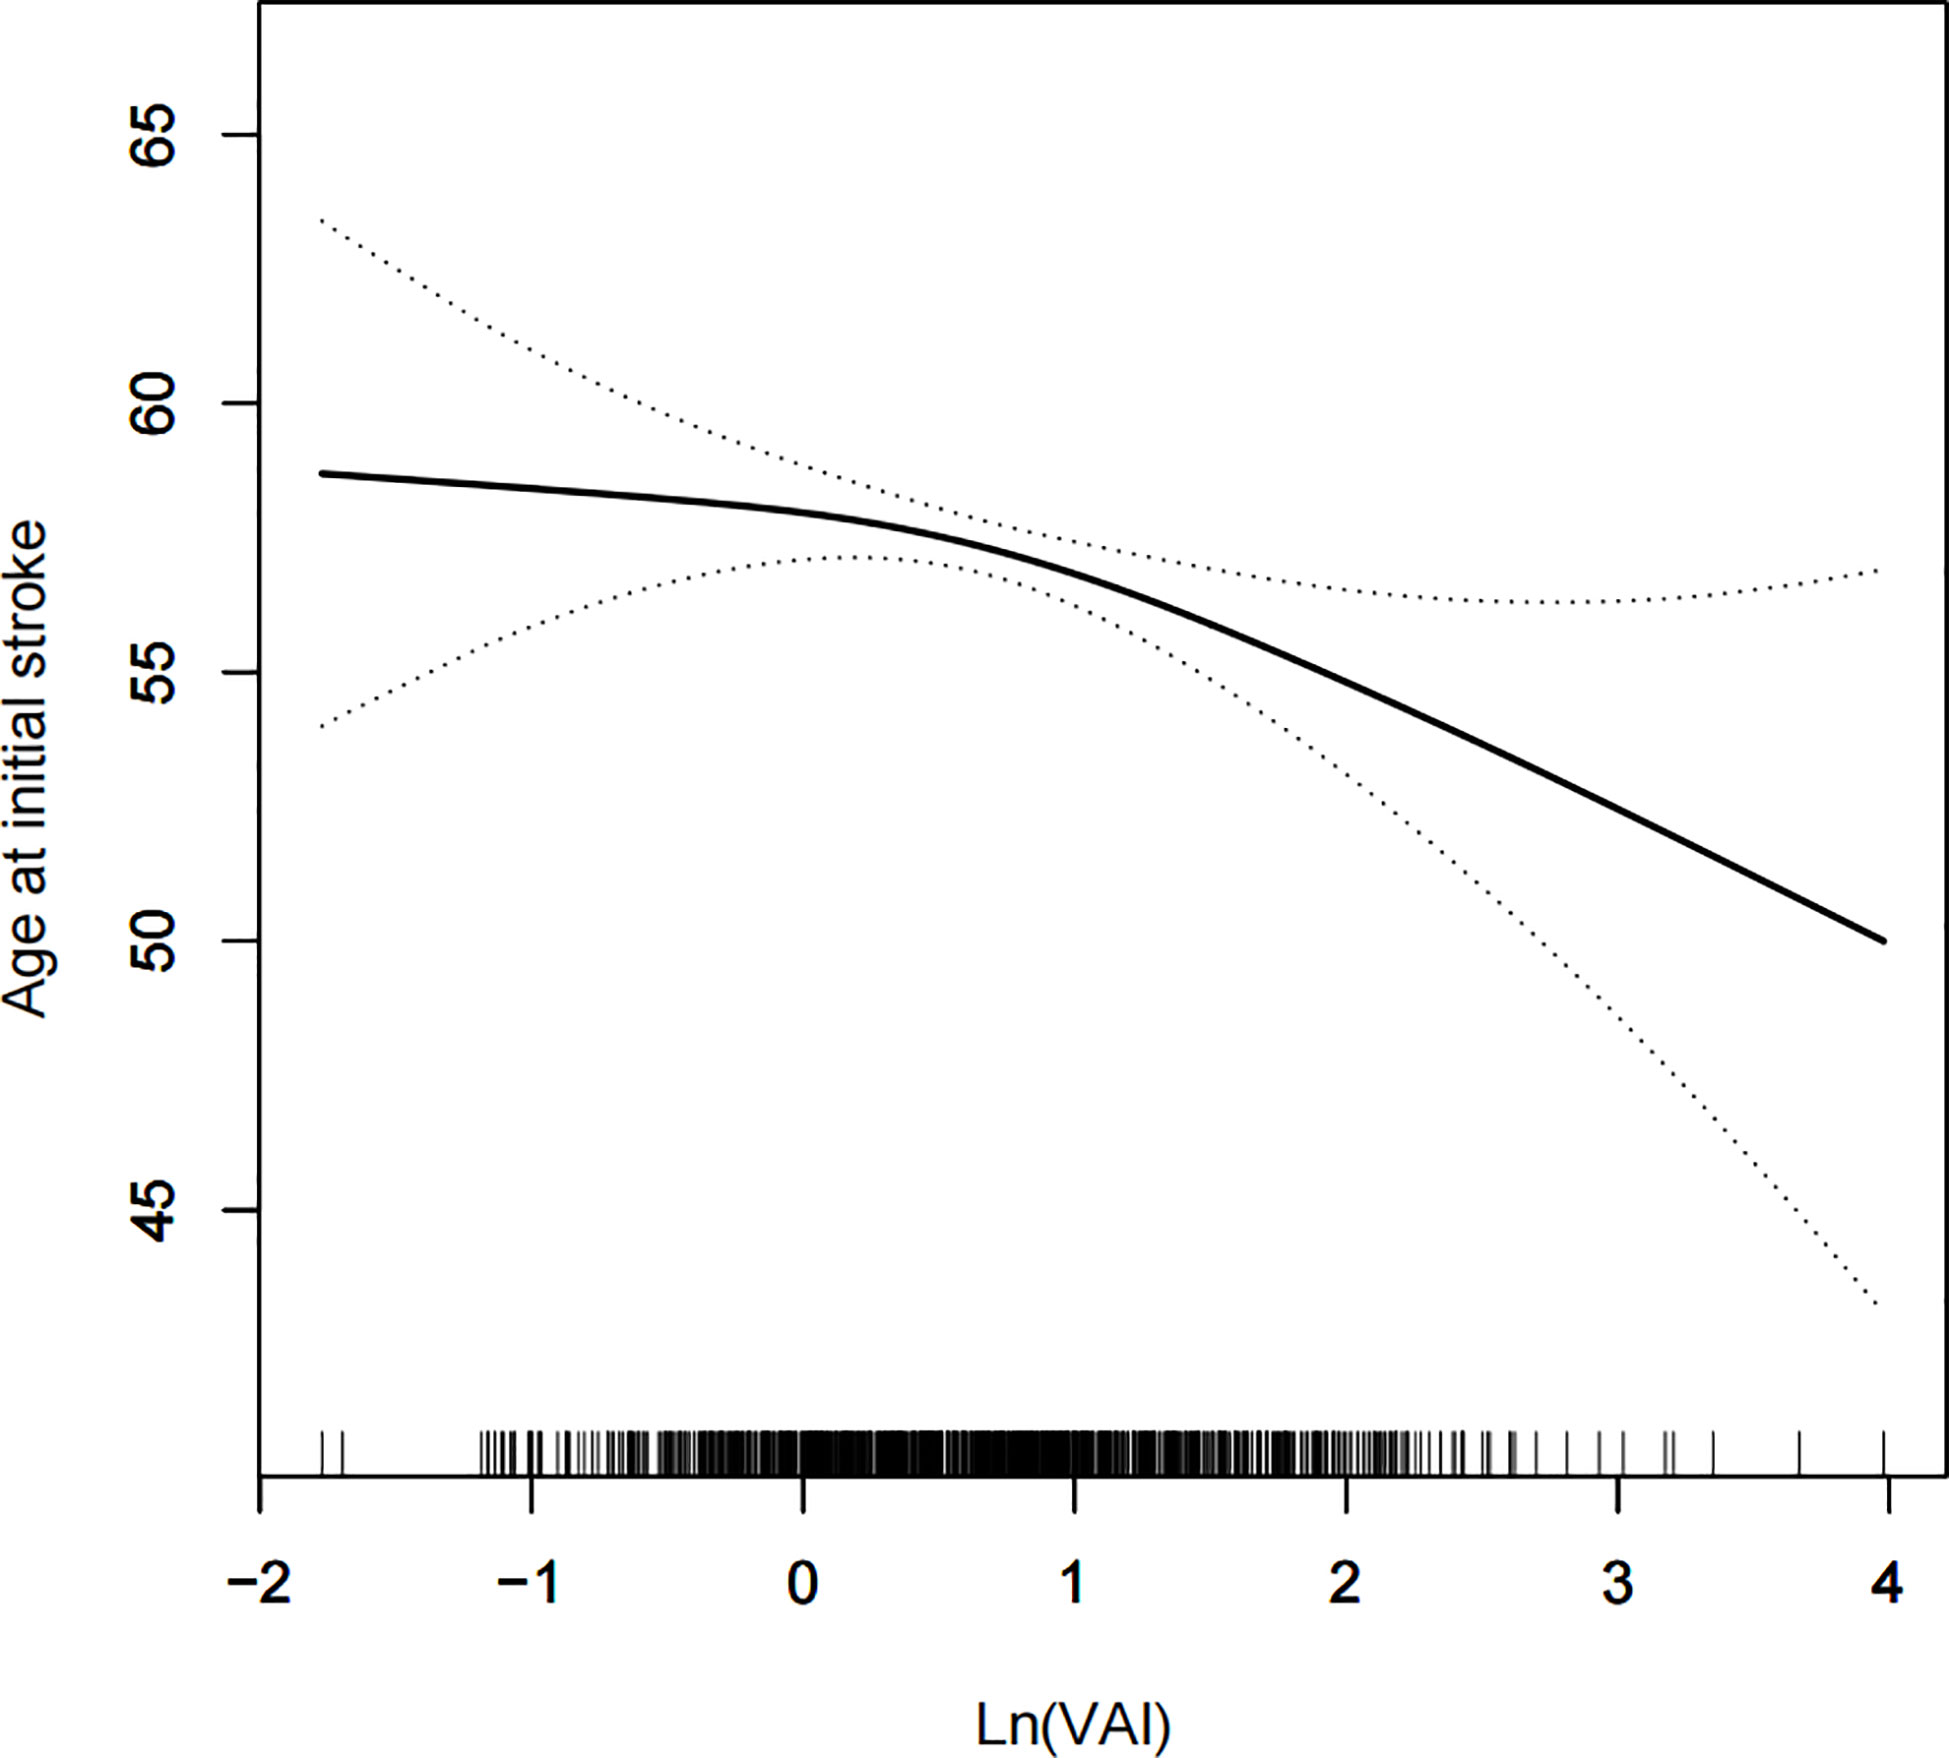
Figure 3 Density dose-response relationship between VAI with onset age of stroke. The area between the upper and lower dashed lines is represented as 95% CI. Each point shows the magnitude of the VAI and is connected to form a continuous line. Adjusted for all covariates except effect modifier.
4. Discussion
As a result of industrialization and urbanization, there has been an increase in the consumption of food and lifestyle, suggesting that these changes are risk factors for stroke development (26, 27) . Thus, epidemiological studies of stroke onset associated with metabolic syndrome are reasonable. As well, VAI is more sensitive and specific than traditional waist circumference and BMI for obesity (18, 19, 28) . Therefore, in this study, we investigated the relationship between VAI levels and stroke in a large U.S. population and found that after adjusting for all confounders, increased VAI levels were positively correlated with stroke prevalence, and age at stroke was negatively correlated with increased VAI levels. The age of first stroke onset was 1.64 years earlier with each unit increase in VAI after correction, and the prevalence of stroke increased 12% after correction.
Stroke affects both physical and mental health severely, placing an immense burden on our society in terms of morbidity, quality of life, and healthcare costs. These pressures continue to rise throughout the world, making stroke prevention particularly crucial. The VAI can also be used to find specific populations adapted to the index and prevent strokes from occurring more often. Consequently, we performed subgroup analyses on females, blacks, those aged >60, hypertensives, and diabetics and found elevated VAI levels were positively associated with increased stroke prevalence. According to several previous related studies, we suspect this finding to be accurate. As previously reported, VAI differences have been found in correlation studies of atherosclerosis, cardiovascular disease, and asymptomatic cerebral infarction (17, 21, 29–31) . A study by Li et al (32) showed that women with VAI were associated with intracranial atherosclerosis, but not men. The findings of Nakagomi (33) also indicate that VAI increases atherosclerosis in women and the association is stronger. As well as predicting cardiometabolic disease in older women, VAI has been found useful in cardiovascular disease studies - a score of 2.71 can be used to identify high-risk women (34). Based on the same study by Mohammadreza (35), women were independently at an increased risk of cardiovascular disease after VAI. According to a Korean study published in 2020, high VAI levels were associated with an increased risk of asymptomatic cerebral infarction in healthy females, particularly (36). Nakagomi (33) speculates that the possible explanation for the above findings is either differences in hormone levels between men and women or differences in the composition of visceral adipose tissue and subcutaneous adipose tissue. However, the etiologic mechanism behind these findings remains unclear. As a result of our study, VAI has a greater effect on stroke risk among younger people than those older than 60 years of age. So far, it seems that young and middle-aged individuals have different risk factors for stroke compared to elderly individuals. Atherosclerosis (including atrial fibrillation), hypertension and diabetes mellitus are the three most common risk factors in the elderly (37). Among young and middle-aged stroke patients, dyslipidemia, smoking and hypertension are the most prevalent vascular risk factors (38–40), while VAI levels are also affected by dyslipidemia, which makes it possible to predict stroke prevalence in young and middle-aged individuals. It is well known that stroke risk differs by race and ethnicity, and in younger populations these differences are even more pronounced. It is important to note that variations in prevalence are largely determined by the racial composition of the study population. There was an increased prevalence of strokes among young Hispanics and blacks in the Northern Manhattan study (41). The hospitalization rate for stroke was significantly higher among young blacks and Hispanics in another Florida study (42). A second study from American Point found that young and middle-aged blacks had up to five times the stroke risk, compared to young and middle-aged whites. Blacks had an increased prevalence of stroke due to the elevated VAI found in our study, which may explain the increased prevalence of stroke among blacks. The increased prevalence of stroke in populations with hypertension and diabetes is not surprising given that both of these factors are known to be risk factors for stroke (43).
In terms of mortality, stroke is one of the top three causes of death worldwide, as well as one of the leading causes of disability. If stroke continues for a longer period of time, the risk of a second stroke increases, as does the poorer prognosis. The long-term socioeconomic consequences of stroke in young patients are also significant. According to a recent study, young stroke patients spend an average of $34,886 in hospitalization for ischemic stroke, $150,307 for subarachnoid hemorrhage, and $94,482 for cerebral hemorrhage (44). The correlation between VAI and age at first stroke was another important finding in this study. As a consequence of our results, every unit increase in VAI will result in a 1.64 year increase in the age of stroke onset. VAI was linearly correlated negatively with age at first stroke even when smoothing curves were fitted. This finding is heartening and has not yet been reported. It is hypothesized that treating and managing VAI levels at younger ages can reduce the risk of stroke. However, the veracity of the present results may be limited by the sample size and needs to be further confirmed by a multicenter prospective study with a large sample.
Several advantages are associated with our study. An extensive quality assurance and quality control process is followed by the NHANES 2007-2018 sample, which represents a representative sample of the U.S. population. Secondly, we adjusted for confounding covariates to ensure our results were reliable and applicable to a wide range of individuals. Our study does, however, have some limitations. We were unable to establish a causal relationship between VAI and stroke due to the fact that we used the NHANES database, a cross-sectional study. In addition, the data on medication history and stroke type classification were not disclosed in the database, which may have contributed to recall bias. Third, the diagnosis of stroke was made by means of a questionnaire, which can be subject to recall bias. It is noteworthy that the present study showed that VAI is associated with stroke onset and, for the first time, evaluated its role in age at first stroke onset.
5. Summary
The VAI is associated with higher stroke prevalence and a younger age at first stroke. Although the causal relationship between VAI management and stroke occurrence cannot be clearly established, we hypothesize that managing VAI levels at a younger age may reduce the occurrence of strokes and delay stroke onset.
Data availability statement
The original contributions presented in the study are included in the article/Supplementary Materials, further inquiries can be directed to the corresponding author.
Ethics statement
The studies involving human participants were reviewed and approved by NCHS Research Ethics Review Committee. The patients/participants provided their written informed consent to participate in this study.
Author contributions
QC: Conceptualization, Methodology, Software. ZZ: Data curation, Writing original draft. NL: Visualization, Investigation. YQ: Writing - review & editing. All authors contributed to the article and approved the submitted version.
Acknowledgments
We would like to thank all NHANES participants and staff.
Conflict of interest
The authors declare that the research was conducted in the absence of any commercial or financial relationships that could be construed as a potential conflict of interest.
Publisher’s note
All claims expressed in this article are solely those of the authors and do not necessarily represent those of their affiliated organizations, or those of the publisher, the editors and the reviewers. Any product that may be evaluated in this article, or claim that may be made by its manufacturer, is not guaranteed or endorsed by the publisher.
Supplementary material
The Supplementary Material for this article can be found online at: https://www.frontiersin.org/articles/10.3389/fendo.2022.1086936/full#supplementary-material
Abbreviations
NHANES, National Health and Nutrition Examination Survey; BMI, body mass index; PIR, ratio of family income to poverty; NCHS, National Center for Health Statistics; CI, confidence interval; OR, odds ratio; MetS, metabolic syndrome; IR, insulin resistance; TG, triglyceride; TC, Cholesterol; FPG, fasting plasma glucose, VAI, visceral adiposity index.
References
1. Hume AW, Tasker RA. Endothelin-1-Induced ischemic damage and functional impairment is mediated primarily by NR2B-containing NMDA receptors. Neurotox Res (2020) 37:349–55. doi: 10.1007/s12640-019-00138-3
2. Barthels D, Das H. Current advances in ischemic stroke research and therapies. Biochim Biophys Acta Mol Basis Dis (2020) 1866:165260. doi: 10.1016/j.bbadis.2018.09.012
3. Carroll CB, Barrett KM. Cardioembolic stroke. Continuum (Minneap Minn). (2017) 23:111–32. doi: 10.1212/CON.0000000000000419
4. Howard VJ, McClure LA, Meschia JF, Pulley L, Orr SC, Friday GH. High prevalence of stroke symptoms among persons without a diagnosis of stroke or transient ischemic attack in a general population: the REasons for geographic and racial differences in stroke (REGARDS) study. Arch Intern Med (2006) 166:1952–8. doi: 10.1001/archinte.166.18.1952
5. Virani SS, Alonso A, Benjamin EJ, Bittencourt MS, Callaway CW, Carson AP, et al. Heart disease and stroke statistics-2020 update: A report from the American heart association. Circulation (2020) 141:e139–139e596. doi: 10.1161/CIR.0000000000000757
6. Towfighi A, Ovbiagele B. Metabolic syndrome and stroke. Curr Diabetes Rep (2008) 8:37–41. doi: 10.1007/s11892-008-0008-z
7. Lucke-Wold BP, Logsdon AF, Turner RC, Rosen CL, Huber JD. Aging, the metabolic syndrome, and ischemic stroke: redefining the approach for studying the blood-brain barrier in a complex neurological disease. Adv Pharmacol (2014) 71:411–49. doi: 10.1016/bs.apha.2014.07.001
8. Morovatdar N, Di Napoli M, Stranges S, Thrift AG, Kapral M, Behrouz R, et al. Regular physical activity postpones age of occurrence of first-ever stroke and improves long-term outcomes. Neurol Sci (2021) 42:3203–10. doi: 10.1007/s10072-020-04903-7
9. Liang Y, Yan Z, Hao Y, Wang Q, Zhang Z, She R, et al. Metabolic syndrome in patients with first-ever ischemic stroke: prevalence and association with coronary heart disease. Sci Rep (2022) 12:13042. doi: 10.1038/s41598-022-17369-8
10. Wafa HA, Wolfe C, Emmett E, Roth GA, Johnson CO, Wang Y. Burden of stroke in Europe: Thirty-year projections of incidence, prevalence, deaths, and disability-adjusted life years. Stroke (2020) 51:2418–27. doi: 10.1161/STROKEAHA.120.029606
11. Heymsfield SB, Wadden TA. Mechanisms, pathophysiology, and management of obesity. N Engl J Med (2017) 376:254–66. doi: 10.1056/NEJMra1514009
12. Ray I, Mahata SK, De RK. Obesity: An immunometabolic perspective. Front Endocrinol (Lausanne). (2016) 7:157. doi: 10.3389/fendo.2016.00157
13. Koenen M, Hill MA, Cohen P, Sowers JR. Obesity, adipose tissue and vascular dysfunction. Circ Res (2021) 128:951–68. doi: 10.1161/CIRCRESAHA.121.318093
14. Stefan N. Causes, consequences, and treatment of metabolically unhealthy fat distribution. Lancet Diabetes Endocrinol (2020) 8:616–27. doi: 10.1016/S2213-8587(20)30110-8
15. Sorimachi H, Obokata M, Takahashi N, Reddy Y, Jain CC, Verbrugge FH, et al. Pathophysiologic importance of visceral adipose tissue in women with heart failure and preserved ejection fraction. Eur Heart J (2021) 42:1595–605. doi: 10.1093/eurheartj/ehaa823
16. Andreoli A, Garaci F, Cafarelli FP, Guglielmi G. Body composition in clinical practice. Eur J Radiol (2016) 85:1461–8. doi: 10.1016/j.ejrad.2016.02.005
17. Amato MC, Giordano C, Galia M, Criscimanna A, Vitabile S, Midiri M, et al. Visceral adiposity index: a reliable indicator of visceral fat function associated with cardiometabolic risk. Diabetes Care (2010) 33:920–2. doi: 10.2337/dc09-1825
18. Bergman RN, Stefanovski D, Buchanan TA, Sumner AE, Reynolds JC, Sebring NG, et al. A better index of body adiposity. Obes (Silver Spring). (2011) 19:1083–9. doi: 10.1038/oby.2011.38
19. Ashwell M, Gunn P, Gibson S. Waist-to-height ratio is a better screening tool than waist circumference and BMI for adult cardiometabolic risk factors: systematic review and meta-analysis. Obes Rev (2012) 13:275–86. doi: 10.1111/j.1467-789X.2011.00952.x
20. Zhang Y, He Q, Zhang W, Xiong Y, Shen S, Yang J, et al. Non-linear associations between visceral adiposity index and cardiovascular and cerebrovascular diseases: Results from the NHANES (1999-2018). Front Cardiovasc Med (2022) 9:908020. doi: 10.3389/fcvm.2022.908020
21. Cui C, He C, Sun Q, Xu Z, Li Q, Yue S, et al. Association between visceral adiposity index and incident stroke: Data from the China health and retirement longitudinal study. Nutr Metab Cardiovasc Dis (2022) 32:1202–9. doi: 10.1016/j.numecd.2022.01.031
22. Amato MC, Giordano C. Visceral adiposity index: an indicator of adipose tissue dysfunction. Int J Endocrinol (2014) 2014:730827. doi: 10.1155/2014/730827
23. Wang J, Yang J, Chen Y, Rui J, Xu M, Chen M. Association of METS-IR index with prevalence of gallbladder stones and the age at the first gallbladder stone surgery in US adults: A cross-sectional study. Front Endocrinol (Lausanne). (2022) 13:1025854. doi: 10.3389/fendo.2022.1025854
24. Hou B, Shen X, He Q, Chen Y, Xu Y, Chen M, et al. Is the visceral adiposity index a potential indicator for the risk of kidney stones. Front Endocrinol (Lausanne). (2022) 13:1065520. doi: 10.3389/fendo.2022.1065520
25. von Elm E, Altman DG, Egger M, Pocock SJ, Gøtzsche PC, Vandenbroucke JP. The strengthening the reporting of observational studies in epidemiology (STROBE) statement: guidelines for reporting observational studies. Int J Surg (2014) 12:1495–9. doi: 10.1016/j.ijsu.2014.07.013
26. Lock K, Smith RD, Dangour AD, Keogh-Brown M, Pigatto G, Hawkes C, et al. Health, agricultural, and economic effects of adoption of healthy diet recommendations. Lancet (2010) 376:1699–709. doi: 10.1016/S0140-6736(10)61352-9
27. Dans A, Ng N, Varghese C, Tai ES, Firestone R, Bonita R. The rise of chronic non-communicable diseases in southeast Asia: time for action. Lancet (2011) 377:680–9. doi: 10.1016/S0140-6736(10)61506-1
29. Özbek M, Çalapkulu M, Hepşen S, Sencar ME, Bostan H, Öztürk Üİ, et al. The visceral adiposity index, lipid accumulation product, and plasma atherogenic index are associated with subclinical atherosclerosis in patients with newly diagnosed acromegaly. Turk J Med Sci (2021) 51:2600–6. doi: 10.3906/sag-2104-346
30. Cao J, Liu S, Xie H, Zhang Y, Zeng Y. The relationship between the visceral adiposity index and carotid atherosclerosis in different genders and age groups. Saudi Med J (2022) 43:169–76. doi: 10.15537/smj.2022.43.2.20210824
31. Kouli GM, Panagiotakos DB, Kyrou I, Georgousopoulou EN, Chrysohoou C, Tsigos C, et al. Visceral adiposity index and 10-year cardiovascular disease incidence: The ATTICA study. Nutr Metab Cardiovasc Dis (2017) 27:881–9. doi: 10.1016/j.numecd.2017.06.015
32. Li R, Li Q, Cui M, Ying Z, Li L, Zhong T, et al. Visceral adiposity index, lipid accumulation product and intracranial atherosclerotic stenosis in middle-aged and elderly Chinese. Sci Rep (2017) 7:7951. doi: 10.1038/s41598-017-07811-7
33. Nakagomi A, Sunami Y, Kawasaki Y, Fujisawa T, Kobayashi Y. Sex difference in the association between surrogate markers of insulin resistance and arterial stiffness. J Diabetes Complications. (2020) 34:107442. doi: 10.1016/j.jdiacomp.2019.107442
34. Dereziński T, Zozulińska-Ziółkiewicz D, Uruska A, Dąbrowski M. Visceral adiposity index as a useful tool for the assessment of cardiometabolic disease risk in women aged 65 to 74. Diabetes Metab Res Rev (2018) 34:e3052. doi: 10.1002/dmrr.3052
35. Mohammadreza B, Farzad H, Davoud K, Fereidoun Prof AF. Prognostic significance of the complex "Visceral adiposity index" vs. simple anthropometric measures: Tehran lipid and glucose study. Cardiovasc Diabetol (2012) 11:20. doi: 10.1186/1475-2840-11-20
36. Nam KW, Kwon HM, Jeong HY, Park JH, Kwon H, Jeong SM, et al. Visceral adiposity index is associated with silent brain infarct in a healthy population. Sci Rep (2020) 10:17271. doi: 10.1038/s41598-020-74454-6
37. Smajlović D, Salihović D, Ibrahimagić OC, Sinanović O. Characteristics of stroke in young adults in tuzla canton, Bosnia and Herzegovina. Coll Antropol (2013) 37:515–9.
38. Putaala J, Metso AJ, Metso TM, Konkola N, Kraemer Y, Haapaniemi E, et al. Analysis of 1008 consecutive patients aged 15 to 49 with first-ever ischemic stroke: the Helsinki young stroke registry. Stroke (2009) 40:1195–203. doi: 10.1161/STROKEAHA.108.529883
39. Zhang YN, He L. [Risk factors study of ischemic stroke in young adults in southwest China]. Sichuan Da Xue Xue Bao Yi Xue Ban. (2012), 43:553–7.
40. Wu TY, Kumar A, Wong EH. Young ischaemic stroke in south Auckland: a hospital-based study. N Z Med J (2012), 125:47–56.
41. Jacobs BS, Boden-Albala B, Lin IF, Sacco RL. Stroke in the young in the northern Manhattan stroke study. Stroke (2002) 33:2789–93. doi: 10.1161/01.str.0000038988.64376.3a
42. Pathak EB, Sloan MA. Recent racial/ethnic disparities in stroke hospitalizations and outcomes for young adults in Florida, 2001-2006. Neuroepidemiology (2009) 32:302–11. doi: 10.1159/000208795
43. Smajlović D. Strokes in young adults: epidemiology and prevention. Vasc Health Risk Manage (2015) 11:157–64. doi: 10.2147/VHRM.S53203
Keywords: stroke prevalence, stroke onset age, VAI, cross-sectional study, metabolic syndrome
Citation: Chen Q, Zhang Z, Luo N and Qi Y (2023) Elevated visceral adiposity index is associated with increased stroke prevalence and earlier age at first stroke onset: Based on a national cross-sectional study. Front. Endocrinol. 13:1086936. doi: 10.3389/fendo.2022.1086936
Received: 01 November 2022; Accepted: 28 December 2022;
Published: 16 January 2023.
Edited by:
Carmine Izzo, University of Salerno, ItalyReviewed by:
Yasith Mathangasinghe, University of Colombo, Sri LankaHan-Yeong Jeong, Seoul National University Hospital, Republic of Korea
Copyright © 2023 Chen, Zhang, Luo and Qi. This is an open-access article distributed under the terms of the Creative Commons Attribution License (CC BY). The use, distribution or reproduction in other forums is permitted, provided the original author(s) and the copyright owner(s) are credited and that the original publication in this journal is cited, in accordance with accepted academic practice. No use, distribution or reproduction is permitted which does not comply with these terms.
*Correspondence: Yilong Qi, cWl5aWxvbmczMjExMUBhbGl5dW4uY29t