 Ardavan Farhadi
 Yan Liu
 Chang Xu1
 Xiaodan Wang
 Erchao Li
- 1Key Laboratory of Tropical Hydrobiology and Biotechnology of Hainan Province, Hainan Aquaculture Breeding Engineering Research Center, College of Marine Sciences, Hainan University, Haikou, Hainan, China
- 2School of Life Sciences, East China Normal University, Shanghai, China
The renin-angiotensin system (RAS) is a hormonal system that plays an important role in the regulation of blood pressure and cardiovascular homeostasis in mammals. In fishes, the RAS pathway participates in osmoregulation and salinity adaptation. However, the role of the RAS pathway in invertebrates, particularly in crustaceans, remains unknown. In this study, four key genes of the RAS pathway (LV-ACE, LV-APN, LV-AT1R, and LV-RR) were cloned, characterized, and their expression levels were detected in the eyestalk, hepatopancreas, and muscle of Litopenaeus vannamei during long-term and short-term low salinity stress. The results showed that LV-ACE, LV-APN, LV-AT1R, and LV-RR encode 666, 936, 175, and 323 amino acids, respectively. Low salinity stress downregulated the expression levels of LV-ACE, LV-APN, LV-AT1R, and LV-RR in L. vannamei, indicating that the RAS pathway was suppressed under low salinity. Moreover, these genes play important roles in the regulation of drinking rate, controlling urine output, blood glucose, and blood pressure, indicating that their downregulation probably affected the homeostasis of shrimps. These findings provide novel insights into the mechanism of salinity adaptation in L. vannamei.
Introduction
The renin-angiotensin system (RAS) is a hormonal system that modulates blood pressure and cardiovascular homeostasis in vertebrates (1). A reduction in blood pressure induces the release of renin from the juxtaglomerular apparatus cells of the kidney into the cardiovascular system. In this process, renin cleaves the precursor protein angiotensinogen (AGT) into angiotensin I. Later, angiotensin-converting enzyme (ACE) cleaves angiotensin I at the carboxyl end to synthesize angiotensin II. Angiotensin II is known to be one of the main active peptides in this pathway. Angiotensin II affects the organs and tissues that modulate blood pressure by renal reabsorption of sodium and water and systemic vasoconstriction (2). To exert its biological functions, angiotensin II must bind to AT1R and AT2R receptors. It seems that the AT1R receptor regulates the main physiological functions of angiotensin II related to osmoregulation and fluid balance. In contrast, the AT2R receptor is associated with cellular remodeling processes, and stimulation of the AT2R receptor has suppressive effects on the cardiovascular system Aminopeptidase N (APN) converts angiotensin III to angiotensin IV (3). A simplified view of the RAS pathway is presented in Figure 1.
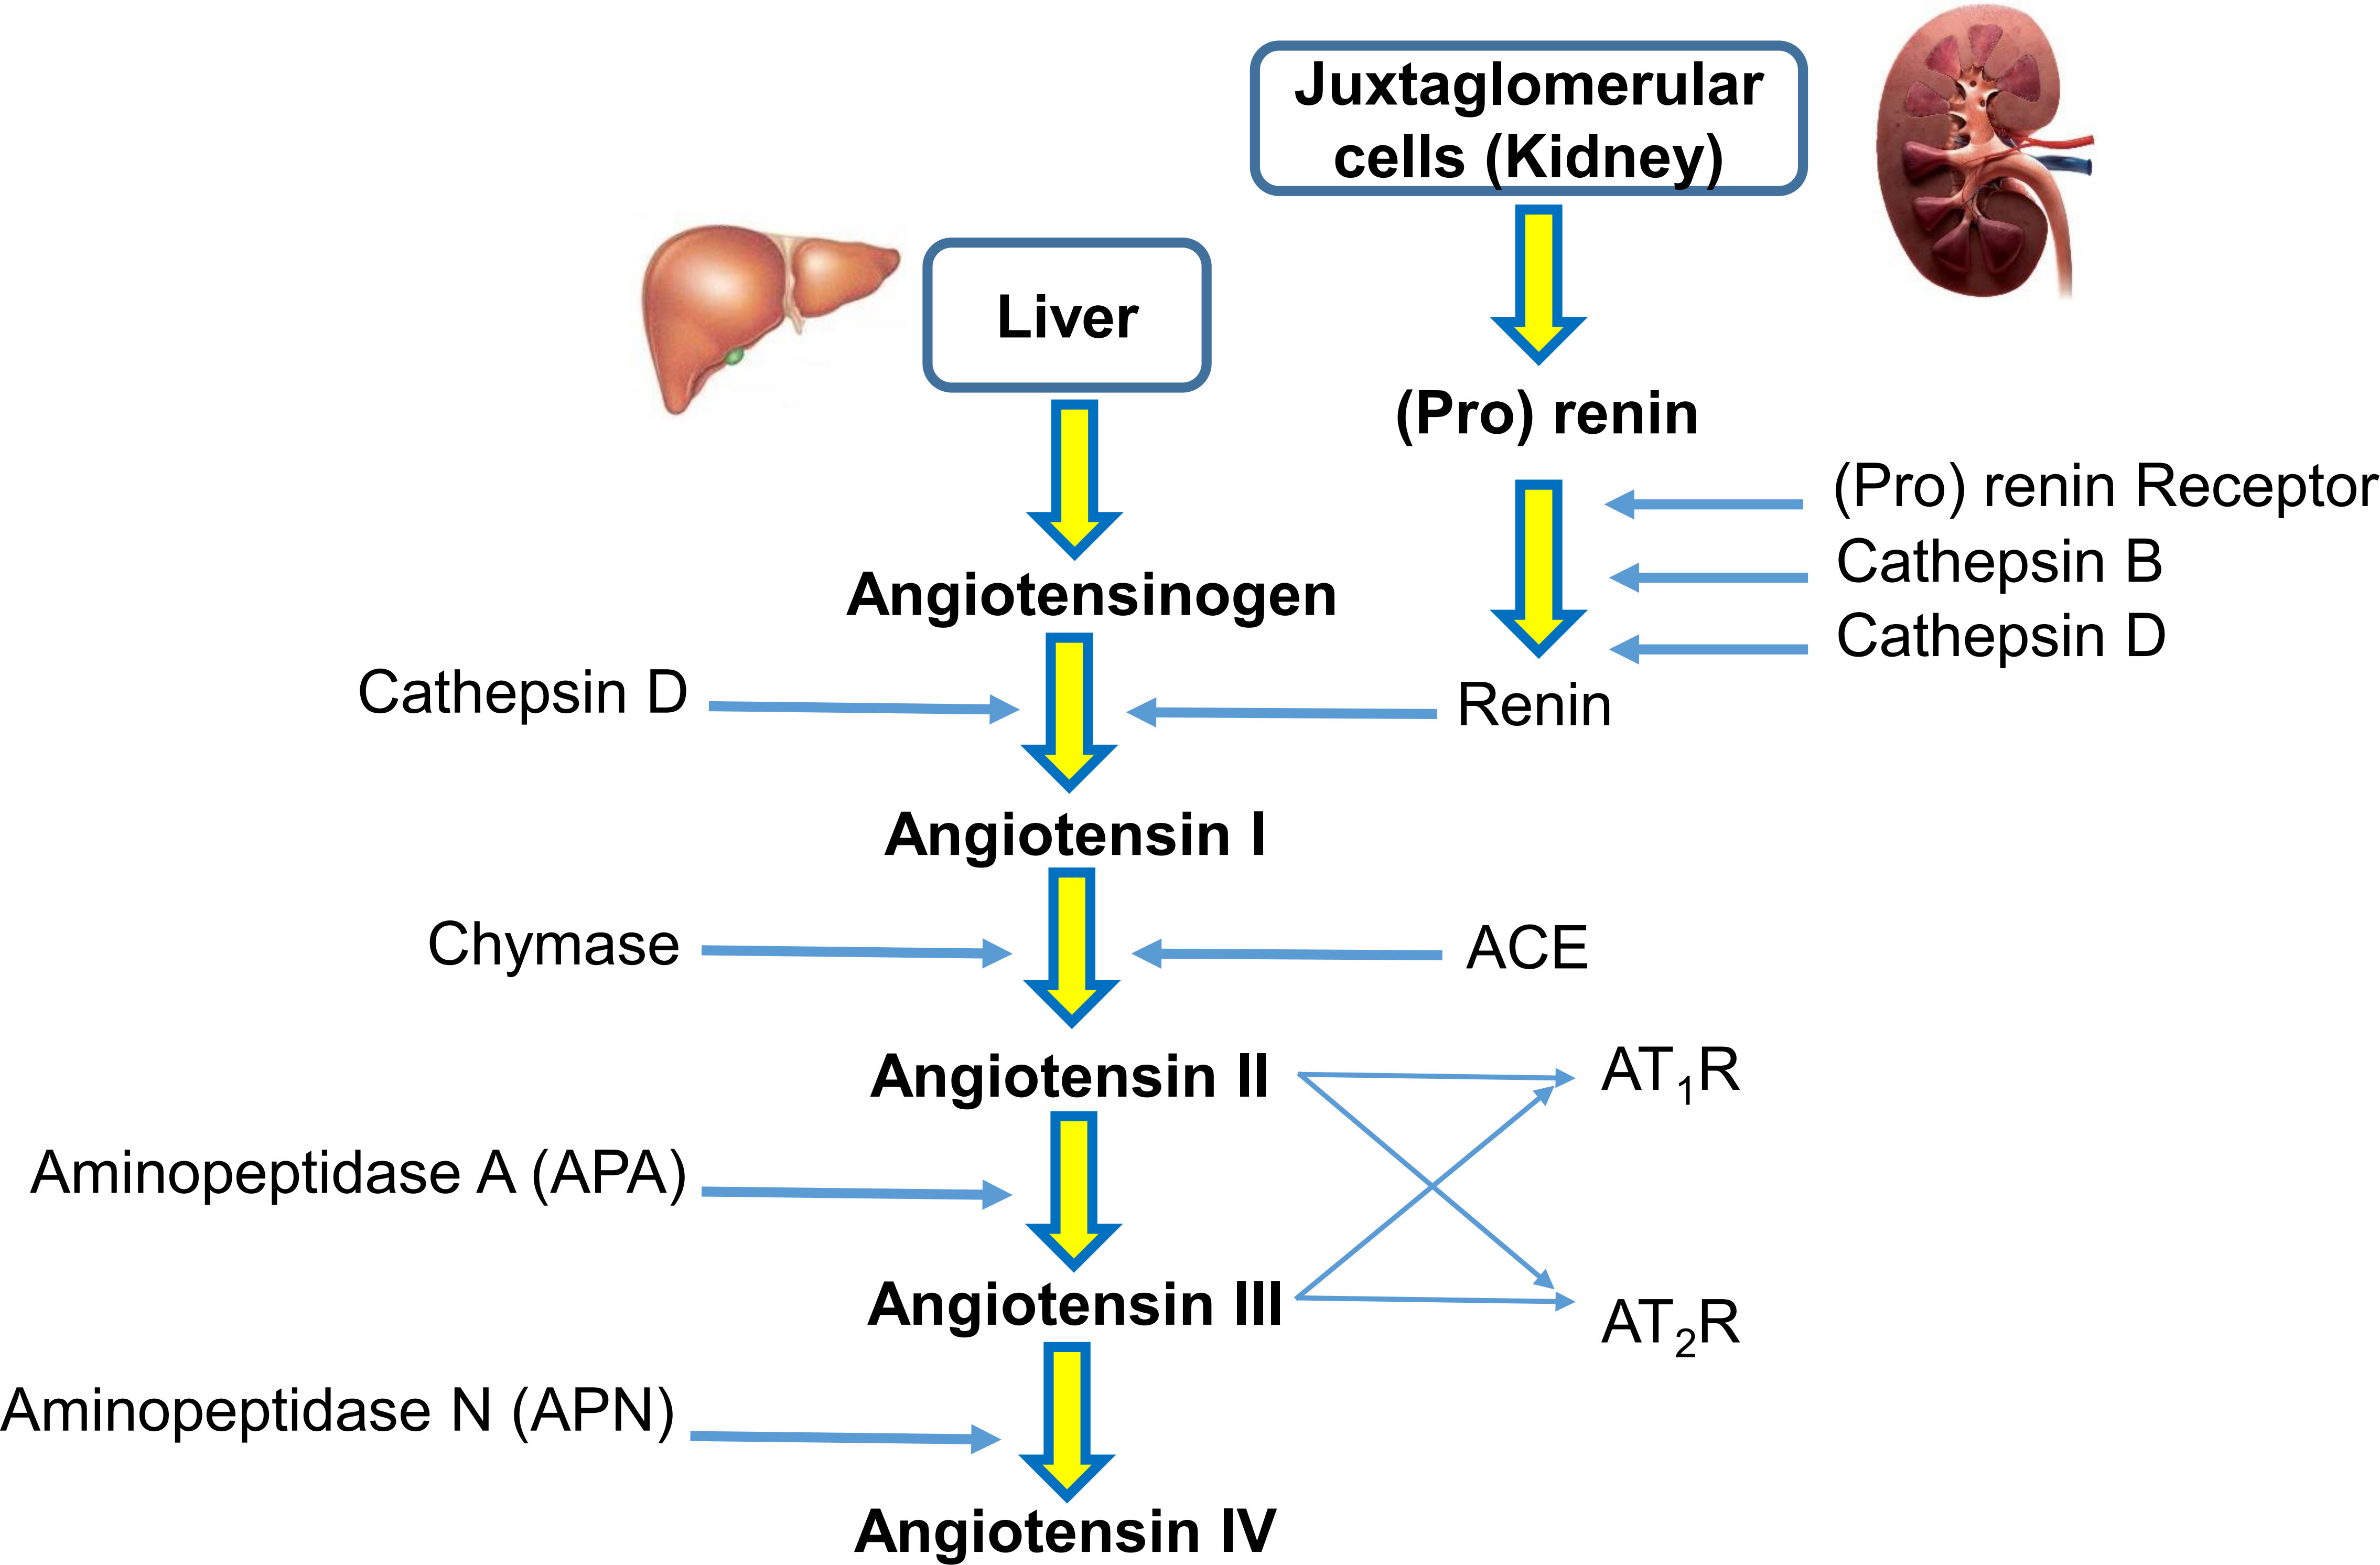
Figure 1 A simplified view of the renin-angiotensin system (RAS). In the RAS, (pro)renin activation is caused by its binding to the (pro)renin receptor. Cathepsins B and D are also renin-activating enzymes. Renin and cathepsin D converts angiotensinogen to angiotensin I, which is acted upon by angiotensin-converting enzyme (ACE) and chymase to produce angiotensin II. Aminopeptidase A (APA) converts angiotensin II to angiotensin III. Angiotensin II and angiotensin III act on the AT1R receptor and AT2R receptor. Aminopeptidase N (APN) converts angiotensin III to angiotensin IV.
It is well known that the RAS system plays a key role in the regulation of salt and osmoregulation in mammals (4). Studies on fishes revealed that the osmoregulatory functions of angiotensin also play a crucial role in dealing with salinity challenges (5). In teleost fish, RAS participates in osmoregulation and salinity adaptation by regulating the drinking rate and blood pressure (6). Zebrafish larvae cultured under different salinities displayed changes in the expression levels of the ren and angiotensin II genes, indicating the important role of the RAS in salinity adaptation (7). Studies have shown that exposure to high salinity activates the RAS pathway in fishes. For example, the mRNA levels of hepatic angiotensinogen in rainbow trout were elevated in a hyperosmotic environment (5). In European eel and Japanese eel, the circulating levels of angiotensin II in plasma were higher in seawater than in freshwater (8, 9). A similar result was recorded for euryhaline bullshark, and the concentration of angiotensin II protein was significantly elevated during a long-term transfer from freshwater to seawater (10). Rapid changes in water salinity from saline water to freshwater resulted in a rapid decrease in plasma angiotensin in river lamprey (11). There is limited information regarding the role of the RAS pathway in crustaceans. In a recent study, the transcriptome analysis revealed that the RAS pathway was activated in Giant Freshwater Prawn (Macrobrachium rosenbergii) under hypotonic stress (12). Our previous study showed that the RAS pathway was suppressed under low salinity in the eyestalk of the Pacific white shrimp Litopenaeus vannamei (13).
The Pacific white shrimp (L. vannamei) is considered an economically important species, and its culture is increasing to meet the high demands of the market (14). This species is a euryhaline species due to its high capability to tolerate a wide range of salinities from 0.5 to 40 ppt (15). Salinity is an abiotic factor that affects the growth, metabolism, immunity, and survival of shrimp. L. vannamei is a euryhaline species that can tolerate a wide range of salinities from 0.5 to 40 ppt (15). However, L. vannamei has low growth, high mortality, and low disease resistance when cultured under low salinity conditions (16). Salinity adaptation is a complex process that involves several biological pathways and different organs. For example, the hepatopancreas is known to provide the required energy for gills, and gills maintain the ionic balance (17). Various adaptive mechanisms must be triggered in L. vannamei to tolerate a wide range of salinity changes. In our previous study, transcriptome analysis revealed that the RAS pathway and its related genes might play important roles in salinity adaptation in L. vannamei, but the detailed mechanisms remain unknown (13).
Previous studies have provided useful information regarding the role of the RAS pathway in the regulation of blood pressure and cardiovascular homeostasis in vertebrates. However, there is limited information regarding the role of the RAS pathway in invertebrates. Unlike vertebrates, L. vannamei has an open circulatory system and different sodium concentrations in the blood; therefore, the RAS might have different regulatory mechanisms and roles in L. vannamei than in vertebrates. In the open circulatory system, the blood (hemolymph) pressure in the body is much lower than in the closed circulatory system, and there is no true heart or capillaries (instead, there are open sinuses, and the movements of body muscles help the hemolymph flow throughout the sinuses). Moreover, the concentration of sodium in the hemolymph of L. vannamei is about 299 mM, while the sodium concentration in the human blood is about 136-145 mM (18).
The present study was carried out to expand the knowledge about the RAS pathway and its related genes in L. vannamei during low salinity stress. This study aims to 1) identify and characterize key genes in the RAS pathway, such as LV-ACE (angiotensin-converting enzyme), LV-APN (aminopeptidase N), LV-AT1R (angiotensin I receptor), and LV-RR (renin receptor), and 2) investigate the expression levels of LV-ACE, LV-APN, LV-AT1R, and LV-RR in different tissues under long-term and short-term low salinity stress. The results of this study help to understand how the RAS pathway and its related genes participate in the osmoregulation of L. vannamei.
Materials and methods
Experimental animals and sampling
Juvenile shrimp (mean weight 1.80 ± 0.16 g) were purchased from a shrimp farm in Shenzhen, China. Shrimp were adapted to the experimental conditions for 1 week (at a salinity of 20). During a one-week period, the salinity of the aquariums was adjusted to 25 ppt and 3 ppt by adding seawater and freshwater, respectively. Shrimp were divided into two salinity groups: 25 ppt (control group) and 3 ppt (low salinity group). For long-term low salinity stress, the experiment was conducted for 8 weeks. For short-term low salinity stress, the samples were collected at 0 h, 3 h, 6 h, 12 h, 24 h, 48 h, 72 h, and 96 h. Shrimp were fed twice daily (at 08:00 and 16:00) with commercial pelleted feed (46% crude protein, 8% crude lipid, 36% carbohydrates, 10% moisture, 11% ash, and 16.7 kJ/g digestible energy). The water temperature, photoperiod, pH, dissolved oxygen, and ammonia nitrogen ranged from 26-28°C, 2 light:12 dark, 7.4-7.8, 4.7-6.5 mg/L, and < 0.02 mg/L, respectively. After dissection, eyestalk, hepatopancreas, and muscle samples were stored in RNAKeeper Tissue Stabilizer (Vazyme, Nanjing) and incubated for 24 h at 4°C. Later, the samples were transferred to -80°C until RNA extraction. The experiment was conducted under the principles of the Guide of the Institutional Animal Care and Use Ethics Committee of East China Normal University.
Gene cloning
The fragments of LV-ACE, LV-APN, LV-AT1R, and LV-RR genes were screened and identified from our transcriptome data (Accession number: SRP048814) by using blast comparison (13). Total RNA was extracted using TRIzol reagent (Invitrogen, Shanghai, China) following the manufacturer’s instructions. The quality and concentration of the extracted RNA were tested using an Agilent 2100 Bioanalyzer (Agilent Technologies, USA) and a Nanodrop 2000 spectrophotometer (ND-2000, Gene Company Limited), respectively. First-strand cDNA was synthesized using FastKing gDNA Dispelling RT SuperMix (TIANGEN, China). PCR amplification was carried out in a total volume of 25 µl, including 12.5 μL 2X Taq PCR master mix, 4 µl cDNA, 0.4 µl forward and reverse primers, and 7.7 μL RNase Free dH2O. The reaction procedure was set at 94 °C for 3 min as preincubation, PCR amplification was performed for 34 cycles (94 °C for 30 s; 55 °C for 30 s; 72 °C for 1 min), and 5 min of extension at 72°C. The amplified products were sent to a biological company (Meiji Biotech Co., Ltd., Shanghai, China) for sequencing, and then the obtained sequences were spliced to obtain the final sequence. The primers were designed using Primer Premier Software 5.0 (PREMIER Biosoft International, USA). All primers used are presented in Table 1.
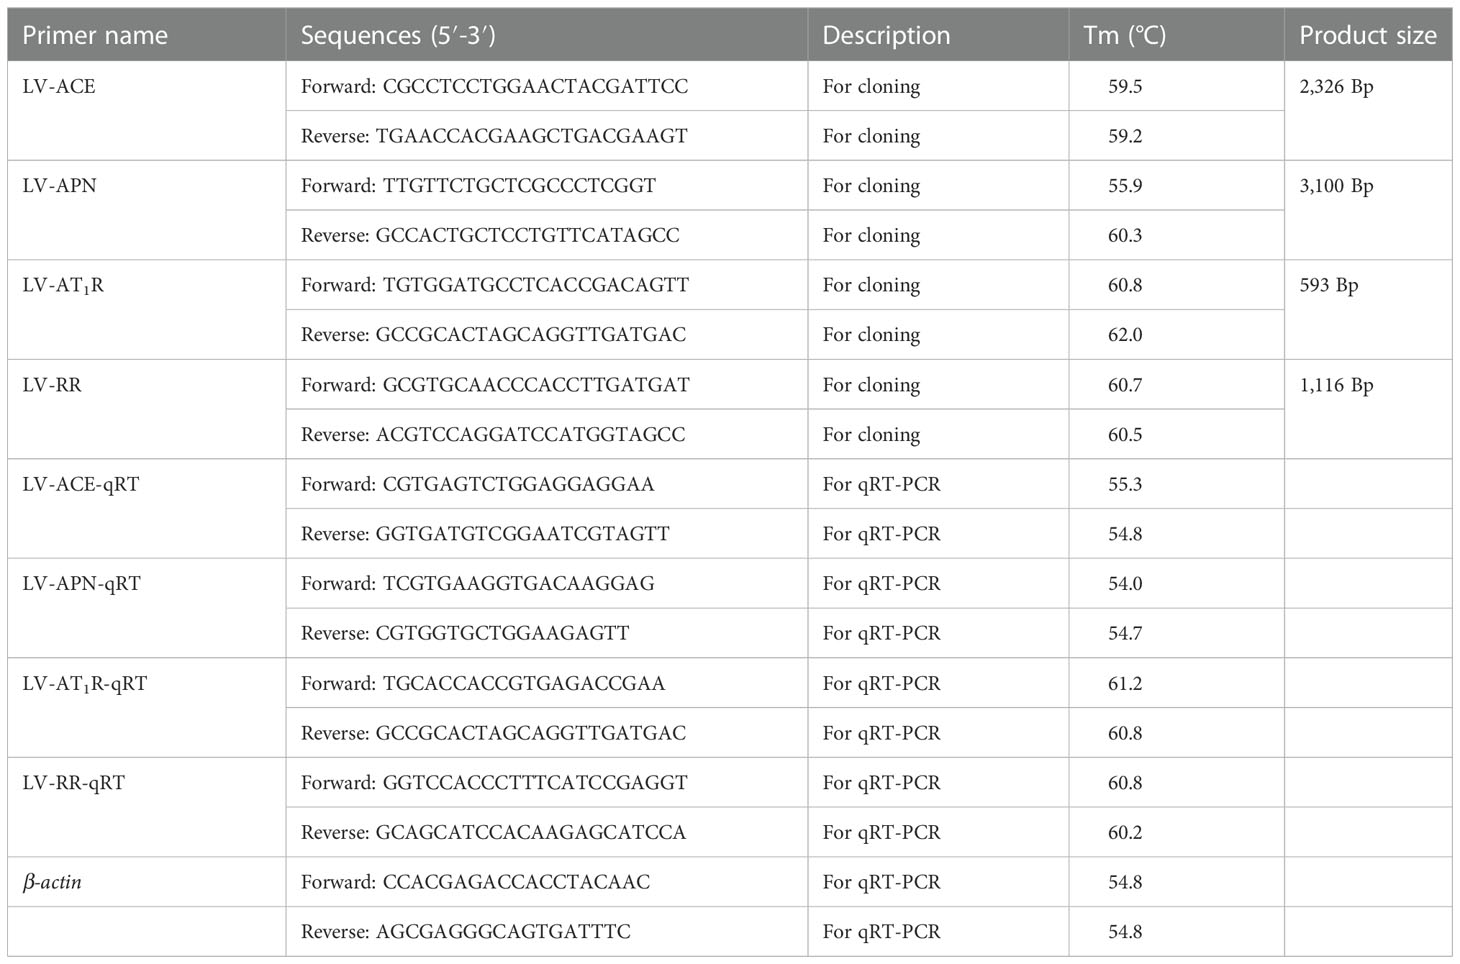
Table 1 Primers used for cloning and qRT−PCR of LV-ACE, LV-APN, LV-AT1R, and LV-RR.
Bioinformatic analysis
The protein sequences of LV-ACE, LV-APN, LV-AT1R, and LV-RR were compared by the BLAST search tool (available at https://blast.ncbi.nlm.nih.gov/Blast.cgi). The Compute pI/Mw tool was used to predict the isoelectric point and molecular weight of the proteins (available at https://web.expasy.org/compute_pi/). The three-dimensional (3D) protein structure and functional domains were predicted using SWISS-MODEL (https://swissmodel.expasy.org/interactive) and the Simple Modular Architecture Research Tool (https://smart.embl.de/), respectively. Signal peptide sites were predicted using the SignalP 5.0 tool (19). The secondary structure of proteins was predicted using the self-optimized prediction method with alignment (SOPMA) server. Mega X software (20) (bootstrap analysis of 1,000 replicates) was used to construct the phylogenetic tree by the neighbor-joining method. Multiple sequence alignment of proteins was performed using BioEdit software version 7.2 (http://bioedit.software.informer.com/7.2).
Quantitative real-time PCR (qRT−PCR)
The expression patterns of LV-ACE, LV-APN, LV-AT1R, and LV-RR in different tissues (eyestalk, hepatopancreas, and muscle) under different salinity conditions were measured by qRT−PCR using the SYBR Green method (TIANGEN Biotech, Beijing, China). qRT−PCR was carried out in a total reaction volume of 20 µl on a 96-well PCR plate (Eppendorf, Germany) with three biological replicates for each sample. qRT−PCR was performed on a Bio-Rad CFX384 real-time PCR system (Bio-Rad, California, United States). The target genes and the housekeeping gene (β-actin) were amplified using gene-specific primers (Table 1). Gene expression data were analyzed using the 2−ΔΔCT method (21).
Bacterially expressed LV-ACE protein and preparation of antibody
A fragment sequence of LV-ACE was amplified using a PCR machine and then ligated with the prokaryotic expression plasmids pET28a (with the expected molecular weight of 21 kD) and pET32a (with the expected molecular weight of 35 kD). Later, pET28a was selected for further analysis. The recombinant protein was expressed in Escherichia coli BL21 (DE3). After an overnight incubation at 37°C, the bacteria were transferred into new media at a ratio of 1:100. The cultures were grown to mid-log phase at 37°C until the OD600 reached 0.6. The cultures were induced with isoprophyl-b-d-thiogalactopyranoside (IPTG) and purified by Ni2+-NTA affinity chromatography. The bacteria were sonicated using ultrasonic waves and then centrifuged at 1000 × g for 5 min. SDS−PAGE was used to analyze the collected sediment and supernatant. Ni-NTA spin columns were used to purify the protein, and the purified protein was detected using SDS−PAGE. New Zealand white rabbits were immunized with purified protein. The titers of antisera were assayed by enzyme-linked immunosorbent assay (ELISA). The antibodies were provided by a biological company (Youke Biotechnology Co., Ltd., Shanghai, China).
Western blot
Total protein was extracted from the hepatopancreas of L. vannamei cultured under long-term low salinity and normal salinity with RIPA lysis buffer and quantified by the BCA method. After the separation of proteins by SDS−PAGE, proteins were transferred from the gel to a PVDF membrane. The membrane was blocked with blocking buffer (1% casein) for 2 h at room temperature. The first (rabbit anti-LV-ACE) and second antibodies (GAPDH) were diluted with PBST and incubated with the PVDF membranes. The PVDF membranes were exposed to X-ray film in a darkroom. After photographing the blots, the images were analyzed using ImageJ software.
Statistical analysis
The experimental data were analyzed using SPSS version 21.0 (Chicago, Ill., USA). The normality and homoscedasticity of the data were verified using the Kolmogorov−Smirnov and Levene’s tests, respectively. Independent samples t tests were employed to determine the differences in the expression profiles of LV-ACE, LV-APN, LV-AT1R, and LV-RR under different salinity conditions. The significance level for all analyses was set at P < 0.05. In the present study, the experimental data are presented as the mean ± SD.
Results
Identification and characterization of LV-ACE, LV-APN, LV-AT1R, and LV-RR
The molecular masses of the LV-ACE, LV-APN, LV-AT1R, and LV-RR proteins were estimated to be 76.446, 108.381, 19.183, and 35.749 kDa, respectively. The estimated isoelectric points (IPs) for the LV-ACE, LV-APN, LV-AT1R, and LV-RR proteins were 5.78, 6.8, 4.73, and 4.95, respectively. The LV-ACE, LV-APN, LV-AT1R, and LV-RR proteins consist of 666, 936, 175, and 323 amino acid residues, respectively. The signal peptide sites and the secondary structure of the proteins are provided in Supplementary Figures 1–4.
Phylogenetic analysis
The protein sequences of LV-ACE, LV-APN, LV-AT1R, LV-RR, and other proteins that were used for the bioinformatic analysis are provided as Supplementary Files. Bioinformatics analysis of the protein sequence of LV-ACE indicated its structural similarity to the angiotensin-converting enzyme-like family. BLAST analysis revealed that the LV-ACE protein shared the highest identity with ACE proteins in crustaceans such as Penaeus chinensis (94.83%), Penaeus japonicus (92.19%), and Carcinus maenas (72.06%), but the similarity of LV-ACE with other animal groups was less than 70% (Figure 2A). The constructed phylogenetic tree using 18 homologous proteins is shown in Figure 2B. In this tree, the homologous proteins are divided into four separate clades: crustaceans, fishes, mammals, and birds. The phylogenetic tree showed that the ACEs in crustaceans clustered together, indicating that they had a close genetic distance.
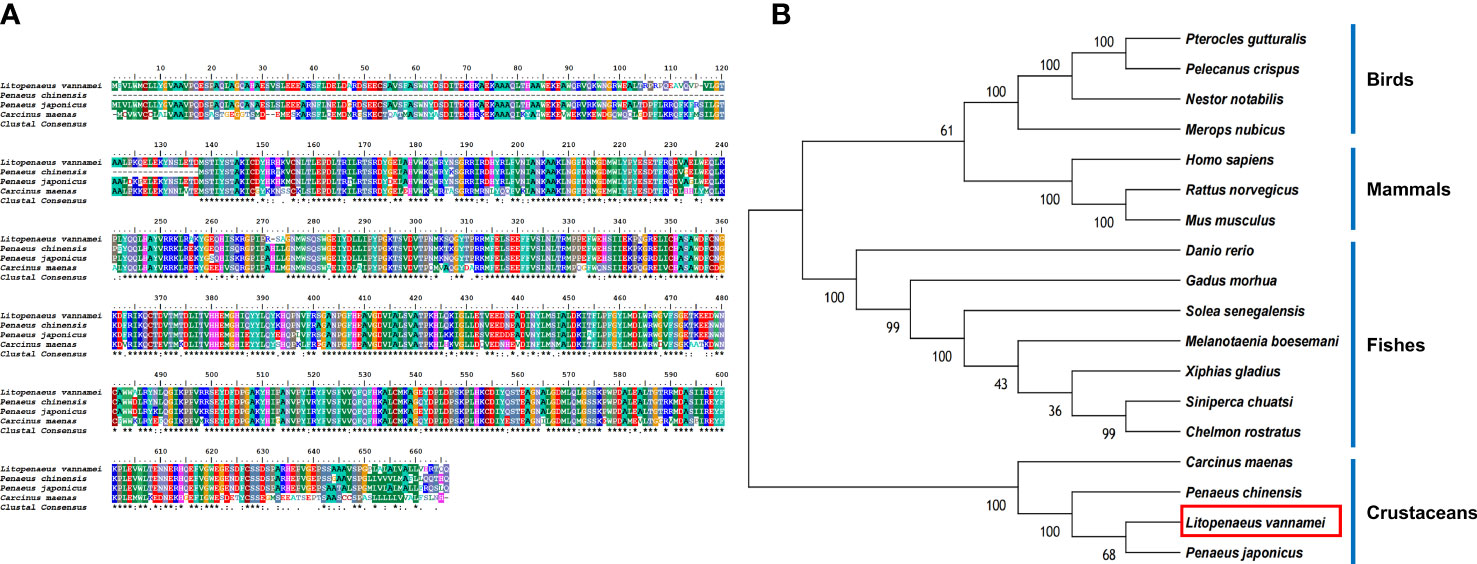
Figure 2 (A) Multiple alignments of deduced amino acids of LV-ACE protein and its homologs. Species names are listed on the left side. (B) The phylogenetic tree shows relationships between the ACE protein of L. vannamei (red rectangle) and those of other organisms. Species names are listed to the right of the tree.
Based on the bioinformatics analysis, LV-APN had a high structural similarity to aminopeptidase N-like proteins (Figure 3A). The LV-APN protein had the highest identity with aminopeptidase N-like proteins in crustaceans, including Penaeus monodon (82.46%), P. chinensis (81.41%), and P. japonicus (72.71%). The phylogenetic tree was constructed using 18 homologous proteins from different animal groups, including crustaceans, fishes, mammals, and insects (Figure 3B).
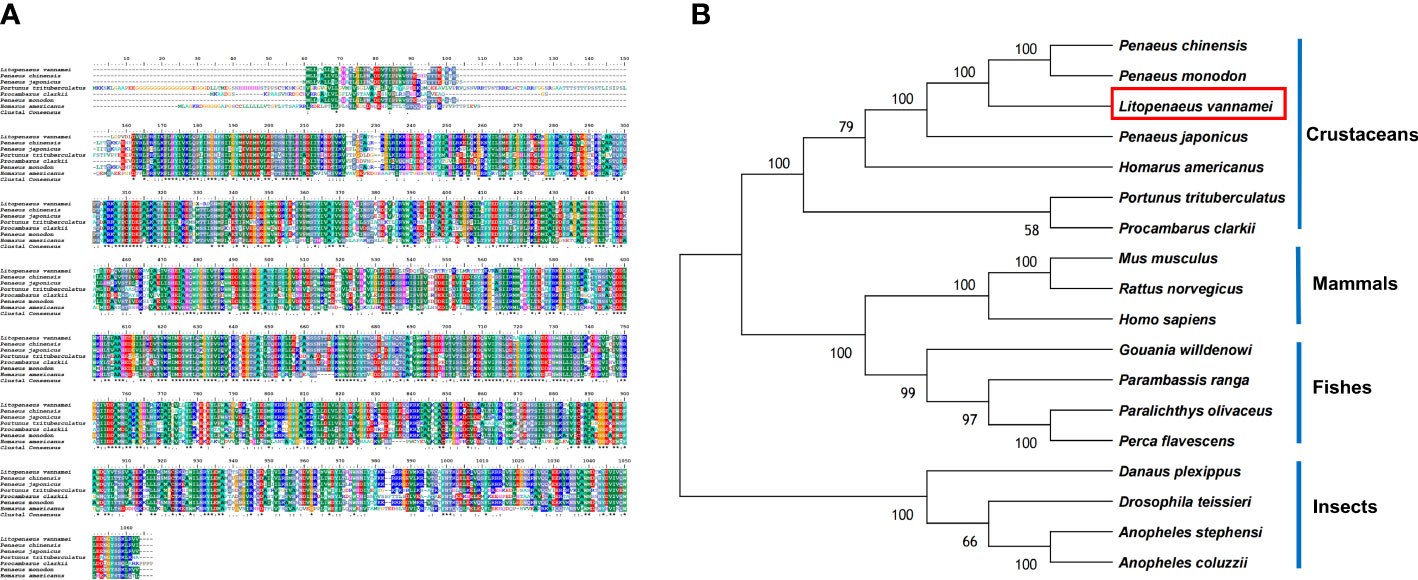
Figure 3 (A) Multiple alignments of deduced amino acids of LV-APN protein and its homologs. Species names are listed on the left side. (B) The phylogenetic tree shows relationships between the APN protein of L. vannamei (red rectangle) and those of other organisms. Species names are listed to the right of the tree.
The LV-AT1R protein had the highest structural similarity with type-1 angiotensin II receptor-associated protein-like in crustaceans (Figure 4A). BLAST analysis showed that the LV-AT1R protein shared the highest identity with P. monodon (93.71%), P. chinensis (93.14%), and P. japonicus (92.61%). The constructed phylogenetic tree using 18 homologous proteins from various species is presented in Figure 4B.
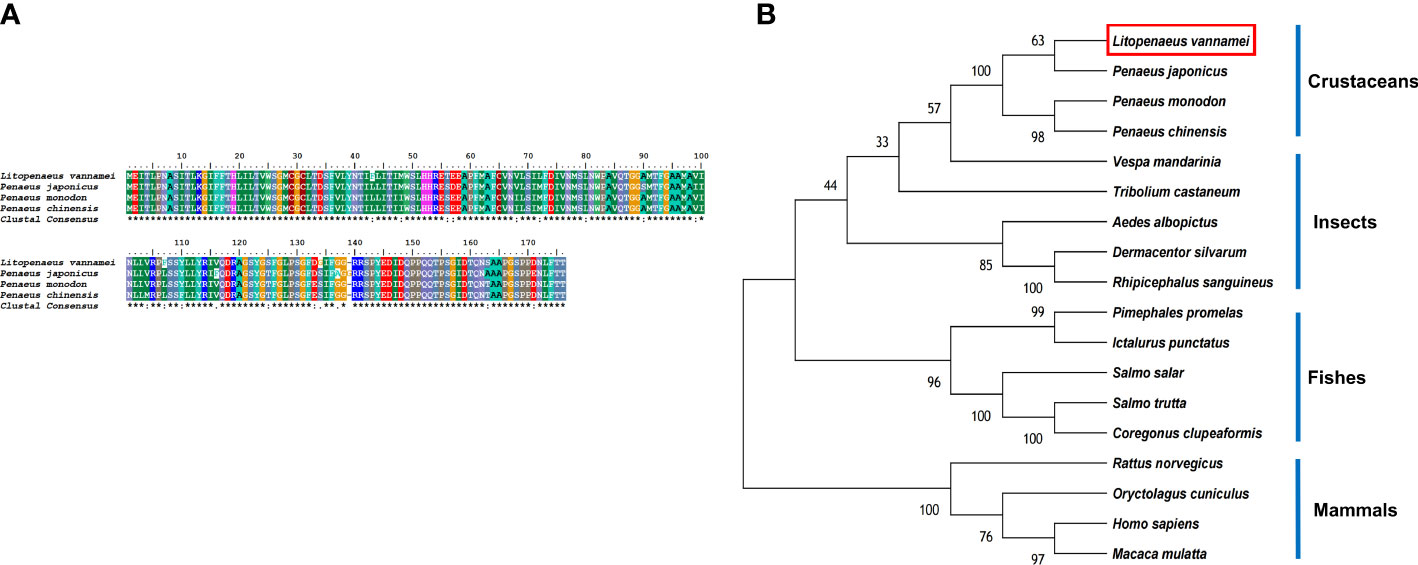
Figure 4 (A) Multiple alignments of deduced amino acids of LV-AT1R protein and its homologs. Species names are listed on the left side. (B) The phylogenetic tree shows relationships between the AT1R protein of L. vannamei (red rectangle) and those of other organisms. Species names are listed to the right of the tree.
The comparison of the protein sequences of LV-RR in the NCBI database showed that this protein belongs to the renin receptor protein family (Figure 5A). The LV-RR protein had the highest identity with renin receptors in P. monodon (94.74%), P. chinensis (93.50%), and P. japonicus (88.85%). The phylogenetic tree for the LV-RR protein is shown in Figure 5B.
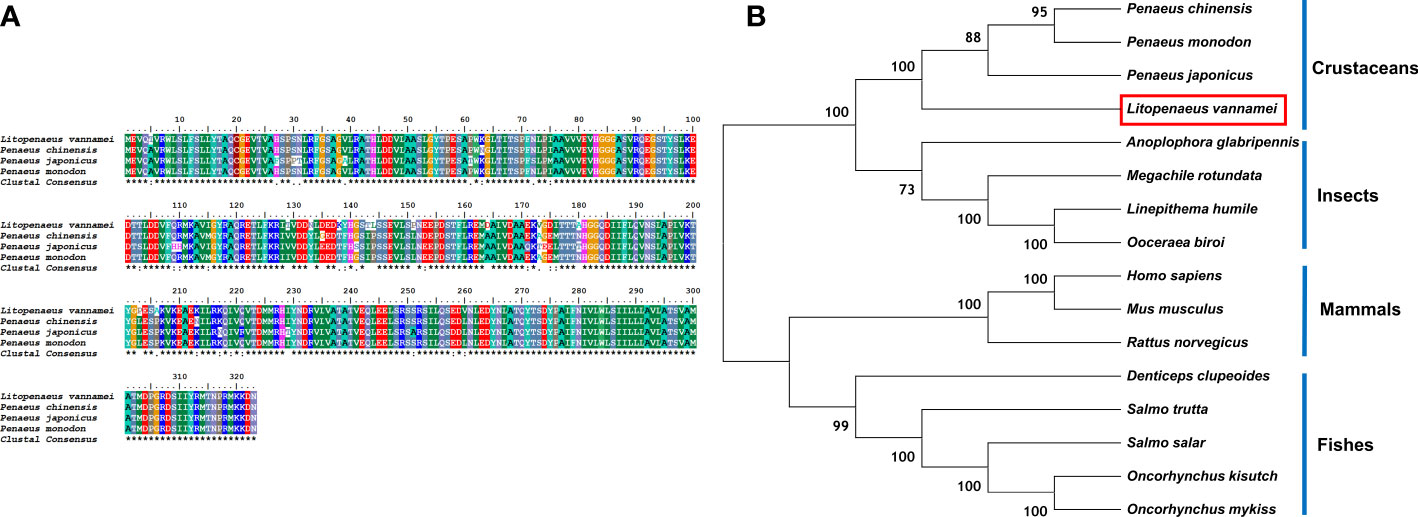
Figure 5 (A) Multiple alignments of deduced amino acids of LV-RR protein and its homologs. Species names are listed on the left side. (B) The phylogenetic tree shows relationships between the RR proteins of L. vannamei (red rectangle) and those of other organisms. Species names are listed to the right of the tree.
Long-term low salinity stress: Expression profile of LV-ACE, LV-APN, LV-AT1R, and LV-RR in different tissues under different salinity conditions
The expression levels of LV-ACE, LV-APN, LV-AT1R, and LV-RR in the eyestalk, hepatopancreas, and muscle are presented in Figure 6. All four genes were expressed in the tested tissues. In the eyestalk, a downward trend was observed in the expression levels of LV-ACE and LV-APN under low salinity stress (P < 0.05). Low salinity stress did not affect the expression level of LV-AT1R or LV-RR in the eyestalk. In the hepatopancreas, the LV-ACE expression level was downregulated in the low salinity group compared to the control group (P < 0.05). The transcript levels of LV-APN, LV-AT1R, and LV-RR in the hepatopancreas were not affected by salinity changes (P > 0.05). In the muscle, the expression level of LV-APN was downregulated after long-term low salinity stress (P < 0.05). In addition, low salinity stress slightly decreased the expression levels of LV-ACE, LV-AT1R, and LV-RR in the muscle; however, no significant difference was found (P > 0.05).
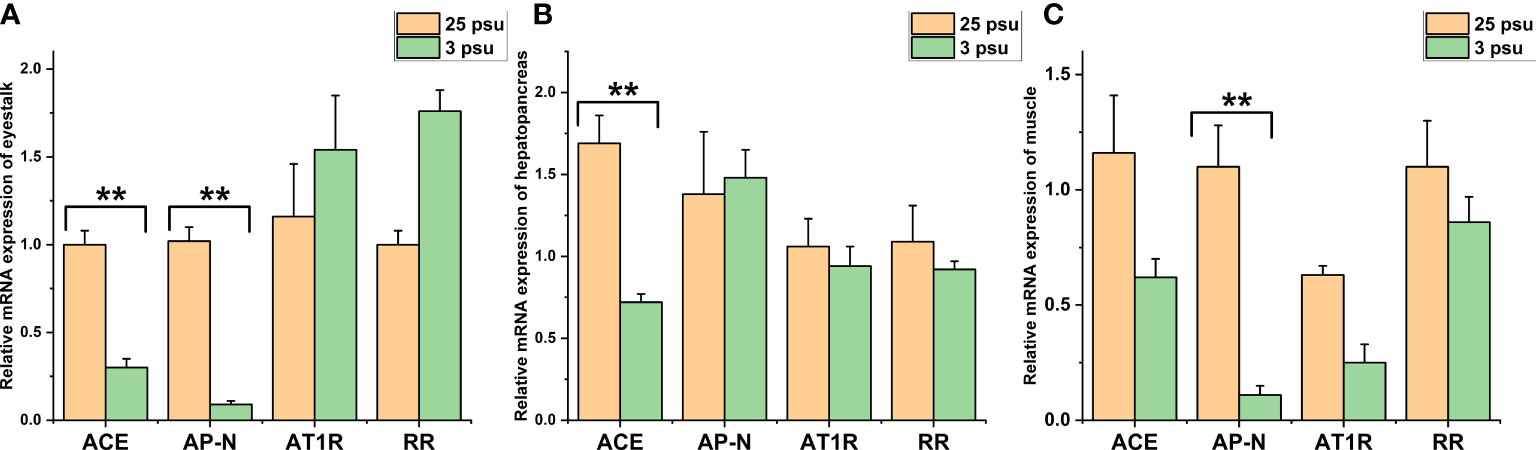
Figure 6 The expression levels of LV-ACE, LV-APN, LV-AT1R, and LV-RR in the eyestalk (A), hepatopancreas (B), and muscle (C) under long-term low salinity stress. Significant differences are indicated with ** marks (P < 0.05). Values are the mean ( ± SD). (N = 6).
Short-term low salinity stress: Expression profile of LV-ACE, LV-APN, LV-AT1R, and LV-RR in different tissues under different salinity conditions
The expression profiles of LV-ACE, LV-APN, LV-AT1R, and LV-RR in the eyestalk, hepatopancreas, and muscle under short-term low salinity stress are presented in Figures 7–9, respectively.
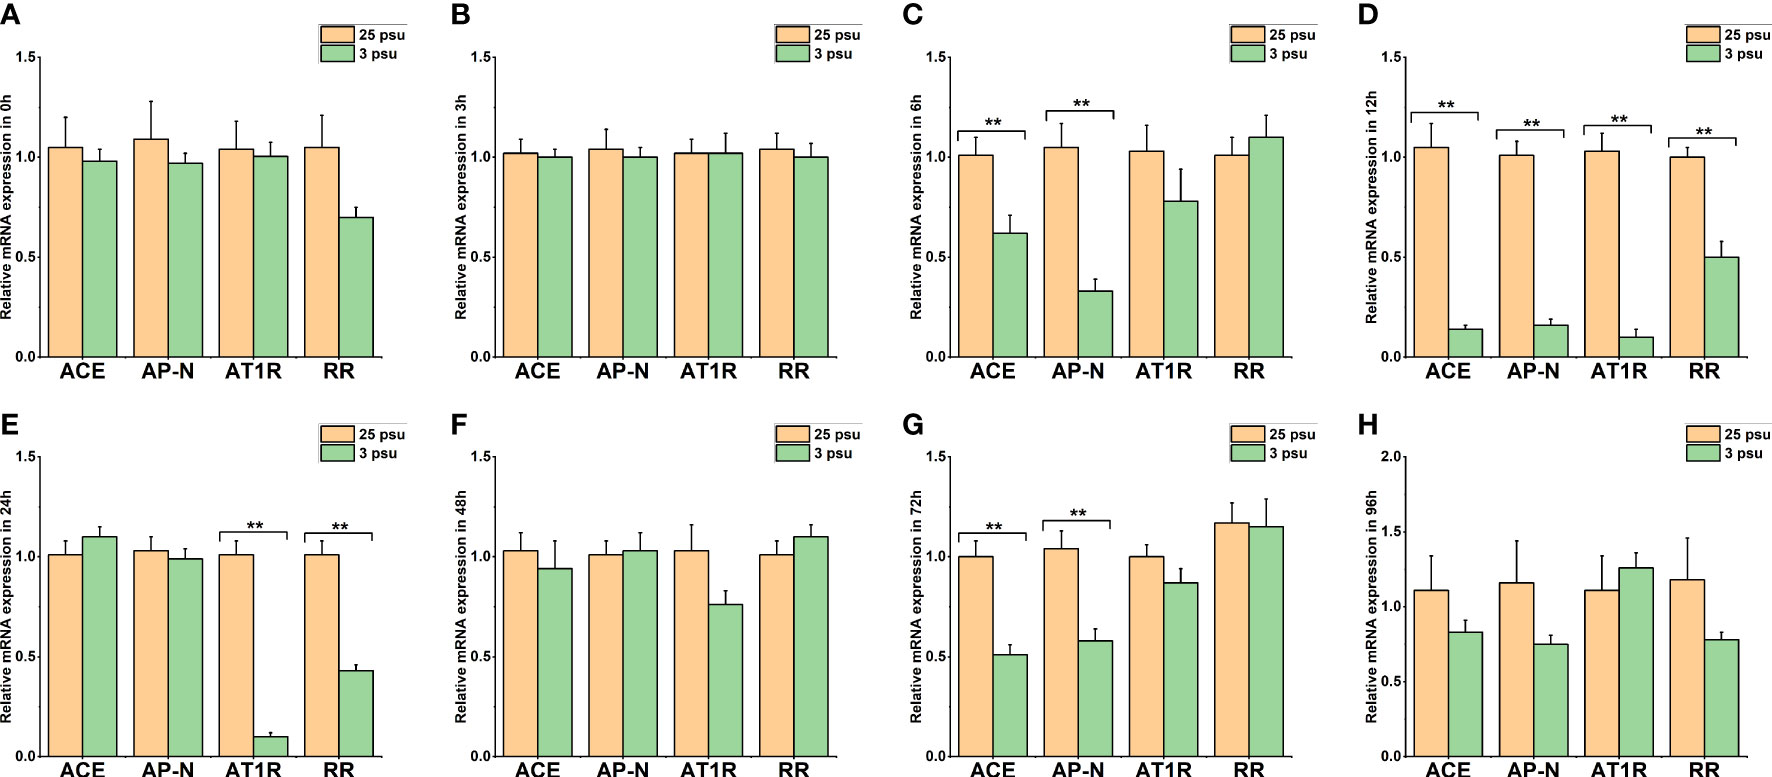
Figure 7 The expression levels of LV-ACE, LV-APN, LV-AT1R, and LV-RR in the eyestalk at 0 h (A), 3 h (B), 6 h (C), 12 h (D), 24 h (E), 48 h (F), 72 h (G), and 96 h (H) of short-term low salinity stress. Significant differences are indicated with ** marks (P < 0.05). Values are the mean ( ± SD). (N = 6).
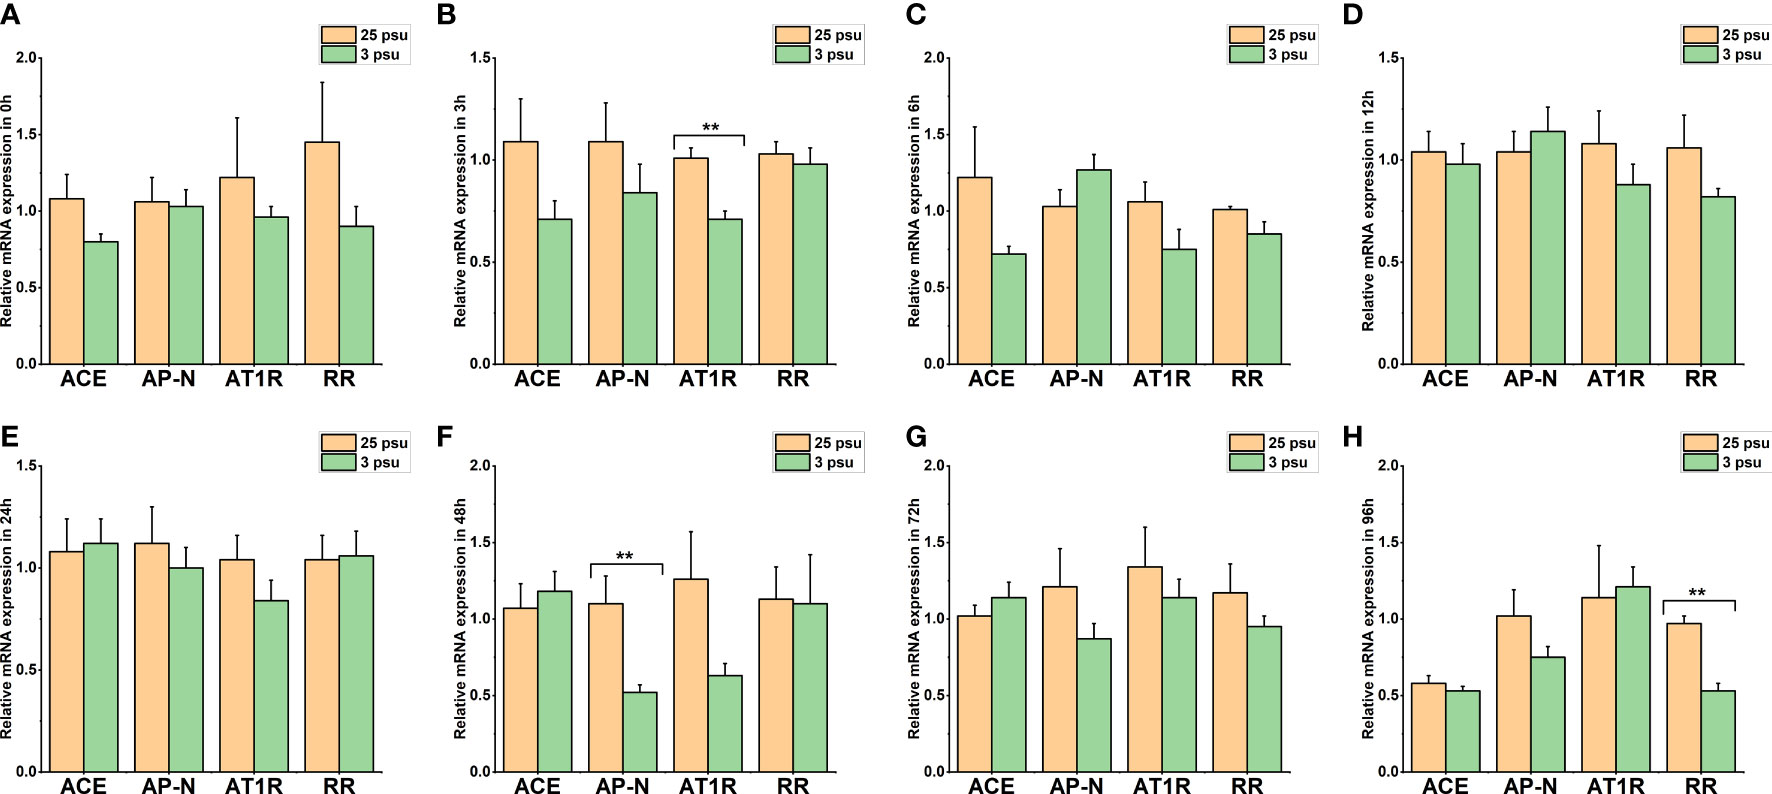
Figure 8 The expression levels of LV-ACE, LV-APN, LV-AT1R, and LV-RR in the hepatopancreas at 0 h (A), 3 h (B), 6 h (C), 12 h (D), 24 h (E), 48 h (F), 72 h (G), and 96 h (H) of short-term low salinity stress. Significant differences are indicated with ** marks (P < 0.05). Values are the mean ( ± SD). (N = 6).
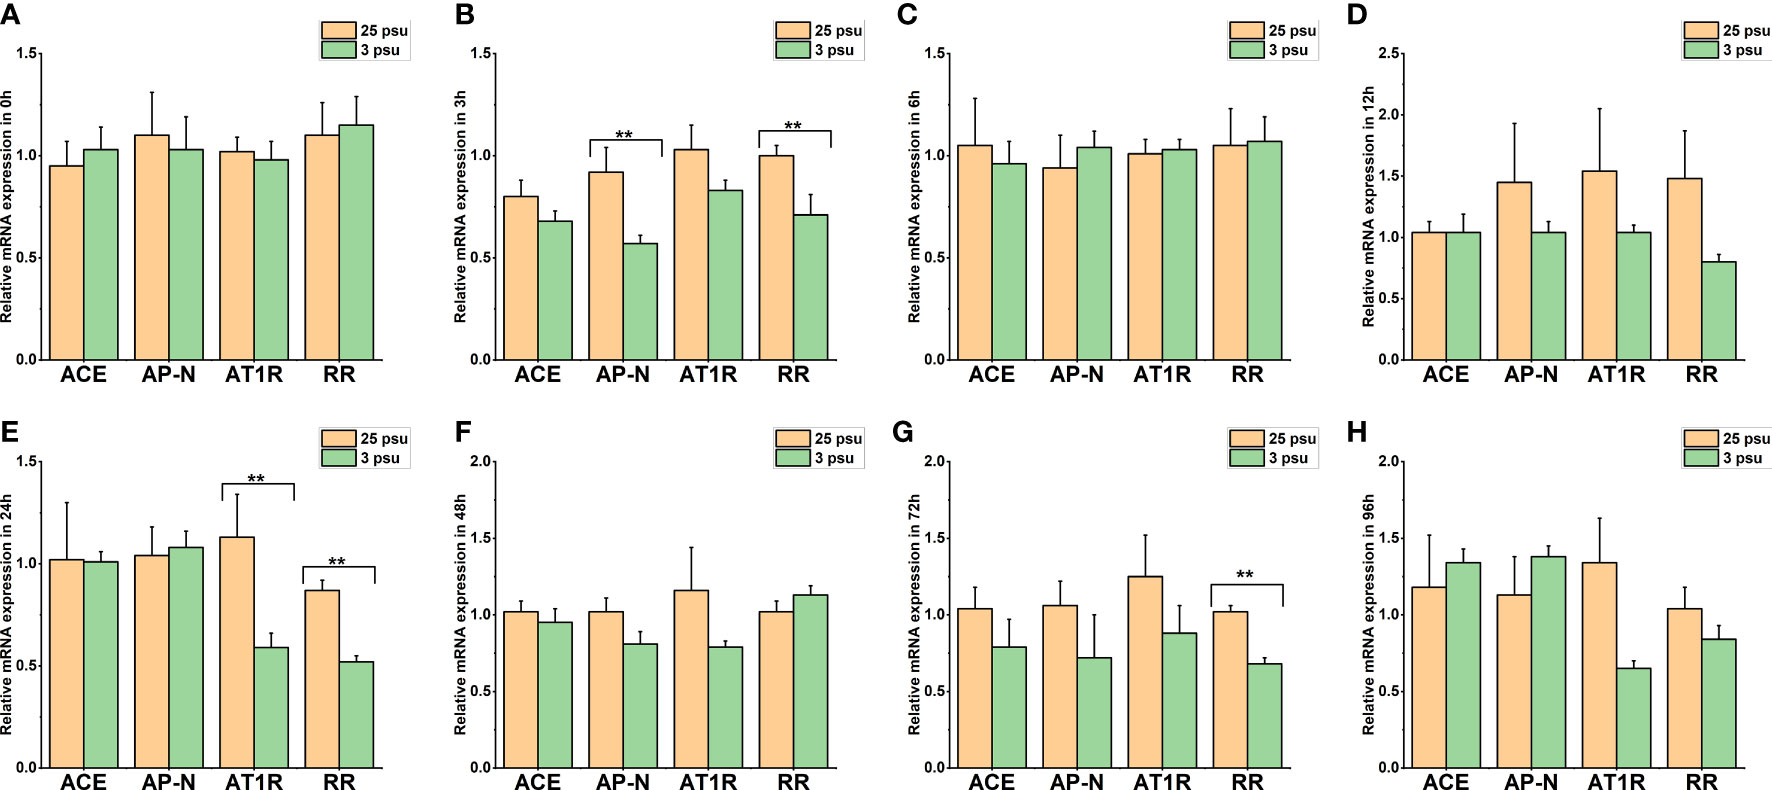
Figure 9 The expression levels of LV-ACE, LV-APN, LV-AT1R, and LV-RR in the muscle at 0 h (A), 3 h (B), 6 h (C), 12 h (D), 24 h (E), 48 h (F), 72 h (G), and 96 h (H) of short-term low salinity stress. Significant differences are indicated with ** marks (P < 0.05). Values are the mean ( ± SD). (N = 6).
Figure 7 shows the mRNA expression of LV-ACE, LV-APN, LV-AT1R, and LV-RR in the eyestalk at 0 h, 3 h, 6 h, 12 h, 24 h, 48 h, 72 h, and 96 h of low salinity stress. The expression levels of the LV-ACE and LV-APN genes were significantly decreased at 6, 12, and 72 h (P < 0.05; Figures 7C, D, G). For the LV-AT1R and LV-RR genes, a significant downregulation was observed from 12 to 24 h in the low salinity group (3 ppt) compared to the 25 ppt salinity group (Figures 7D, E).
The mRNA expression profile of LV-ACE, LV-APN, LV-AT1R, and LV-RR in the hepatopancreas at 0 h, 3 h, 6 h, 12 h, 24 h, 48 h, 72 h, and 96 h is presented in Figure 8. The expression level of LV-ACE was not affected by short-term low salinity stress (P > 0.05). Based on the results (Figure 8F), the expression level of LV-APN in the hepatopancreas at 48 h decreased compared to that in the control group (P < 0.05). Downregulation of the expression of LV-AT1R and LV-RR was recorded at 3 h (Figure 8B) and 96 h (Figure 8H), respectively (P < 0.05).
Figure 9 presents the expression profile of LV-ACE, LV-APN, LV-AT1R, and LV-RR in the muscle at 0 h, 3 h, 6 h, 12 h, 24 h, 48 h, 72 h, and 96 h under different salinity conditions. The mRNA expression of LV-ACE in the muscle remained intact during short-term low salinity stress (P > 0.05). Downregulation of the expression level of LV-APN was observed at 3 h (Figure 9B; P < 0.05). The expression of the LV-AT1R gene in the muscle significantly decreased at 24 h in comparison with the control group (Figure 9E; P < 0.05). For the LV-RR gene, the downregulation was recorded at 3, 24, and 72 h (Figures 9B, E, G; P < 0.05).
Purification and expression of LV-ACE protein
The ligated protein fragments with prokaryotic expression plasmids pET28a and pET32a are shown in Supplementary Figure 5A. LV-ACE protein was successfully expressed after induction. The solubility of LV-ACE recombinant protein was determined by ultrasonic disruption of bacteria (Supplementary Figure 5B). After ultrasonic disruption, only LV-ACE recombinant protein appeared on SDS−PAGE, suggesting the presence of LV-ACE recombinant protein in the form of inclusion bodies. The SDS−PAGE for purification and quantification of LV-ACE recombinant protein is presented in Supplementary Figures 5C, D, respectively. Western blot results showed the expression of LV-ACE protein in the hepatopancreas under long-term low salinity and normal salinity conditions (Figure 10). The expression of LV-ACE protein in the hepatopancreas was decreased under long-term low salinity stress compared with the control group. The Western blot results were consistent with the qRT−PCR results.
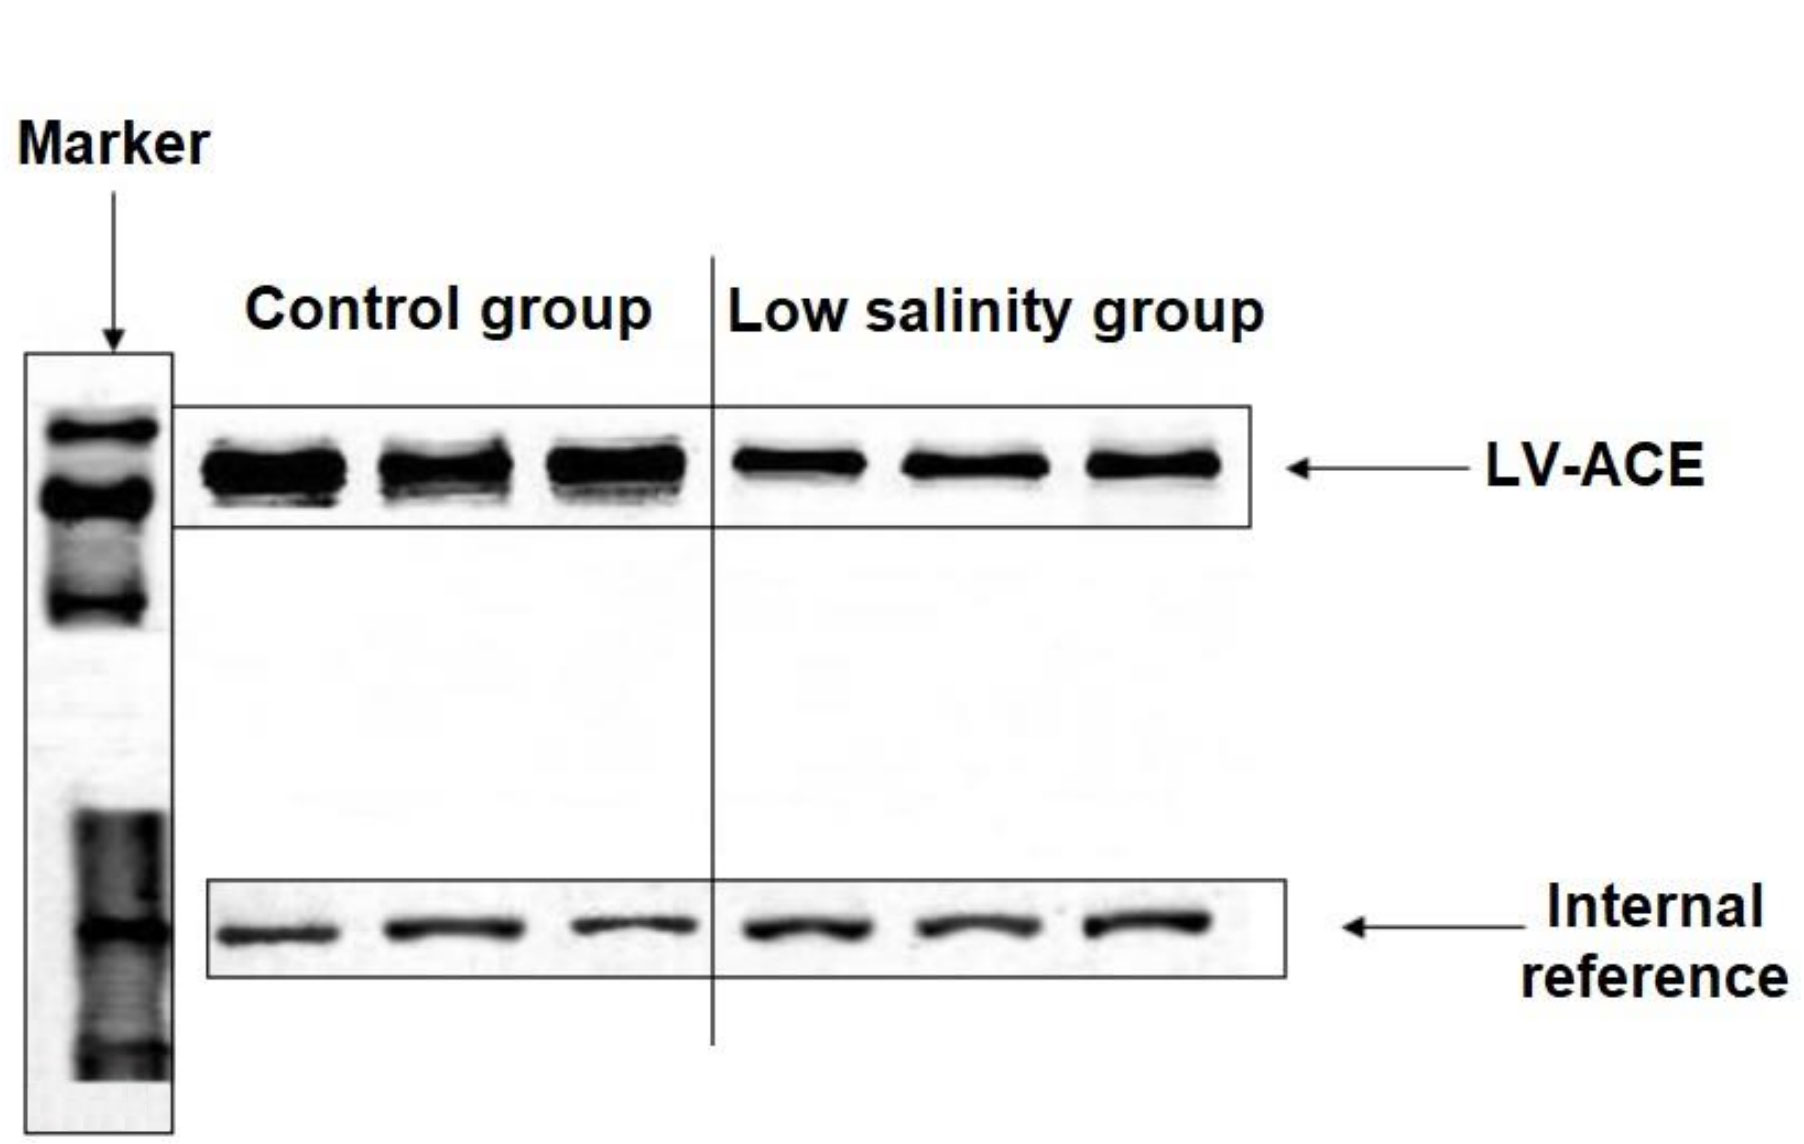
Figure 10 Western blot results of the expression of LV-ACE protein in the hepatopancreas under long-term low salinity and the control group. GAPDH was used as an internal reference.
Discussion
It is well known that the RAS pathway is a key regulator of blood pressure and osmoregulation in mammals (1). However, for a better understanding of the role, evolution, and regulatory mechanism of the RAS pathway, it is pivotal to study the molecular characterization and expression analysis of RAS-related genes in other animal groups, such as invertebrates.
Identification, characterization, and expression analysis of LV-ACE
Based on the sequence homology and phylogenetic analysis, the LV-ACE protein had the closest evolutionary relationship with ACE proteins in crustaceans. The phylogenetic tree revealed that ACE protein in crustaceans was distinct from other identified proteins in vertebrates and therefore might have a divergent evolutionary trend. Notably, the LV-ACE protein (666 aa) and ACE proteins in crustaceans (ranging from 529-666 aa) were much smaller than most of the ACE proteins in vertebrates (ranging from 1147-1324 aa).
LV-ACE was expressed in all the examined tissues in both the control and low salinity groups, indicating that LV-ACE might have a wide range of functions. Several studies have reported changes in the expression level of the ACE gene under salinity challenges in aquatic organisms (22, 23). In the present study, the expression analysis showed that LV-ACE in the eyestalk and hepatopancreas was downregulated after eight weeks of long-term low salinity stress. During the short-term low salinity stress, the downregulation in the mRNA level of LV-ACE was detected only in eyestalk but not in other tissues. In the eyestalk, the expression of LV-ACE decreased at 6 h, 12 h, and 72 h of short-term low salinity stress. A similar result was observed in our previous study, mRNA sequencing showed downregulation in the expression level of LV-ACE in the eyestalk of L. vannamei after long-term low salinity stress (13). The downregulation of LV-ACE in the eyestalk (but not in other organs) under short-term salinity stress could be related to the quick response of the eyestalk as an important regulatory organ for facing stressful situations. Eyestalk regulates energy metabolism by secreting crustacean hyperglycemic hormones (CHHs). The CHH neurohormones are involved in the stress responses by regulating the glucose level in the hemolymph (24). In mammals, salt intake regulates both plasma and tissue ACE expression (25). In rats, the mRNA expression level of ACE significantly increased after feeding with a diet containing a high level of salt compared to the control diet (25). The downregulation of LV-ACE under low saintly could be a response to low salt concentration in this group. In contrast to our findings, proteomics analysis exhibited an upregulation in the ACE protein under the low salinity group in the hepatopancreas of mud crab Scylla paramamosain (26). The ACE enzyme was initially isolated as a ‘hypertensin-converting enzyme’ in 1956 (27). This enzyme is present in several tissues and biological fluids. In humans, two isoforms of ACE have been identified: somatic ACE (sACE) and germinal ACE (gACE). Somatic ACE is present in different types of endothelial and epithelial cells (28). Germinal ACE is found particularly in germinal cells of male testis. In the RAS pathway, angiotensin I-(1-10) (Asp-Arg-Val-Tyr-Ile-His-Pro-PheHis-Leu) is cleaved into the octapeptide angiotensin II-(1-8) by ACE enzyme by removing the C-terminal dipeptide His-Leu (29). The catalytic mechanism of ACE in invertebrates is not clear. In humans, ACE activity depends on chloride ion concentration. Chloride mainly induces the active part of ACE and increases the binding of substrates (28). Each active domain of ACE exhibits different levels of sensitivity to different chloride concentrations (30). The C domain of sACE activates in the presence of chloride ions and is inactive in its absence. In contrast, the N domain is completely active at a very low chloride concentration and can even remain active in the absence of chloride (31). Seawater (salinity of 35 ppt) contains a chloride ion concentration of approximately 19,400 mg/L. The concentration of chloride ions in brackish water (salinity of 1-10 ppt) ranges from 500 to 5,000 mg/L. Freshwater (salinity of <0.5 ppt) has a lower chloride concentration, which can range from 1 to 250 mg/L (32). The concentration of chloride in the hemolymph of crustaceans is directly affected by the presence of this ion in the surrounding water (33). Therefore, the changes in ACE activity in the present study and other studies under different salinities might be related to the differences in the chloride ion concentration at different salinities.
Identification, characterization, and expression analysis of LV-APN
The LV-APN protein had the highest similarity to aminopeptidase N-like proteins in P. monodon (82.46%), P. chinensis (81.41%), and P. japonicus (72.71%). The comparison and phylogenic analysis of aminopeptidase N-like proteins in 18 species from different animal groups (i.e., crustaceans, fishes, mammals, and insects) revealed that aminopeptidase N-like proteins in crustaceans clustered together and had a close genetic distance. The APN protein in all 18 species was almost the same size (ranging from 933-1065 aa).
The expression analysis of LV-APN showed that this gene was expressed in all the examined tissues (i.e., eyestalk, hepatopancreas, and muscle) in both the control and low salinity groups, suggesting that LV-APN probably has a wide functional range. In the present study, the expression level of LV-APN in the eyestalk and muscle was downregulated after eight weeks of long-term low salinity stress. Short-term low salinity stress significantly downregulated the expression level of LV-APN in the eyestalk, hepatopancreas, and muscle. In the eyestalk, the expression of LV-APN significantly decreased at 6 h, 12 h, and 72 h of short-term low salinity stress. For the hepatopancreas and muscle, the downregulation was observed at 48 h and 3 h of short-term low salinity stress, respectively. Similarly, mRNA sequencing of mud crab S. paramamosain megalopa showed that the expression level of APN was downregulated under low salinity (34). The activity of APN in crustaceans is not limited to salinity adaptation. APN activity in the hepatopancreas of the euryhaline crab (Cyrtograpsus angulatus) was changed in response to salinity, pH, and water temperature challenges (35). This enzyme plays an important role in the final stages of protein digestion in mammals, and its activity in the intestine is considered an important indicator of protein digestive capacity (36). Therefore, the increase in the activity of APN in the hepatopancreas can lead to an increase in amino acid availability, which can be used in biochemical adjustments during salinity stress in crustaceans (37). Considering the findings of the present study, previous studies, and the important role of APN in the RAS pathway, it seems that APN participates in salinity adaptation not only by affecting the enzymatic activity of the hepatopancreas and energy availability. The changes in genes related to the RAS pathway (i.e., LV-ACE, LV-APN, LV-AT1R, and LV-RR) in different tissues (i.e., eyestalk, hepatopancreas, and muscle) indicate that APN might also be involved in salinity adaptation through the RAS pathway.
Identification, characterization, and expression analysis of LV-AT1R
Sequence homology and phylogenetic analysis revealed that LV-AT1R belongs to the type-1 angiotensin II receptor family. The structure and sequences of the AT1R protein in 18 various species were compared. Interestingly, AT1R proteins in crustaceans (175-176 aa), fishes (146-201 aa), and insects (151-173 aa) were smaller than AT1R proteins in mammals (358 aa). Moreover, the molecular mass and estimated IP of the AT1R protein in crustaceans (molecular mass: 19 kDa; IP: 4.7), fishes (molecular mass: 16-22 kDa; IP: 5-6), and insects (molecular mass: 16-19 kDa; IP: 5-6) were also lower than those in mammals (molecular mass: 40 kDa; IP: 9.4).
The mRNA of LV-AT1R was detected in all of the examined tissues. Eight weeks of long-term low salinity stress did not affect the expression level of LV-AT1R in the eyestalk, hepatopancreas, or muscle. During short-term low salinity stress, LV-AT1R was downregulated in the eyestalk at 12 h and 24 h. In the hepatopancreas and muscle, the downregulation was observed at 3 h and 24 h, respectively. The regulatory mechanism of AT1R in invertebrates is unknown, and the information is limited to some vertebrate species. AT1R receptors belong to the family of G protein-coupled receptors (GPCRs). Angiotensin II and angiotensin III stimulate AT1R receptors, and these receptors are inhibited by members of the sartan family such as losartan (38). Tyrosine4 and phenylalanine8 side chains are the key amino acids in angiotensin II that activate AT1R receptors (39). Angiotensin II and angiotensin III are the main effector peptides in the RAS pathway. The role of angiotensin II and angiotensin III in stimulating drinking, decreasing urine output, and perfusate flow rate in the kidney is well documented in fishes and mammals (38). In semiterrestrial crabs (Chasmagnathus granulatus), water deprivation elevated the level of angiotensin II neuropeptide in the brain and optic lobes (40). Two hours after water deprivation, the immunoreactivity of angiotensin II neuropeptide increased in the central body and decreased in the olfactory neuropil, indicating that angiotensin II regulates several neuronal activities during water shortages (40). In the clam worm Perinereis sp., angiotensin III and angiotensin II regulate body weight under different osmotic conditions. Angiotensin II and angiotensin III suppress net body fluid loss under hyperosmotic stress. Under hypoosmotic stress, they enhance net body fluid gain. Under drying conditions, angiotensin II suppressed body weight loss, but angiotensin III did not. These results showed that these two peptides regulate body fluid volume via the angiotensin II receptor in various ways (41).
Identification, characterization, and expression analysis of LV-RR
Sequence homology and phylogenetic analysis showed that the LV-RR protein had the highest degree of homology with renin receptors in P. monodon (94.74%), P. chinensis (93.50%), and P. japonicus (88.85%). The structure and sequences of the LV-RR protein in 18 various species were compared. The LV-RR protein in crustaceans consists of 323 amino acid residues. In crustaceans, the molecular mass and estimated IP were approximately 4.95 and 35 kDa, respectively. The LV-RR protein in insects and fishes was relatively larger than that in crustaceans and mammals. Unlike other elements of the RAS pathway, the RR gene is extremely conserved among species, and RR orthologs are found in several species from mammals to insects and crustaceans (42). The RR protein in mammals consists of approximately 350 amino acids and has a single transmembrane domain and a short cytoplasmic domain that has no intrinsic kinase activity. In mammals, the percent identity among human, rat, and mouse RR proteins is approximately 95% for the nucleotide sequence and over 80% for the amino acid sequences, showing that RR protein is a highly conserved protein (43).
The LV-RR mRNA was expressed in all of the examined tissues. The expression level of LV-RR in the eyestalk, hepatopancreas, and muscle was not affected by long-term low salinity stress. Short-term low salinity stress significantly downregulated the expression level of LV-RR in the eyestalk at 12 h and 24 h. In the hepatopancreas, the downregulation was recorded at 96 h. In the muscle, the expression of LV-RR significantly decreased at 3 h, 24 h, and 72 h of short-term low salinity stress. The RR protein is a multifunctional protein existing in different molecular forms, and its regulatory mechanism is very complicated. In addition to the RAS pathway, the activation of RR is triggered by other signaling pathways, such as the MAP kinase p38-heat shock protein 27 cascade and the PI3K-p85 pathway (44). Renin is an important modulator of the RAS pathway. Renin is the first rate-limiting step of the RAS, and its suppression directly affects the whole RAS pathway (45). Moreover, renin itself is modulated by several components of the RAS pathway and other pathways, including intracellular cAMP (stimulatory), Ca2+ (inhibitory), and cyclic guanosine monophosphate signaling pathways (30).
Conclusion
In the present study, four key genes (LV-ACE, LV-APN, LV-AT1R, and LV-RR) in the RAS pathway were cloned and characterized, and their expression patterns were investigated in different tissues (eyestalk, hepatopancreas, and muscle) under different salinity conditions. The LV-ACE, LV-APN, LV-AT1R, and LV-RR genes encode 666, 936, 175, and 323 amino acids, respectively. All four genes were expressed in all the examined tissues. In terms of the RAS pathway and its related genes, the eyestalk was the most sensitive tissue. Low salinity stress downregulated the expression levels of LV-ACE, LV-APN, LV-AT1R, and LV-RR in the eyestalk. Other tissues also displayed a similar trend, and the downregulation of these four genes indicates that the RAS pathway was suppressed under low salinity. The results of this study provide valuable information regarding the role of the RAS pathway in nonvertebrate species and the mechanism of salinity adaptation in L. vannamei. Further studies are required to reveal the regulatory mechanism (i.e., eyestalk ablation) and functional analysis (i.e., RNA interference and in situ hybridization) of the RAS pathway and its related genes in L. vannamei.
Data availability statement
The datasets presented in this study can be found in online repositories. The names of the repository/repositories and accession number(s) can be found in the article/Supplementary Material.
Author contributions
AF: manuscript writing, data analysis. YL: conducting experiments, data analysis. CX: conducting experiments, validating the data, and proofreading the manuscript. XW: experimental design, validation of the data, proofreading of the manuscript. EL: funding acquisition, supervision, experimental design, validation of the data, proof reading of the manuscript. All authors contributed to the article and approved the submitted version.
Funding
This study was supported by the National Natural Foundation of China (32060832) and the Initial Funding for Research and Development from Hainan University (KYQD[ZR]-22002).
Conflict of interest
The authors declare that the research was conducted in the absence of any commercial or financial relationships that could be construed as a potential conflict of interest.
Publisher’s note
All claims expressed in this article are solely those of the authors and do not necessarily represent those of their affiliated organizations, or those of the publisher, the editors and the reviewers. Any product that may be evaluated in this article, or claim that may be made by its manufacturer, is not guaranteed or endorsed by the publisher.
Supplementary material
The Supplementary Material for this article can be found online at: https://www.frontiersin.org/articles/10.3389/fendo.2022.1089419/full#supplementary-material
References
1. Fountain JH, Lappin SL. Physiology, renin angiotensin system. SUNY upstate medical university. Treasure Island (FL: StatPearls Publishing (2021). Available at: http://europepmc.org/abstract/MED/29261862.
2. Bader M, Ganten D. Update on tissue renin–angiotensin systems. J Mol Med (2008) 86:615–21. doi: 10.1007/s00109-008-0336-0
3. Kaschina E, Unger T. Angiotensin AT1/AT2 receptors: regulation, signalling and function. Blood Press (2003) 12:70–88. doi: 10.1080/08037050310001057
4. Rankin JC, Watanabe TX, Nakajima K, Broadhead C, Takei Y. Identification of angiotensin I in a cyclostome, lampetra fluviatilis. Zoolog Sci (2004) 21:173–9. doi: 10.2108/zsj.21.173
7. Kumai Y, Bernier NJ, Perry SF. Angiotensin-II promotes na+ uptake in larval zebrafish, danio rerio, in acidic and ion-poor water. J Endocrinol (2014) 220:195–205. doi: 10.1530/JOE-13-0374
8. Tierney ML, Luke G, Cramb G, Hazon N. The role of the renin-angiotensin system in the control of blood pressure and drinking in the European eel, Anguilla anguilla. Gen Comp Endocrinol (1995) 100:39–48. doi: 10.1006/gcen.1995.1130
9. Okawara Y, Karakida T, Aihara M, Yamaguchi K, Kobayashi H. Involvement of angiotensin 2 in water intake in the Japanese eel, Anguilla japonica. Zoolog Sci (1987) 4:p523–528. doi: 10.1016/0016-6480(79)90155-2
10. Anderson WG, Hyodo S, Tsukada T, Meischke L, Pillans RD, Good JP, et al. Sequence, circulating levels, and expression of c-type natriuretic peptide in a euryhaline elasmobranch, carcharhinus leucas. Gen Comp Endocrinol (2005) 144:90–8. doi: 10.1016/j.ygcen.2005.04.013
11. Brown JA, Cobb CS, Frankling SC, Rankin JC. Activation of the newly discovered cyclostome renin–angiotensin system in the river lamprey lampetra fluviatilis. J Exp Biol (2005) 208:223–32. doi: 10.1242/jeb.01362
12. Liu B, Gao Q, Liu B, Song C, Sun C, Liu M, et al. Application of transcriptome analysis to understand the adverse effects of hypotonic stress on different development stages in the giant freshwater prawn macrobrachium rosenbergii post-larvae. Antioxidants (2022) 11:440. doi: 10.3390/antiox11030440
13. Farhadi A, Liu Y, Xu C, Han T, Wang X, Li E. Evidence from transcriptome analysis unravelled the roles of eyestalk in salinity adaptation in pacific white shrimp (Litopenaeus vannamei). Gen Comp Endocrinol (2022) 329:114120. doi: 10.1016/j.ygcen.2022.114120
14. Flores M, Díaz F, Medina R, Re AD, Licea A. Physiological, metabolic and haematological responses in white shrimp litopenaeus vannamei (Boone) juveniles fed diets supplemented with astaxanthin acclimated to low-salinity water. Aquac Res (2007) 38:740–7. doi: 10.1111/j.1365-2109.2007.01720.x
15. Gao W, Tan B, Mai K, Chi S, Liu H, Dong X, et al. Profiling of differentially expressed genes in hepatopancreas of white shrimp (Litopenaeus vannamei) exposed to long-term low salinity stress. Aquaculture (2012) 364–365:186–91. doi: 10.1016/j.aquaculture.2012.08.024
16. Li E, Chen L, Zeng C, Chen X, Yu N, Lai Q, et al. Growth, body composition, respiration and ambient ammonia nitrogen tolerance of the juvenile white shrimp, litopenaeus vannamei, at different salinities. Aquaculture (2007) 265:385–90. doi: 10.1016/j.aquaculture.2007.02.018
17. Wang X, Wang S, Li C, Chen K, Qin JG, Chen L, et al. Molecular pathway and gene responses of the pacific white shrimp Litopenaeus vannamei to acute low salinity stress. J Shellfish Res (2015) 34:1037–48. doi: 10.2983/035.034.0330
18. Valencia-Castañeda G, Frías-Espericueta MG, Vanegas-Pérez RC, Chávez-Sánchez MC, Páez-Osuna F. Physiological changes in the hemolymph of juvenile shrimp litopenaeus vannamei to sublethal nitrite and nitrate stress in low-salinity waters. Environ Toxicol Pharmacol (2020) 80:103472. doi: 10.1016/j.etap.2020.103472
19. Armenteros JJA, Tsirigos KD, Sønderby CK, Petersen TN, Winther O, Brunak S, et al. SignalP 5.0 improves signal peptide predictions using deep neural networks. Nat Biotechnol (2019) 37:420–3. doi: 10.1038/s41587-019-0036-z
20. Kumar S, Stecher G, Li M, Knyaz C, Tamura K. MEGA X: molecular evolutionary genetics analysis across computing platforms. Mol Biol Evol (2018) 35:1547–9. doi: 10.1093/molbev/msy096
21. Livak KJ, Schmittgen TD. Analysis of relative gene expression data using real-time quantitative pcr and the 2(-delta delta c(t)). Methods (2001) 25:402–8. doi: 10.1006/meth.2001.1262
22. Armesto P, Cousin X, Salas-Leiton E, Asensio E, Manchado M, Infante C. Molecular characterization and transcriptional regulation of the renin-angiotensin system genes in Senegalese sole (Solea senegalensis kaup, 1858): Differential gene regulation by salinity. Comp Biochem Physiol Part A Mol Integr Physiol (2015) 184:6–19. doi: 10.1016/j.cbpa.2015.01.021
23. Rider SA, Mullins LJ, Verdon RF, Macrae CA, Mullins JJ. Renin expression in developing zebrafish is associated with angiogenesis and requires the notch pathway and endothelium. Am J Physiol Ren Physiol (2015) 309:F531–9. doi: 10.1152/ajprenal.00247.2015
24. Kim B-M, Jeong C-B, Han J, Kim I-C, Rhee J-S, Lee J-S. Role of crustacean hyperglycemic hormone (CHH) in the environmental stressor-exposed intertidal copepod tigriopus japonicus. Comp Biochem Physiol Part C Toxicol Pharmacol (2013) 158:131–41. doi: 10.1016/j.cbpc.2013.06.001
25. Zhao X, White R, Van Huysse J, Leenen FHH. Cardiac hypertrophy and cardiac renin–angiotensin system in Dahl rats on high salt intake. J Hypertens (2000) 18:1319–26. doi: 10.1097/00004872-200018090-00018
26. Zhou J, Li N, Wang H, Wang C, Mu C. iTRAQ-based quantitative proteomic analysis reveals metabolic changes in overwintering Scylla paramamosain at two different salinities. Aquac Res (2021) 52:3757–70. doi: 10.1111/are.15221
27. Imanishi T, Ikejima H, Tsujioka H, Kuroi A, Kobayashi K, Muragaki Y, et al. Addition of eplerenone to an angiotensin-converting enzyme inhibitor effectively improves nitric oxide bioavailability. Hypertension (2008) 51:734–41. doi: 10.1161/HYPERTENSIONAHA.107.104299
28. Riordan JF. Angiotensin-i-converting enzyme and its relatives. Genome Biol (2003) 4:1–5. doi: 10.1186/gb-2003-4-8-225
29. Fyhrquist F, Saijonmaa O. Renin-angiotensin system revisited. J Intern Med (2008) 264:224–36. doi: 10.1111/j.1365-2796.2008.01981.x
30. Guang C, Phillips RD, Jiang B, Milani F. Three key proteases–angiotensin-I-converting enzyme (ACE), ACE2 and renin–within and beyond the renin-angiotensin system. Arch Cardiovasc Dis (2012) 105:373–85. doi: 10.1016/j.acvd.2012.02.010
31. Araujo MC, Melo RL, Cesari MH, Juliano MA, Juliano L, Carmona AK. Peptidase specificity characterization of c-and n-terminal catalytic sites of angiotensin I-converting enzyme. Biochemistry (2000) 39:8519–25. doi: 10.1021/bi9928905
32. Abuelaish SB, Olmedo TMC. Analysis and modelling of groundwater salinity dynamics in the Gaza strip. Cuad Geogr (2018) 57:72–91. doi: 10.30827/cuadgeo.v57i2.5914
33. Chen J-C, Chia P-G. Osmotic and ionic concentrations of Scylla serrata (Forskål) subjected to different salinity levels. Comp Biochem Physiol Part A Physiol (1997) 117:239–44. doi: 10.1016/S0300-9629(96)00237-X
34. Zhang Y, Wu Q, Fang S, Li S, Zheng H, Zhang Y, et al. mRNA profile provides novel insights into stress adaptation in mud crab megalopa, Scylla paramamosain after salinity stress. BMC Genomics (2020) 21:1–16. doi: 10.1186/s12864-020-06965-5
35. Michiels MS, del Valle JC, López Mañanes AA. Trypsin and n-aminopeptidase (APN) activities in the hepatopancreas of an intertidal euryhaline crab: Biochemical characteristics and differential modulation by histamine and salinity. Comp Biochem Physiol Part A Mol Integr Physiol (2017) 204:228–35. doi: 10.1016/j.cbpa.2016.12.003
36. Ramirez-Otarola N, Narváez C, Sabat P. Membrane-bound intestinal enzymes of passerine birds: dietary and phylogenetic correlates. J Comp Physiol B (2011) 181:817–27. doi: 10.1007/s00360-011-0557-3
37. Michiels MS, del Valle JC, Lopez Mañanes AA. Biochemical characteristics and modulation by external and internal factors of aminopeptidase-n activity in the hepatopancreas of a euryhaline burrowing crab. J Comp Physiol B (2015) 185:501–10. doi: 10.1007/s00360-015-0899-3
38. Russell MJ, Klemmer AM, Olson KR. Angiotensin signaling and receptor types in teleost fish. Comp Biochem Physiol Part A Mol Integr Physiol (2001) 128:41–51. doi: 10.1016/S1095-6433(00)00296-8
39. Miura S, Feng Y-H, Husain A, Karnik SS. Role of aromaticity of agonist switches of angiotensin II in the activation of the AT1 receptor. J Biol Chem (1999) 274:7103–10. doi: 10.1074/jbc.274.11.7103
40. Frenkel L, Dimant B, Portiansky EL, Imboden H, Maldonado H, Delorenzi A. Neuroanatomical distribution of angiotensin-II-like neuropeptide within the central nervous system of the crab chasmagnathus; physiological changes triggered by water deprivation. Cell Tissue Res (2010) 341:181–95. doi: 10.1007/s00441-010-0990-8
41. Satou R, Nakagawa T, Ido H, Tomomatsu M, Suzuki F, Nakamura Y. Angiotensin II and III upregulate body fluid volume of the clam worm perinereis sp. Angiotensin II Receptors Diff Manners Peptides (2005) 26:2452–7. doi: 10.1016/j.peptides.2005.05.017
42. Nguyen G, Muller DN. The biology of the (pro) renin receptor. J Am Soc Nephrol (2010) 21:18–23. doi: 10.1681/ASN.2009030300
43. Bader M. Spotlight on renin the second life of the (Pro) renin receptor. J Renin-Angiotensin-Aldosterone Syst (2007) 8:205–8. doi: 10.3317/jraas.2007.031
44. Schefe JH, Menk M, Reinemund J, Effertz K, Hobbs RM, Pandolfi PP, et al. A novel signal transduction cascade involving direct physical interaction of the renin/prorenin receptor with the transcription factor promyelocytic zinc finger protein. Circ Res (2006) 99:1355–66. doi: 10.1161/01.RES.0000251700.00994.0d
Keywords: adaptation, osmoregulation, renin-angiotensin system (RAS), shrimp, gene experession
Citation: Farhadi A, Liu Y, Xu C, Wang X and Li E (2022) The role of the renin-angiotensin system (RAS) in salinity adaptation in Pacific white shrimp (Litopenaeus vannamei). Front. Endocrinol. 13:1089419. doi: 10.3389/fendo.2022.1089419
Received: 04 November 2022; Accepted: 30 November 2022;
Published: 15 December 2022.
Edited by:
Wen Liu, Huazhong Agricultural University, ChinaReviewed by:
Mohammad Munir, Universiti Malaysia Sarawak, MalaysiaSusan Glendinning, University of thes Sunshine Coast, Australia
Copyright © 2022 Farhadi, Liu, Xu, Wang and Li. This is an open-access article distributed under the terms of the Creative Commons Attribution License (CC BY). The use, distribution or reproduction in other forums is permitted, provided the original author(s) and the copyright owner(s) are credited and that the original publication in this journal is cited, in accordance with accepted academic practice. No use, distribution or reproduction is permitted which does not comply with these terms.
*Correspondence: Xiaodan Wang, eGR3YW5nQGJpby5lY251LmVkdS5jbg==; Erchao Li, ZWNsaUBiaW8uZWNudS5lZHUuY24=
†These authors have contributed equally to this work