 Wan-Ying Wang
 Zhong-Ze Fang
- Department of Toxicology and Sanitary Chemistry, School of Public Health, Tianjin Medical University, Tianjin, China
Objective: Diabetic retinopathy is a common complication of type 2 diabetes mellitus (T2DM). Due to the limited effectiveness of current prevention and treatment methods, new biomarkers are urgently needed for the prevention and diagnosis of DR. This study aimed to explore the relationships between plasma acylcarnitine with DR in T2DM.
Methods: From May 2015 to August 2016, data of 1032 T2DM patients were extracted from tertiary hospitals. Potential non-linear associations were tested by binary logistic regression models, and ORs and 95% CIs of the research variables were obtained. Correlation heat map was used to analyze the correlation between variables. The change of predictive ability was judged by the area under the receiver operating characteristic curve.
Results: Of the 1032 patients with T2DM, 162 suffered from DR. After adjusting for several confounding variables, C2 (OR:0.55, 95%CI:0.39-0.76), C14DC (OR:0.64, 95%CI:0.49-0.84), C16 (OR:0.64, 95%CI:0.49-0.84), C18:1OH (OR:0.51, 95%CI:0.36-0.71) and C18:1 (OR:0.60, 95%CI:0.44-0.83) were negatively correlated with DR. The area under the curve increased from 0.794 (95% CI 0.745 to 0.842) to 0.840 (95% CI 0.797 to 0.833) when C2, C14DC, C18:1OH and C18:1 added to the traditional risk factor model.
Conclusion: There was a negative correlation between C2, C14DC, C16, C18:1OH, and C18:1 and the risk of retinopathy in patients with T2DM. C2, C14DC, C18:1OH, and C18:1 may be new predictors and diagnostic markers of DR.
Introduction
Diabetes is a chronic disease prevalent all over the world. It is estimated that the global prevalence of diabetes was about 9.3% in 2019, and it will rise to 10.2% by 2030 and 10.9% by 2045 (1). China currently has the largest number of diabetic patients in the world (2). Diabetic retinopathy(DR), as a common microvascular complication of type 2 diabetes mellitus (T2DM), is the main cause of visual impairment and blindness among working-age people, which brings a heavy burden to society and families (3). The main treatments of DR include anti-vascular endothelial growth factor therapy, laser photocoagulation, corticosteroids, and vitrectomy (4). Since these invasive treatments are mainly used in the late stage of irreversible injury, we need new biomarkers for the prevention and screening of DR (5).
The pathogenesis of DR is complex, involving a variety of vascular, inflammatory, and neural mechanisms (6–8). Inflammation mediates structural and molecular alterations related to DR. However, the molecular mechanism of DR-related inflammatory pathways has not been fully elucidated (9). Studies have shown that different fatty acid (FA) metabolism will produce different inflammatory effects (10–13). As an intermediate of FA metabolism, the level of acylcarnitine (AC) is closely related to FA metabolism (14–16). The level of ACs reflects FAs metabolism in obese and T2DM people (17). As a marker of inflammation, the level of ACs was different from that of healthy and lean humans (18, 19). In this study, we aimed to test the associations between plasma AC levels and risk of DR. Determining the difference in AC profile is helpful to find new targets for early diagnosis of DR.
Materials and Methods
Research Design and Study Patients
In this study, a cross-sectional design was used to investigate the relationship between AC and DR. The objects and methods of this study have been described in detail in previous studies (20). In short, from May 2015 to August 2016, the Liaoning Medical University First Affiliated Hospital (LMUFAH) had 1,898 consecutive inpatients with T2DM. T2DM meets the diagnostic criteria of the WHO in 1999 (21). Their electronic medical records were retrieved and metabolomics profiles were measured. 1032 patients older than 18 years with complete information of anthropometric and AC metabolism and a clear DR diagnosis were eventually enrolled. The LMUFAH Clinical Research Ethics Committee approved the ethics of this study. Due to the retrospective nature of the study, informed consent was exempted, consistent with the Declaration of Helsinki.
Data Collection and Definitions
Information of demographic and anthropometric, diabetes duration, clinical and laboratory measurements, and diagnosis of DR was recorded in the electronic medical records. Clinical indicators include systolic blood pressure (SBP), diastolic blood pressure (DBP), glycosylated hemoglobin (HbA1c), triglycerides (TG), high-density lipoprotein cholesterol (HDL-C), and low-density lipoprotein cholesterol (LDL-C).
Clinical Definitions
DR was defined as the presence of microaneurysm, soft exudate, hard exudate, retinal hemorrhage, or vitreous hemorrhage, which was evaluated by binocular retinography (22). The SBP and DBP of the patients were measured by a calibrated mercury sphygmomanometer after sitting for 5 to 10 minutes. Body mass index (BMI) was calculated by dividing weight in kilograms by height in meters squared. According to the WHO’s Asian body mass index standards, BMI was divided into four categories: underweight (<18.5 kg/m2), normal weight (18.5-23.9 kg/m2), overweight (24.0-27.9 kg/m2), and obesity (≥28.0 kg/m2) (23). Hyperglycemia and dyslipidemia were defined as failure to meet the treatment goals recommended by the American Diabetes Association, that is, HbA1c≥7% as hyperglycemia; TG≥1.7 mmol/L, LDL-C≥2.6 mmol/L, male HDL-C ≤ 1 mmol/L or female HDL-C ≤ 1.3 mmol/L as dyslipidemia (24).
AC was divided into short-chain AC (C2 to C6), medium-chain AC (C8 to C14), and long-chain AC (C16 to C26) according to the number of carbon atoms in the acyl chain (25).
Acylcarnitine Quantification
Methods of AC had been described in previous studies (26). Briefly, the dry blood spot samples of finger puncture were collected after fasting for 8 hours, and the samples were detected by mass spectrometry (MS) technology. The MS metabolic analysis was performed using the AB Sciex 4000 QTrap system (AB Sciex, Framingham, MA, USA). The electrospray ionization source was an ion source. The ion spray voltage was 4.5kV. Positive mode was performed to scan analytes. Each dried sample was dissolved in 100μL fresh mobile phase solution. The mobile phase was 80% acetonitrile aqueous solution. Absolute quantification used AC isotope-labeled internal standard from Cambridge Isotope Laboratories (Tewksbury, Massachusetts, USA). Mixed and dissolved the standards in 2mL pure methanol and stored it at 4°C. Working solution was prepared through 100-fold dilution for metabolite extraction.
Statistical Analysis
Continuous variables with a normal distribution are reported as mean (SD), and skewed variables are reported as median (IQR). Check normality by observing the Q-Q plot. Categorical variables are expressed in frequency (%). Participants were divided into two groups according to their DR status. The non-paired Student t-test for normally distributed variables or the Mann-Whitney U test for skewed distribution variables were used to compare the differences between the two groups. The χ2 test or the eligible Fisher test was used to compare the differences between the two groups of categorical variables.
A single-factor binary logistic regression model was used to obtain the OR value and 95% confidence interval of the degree of the reaction AC on the DR. Use structural adjustment programs to control the confounding effects of other variables. First, obtain an unadjusted OR; secondly, perform multivariate analysis to adjust traditional risk factors, including age, gender, SBP, DBP, BMI, and diabetes duration (multivariate model 1); finally, add HDL-C, LDL-C, HbA1c, and TG (multivariate model 2) based on model 1, to obtain the adjusted OR value of AC with statistical significance.
The correlation heat map was drawn to analyze the correlation of the incoming variables adjusted by logistic regression. Delete the related variables with less contribution to the model. The correlation coefficient is r ≥ 0.8, indicating a significant correlation between variables. Receiver operating characteristic curve (ROC) was drawn to compare the difference of area under the ROC curve (AUC) and determine whether the prediction ability of the DR model increased after adding AC.
P values of <0.05 were considered statistically significant and were corrected by Bonferroni. All analyses were performed using R V.4.0. R packets used include caret, randomForest, tableone survival, epiDisplay, and kernlab.
Result
Characteristics of the Study Patients
The average age of 1032 T2DM patients included in this study was 57.2 (SD 13.8) years, of which 53.2% were males. The average BMI of the study population was 25.3 (SD 3.9) kg/m2, of which overweight and obesity accounted for 63.1%. There were 162 patients with DR. The median diabetes duration in the DR group was 13 (IQR 6-20) years, significantly higher than that in the control group (M 4, IQR 0-10). In addition, compared with the non-DR group, there were more women in the DR group, higher SBP, lower HbA1c levels, and a higher proportion of patients with abnormal levels of TG and LDL-C. Other characteristics were similar between the two groups (Table 1).
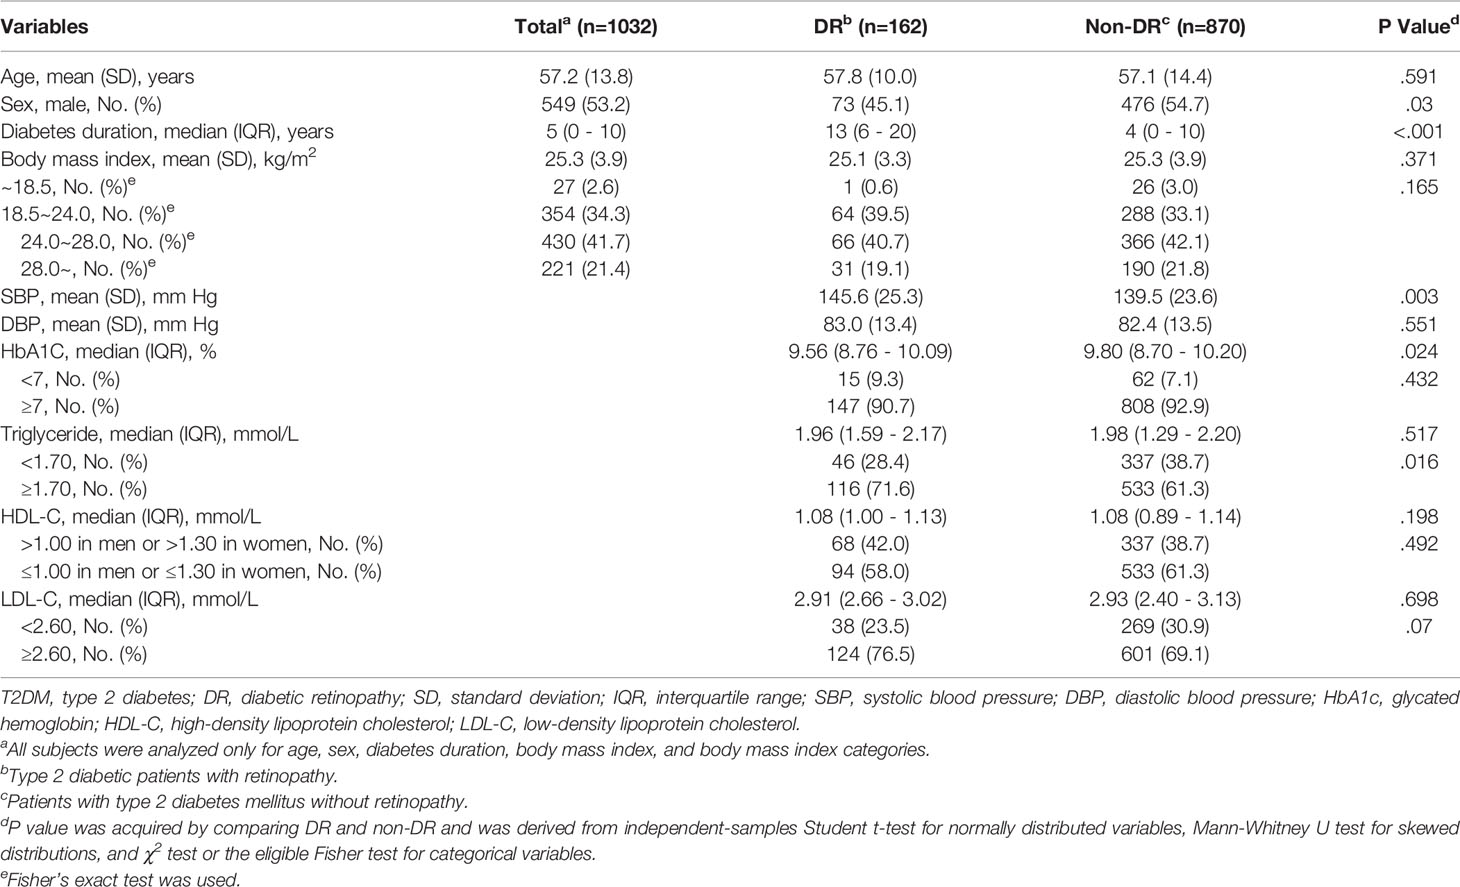
Table 1 Characteristics of patients with T2DM according to DR status.
The results showed that the levels of C2, C3, C4, C5, C6DC, C14, C14DC, C14:1, C16, C16OH, C16:1OH, C18, C18OH, C18:1, C18:1OH, C20, C22, and C26 in the DR group were lower than those in the control group, and the contents of other AC were similar in the two groups (Table 2).
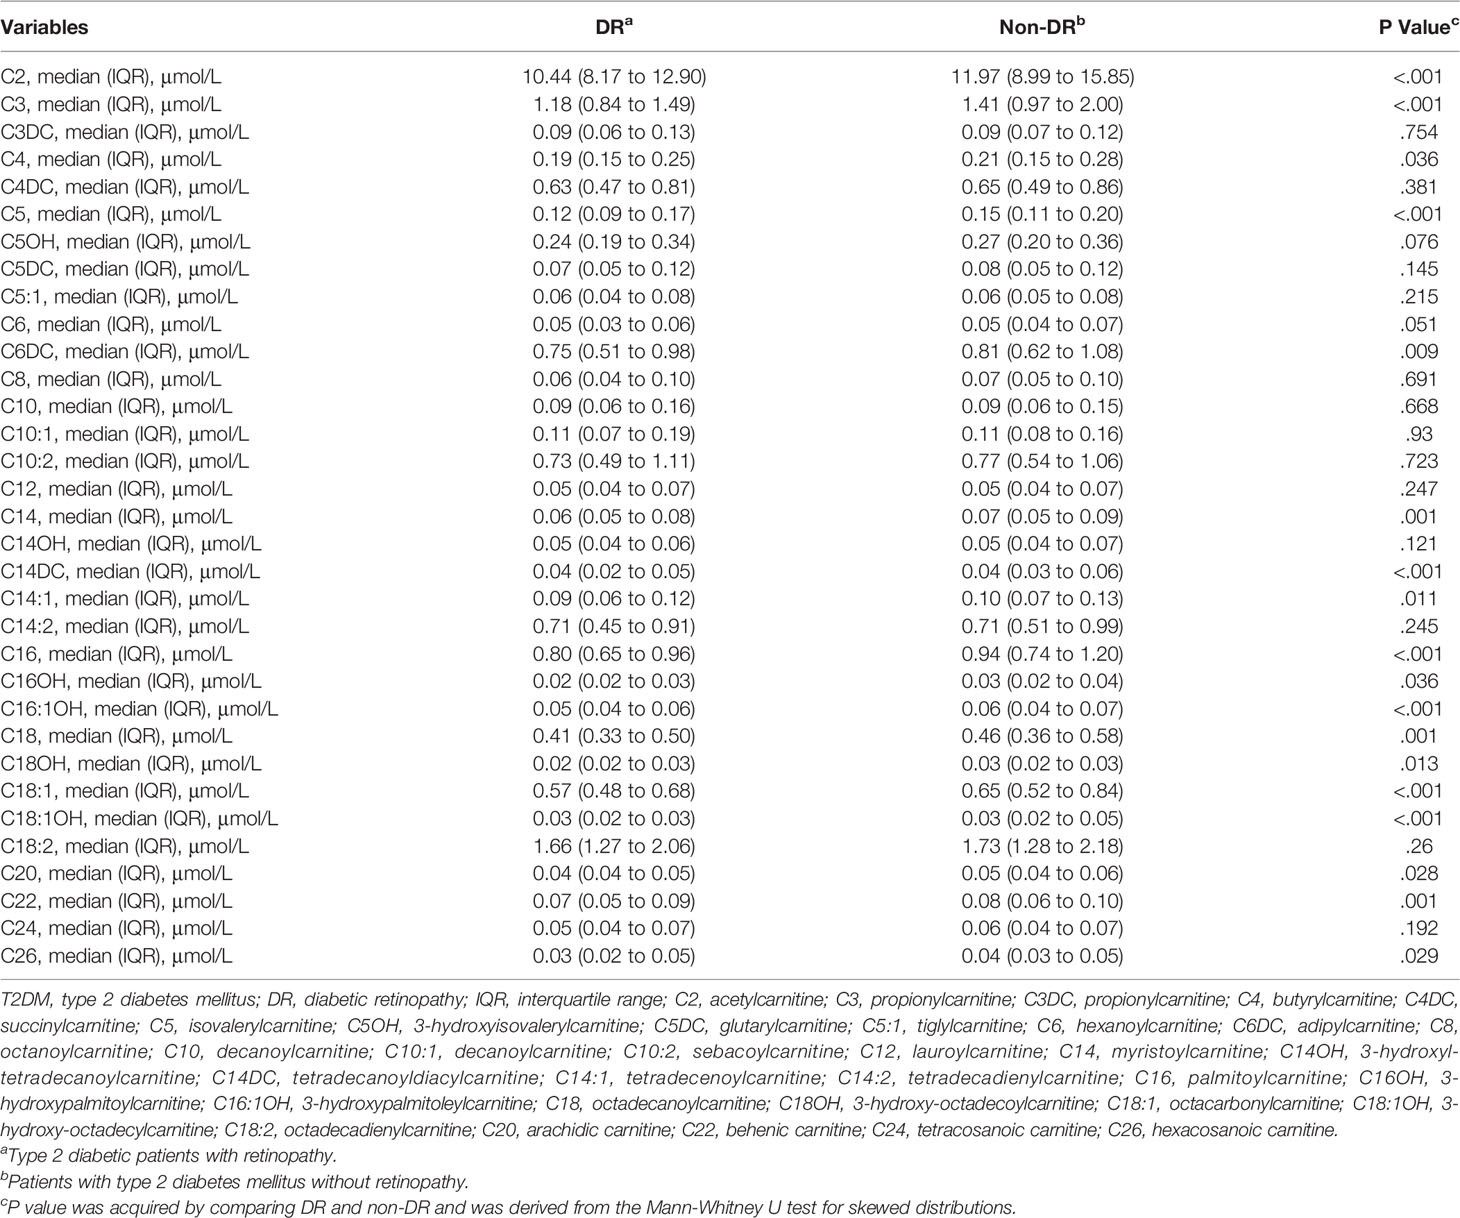
Table 2 Acylcarnitine profile in T2DM patients.
Associations of Acylcarnitines With DR Risk
Table 3 shows the results of univariate logistic regression. C2, C3, C5, C6, C14:1, C14DC, C16, C16:1OH, C18, C18:1, C18:1OH, C18OH, C20, and C22 were adjusted for p<0.05, OR < 1, which was negatively correlated with risk of DR. Add traditional risk factors (age, gender, BMI, SBP, BP, and diabetes duration) to the univariate logistic regression model to adjust for confounding factors (multivariate model 1) and get C2, C14DC, C16, C18:1, and C18:1OH P-value <0.05. Based on multivariate model 1, we continue to adjust HbA1c, TG, HDL-C, and LDL-C (multivariate model 2). The effects of C2, C14DC, C16, C18:1OH, and C18 were almost unchanged (Table 4). See Supplementary Material for all results of multivariate analysis.
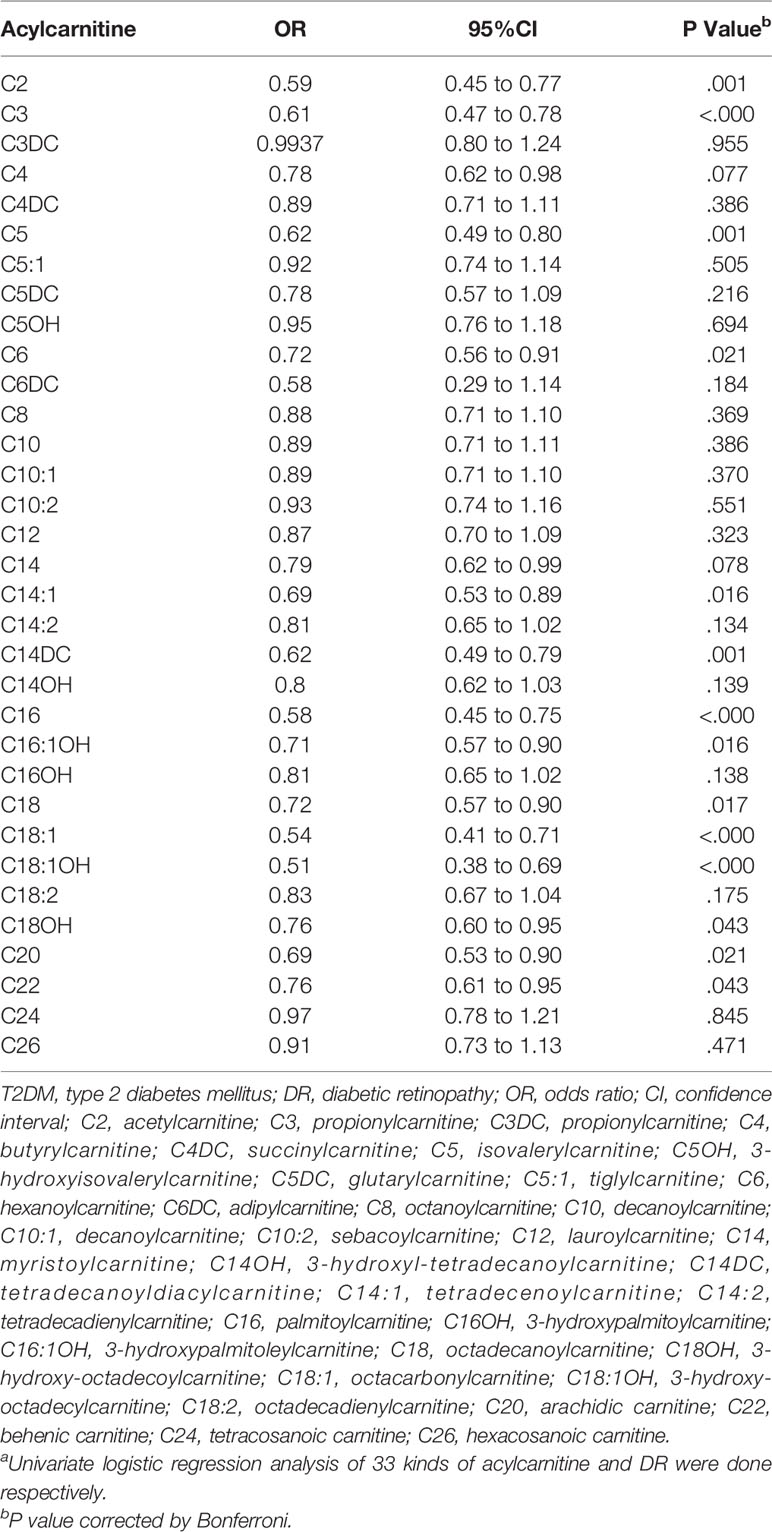
Table 3 OR of acylcarnitine for DR risk in T2DM (univariable model)a.
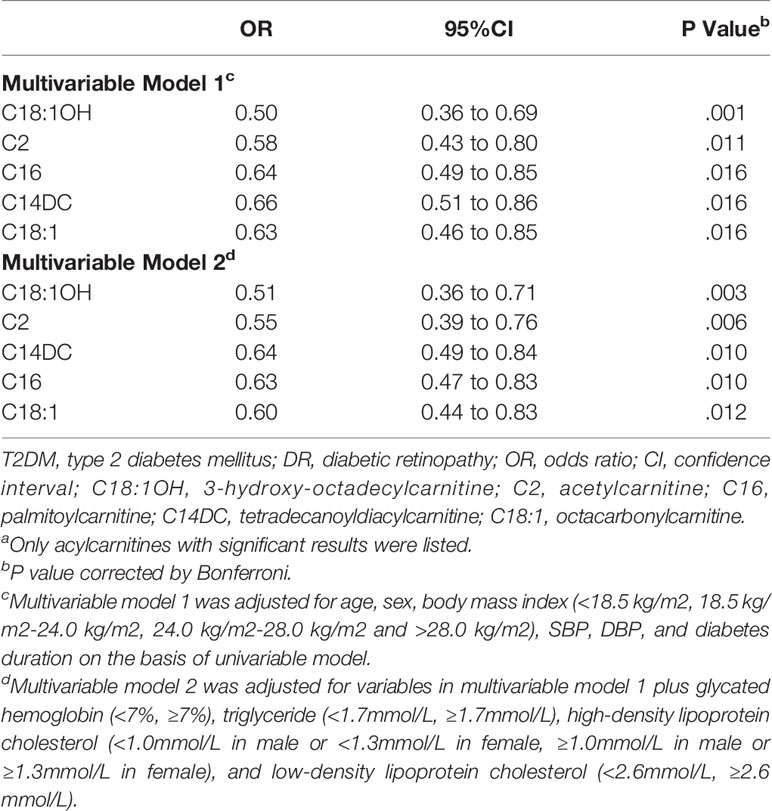
Table 4 OR of Acylcarnitine for DR risk in T2DM (Multivariable model)a.
Correlation Analysis Between Predictors
Correlation analysis of age, SBP, DBP, diabetes duration, C2, C14DC, C16, C18:1, and C18:1OH showed that the correlation coefficient between C16 and C18:1 was 0.81 (p<0.05) (Figure 1).
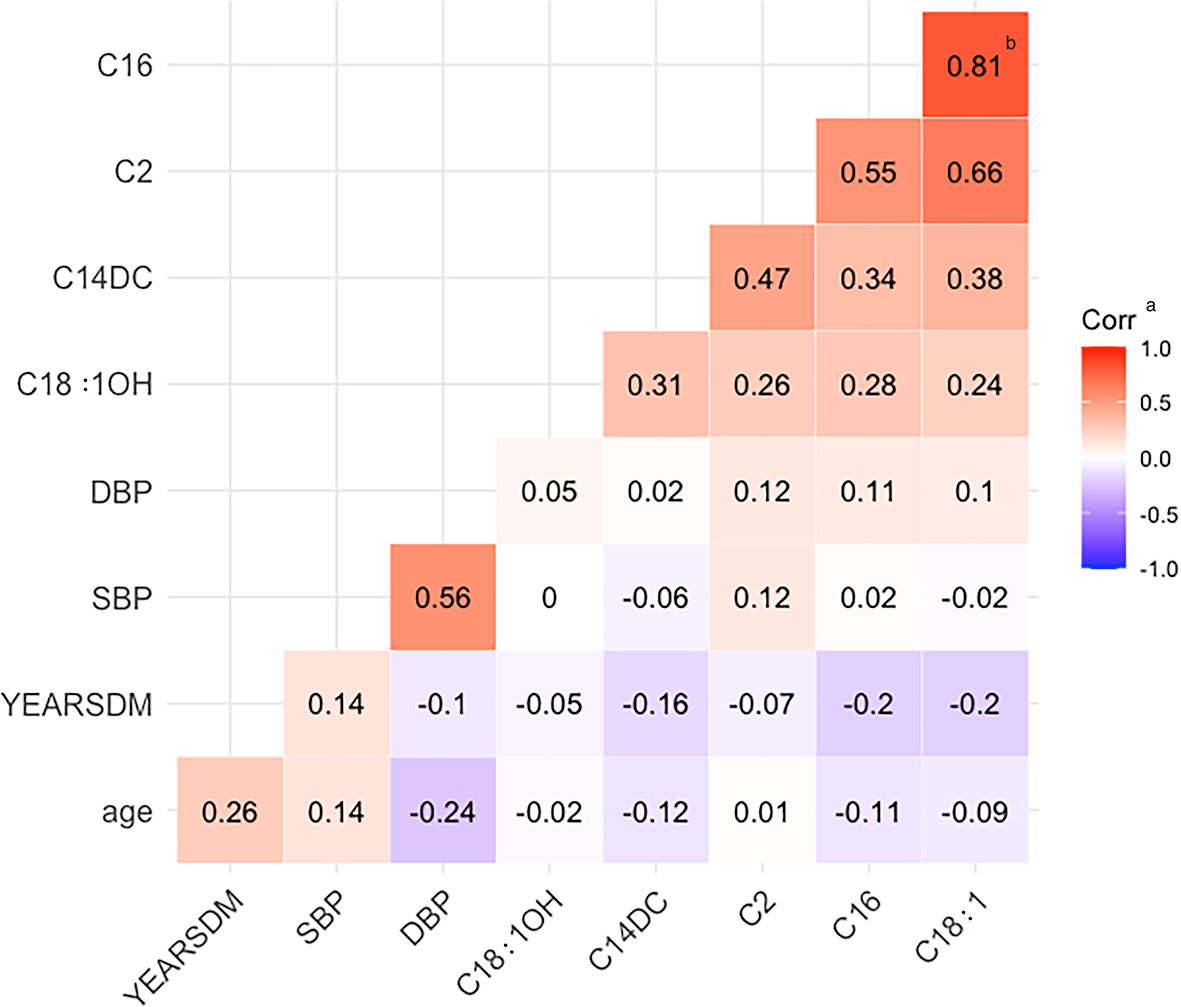
Figure 1 Heat map of correlation. YEARSDM, diabetes duration; SBP, systolic blood pressure; DBP, diastolic blood pressure; C18:1OH, 3-hydroxy-octadecylcarnitine; C14DC, tetradecanoyldiacylcarnitine; C2, acetylcarnitine; C16, palmitoylcarnitine; C18:1, octacarbonylcarnitine. aCorr, the correlation coefficient r, red indicates positive correlation, blue indicates negative correlation, r > 0.8 indicates that the two variables correlate. bThe two positively correlated variables, C16 and C18:1, had a correlation coefficient of 0.81.
Potential Increase in Predictive Values of Acylcarnitine for DR
The AUC was significantly increased by adding C2, C14DC, C18:1OH, and C18:1 to the traditional risk factor model, and the OR value increased from 0.794 (95%CI, 0.745-0.842) to 0.840 (95%CI, 0.797-0.883) (p = 0.0018) (Figure 2). Since C16 contributed less variance to the logistic regression model, it was deleted.
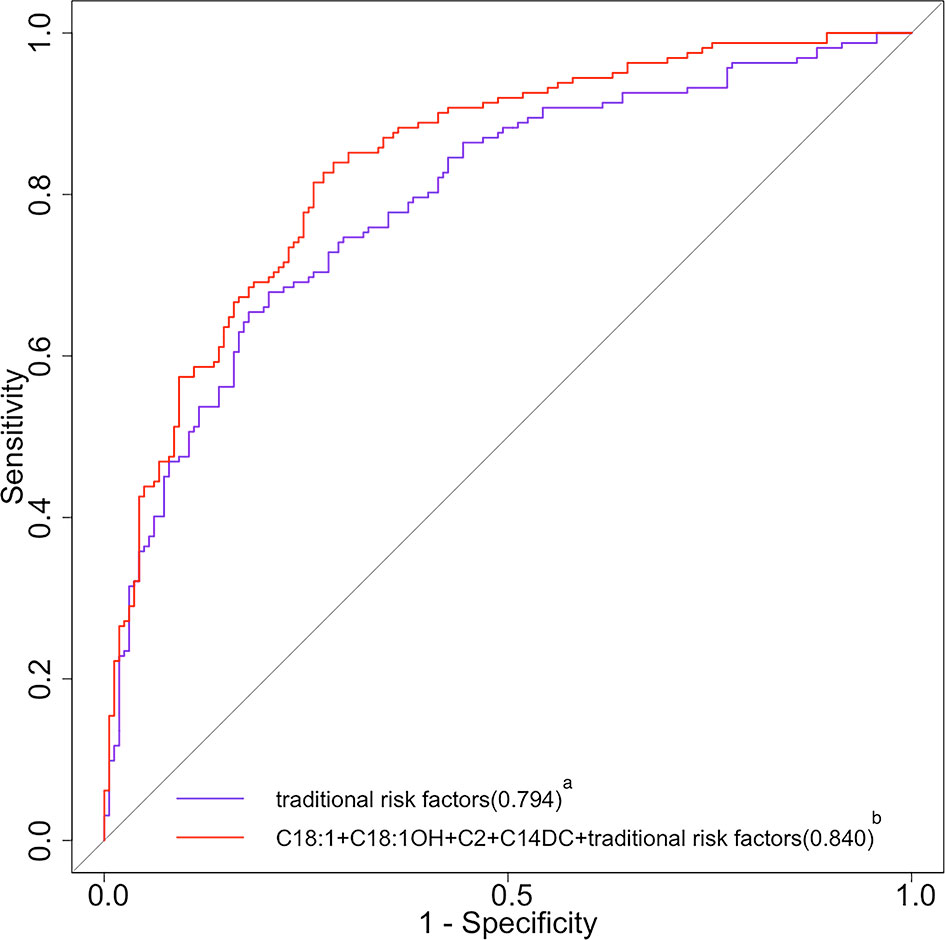
Figure 2 ROC curves of traditional risk factors and traditional risk factors plus acylcarnitine for DR. ROC, receiver operating characteristic; DR, diabetic retinopathy; C18:1, octacarbonylcarnitine; C18:1OH, 3-hydroxy-octadecylcarnitine; C2, acetylcarnitine; C14DC, tetradecanoyldiacylcarnitine. aThe purple curve stands for the traditional risk factor model (multivariable model 1 in Table 4 for the list of variables); the area under the operating characteristic curve was 0.794 (95% CI 0.745 to 0.842) for the traditional risk factor model. bThe red curve stands for the traditional risk factors plus C18, C18:1OH, C2, and C14DC; the area under the operating characteristic curve was 0.840 (95% CI 0.797 to 0.883) for the traditional risk factor plus C18, C18:1OH, C2, and C14DC (p<0.05 for comparison of the traditional risk factor model).
Discussion
In this cross-sectional study, we analyzed the effect of AC levels on the risk of DR in T2DM patients. It could be seen that the levels of C2, C14DC, C16, C18:1OH, and C18:1 were decreased in DR patients, which was significantly related to the reduced risk of DR. This relationship was independent of other AC and traditional diabetes risk factors, suggesting that the risk of DR in T2DM patients might increase with the decrease of these AC levels. The AUC of the model was improved by adding C2, C14DC, C18:1OH, and C18:1 to the traditional prediction model. These AC metabolites were mainly long-chain AC.
DR is an inflammatory disease characterized by the destruction of the blood-retinal barrier, inflammatory process, and increased vascular permeability (27). Chronic hyperglycemia can induce the occurrence of DR, because the blood glucose control of diabetic patients can not completely stop the progress of DR after the normal level, indicating that other factors are affecting the progress of DR besides hyperglycemia (28). At present, many studies have focused on the effect of lipid metabolism on metabolic disorders, but it is not clear how AC, an intermediate product of lipid metabolism, affects the occurrence and development of diseases.
The lipid is an important part of the retina, which plays an important role in the function of the retina. Abnormal lipid metabolism is one of the important factors leading to the progress of DR (29, 30). In the process of mitochondrial metabolism of long-chain fatty acids (LCFAs), it is necessary to esterify carnitine with carnitine to form AC, and then proceed to the next step of metabolism (31). This is because neither LCFAs nor their coenzyme A (CoA) esters can pass through the mitochondrial inner membrane alone, so carnitine is an essential substance for LCFAs to enter the mitochondria through AC intermediates before β-oxidation (25). The acyl part can be transferred between CoA and carnitine through the reversible reaction of carnitine palmitoyltransferase I (CPT1) and II (CPT2). Carnitine binds the acyl residues on CoA to form free radicals and long-chain acyl-COAs (32). Long-chain acyl-COAs are converted to AC under the action of CPT1. Carnitine translocation enzyme (CACT) catalyzes AC to pass through the inner membrane of mitochondria (33). Then, the LCFAs are converted to long-chain acyl-CoA in the presence of CPT2 for β-oxidation. In this process, the number of carbon atoms of acyl-CoA decreases continuously, then enters the oxidation pathway of short-chain fatty acids (SCFAs), and finally produces acetyl-CoA to provide energy by participating in the tricarboxylic acid cycle (TCA cycle) (Figure 3A) (34).
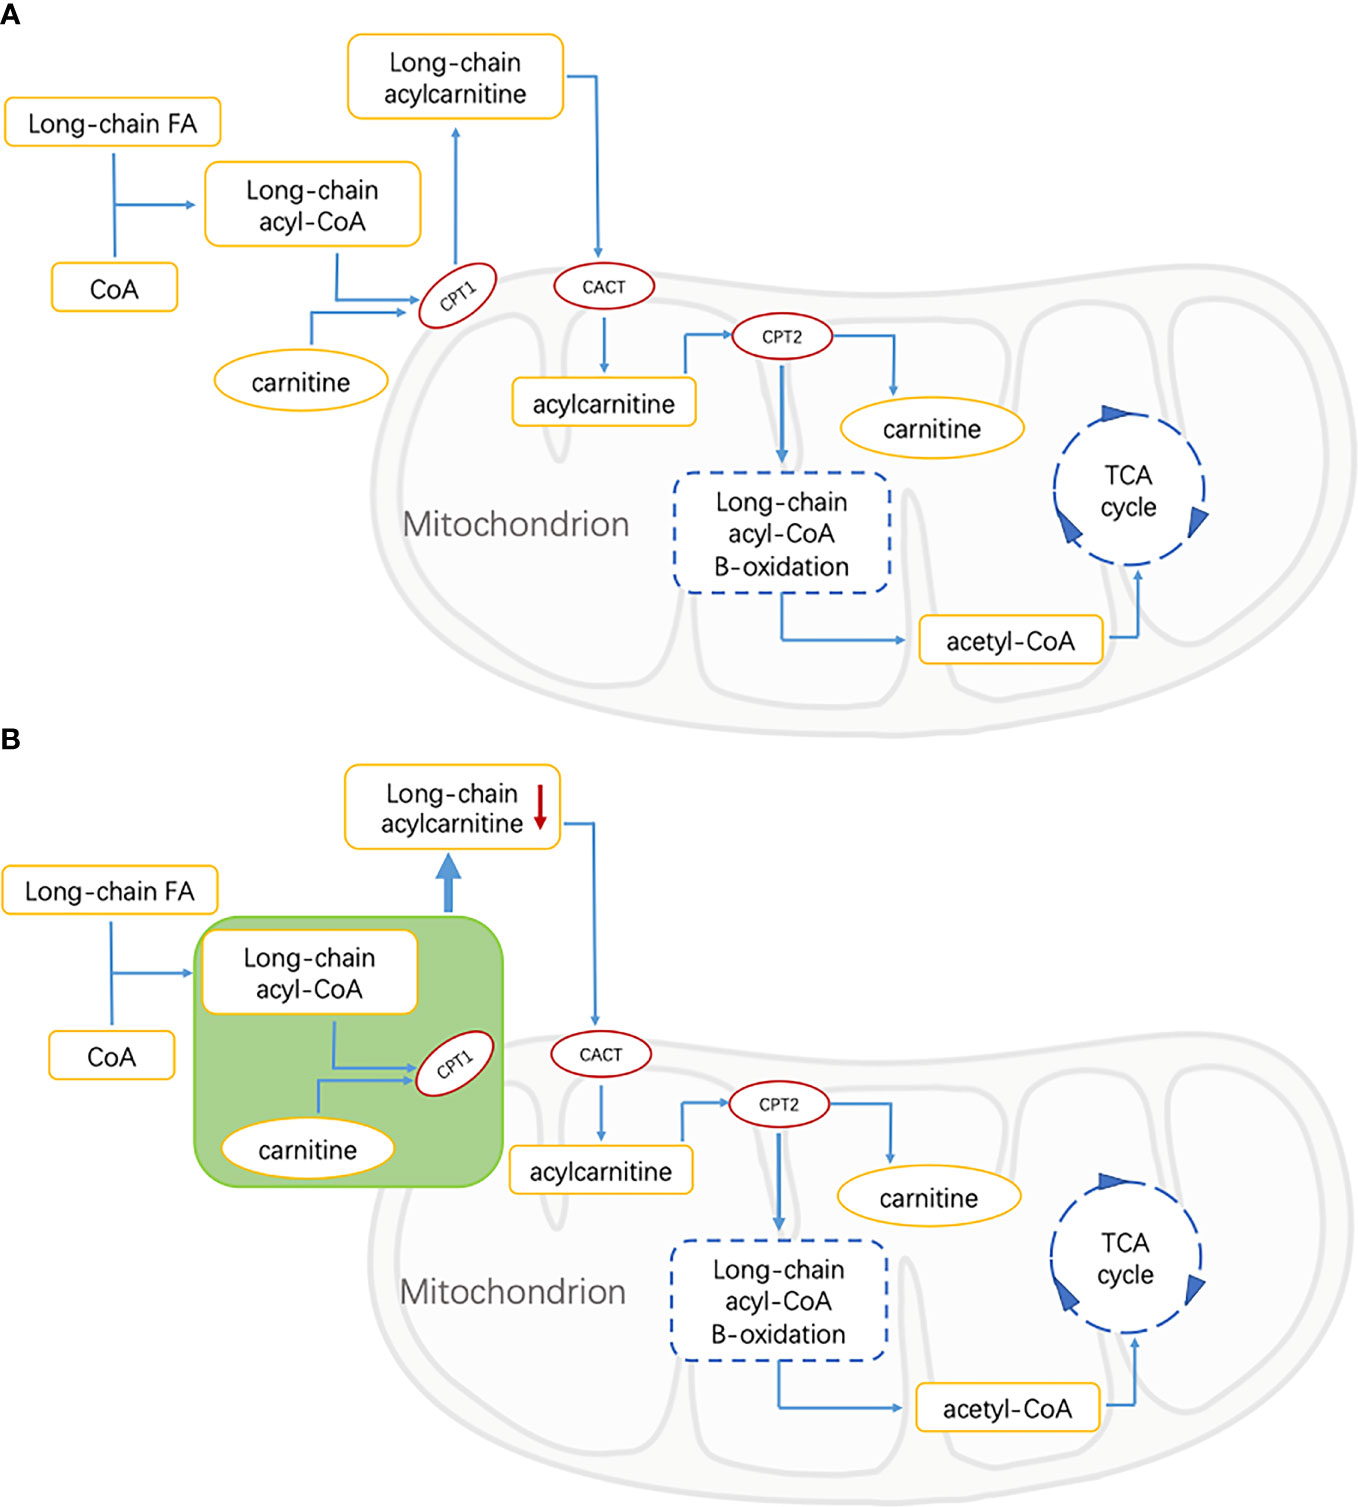
Figure 3 FA, fatty acid; CoA, Coenzyme A; CPT1, carnitine palmitoyltransferase 1; CACT, carnitine acylcarnitine translocase; CPT2, carnitine palmitoyltransferase 2; TCA, tricarboxylic acid. (A) Energy supply pathways of long-chain fatty acids in healthy people. Long-chain fatty acids are catalyzed by CPT1, CPT2, and CACT to produce acetyl-CoA, which is involved in the tricarboxylic acid cycle, and acylcarnitine is the intermediate metabolite. (B) Energy supply pathway of long-chain fatty acids in patients with diabetic retinopathy. The green part shows the inhibition of free FAs transport of CPT1-mediated that resulted in the decrease of long-chain acylcarnitine.
As an important intermediate in the oxidation of fatty acids, the abnormal level of AC may be related to a disrupted FA metabolism in T2DM patients. Bene et al.’s studies on AC profile in patients with metabolic diseases showed that the levels of C3 and C4 in patients with T2DM were significantly higher than those in the control group, while the levels of some medium- and long-chain ACs were lower than those in controls. It was speculated that the decrease of these medium- and long-chain AC levels was affected by the inhibition of free FAs transport of CPT1-mediated (31, 35). This suggested that in our study, the decrease of long-chain ACs in the DR group may be related to the inhibition of long-chain FAs transport mediated by CPT1 (Figure 3B).
In the study of AC and insulin resistance, it is found that the incomplete β-oxidation of muscle FA led to the accumulation of AC, which in turn led to muscle oxidative stress and insulin resistance (36). The accumulation of long-chain AC in serum, muscle, and adipose tissue of insulin-resistant rats was observed in animal experiments (19). When the level of long-chain AC decreased, insulin sensitivity was effectively improved (37). However, Schooneman et al. believe that AC may only reflect the change of FA oxidation and has no correlation with insulin resistance (38). Combined with these studies, the association between ACs levels and insulin resistance remains unclear.
At present, there are few studies on the effects of AC metabolic disorders on DR. Some inconsistent results of diabetes and diabetes complications studies may be caused by differences in the study population and sample size, as well as study design and clinical phenotyping. In Fort PE et al.’s study, AC was detected in human retinal tissue and plasma samples. It was found that the abundance of ACs with carbon atom number ≥ 14 decreased in a gradient with the disease state of the subjects (without diabetes, diabetes without DR, and DR) (39). This finding suggested impaired mitochondrial β-oxidation of retinal FAs in the retina in DR which was consistent with our research. A study on populations of South Asian and European backgrounds showed that ACs were associated with decreased risk of T2DM (40). Okuda et al. found no difference in plasma AC levels between patients with common diabetes and patients with non-insulin-dependent diabetes (41). Inconsistent study showed that DR patients had higher levels of AC than diabetic controls and patients with value-added retinopathy (PDR) had higher plasma carnitine levels than patients with non-proliferative retinopathy (NPDR) (42). The diabetes duration and the distribution and characteristics of HbA1c were significantly different from those in this study. In addition, the sample size of our study is much larger than that of the above study. The population selected in this study was a special analysis between people with T2DM and DR, which might cause our results to be different from previous findings. The results of the logical regression model suggested that our findings were meaningful. Therefore, we speculate that the metabolic level of ACs is different between different disease states and healthy people. A prospective study is necessary to further characterize the relationship between ACs and DR.
Our findings have important clinical and public health implications: (1) these ACs may be candidate markers for predicting the risk of DR in T2DM patients due to the increase of AUC by adding C2, C14DC, C18:1OH, and C18:1 into the model. Although these are potential predictors of DR, due to the limitations of cross-sectional studies, caution should be taken when concluding the relationship between ACs and DR; (2) fundus examination is the basis for the diagnosis and staging of DR, and our results may find new biomarkers for the early diagnosis of DR; (3) as a common complication that can seriously affect the quality of life of T2DM patients, it is important to understand the metabolic mechanism of DR before the occurrence of organic lesions. Our study provides new insight into the pathway from T2DM metabolic disorder to DR; (4) Our study comprehensively detected the levels of more than 20 kinds of plasma AC and found that the level of AC decreased generally in patients with DR, suggesting that the treatment or prevention of DR can be achieved by supplementing carnitine metabolites, which provides a new idea for the study of DR treatment.
Limitations
Our study also has the following shortcomings. First, this study was based on a cross-sectional study of inpatients and cannot infer the causal relationship between AC accumulation and DR. Second, the diet of the subject was not collected in this study. The homeostasis of carnitine in the human body was maintained by dietary absorption, moderate synthesis rate, and effective kidney reabsorption (43). As an intermediate of FA metabolism, diet also affects the concentration of ACs in blood and urine (44). However, we adjusted the potential confounding effects of other demographic and clinical factors, which may have partially eliminated the confounding effects of eating habits. Third, because HbA1c, HDL-C and LDL-C, and TGs have missing values, the random forest method was used for interpolation, and the change of OOB error rate was very small, indicating that the interpolation results were relatively stable, and the influence on the research results was small because AC value was not missing. Fourth, the degree of disease progression of DR patients was not subdivided. Fifth, the interaction of other macrovascular and microvascular complications was not excluded.
Conclusions
In summary, our study found that some short- and long-chain ACs were negatively correlated with the risk of DR in T2DM patients. In the future, we need to conduct larger multicenter prospective studies to further verify our findings. In addition, it is worth paying attention to whether C2, C14DC, C18:1OH, and C18:1 can be used as predictors of DR. Next, we will further study the effects of these ACs on DR and their ability to predict the risk of DR, to find biomarkers that change before organic retinopathy occurs in patients with diabetes.
Data Availability Statement
The raw data supporting the conclusions of this article will be made available by the authors, without undue reservation.
Author Contributions
Z-ZF, X-QG, and W-YW partly contributed to the conception and design of the work. W-YW, XinL, and XuL were responsible for organizing electronic medical records. W-YW and X-QG contributed to the statistical analysis and analyzed the data. W-YW wrote the manuscript. All authors contributed to the article and approved the submitted version.
Funding
This work was supported by the National Key Research and Development Program of China (2021YFA1301200, 2019YFA0802302, 2019YFA0802300), Open Fund of Hubei Province Key Laboratory of Persistent Toxic Substances (PTS) Environmental Health Hazards (PTS2020-05), and the Open Fund of Tianjin Central Hospital of Gynecology Obstetrics/Tianjin Key Laboratory of Human Development and Reproductive Regulation (2020XHY01).
Conflict of Interest
The authors declare that the research was conducted in the absence of any commercial or financial relationships that could be construed as a potential conflict of interest.
Publisher’s Note
All claims expressed in this article are solely those of the authors and do not necessarily represent those of their affiliated organizations, or those of the publisher, the editors and the reviewers. Any product that may be evaluated in this article, or claim that may be made by its manufacturer, is not guaranteed or endorsed by the publisher.
Supplementary Material
The Supplementary Material for this article can be found online at: https://www.frontiersin.org/articles/10.3389/fendo.2022.834205/full#supplementary-material
References
1. Saeedi P, Petersohn I, Salpea P, Malanda B, Karuranga S, Unwin N, et al. Global and Regional Diabetes Prevalence Estimates for 2019 and Projections for 2030 and 2045: Results From the International Diabetes Federation Diabetes Atlas, 9(Th) Edition. Diabetes Res Clin Pract (2019) 157:107843. doi: 10.1016/j.diabres.2019.107843
2. Ma RCW. Epidemiology of Diabetes and Diabetic Complications in China. Diabetologia (2018) 61(6):1249–60. doi: 10.1007/s00125-018-4557-7
3. Wong TY, Sabanayagam C. Strategies to Tackle the Global Burden of Diabetic Retinopathy: From Epidemiology to Artificial Intelligence. Ophthalmologica (2020) 243(1):9–20. doi: 10.1159/000502387
4. Stitt AW, Curtis TM, Chen M, Medina RJ, McKay GJ, Jenkins A, et al. The Progress in Understanding and Treatment of Diabetic Retinopathy. Prog Retin Eye Res (2016) 51:156–86. doi: 10.1016/j.preteyeres.2015.08.001
5. Elmasry K, Ibrahim AS, Abdulmoneim S, Al-Shabrawey M. Bioactive Lipids and Pathological Retinal Angiogenesis. Br J Pharmacol (2019) 176(1):93–109. doi: 10.1111/bph.14507
6. Forrester JV, Kuffova L, Delibegovic M. The Role of Inflammation in Diabetic Retinopathy. Front Immunol (2020) 11:583687. doi: 10.3389/fimmu.2020.583687
7. Forrester JV, McMenamin PG, Dando SJ. CNS Infection and Immune Privilege. Nat Rev Neurosci (2018) 19(11):655–71. doi: 10.1038/s41583-018-0070-8
8. Garner A. Histopathology of Diabetic Retinopathy in Man. Eye (Lond) (1993) 7(Pt 2):250–3. doi: 10.1038/eye.1993.58
9. Semeraro F, Cancarini A, dell’Omo R, Rezzola S, Romano MR, Costagliola C. Diabetic Retinopathy: Vascular and Inflammatory Disease. J Diabetes Res (2015) 2015:582060. doi: 10.1155/2015/582060
10. Ishihara T, Yoshida M, Arita M. Omega-3 Fatty Acid-Derived Mediators That Control Inflammation and Tissue Homeostasis. Int Immunol (2019) 31(9):559–67. doi: 10.1093/intimm/dxz001
11. Behl T, Kotwani A. Omega-3 Fatty Acids in Prevention of Diabetic Retinopathy. J Pharm Pharmacol (2017) 69(8):946–54. doi: 10.1111/jphp.12744
12. Chen W, Esselman WJ, Jump DB, Busik JV. Anti-Inflammatory Effect of Docosahexaenoic Acid on Cytokine-Induced Adhesion Molecule Expression in Human Retinal Vascular Endothelial Cells. Invest Ophthalmol Vis Sci (2005) 46(11):4342–7. doi: 10.1167/iovs.05-0601
13. Calder PC. Long-Chain Fatty Acids and Inflammation. Proc Nutr Soc (2012) 71(2):284–9. doi: 10.1017/S0029665112000067
14. Nguyen TB, Olzmann JA. Lipid Droplets and Lipotoxicity During Autophagy. Autophagy (2017) 13(11):2002–3. doi: 10.1080/15548627.2017.1359451
15. Houten SM, Wanders RJA, Ranea-Robles P. Metabolic Interactions Between Peroxisomes and Mitochondria With a Special Focus on Acylcarnitine Metabolism. Biochim Biophys Acta Mol Basis Dis (2020) 1866(5):165720. doi: 10.1016/j.bbadis.2020.165720
16. Ruiz-Sala P, Pena-Quintana L. Biochemical Markers for the Diagnosis of Mitochondrial Fatty Acid Oxidation Diseases. J Clin Med (2021) 10(21):7. doi: 10.3390/jcm10214855
17. Newgard CB, An J, Bain JR, Muehlbauer MJ, Stevens RD, Lien LF, et al. A Branched-Chain Amino Acid-Related Metabolic Signature That Differentiates Obese and Lean Humans and Contributes to Insulin Resistance. Cell Metab (2009) 9(4):311–26. doi: 10.1016/j.cmet.2009.02.002
18. Romero-Ibarguengoitia ME, Vadillo-Ortega F, Caballero AE, Ibarra-Gonzalez I, Herrera-Rosas A, Serratos-Canales MF, et al. Family History and Obesity in Youth, Their Effect on Acylcarnitine/Aminoacids Metabolomics and non-Alcoholic Fatty Liver Disease (NAFLD). Structural Equation Modeling Approach. PloS One (2018) 13(2):e0193138. doi: 10.1371/journal.pone.0193138
19. Sampey BP, Freemerman AJ, Zhang J, Kuan PF, Galanko JA, O’Connell TM, et al. Metabolomic Profiling Reveals Mitochondrial-Derived Lipid Biomarkers That Drive Obesity-Associated Inflammation. PloS One (2012) 7(6):e38812. doi: 10.1371/journal.pone.0038812
20. Li J, Cao YF, Sun XY, Han L, Li SN, Gu WQ, et al. Plasma Tyrosine and its Interaction With Low High-Density Lipoprotein Cholesterol and the Risk of Type 2 Diabetes Mellitus in Chinese. J Diabetes Investig (2019) 10(2):491–8. doi: 10.1111/jdi.12898
21. Alberti KG, Zimmet PZ. Definition, Diagnosis and Classification of Diabetes Mellitus and its Complications. Part 1: Diagnosis and Classification of Diabetes Mellitus Provisional Report of a WHO Consultation. Diabetes Med (1998) 15(7):539–53. doi: 10.1002/(SICI)1096-9136(199807)15:7<539::AID-DIA668>3.0.CO;2-S
22. Luo HH, Li J, Feng XF, Sun XY, Li J, Yang XL, et al. Plasma Phenylalanine and Tyrosine and Their Interactions With Diabetic Nephropathy for Risk of Diabetic Retinopathy in Type 2 Diabetes. BMJ Open Diabetes Res CA (2020) 8(1):2. doi: 10.1136/bmjdrc-2019-000877
23. Chen XB, Cui J, Zhang YY, Peng WJ. The Association Between BMI and Health-Related Physical Fitness Among Chinese College Students: A Cross-Sectional Study. BMC Public Health (2020) 20(1):2. doi: 10.1186/s12889-020-08517-8
24. American Diabetes A. Standards of Medical Care in Diabetes-2019 Abridged for Primary Care Providers. Clin Diabetes (2019) 37(1):11–34. doi: 10.2337/cd18-0105
25. Guasch-Ferre M, Zheng Y, Ruiz-Canela M, Hruby A, Martinez-Gonzalez MA, Clish CB, et al. Plasma Acylcarnitines and Risk of Cardiovascular Disease: Effect of Mediterranean Diet Interventions. Am J Clin Nutr (2016) 103(6):1408–16. doi: 10.3945/ajcn.116.130492
26. Wang Q, Sun T, Cao Y, Gao P, Dong J, Fang Y, et al. A Dried Blood Spot Mass Spectrometry Metabolomic Approach for Rapid Breast Cancer Detection. Onco Targets Ther (2016) 9:1389–98. doi: 10.2147/OTT.S95862
27. Semeraro F, Morescalchi F, Cancarini A, Russo A, Rezzola S, Costagliola C. Diabetic Retinopathy, a Vascular and Inflammatory Disease: Therapeutic Implications. Diabetes Metab (2019) 45(6):517–27. doi: 10.1016/j.diabet.2019.04.002
28. Lachin JM, Genuth S, Nathan DM, Zinman B, Rutledge BN, Group DER. Effect of Glycemic Exposure on the Risk of Microvascular Complications in the Diabetes Control and Complications Trial–Revisited. Diabetes (2008) 57(4):995–1001. doi: 10.2337/db07-1618
29. Augustine J, Troendle EP, Barabas P, McAleese CA, Friedel T, Stitt AW, et al. The Role of Lipoxidation in the Pathogenesis of Diabetic Retinopathy. Front Endocrinol (Lausanne) (2020) 11:621938. doi: 10.3389/fendo.2020.621938
30. Zhou Y, Wang C, Shi K, Yin X. Relationship Between Dyslipidemia and Diabetic Retinopathy: A Systematic Review and Meta-Analysis. Med (Baltimore) (2018) 97(36):e12283. doi: 10.1097/MD.0000000000012283
31. Bene J, Hadzsiev K, Melegh B. Role of Carnitine and its Derivatives in the Development and Management of Type 2 Diabetes. Nutr Diabetes (2018) 8(1):8. doi: 10.1038/s41387-018-0017-1
32. Bieber LL. Carnitine. Annu Rev Biochem (1988) 57:261–83. doi: 10.1146/annurev.bi.57.070188.001401
33. McGarry JD. The Mitochondrial Carnitine Palmitoyltransferase System: Its Broadening Role in Fuel Homoeostasis and New Insights Into its Molecular Features. Biochem Soc Trans (1995) 23(2):321–4. doi: 10.1042/bst0230321
34. Houten SM, Violante S, Ventura FV, Wanders RJ. The Biochemistry and Physiology of Mitochondrial Fatty Acid Beta-Oxidation and Its Genetic Disorders. Annu Rev Physiol (2016) 78:23–44. doi: 10.1146/annurev-physiol-021115-105045
35. Bene J, Marton M, Mohas M, Bagosi Z, Bujtor Z, Oroszlan T, et al. Similarities in Serum Acylcarnitine Patterns in Type 1 and Type 2 Diabetes Mellitus and in Metabolic Syndrome. Ann Nutr Metab (2013) 62(1):80–5. doi: 10.1159/000345759
36. Aguer C, McCoin CS, Knotts TA, Thrush AB, Ono-Moore K, McPherson R, et al. Acylcarnitines: Potential Implications for Skeletal Muscle Insulin Resistance. FASEB J (2015) 29(1):336–45. doi: 10.1096/fj.14-255901
37. Liepinsh E, Makrecka-Kuka M, Makarova E, Volska K, Svalbe B, Sevostjanovs E, et al. Decreased Acylcarnitine Content Improves Insulin Sensitivity in Experimental Mice Models of Insulin Resistance. Pharmacol Res (2016) 113(Pt B):788–95. doi: 10.1016/j.phrs.2015.11.014
38. Schooneman MG, Vaz FM, Houten SM, Soeters MR. Acylcarnitines: Reflecting or Inflicting Insulin Resistance? Diabetes (2013) 62(1):1–8. doi: 10.2337/db12-0466
39. Fort PE, Rajendiran TM, Soni T, Byun J, Shan Y, Looker HC, et al. Diminished Retinal Complex Lipid Synthesis and Impaired Fatty Acid Beta-Oxidation Associated With Human Diabetic Retinopathy. JCI Insight (2021) 6(19):7. doi: 10.1172/jci.insight.152109
40. Muilwijk M, Goorden SMI, Celis-Morales C, Hof MH, Ghauharali-van der Vlugt K, Beers-Stet FS, et al. Contributions of Amino Acid, Acylcarnitine and Sphingolipid Profiles to Type 2 Diabetes Risk Among South-Asian Surinamese and Dutch Adults. BMJ Open Diabetes Res Care (2020) 8(1):7. doi: 10.1136/bmjdrc-2019-001003
41. Okuda Y, Kawai K, Murayama Y, Yamashita K. Postprandial Changes in Plasma Ketone Body and Carnitine Levels in Normal and non-Insulin-Dependent Diabetic Subjects. Endocrinol Jpn (1987) 34(3):415–22. doi: 10.1507/endocrj1954.34.415
42. Sumarriva K, Uppal K, Ma C, Herren DJ, Wang Y, Chocron IM, et al. Arginine and Carnitine Metabolites Are Altered in Diabetic Retinopathy. Invest Ophthalmol Vis Sci (2019) 60(8):3119–26. doi: 10.1167/iovs.19-27321
43. Rebouche CJ. Kinetics, Pharmacokinetics, and Regulation of L-Carnitine and Acetyl-L-Carnitine Metabolism. Ann N Y Acad Sci (2004) 1033:30–41. doi: 10.1196/annals.1320.003
Keywords: acylcarnitine, diabetic retinopathy, type 2 diabetes mellitus, metabonomics, diabetic complications
Citation: Wang W-Y, Liu X, Gao X-Q, Li X and Fang Z-Z (2022) Relationship Between Acylcarnitine and the Risk of Retinopathy in Type 2 Diabetes Mellitus. Front. Endocrinol. 13:834205. doi: 10.3389/fendo.2022.834205
Received: 13 December 2021; Accepted: 18 February 2022;
Published: 15 March 2022.
Edited by:
Peiyuan Yin, Dalian Medical University, ChinaReviewed by:
Shuangyuan Wang, Shanghai Jiao Tong University School of Medicine, ChinaYong Liu, Dalian University of Technology, China
Copyright © 2022 Wang, Liu, Gao, Li and Fang. This is an open-access article distributed under the terms of the Creative Commons Attribution License (CC BY). The use, distribution or reproduction in other forums is permitted, provided the original author(s) and the copyright owner(s) are credited and that the original publication in this journal is cited, in accordance with accepted academic practice. No use, distribution or reproduction is permitted which does not comply with these terms.
*Correspondence: Zhong-Ze Fang, ZmFuZ3pob25nemVAdG11LmVkdS5jbg==