Abstract
Reproduction is regulated through the hypothalamic-pituitary-gonadal (HPG) axis, largely via the action of kisspeptin neurons in the hypothalamus. Importantly, Kiss1 neurons have been identified in other brain regions, including the medial amygdala (MeA). Though the MeA is implicated in regulating aspects of both reproductive physiology and behavior, as well as non-reproductive processes, the functional roles of MeA Kiss1 neurons are largely unknown. Additionally, besides their stimulation by estrogen, little is known about how MeA Kiss1 neurons are regulated. Using a RiboTag mouse model in conjunction with RNA-seq, we examined the molecular profile of MeA Kiss1 neurons to identify transcripts that are co-expressed in MeA Kiss1 neurons of female mice and whether these transcripts are modulated by estradiol (E2) treatment. RNA-seq identified >13,800 gene transcripts co-expressed in female MeA Kiss1 neurons, including genes for neuropeptides and receptors implicated in reproduction, metabolism, and other neuroendocrine functions. Of the >13,800 genes co-expressed in MeA Kiss1 neurons, only 45 genes demonstrated significantly different expression levels due to E2 treatment. Gene transcripts such as Kiss1, Gal, and Oxtr increased in response to E2 treatment, while fewer transcripts, such as Esr1 and Cyp26b1, were downregulated by E2. Dual RNAscope and immunohistochemistry was performed to validate co-expression of MeA Kiss1 with Cck and Cartpt. These results are the first to establish a profile of genes actively expressed by MeA Kiss1 neurons, including a subset of genes regulated by E2, which provides a useful foundation for future investigations into the regulation and function of MeA Kiss1 neurons.
1 Introduction
Reproduction is regulated by gonadotropin-releasing hormone (GnRH) secreted from neurons in the hypothalamic forebrain. Activation of GnRH neurons, and hence the reproductive axis, requires kisspeptin, a neuropeptide encoded by the Kiss1 gene. Humans and mice with gene mutations in Kiss1 or its receptor, Kiss1r, exhibit significantly disrupted reproduction, including incomplete sexual maturation and infertility (1–3). Kisspeptin treatment potently stimulates LH and FSH release (4–7) via direct stimulation of GnRH neurons, which express Kiss1r (4–11). Thus, kisspeptin is both necessary and sufficient for GnRH release and regulation of the reproductive axis. Neurons expressing Kiss1 have been detected in several distinct brain areas, including the anteroventral periventricular (AVPV) and periventricular (PeN) nuclei (referred to as AVPV here; also commonly called the RP3V) and arcuate (ARC) nuclei of the hypothalamus, as well as in several extra-hypothalamic areas, including the medial amygdala (MeA), bed nucleus of the stria terminalis, and the lateral septum (7, 8, 12–20).
Hypothalamic Kiss1 neurons in the AVPV and ARC have been well-studied and are known to be regulated by testosterone (T) and estradiol (E2) (13–15). In the ARC, sex steroids inhibit ARC Kiss1 expression, whereas the removal of sex steroids increases ARC Kiss1 levels, suggesting that kisspeptin neurons in the ARC are involved in sex steroid negative feedback (13–15). In contrast, in the AVPV, Kiss1 levels are increased by sex steroids, particularly E2 (13–15), suggesting that AVPV Kiss1 neurons participate in the E2- mediated positive feedback that triggers the preovulatory LH surge in females (21, 22). E2 regulation of AVPV and ARC Kiss1 levels occurs specifically via estrogen receptor α (ERα), which is highly expressed in both of these Kiss1 populations (13, 14, 18, 23, 24). Recent RNA-seq studies of AVPV and ARC Kiss1 neurons reported other co-expressed genes in these specific cell populations that also respond to E2 treatment (25–27), including hormone receptors such as Pgr, Ghsr, and Npr2 (26, 27).
MeA Kiss1 expression is also regulated by sex steroids. Similar to AVPV Kiss1 expression, MeA Kiss1 levels dramatically increase with T or E2 exposure in both sexes and fall to nearly undetectable levels in the absence of sex steroids (17, 18, 20, 28). However, the non-aromatizable androgen, DHT, has no stimulatory effect on MeA Kiss1 expression (17), which suggests that the observed upregulation of MeA Kiss1 expression by T is mediated by E2 signaling after aromatization; this possibility is supported by the presence of high aromatase expression in the MeA region (17, 29–31). As with Kiss1 in the AVPV and ARC (14, 23), data from ErαKO and ERβKO mice show that the ERα receptor subtype is required for E2’s upregulation of MeA Kiss1 levels (18). Despite these findings demonstrating that Kiss1 expression in the MeA is potently stimulated by E2, the functional significance of this E2 stimulation is still currently unknown. In contrast to their E2-induced upregulation, MeA Kiss1 levels are inhibited by GABA signaling through GABABR. This is evidenced by very high Kiss1 expression in the MeA, but not the AVPV or ARC, of GABABR knockout mice of both sexes (19, 20). Whether this GABA effect is direct or indirect is still unknown, though MeA Kiss1 neurons are reported to expressed GABABR as determined with in situ hybridization (19).
At present, E2 and GABA, acting via ERα and GABABR respectively, are the only known regulators of MeA Kiss1 neurons. In fact, almost nothing is known about the identities of other receptors, co-transmitters and signaling factors, and transcription factors that are expressed by this specific kisspeptin neuron population, or whether other genes in MeA kisspeptin neurons are also altered by E2 signaling. This lack of knowledge of the phenotype of MeA Kiss1 neurons has limited our understanding of possible functions of this kisspeptin population. The MeA has numerous behavioral and physiological functions, including effects on puberty, as well as reproductive physiology and behavior (32–37) and other non-reproductive behaviors (38–44). Classic studies found that lesions of the entire MeA disrupt ovarian cycles and impair E2 positive feedback in female rodents (35–37). Conversely, acute electrical stimulation of the MeA region of E2-primed ovariectomized (OVX) females induced high LH secretion (34), indicating that the MeA might facilitate E2 positive feedback of the LH surge. However, the mechanisms by which the MeA influences reproductive hormone release are still unknown, as is the identity of the specific MeA cell types responsible for these effects. Because kisspeptin can potently stimulate GnRH neurons (10, 11) and the MeA projects both directly and indirectly to the POA where GnRH neurons reside (45–48), it remains possible that MeA Kiss1 neurons participate in the regulation of the reproductive axis by acting directly or indirectly on GnRH neurons. Some recent optogenetic and chemogenetic mouse studies have begun to address this possibility (39, 49–51), but this is still currently not well understood. Thus, at present, the various functional roles of MeA kisspeptin neurons remain unknown, in part due to our limited understanding of the detailed phenotype of those specific kisspeptin neurons.
Recent studies have begun to detail the molecular phenotype of the two kisspeptin populations in the hypothalamus. Using the RiboTag technique coupled with RNA-seq, we recently reported the identification of >13,000 genes that are expressed in AVPV Kiss1 neurons of female mice (25). In that study, we also identified numerous AVPV Kiss1 neuron transcripts that are differentially regulated by E2, such as Pgr, Th, Cartpt, and Gal. Two subsequent reports from Hrabovszky and colleagues used a different approach to examine E2 regulation of RNA transcripts in ARC and AVPV kisspeptin neurons (26, 27). These various RNA profiling studies provide insight into potential mechanisms of regulation of hypothalamic Kiss1 neurons and, hence, reproductive status. However, similar RNA-seq analyses of kisspeptin neurons in the MeA have not yet been reported. In the current study, we used the RiboTag technique (52, 53), which allows for the isolation of mRNAs that are actively being translated into proteins, along with RNA-seq to identify the molecular phenotype of MeA Kiss1 neurons of female mice under different E2 conditions.
2 Method
2.1 Animals
We used the RiboTag mouse model (54, 55) crossed with Kiss1Cre mice to identify actively-translated gene transcripts that are co-expressed specifically in MeA Kiss1 neurons, following methods previously described (25, 54, 55). Briefly, RiboTag (Rpl22HA+) mice have a wild-type C-terminal exon floxed on the Rpl22 gene that is followed by three copies of a hemagglutinin (HA) epitope sequence inserted prior to a stop codon (54). Cell-type-specific recombination can be induced by crossing RiboTag mice with a cell type-specific Cre recombinase-expressing mouse line, which leads to Cre-mediated recombination and expression of HA tags on ribosomes only in cells expressing Cre recombinase(54, 56). Here, Rpl22HA+ mice were crossed with Kiss1Cre mice (courtesy of Carol Elias) (57) to generate Kiss1Cre+/Rpl22HA+/+ female mice to be used for this study. Kiss1Cre+/Rpl22HA+/+ mice express the HA-tagged ribosomes only in Kiss1-expressing cells, permitting isolation of ribosome-associated transcripts from just Kiss1 cells in specific brain regions, such as the MeA. In addition to adult (8-10 weeks old) Kiss1Cre+/Rpl22HA+/+ females, a small cohort of adult Kiss1Cre-/Rpl22HA+/+ females was used as controls. These control mice do not have HA-tagged ribosomes in Kiss1-expressing cells and therefore, no Kiss1 cell-specific RNA should be isolated. Tail DNA was used to genotype mice via polymerase chain reaction (PCR) to confirm genotypes of Kiss1Cre+/Rpl22HA+/+ and Kiss1Cre-/Rpl22HA+/+ mice (henceforth referred to as “KissRibo” or “Control” mice, respectively). Additionally, any mice with germline recombination were excluded from the study.
In a separate experiment, adult Kiss1Cre/tdTomato mice were used to validate co-expression of select genes in MeA Kiss1 neurons using immunohistochemistry and in situ hybridization co-detection (IHC-ISH). Kiss1Cre/tdTomato mice (“KisstdTom”) were generated by crossing Kiss1Cre mice with tdTomato mice (Ai9 strain, JAX stock #007909) (58), permitting tdtomato fluorescent reporter to be expressed exclusively in Kiss1-expressing cells.
All mice were housed 2-3 per cage (KissRibo and Control mice) or 2-5 per cage (KisstdTom mice) in a 12hr:12hr light:dark cycle (lights off at 18:00h), with access to food and water ad libitum. All animal procedures were approved by local IACUC committees at the University of California, San Diego (KissRibo and Control mice) or Albany Medical College (KisstdTom mice).
2.2 Hormone treatment and tissue processing
MeA Kiss1 expression is known to be stimulated by E2 (20). Thus, all KissRibo and Control mice were ovariectomized (OVX) at 8 weeks of age, under isoflurane anesthesia, and pre-treated at this time with high dose E2 (2 mm of 1:30 E2: cholesterol powder) via subcutaneous Silastic capsule for 4 days. This dose of E2 in mice is known to increase MeA Kiss1 expression, as well as induce E2 negative feedback to suppress LH levels (13, 14, 17, 18, 20, 25). This E2 pre-treatment was used to drive sufficient Cre expression in MeA Kiss1 cells in all KissRibo mice and promote a high degree of incorporation of HA-tagged ribosomes in these neurons, regardless of subsequent E2 and OVX treatment conditions (25). For consistency between genotypes, Cre- controls were similarly given the E2 pre-treatment. All pre-treatment E2 implants were removed after 4 days and all mice were given 7 days to wash out any residual circulating E2. After the 1-week washout period, half of the mice were re-implanted with a new E2 Silastic capsule (E2 group, n = 12 KissRibo; n=4 Controls), while the remaining females received no additional E2 treatment and served as the OVX group (n = 12 KissRibo; n=4 Controls). 5 days after receiving the second E2 implant (or no implant), all females were euthanized between 11:00h and 14:00h. Blood was collected at this time via retroorbital bleed, and brains were collected fresh frozen on dry ice. Blood serum was assayed for LH concentrations to confirm low LH levels in the E2-treated group (indicating proper E2 negative feedback) and elevated LH levels in the OVX group (indicating lack of E2 negative feedback). Serum LH was measured via a highly sensitive mouse LH radioimmunoassay performed by the University of Virginia Ligand Assay Core (lower detection limit: 0.04 ng/mL; average reportable range: 0.04-75 ng/mL). As expected, E2-treated OVX females had significantly reduced mean LH levels compared to OVX females lacking E2 (0.22 ± 0.04 ng/mL vs 3.04 ± 0.22 ng/mL, respectively, p<0.05).
Fresh frozen brains were processed for RiboTag immunoprecipitation. The brain was micro-dissected on a coronal plane and 2 consecutive 400 µm thick slices spanning the MeA region were micro-punched bilaterally using a 2 mm diameter sampling tool. To ensure sufficient yield of isolated mRNA following immunoprecipitation, MeA micro-punches from n = 4 mice were pooled for each treatment (E2 and OVX groups). The total number of pooled samples per group were as follows: n = 3 for both OVX KissRibo and E2 KissRibo, n = 1 for both OVX and E2 Cre- controls. Prior to the RiboTag immunoprecipitation, all pooled MeA micro-punch samples were stored at -80°C in 1.7 mL Eppendorf tubes.
For the ISH/IHC co-expression experiments, female KisstdTom mice (n=3) were ovariectomized and received a similar E2 Silastic capsule for 5 days, as was done for the KissRibo mice. Brains were then collected in 4% paraformaldehyde, transferred to 30% sucrose 24 hours later, and stored at 4°C prior to slicing. Brains were then sectioned at 25 µm/slice, and sections containing the MeA mounted on SuperFrost Plus slides (Fisher Scientific), air dried, and stored at -80°C until the assay.
2.3 Immunoprecipitation and RNA extraction
RiboTag immunoprecipitation on pooled MeA samples from KissRibo and Control females was performed following published protocols (54, 56). Some modifications to the original protocol were performed to maximize isolation of ribosomes and their attached mRNA transcripts from MeA Kiss1 neurons (25). Specifically, pooled MeA samples were homogenized in a homogenization buffer solution (72% H2O, 9.6% NP-40, 9.6% 2M KCl, 3.2% 1.5M Tris – pH 7.4, 1.2% 1M MgCl2, 2% Cyclohexamide 5mg/ml, 1% Protease Inhibitors, 1% heparin 100mg/ml, 0.5% RNAsin, and 0.1% DTT) at 3% weight by volume. The samples were then centrifuged at 10K rpm for 10 minutes at 4°C. After centrifugation, 10% of the lysate was saved in a separate tube as the “Input” sample, which contains mRNA from all cell types present in the MeA micropunch, including but not limited to Kiss1 cells. To store the Input samples, 350µL of lysis buffer (from Qiagen Kit #74034) was added and briefly vortexed, and then the samples flash frozen and stored at -80°C. The remaining lysate was then used for the immunoprecipitation procedure. To precipitate Kiss1 cell ribosomes and their associated RNA transcripts from each lysate sample, 0.25µL of antibody/100µL lysate of Biolegend Purified anti-Ha.11 Epitope Tag Antibody (#910501) was added to the remaining lysate volume and incubated for 2 hours on a gentle sample rotator at 4°C. Magnetic beads (Pierce Protein A/G #88803; 25µL beads/100µL sample) were washed with homogenization buffer (described above). Following the antibody incubation, the sample was transferred to the washed magnetic beads and incubated again at 4°C for 1 hour on gentle rotation. The lysate was removed by placing the sample tubes on a magnetic tube rack and the beads washed 3 times for 10 minutes each on a gentle rotator at 4°C with a high salt buffer (53.4% H2O, 30% 2M KCl, 10% NP-40, 3.3% 1.5M Tris – pH 7.4, 1.2% 1M MgCl2, 2% Cyclohexamide 5mg/ml, and 0.05% DTT), using fresh high salt buffer for each wash. Immediately following the washes, 350µL lysis buffer (Qiagen Kit #74034) was added to each sample and vortexed for 30 seconds. Sample tubes were then secured in a magnetic tube rack and the resulting lysate (termed the “IP” sample) was separated from the magnetic beads and transferred into another tube, flash frozen, and stored at -80°C. The IP samples only contain RNA from the HA-tagged ribosomes, which in this experiment were only present in Kiss1 neurons. Thus, the IP samples from KissRibo mice contained RNA specific to MeA Kiss1 neurons. To extract RNA from the Input and IP samples, the Qiagen RNeasy Plus Micro Kit (#74034) kit was used per kit instructions, and isolated RNA was stored in aliquots at -80°C until RT-PCR and RNA-sequencing.
2.4 Examination of Cck co-expression in Kiss1 neurons using double-label in situ hybridization and immunohistochemistry
A double-label ISH/IHC co-detection assay was performed to examine the co-expression of Cck, a gene known to be expressed in the MeA (59, 60), in Kiss1 neurons. This assay was performed on MeA-containing brain slices from adult KisstdTom female mice (1 slice/mouse, n = 3 mice total). The assay measured co-expression of Cck mRNA (cholecystokinin) in MeA Kiss1 neurons (labeled with tdtomato). To perform the co-expression assay, we used Advanced Cell Diagnostics’ RNAscope® multiplex fluorescent V2 ISH assay with IHC co-detection, with the following RNAscope® catalog probe: Mm-Cck-C3 – Mus musculus cholecystokinin (Cck) mRNA. For IHC detection of tdtomato, Rockland rabbit anti-RFP (red fluorescent protein, #600-401-379) primary antibody was used along with Invitrogen goat anti-rabbit IgG Alexa Fluor 594 (#A-11037) secondary antibody.
2.5 RT-PCR confirmation of Kiss1 cell-specific mRNAs
To validate the efficacy of the Kiss1Cre/RiboTag method to isolate mRNA from MeA Kiss1 neurons, we performed RT-PCR on Input and IP samples for Kiss1 and Cck, which is known to be expressed in the MeA where Kiss1 cells are located (59, 60) and was identified in the first experiment (Figure 1) to be co-expressed in Kiss1 neurons. To confirm specificity, we also performed RT-PCR for Avp, a gene known to be expressed in the MeA, but not typically in the posterior MeA where Kiss1 expression is observed (61). RT-PCR was performed using the iScript cDNA Synthesis Kit (Bio-Rad #1708891), per kit instructions, to synthesize cDNA from 10ng of RNA from the Input and IP samples. Using RNA-specific primers for each transcript (Kiss1 Forward-CTGTGTCGCCACCTATGGGG; Kiss1 Reverse- GGCCTCTACAATCCACCTGC; Cck Forward- CTCGGTATGTCTGTGCGTGG; Cck Reverse- GGTCTGGGAGTCACTGAAGG; Avp Forward- CCCGAGTGCCACGACGGTTT; Avp Reverse- CCCGGGGCTTGGCAGAATCC), the levels of Kiss1, Cck, and Avp mRNA in the IP and Input samples were measured via PCR. The PCR reaction mix included 1µL of cDNA, Jumpstart RedTaq mix (Sigma #P0982), forward and reverse primers, and RNase-free water. The PCR conditions were as follows: 94 x15’, (94 x 30”, annealing x 30”, 72 x 60”) repeat 30 times, 72 x 5’, 4 x 5’. The annealing temperature was 57°C for Kiss1 and Cck and 62°C for Avp.
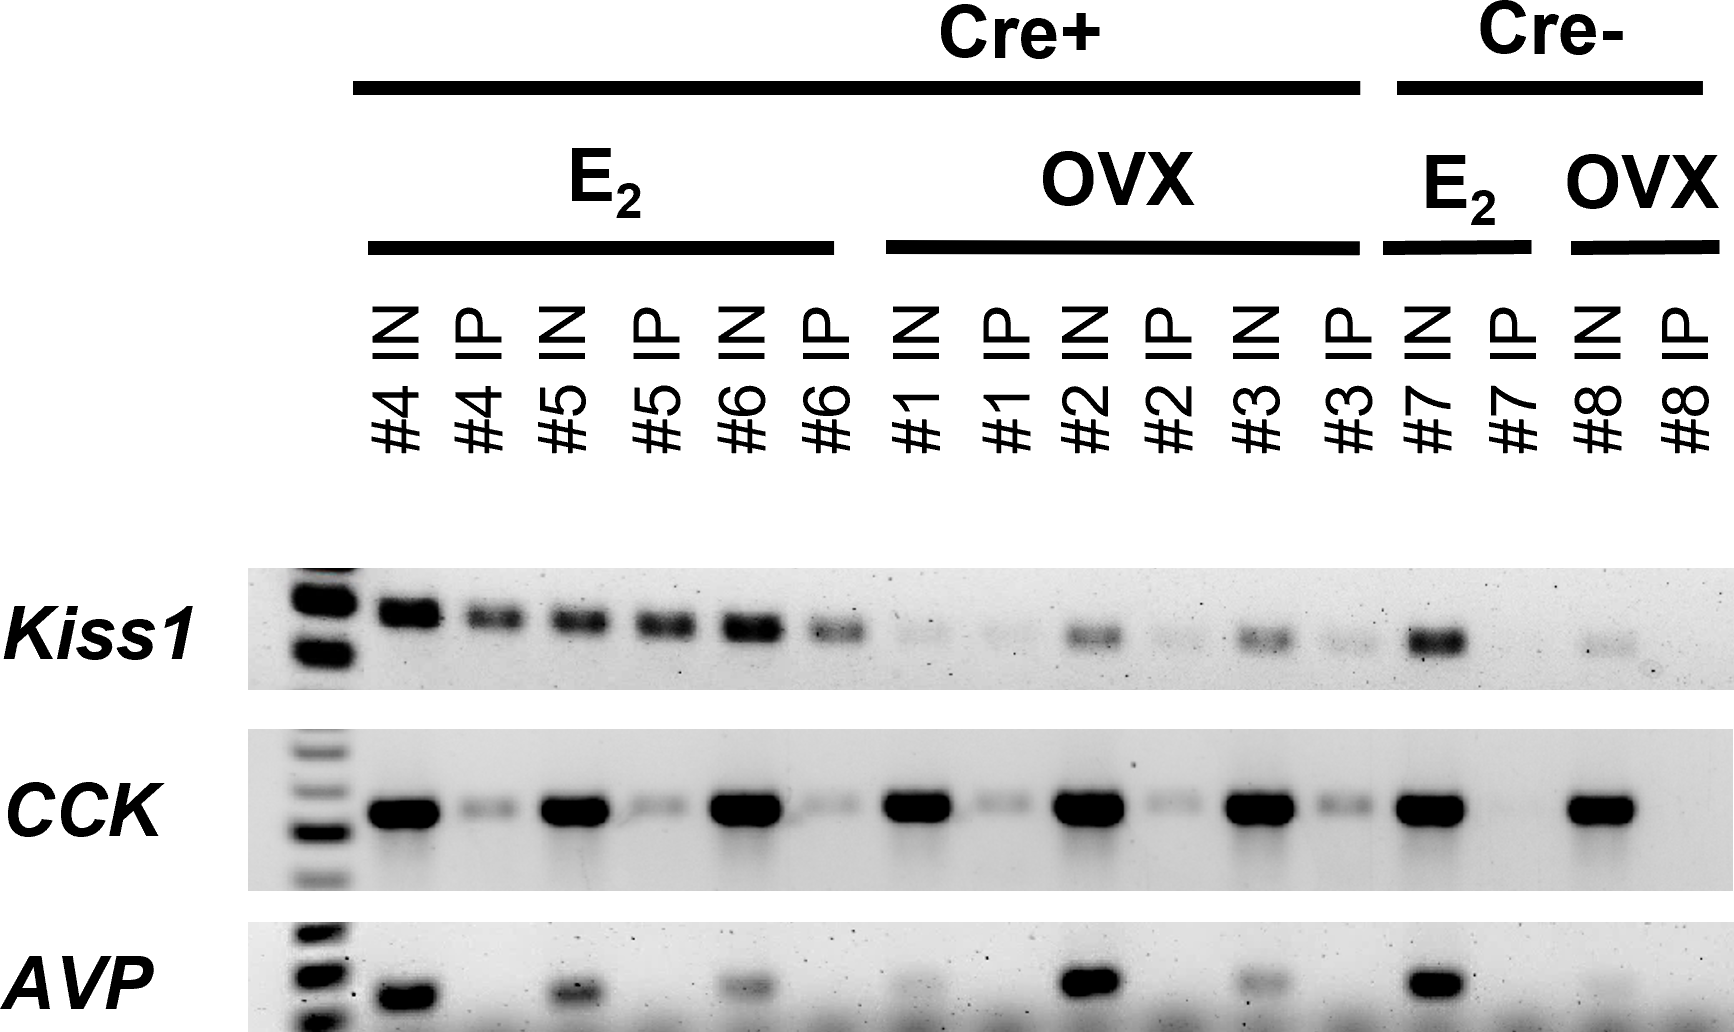
Figure 1

Double-label IHC/ISH of Kiss1TdTomato cells and Cck in the female mouse medial amygdala. (A) A representative image of Kiss1TdTomato cells (red) and Cck (green) of an E2-treated female mouse. (B) Higher magnification images of the area in the white box showing a very high degree of Cck mRNA (green) expression in Kiss1TdTomato cells (red). opt = optic tract.
2.6 RNA-seq of Cre+ samples and bioinformatic analysis
RNA sequencing was performed by the Genomics Center at UC San Diego’s Institute for Genomic Medicine, using RNA from the MeA IP samples of KissRibo mice, for both E2 and OVX (no E2) treatments. Agilent High Sensitivity RNA ScreenTape System was used to determine the quality of all MeA IP RNA samples prior to RNA sequencing, and library preparation was only performed on IP samples with an RNA integrity number >7.6. The library was created using Illumina unstranded mRNA library kits with polyA enrichment. The Illumina HiSeq4000 platform (SR75 run type) was used to perform RNA sequencing. Raw RNA sequencing data quality control analysis was performed using Fastqc v0.11.8, then read trimming was performed using Trimmomatic 0.38, followed by alignment using STAR v2.6.0a, and then quantification of reads (RSEMv1.3.0) using GRCm38.p6/mm10 and Mus-musculus.GRCm38.98.gtf.
The Center for Computational Biology and Bioinformatics at UC San Diego performed all RNA sequencing analyses and statistics. All analyses were limited to known protein coding regions. To prepare for data exploration and preprocessing using edgeR Bioconductor package (62) written in R (63), integration and annotation of sample inputs was performed using per-gene-per-sample counts from both the count preparation and quality control were used with the per-sample RNA-seq metadata. The edgeR Bioconductor package and limma package (64) were used to explore and pre-process annotated data for determining differential gene expression specifically in transcripts produced by MeA Kiss1 neurons. In order to eliminate low-expressing genes from comparative analyses, only transcripts with a mean CPM >1 for all 3 samples in at least one hormone treatment group (OVX or E2) were used for differential expression (OVX vs E2) and biological KEGG pathway analyses. The voom technique (65, 66), which utilizes limma and edgeR Bioconductor packages, was used to determine differential expression of any retained transcripts between the two treatment groups (E2 versus OVX). To test for the presence of specific genes and differential gene expression in annotated functions, pathways, and diseases, the overall data and differential gene data were analyzed with WebGestalt (67). We then performed a KEGG (Kyoto Encyclopedia of Genes and Genomes) pathway analysis (68) using PathView (69) in both E2 and OVX groups to examine the primary KEGG pathways observed in the overall MeA Kiss1 RNA sequencing dataset, as well as for any pathways that were represented differently between E2 and OVX groups. The data set containing all identified gene transcripts is available in the Gene Expression Omnibus (geo) data repository (70).
2.7 Validation of gene co-expression using double-label ISH and IHC co-detection
A double-label ISH/IHC co-detection assay was performed to validate the co-expression of Cartpt, a gene found to be highly expressed in our RNA-seq dataset, in MeA Kiss1 neurons. Using brain slices from 3 female KisstdTom mice (1 slice/mouse), a double-label ISH/IHC for Cartpt mRNA and TdTomato, representing MeA Kiss1 cells, was performed using Advanced Cell Diagnostics’ RNAscope® multiplex fluorescent V2 ISH assay with IHC co-detection, as described previously for the detection of Cck in Kiss1 cells. This assay used the RNAscope catalog probe for Cartpt: Mm-Cartpt-C2 – Mus musculus cocaine- and amphetamine-regulated transcript prepropeptide (Cartpt) mRNA.
The manufacturer’s protocol was followed for multiplex fluorescent V2 ISH assay with IHC co-detection for fixed frozen tissue, with some modifications to preserve tissue integrity. Briefly, slides containing brain slices with the MeA region were briefly washed with Milli-Q water, baked at 60°C for 1 hour, and post-fixed in fresh 4% paraformaldehyde for 2 hours at 4°C. The tissue was dehydrated in 50%, 70%, and 100% ethanol washes, treated with hydrogen peroxide for 10 minutes, washed with Milli-Q water, and baked for an additional 30 minutes at 60°C. Following baking, the tissue was incubated at 98-102°C for 5 minutes in 1X RNAscope® target retrieval reagent, and briefly washed with Milli-Q water followed by 1X PBS-T. 200µL primary antibody (1:1000, anti-RFP) was added to each slide and slides were incubated overnight at 4°C. On Day 2, the slides were washed 3 times in 1X PBS-T, transferred to fresh 4% paraformaldehyde for 30 minutes at room temperature, followed by four washes in 1X PBS-T. 2-4 drops of Protease Plus was added to each slide and incubated at 40°C for 30 minutes, followed by 3 brief washes in Milli-Q water. Excess liquid was removed and a probe mix (Probe Diluent + RNAscope probe) was added to each slide and hybridized to the tissue at 40°C for 2 hours. The slides were washed twice with RNAscope® 1X Wash Buffer at room temperature, followed by 3 amplification hybridization steps (AMP 1 and 2 for 30 minutes at 40°C, and AMP 3 for 15 minutes at 40°C) with two washes with 1X wash buffer between each amplification hybridization step. After hybridization, the HRP-C2 fluorescent signal was developed for each respective probe by adding 2-4 drops of HRP-C2 to each sample and incubating for 15min at 40°C, washing twice with 1X wash buffer, incubating with 150µL diluted Opal™ dye for 30 minutes at 40°C, and washing twice with 1X wash buffer. This was repeated again, using HRP-C3 (instead of HRP-C2) to develop the HRP-C3 fluorescent signal. The Opal™ dyes used were: Opal 520 (Cck) and Opal 690 (Cartpt). After developing the HRP-C3 signal, the 200μL secondary antibody (Goat anti-rabbit), diluted 1:100 in co-detection Antibody Diluent, was incubated on each slide for 30 minutes at room temperature, followed by two washes with PBS-T. After incubating with the secondary antibody, 4 drops of DAPI were added to each slide, incubated for 30 seconds, excess DAPI removed, and the slides then immediately coverslipped using ProLong Gold Antifade Mountant. Slides were stored at 4°C in the dark.
2.8 Microscopy analyses of kisspeptin and Cck or Cartpt co-expression
Using a Zeiss LSM 880 confocal microscope, images of Cck or Cartpt mRNA with TdTomato fluorescent staining were obtained at 40X (oil) magnification for one unilateral brain slice containing the MeA for each female. For each female, the number of TdTomato (reporter for kisspeptin) cells were identified (minimum 79 cells/mouse) and the number of Kiss1 cells that co-expressed Cck or Cartpt were counted, using the RNAscope manufacturer’s criteria as a guideline (cell = ≥15 clustered dots). The mean percent of MeA Kiss1 cells that contained Cck or Carpt was calculated.
2.9 Statistical analysis
T-tests were performed to compare LH levels between the OVX and E2-treated females. To statistically test for differences in gene expression between OVX and E2-treated females, the voom technique, which uses limma and edgeR Bioconductor packages (64–66), was used. This technique using simple linear regression models and produces a modified t-statistic that is interpreted like other t-statistics, with the exception that the standard errors have been moderated across genes using a simple Bayesian model (64–66). The reported p-value for all RNA-seq statistical analyses is an Benjamini-Hochberg-adjusted p-value to account for the number of genes analyzed in the dataset (71). The statistical significance was set so the adjusted p-value < 0.05.
3 Results
3.1 Validation and specificity of the Ribotag isolation of MeA Kiss1 cell transcripts
Genes that are co-expressed in MeA kisspeptin neurons are unknown, though Cck is known to be expressed in the MeA region (59, 60), suggesting it may also be expressed specifically in kisspeptin neurons in this region. As a search for a positive control gene that is expressed in MeA kisspeptin neurons, we first performed a double-label assay to assess if Cck is in fact present in MeA kisspeptin neurons. Indeed, we observed that most MeA Kiss1 cells of female mice also express high levels of Cck (Figure 1), with 88% of MeA Kiss1 cells co-expressing Cck mRNA. Thus, Cck expression was selected as a positive control for subsequent Ribotag pulldown validation purposes.
In order to validate the Ribotag isolation procedure, we performed RT-PCR using cDNA from both the Input samples (mRNA from all cells in the MeA micropunches, including Kiss1 cells) and IP samples (mRNA from only Kiss1 cell ribosomes) to confirm that the immunoprecipitation procedure was specific to Kiss1 cells. As expected, both the Input and IP samples of KissRibo mice contained Kiss1 transcripts (Figure 2). As also expected, Kiss1 was also found in the Input samples of Control (Cre-) mice, but was not detected in the IP samples of these Controls (Figure 2), confirming that the immuno-pulldown was specific to Kiss1 cells that had undergone Cre-mediated recombination to express the HA+ tag. Our positive control gene, Cck, was also found to be highly expressed in all the Input samples as well as in IP samples of both E2-treated and OVX KissRibo mice, but not in the IP of Control mice (Figure 2), further validating the selectivity of the Ribotag isolation technique. Given that little is currently known about what genes are or are not expressed in MeA Kiss1 neurons, it is difficult to identify a true negative control. We selected Avp because Avp is expressed in the MeA region, but typically more in the rostral part of the MeA (61), whereas Kiss1 is expressed in the more caudal (posterior) part of the MeA. Thus, AVP and Kiss1 are in different anatomical sub-regions of the MeA and unlikely to be co-expressed in the same cells, serving as a useful negative control for our Riobotag pulldown selectivity. Indeed, here we confirmed that Avp mRNA was present, at low to moderate levels, in all Input samples but was absent in all IP samples (Figure 2), suggesting that MeA Kiss1 cells do not express Avp but other MeA cell types do.
Figure 2
RT-PCR validation of successful isolation of ribosomal mRNA from MeA Kiss1 cells in female mice. The number above each lane denotes the pooled sample number. Input samples contain all cells in the MeA, including, but not limited to Kiss1 cells. IP samples contain mRNA transcripts isolated from the ribosomes of only MeA Kiss1 cells, but not other non-Kiss1 MeA cells. Kiss1 and Cck are identified in both the Input and IP samples as expected, whereas Avp transcripts were located in the Input, but not the IP samples, indicating that Avp is not expressed in MeA Kiss1 cells. For our Cre- control mice, the Input samples express bands for Kiss1, Cck, and Avp, whereas the IP samples, as expected due to the lack of the HA+ tag on the ribosomes, do not contain mRNA for these genes.
3.2 Identification of RNA transcripts in female MeA Kiss1 cells
The goal of the current study is to identify what neuropeptides, neurotransmitter synthesis and transport factors, and receptors are made by MeA Kiss1 neurons to begin to understand the regulation and function of this Kiss1 neuronal population. RNA quality for all E2 and OVX KissRibo samples was sufficient for RNA-seq, with RNA integrity values of at least 7.6 for all 6 KissRibo IP samples. As expected, the RNA quality for our Cre- control samples, which lack the HA+ tag in Kiss1 cells, was low, <5.8. Due to the low integrity of the RNA from our control samples, only the KissRibo IP samples were processed for RNA-seq. The library size for each KissRibo sample was ≥ 25M total reads per sample, well above the 5-25M reads per sample recommended by Illumina, and well over the 10M reads aligned reach threshold, indicating a high RNA-seq quality. RNA-seq of the KissRibo samples identified approximately 13,800 different mRNA transcripts, including Kiss1 and Cck, as well as other transcripts such as Esr1, Esr2, Ar, Gal, Cartpt, Pdyn, Oxtr, and Npy2r (Figure 3). Our first analysis identified the top 75 genes expressed by MeA Kiss1 cells, regardless of E2 treatment. The top 3 most highly expressed genes (Sptbn1, Sptan1, and Sptbn2) are coding genes for spectrin proteins, which are involved in actin crosslinking, cell communication, and cell regulation. Other very highly expressed transcripts included several genes related to intra-cell signaling, such as Gprasp1, Atp1a3, Calm1, and Ywhag, genes important for protein synthesis and regulation, including Cpe, Hspa8, Hsp90ab1, Eef1a1, and Ubb, and genes involved with secretion and synapses, like App, Syp, and Rtn1. The 75 transcripts with the highest overall mean expression (i.e., the mean expression of all OVX and E2 samples combined) in MeA Kiss1 cells are listed in Table 1.
Figure 3
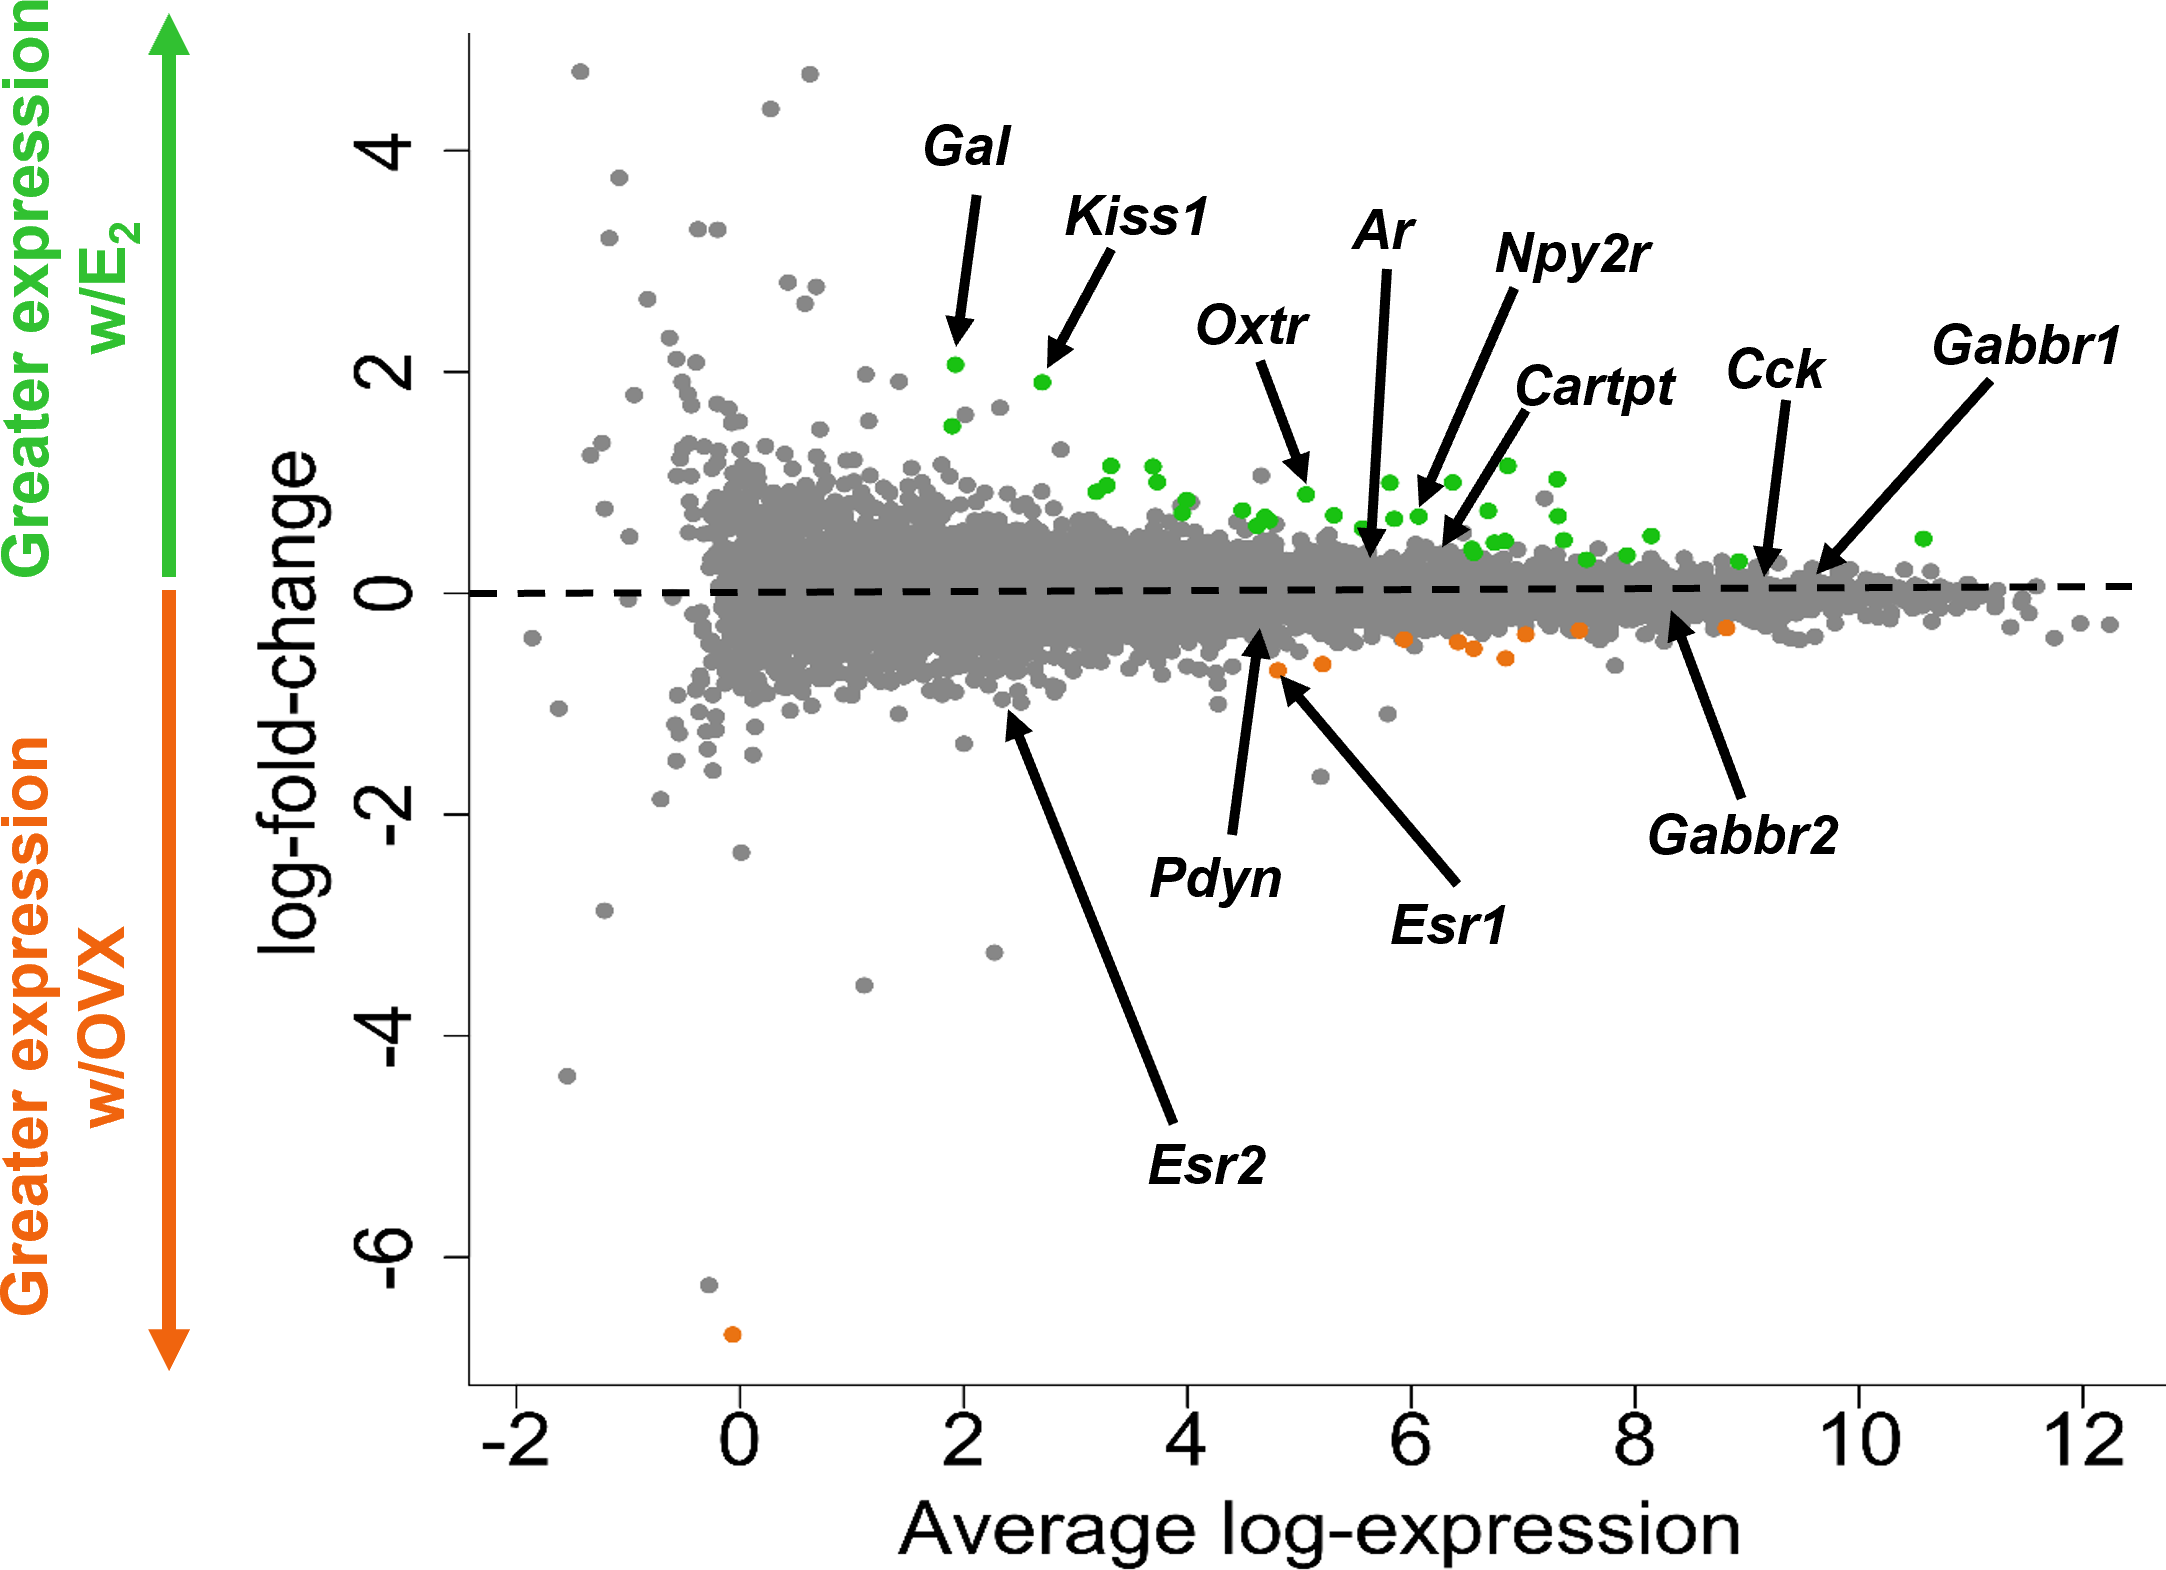
A glimma plot showing the expression of >13,800 gene transcripts identified by RNA-seq to be produced in MeA Kiss1 cells. Each dot represents a single gene transcript. Some transcripts were upregulated by E2 treatment (green dots), whereas other transcripts were downregulated by E2 treatment (orange dots). Grey dots represent gene transcripts whose expression did not differ between OVX and E2 treatment groups. The y-axis represents the magnitude of difference in expression levels between OVX and E2 samples, with greater positive or negative values indicating a greater difference in gene expression between the two treatment groups. Y-axis values close to 0 indicate little change in expression levels between OVX and E2 treatments. The x-axis represents the average log-expression of each transcript, thus plotting the average of the mean expression levels of the OVX and E2 treatment groups. Several genes of interest are marked by arrows to indicate their location in the glimma plot.
Table 1
| ENSEMBL ID | ENTREZ ID | Gene | Total Mean expression | Mean E2 expression | Mean OVX expression | Adjusted p value |
|---|---|---|---|---|---|---|
| ENSMUSG00000020315 | 20742 | Sptbn1 | 12.242 | 12.099 | 12.384 | 0.5118 |
| ENSMUSG00000057738 | 20740 | Sptan1 | 11.977 | 11.841 | 12.113 | 0.4078 |
| ENSMUSG00000067889 | 20743 | Sptbn2 | 11.746 | 11.545 | 11.948 | 0.3742 |
| ENSMUSG00000015656 | 15481 | Hspa8 | 11.585 | 11.615 | 11.555 | 0.8581 |
| ENSMUSG00000024617 | 12322 | Camk2a | 11.519 | 11.430 | 11.609 | 0.4101 |
| ENSMUSG00000040907 | 232975 | Atp1a3 | 11.462 | 11.438 | 11.486 | 0.8567 |
| ENSMUSG00000001175 | 12313 | Calm1 | 11.448 | 11.405 | 11.491 | 0.6301 |
| ENSMUSG00000032826 | 109676 | Ank2 | 11.354 | 11.202 | 11.506 | 0.4078 |
| ENSMUSG00000023944 | 15516 | Hsp90ab1 | 11.238 | 11.252 | 11.224 | 0.9463 |
| ENSMUSG00000022892 | 11820 | App | 11.224 | 11.186 | 11.262 | 0.7160 |
| ENSMUSG00000004207 | 19156 | Psap | 11.217 | 11.153 | 11.281 | 0.4345 |
| ENSMUSG00000030695 | 11674 | Aldoa | 11.097 | 11.084 | 11.110 | 0.9524 |
| ENSMUSG00000028833 | 26562 | Ncdn | 11.011 | 10.967 | 11.054 | 0.6539 |
| ENSMUSG00000037742 | 13627 | Eef1a1 | 10.981 | 11.022 | 10.940 | 0.6704 |
| ENSMUSG00000019505 | 22187 | Ubb | 10.978 | 10.985 | 10.972 | 0.9778 |
| ENSMUSG00000027273 | 20614 | Snap25 | 10.970 | 11.011 | 10.928 | 0.7388 |
| ENSMUSG00000006651 | 11803 | Aplp1 | 10.909 | 10.885 | 10.933 | 0.8767 |
| ENSMUSG00000031144 | 20977 | Syp | 10.902 | 10.905 | 10.899 | 0.9893 |
| ENSMUSG00000036564 | 234593 | Ndrg4 | 10.893 | 10.908 | 10.879 | 0.9240 |
| ENSMUSG00000072235 | 22142 | Tuba1a | 10.880 | 10.890 | 10.871 | 0.9640 |
| ENSMUSG00000032294 | 18746 | Pkm | 10.878 | 10.875 | 10.882 | 0.9902 |
| ENSMUSG00000062825 | 11465 | Actg1 | 10.875 | 10.878 | 10.871 | 0.9893 |
| ENSMUSG00000014602 | 16560 | Kif1a | 10.873 | 10.806 | 10.940 | 0.6811 |
| ENSMUSG00000036438 | 12314 | Calm2 | 10.793 | 10.808 | 10.777 | 0.9524 |
| ENSMUSG00000051391 | 22628 | Ywhag | 10.780 | 10.786 | 10.773 | 0.9720 |
| ENSMUSG00000026825 | 13429 | Dnm1 | 10.767 | 10.755 | 10.778 | 0.9527 |
| ENSMUSG00000074657 | 16572 | Kif5a | 10.739 | 10.751 | 10.726 | 0.9639 |
| ENSMUSG00000027523 | 14683 | Gnas | 10.733 | 10.711 | 10.755 | 0.8863 |
| ENSMUSG00000021270 | 15519 | Hsp90aa1 | 10.727 | 10.757 | 10.697 | 0.8383 |
| ENSMUSG00000039953 | 65945 | Clstn1 | 10.726 | 10.657 | 10.795 | 0.3811 |
| ENSMUSG00000046093 | 170638 | Hpcal4 | 10.702 | 10.662 | 10.742 | 0.7003 |
| ENSMUSG00000019923 | 52696 | Zwint | 10.695 | 10.687 | 10.703 | 0.9848 |
| ENSMUSG00000043384 | 67298 | Gprasp1 | 10.681 | 10.689 | 10.674 | 0.9859 |
| ENSMUSG00000027254 | 17754 | Map1a | 10.662 | 10.618 | 10.705 | 0.8595 |
| ENSMUSG00000022421 | 73340 | Nptxr | 10.652 | 10.524 | 10.779 | 0.4542 |
| ENSMUSG00000006930 | 15114 | Hap1 | 10.642 | 10.740 | 10.544 | 0.3411 |
| ENSMUSG00000021087 | 104001 | Rtn1 | 10.585 | 10.550 | 10.620 | 0.7867 |
| ENSMUSG00000050711 | 20254 | Scg2 | 10.577 | 10.823 | 10.331 | 0.0453 |
| ENSMUSG00000019370 | 12315 | Calm3 | 10.566 | 10.508 | 10.625 | 0.4801 |
| ENSMUSG00000058672 | 22151 | Tubb2a | 10.564 | 10.588 | 10.539 | 0.8863 |
| ENSMUSG00000053310 | 64011 | Nrgn | 10.529 | 10.520 | 10.537 | 0.9784 |
| ENSMUSG00000024758 | 20168 | Rtn3 | 10.508 | 10.510 | 10.506 | 0.9901 |
| ENSMUSG00000022285 | 22631 | Ywhaz | 10.507 | 10.501 | 10.514 | 0.9778 |
| ENSMUSG00000015222 | 17756 | Map2 | 10.500 | 10.539 | 10.461 | 0.8128 |
| ENSMUSG00000004267 | 13807 | Eno2 | 10.498 | 10.483 | 10.513 | 0.9382 |
| ENSMUSG00000037852 | 12876 | Cpe | 10.480 | 10.483 | 10.478 | 0.9902 |
| ENSMUSG00000058297 | 94214 | Spock2 | 10.479 | 10.409 | 10.549 | 0.3330 |
| ENSMUSG00000051853 | 11842 | Arf3 | 10.439 | 10.397 | 10.481 | 0.6539 |
| ENSMUSG00000025422 | 216439 | Agap2 | 10.412 | 10.377 | 10.448 | 0.8311 |
| ENSMUSG00000044349 | 319317 | Snhg11 | 10.407 | 10.512 | 10.301 | 0.1504 |
| ENSMUSG00000008348 | 22190 | Ubc | 10.393 | 10.406 | 10.380 | 0.9406 |
| ENSMUSG00000026576 | 11931 | Atp1b1 | 10.376 | 10.396 | 10.356 | 0.8799 |
| ENSMUSG00000070802 | 434128 | Pnmal2 | 10.359 | 10.383 | 10.335 | 0.8880 |
| ENSMUSG00000034187 | 18195 | Nsf | 10.349 | 10.330 | 10.368 | 0.9145 |
| ENSMUSG00000018707 | 13424 | Dync1h1 | 10.289 | 10.203 | 10.374 | 0.7243 |
| ENSMUSG00000026131 | 13518 | Dst | 10.288 | 10.195 | 10.381 | 0.6898 |
| ENSMUSG00000028649 | 11426 | Macf1 | 10.277 | 10.160 | 10.394 | 0.6331 |
| ENSMUSG00000031517 | 234267 | Gpm6a | 10.268 | 10.310 | 10.226 | 0.7715 |
| ENSMUSG00000025855 | 19085 | Prkar1b | 10.245 | 10.238 | 10.253 | 0.9780 |
| ENSMUSG00000026797 | 20910 | Stxbp1 | 10.237 | 10.210 | 10.265 | 0.8365 |
| ENSMUSG00000052727 | 17755 | Map1b | 10.237 | 10.262 | 10.212 | 0.8683 |
| ENSMUSG00000025867 | 12890 | Cplx2 | 10.211 | 10.248 | 10.173 | 0.8091 |
| ENSMUSG00000018965 | 22629 | Ywhah | 10.175 | 10.231 | 10.119 | 0.6360 |
| ENSMUSG00000023004 | 22143 | Tuba1b | 10.171 | 10.225 | 10.116 | 0.6450 |
| ENSMUSG00000059213 | 13199 | Ddn | 10.168 | 10.060 | 10.277 | 0.4345 |
| ENSMUSG00000020894 | 22318 | Vamp2 | 10.154 | 10.109 | 10.198 | 0.6710 |
| ENSMUSG00000024121 | 11984 | Atp6v0c | 10.150 | 10.157 | 10.142 | 0.9713 |
| ENSMUSG00000016349 | 13628 | Eef1a2 | 10.103 | 10.097 | 10.109 | 0.9857 |
| ENSMUSG00000022199 | 59049 | Slc22a17 | 10.088 | 10.066 | 10.110 | 0.8834 |
| ENSMUSG00000025151 | 94275 | Maged1 | 10.081 | 10.096 | 10.065 | 0.9356 |
| ENSMUSG00000029223 | 22223 | Uchl1 | 10.073 | 10.068 | 10.079 | 0.9895 |
| ENSMUSG00000025579 | 14387 | Gaa | 10.072 | 10.058 | 10.086 | 0.9606 |
| ENSMUSG00000025393 | 11947 | Atp5b | 10.068 | 10.050 | 10.087 | 0.9085 |
| ENSMUSG00000026223 | 64294 | Itm2c | 10.065 | 10.129 | 10.001 | 0.5503 |
| ENSMUSG00000025428 | 11946 | Atp5a1 | 10.064 | 10.058 | 10.070 | 0.9859 |
The 75 genes that are most highly expressed by female MeA Kiss1 neurons.
Transcripts are listed in descending order of total mean expression, regardless of hormone treatment. p <0.05 signifies significant differential expression between E2 and OVX conditions, denoted in bold type.
Many transcripts for genes encoding neuropeptides, receptors, and proteins involved in neurotransmitter synthesis or transport were found to be highly expressed in the RNA-seq data. In addition to Gabbr1 and Gabbr2 being expressed in the RNA-seq dataset, which supports previous co-expression double-label assays with GABABR and Kiss1 in the MeA (19), the RNAseq identified new transcripts that appear to be expressed by MeA Kiss1 cells, some of which are implicated in reproductive function or other behaviors. Aside from Kiss1, RNAseq identified other neuropeptides implicated in modulating reproduction, metabolism, and stress, such as Cck, Pdyn, Tac1, Gal, Cartpt, Trh, Sst, Npy, Agt, Vgf, and Penk (Table 2). Transcripts related to GABA synthesis and transport, like Vgat, Gad1, and Gad2, were also expressed, as were genes important for glutamate transport and synthesis, such as Glud1, Vglut1, and Vglut2 (Table 2). Table 2 provides a more detailed list of ligand (or their related enzymes) gene transcripts identified in this RNA-seq dataset. A few ligands of interest that were absent include Avp, C3, Calca, Nmu, Oxt, Ghrh, Gnrh1, and Tshb.
Table 2
| ENSEMBL | ENTREZ ID | Gene | Overall Mean expression | Mean E2 expression | Mean OVX expression | Adjusted p value |
|---|---|---|---|---|---|---|
| ENSMUSG00000037428 | 381677 | Vgf | 9.288 | 9.284 | 9.292 | 0.9895 |
| ENSMUSG00000032532 | 12424 | Cck | 9.087 | 9.205 | 8.968 | 0.2596 |
| ENSMUSG00000045573 | 18619 | Penk | 8.372 | 8.423 | 8.320 | 0.8302 |
| ENSMUSG00000030500 | 140919 | Slc17a6 | 7.669 | 7.869 | 7.468 | 0.1087 |
| ENSMUSG00000070880 | 14415 | Gad1 | 7.387 | 7.461 | 7.312 | 0.7006 |
| ENSMUSG00000026787 | 14417 | Gad2 | 7.249 | 7.404 | 7.093 | 0.2441 |
| ENSMUSG00000037771 | 22348 | Slc32a1 | 6.754 | 6.807 | 6.700 | 0.8247 |
| ENSMUSG00000021647 | 27220 | Cartpt | 6.442 | 6.510 | 6.374 | 0.9269 |
| ENSMUSG00000004366 | 20604 | Sst | 6.222 | 6.176 | 6.269 | 0.7983 |
| ENSMUSG00000005892 | 22044 | Trh | 6.136 | 6.025 | 6.246 | 0.7929 |
| ENSMUSG00000024256 | 11516 | Adcyap1 | 5.975 | 6.054 | 5.895 | 0.7793 |
| ENSMUSG00000061762 | 21333 | Tac1 | 5.436 | 5.505 | 5.367 | 0.8532 |
| ENSMUSG00000021342 | 19109 | Prl | 5.189 | 4.431 | 5.946 | 0.8961 |
| ENSMUSG00000031980 | 11606 | Agt | 4.788 | 5.110 | 4.466 | 0.3055 |
| ENSMUSG00000027400 | 18610 | Pdyn | 4.744 | 4.658 | 4.830 | 0.6762 |
| ENSMUSG00000045731 | 18155 | Pnoc | 3.968 | 4.173 | 3.763 | 0.5648 |
| ENSMUSG00000029819 | 109648 | Npy | 3.635 | 3.674 | 3.596 | 0.9562 |
| ENSMUSG00000024517 | 225642 | Grp | 3.578 | 3.564 | 3.593 | 0.9861 |
| ENSMUSG00000019890 | 67405 | Nts | 3.024 | 3.114 | 2.935 | 0.8756 |
| ENSMUSG00000019772 | 22353 | Vip | 2.973 | 2.823 | 3.124 | 0.7557 |
| ENSMUSG00000115958 | 280287 | Kiss1 | 2.701 | 3.656 | 1.746 | 0.0049 |
| ENSMUSG00000037010 | 30878 | Apln | 2.643 | 2.689 | 2.597 | 0.9770 |
| ENSMUSG00000020713 | 14599 | Gh | 2.274 | 0.780 | 3.767 | 0.8107 |
| ENSMUSG00000025400 | 21334 | Tac2 | 2.240 | 2.053 | 2.427 | 0.7956 |
| ENSMUSG00000027524 | 13616 | Edn3 | 2.088 | 2.133 | 2.044 | 0.9845 |
| ENSMUSG00000024907 | 14419 | Gal | 1.925 | 2.947 | 0.903 | 0.0207 |
| ENSMUSG00000000214 | 21823 | Th | 1.853 | 2.252 | 1.454 | 0.5648 |
| ENSMUSG00000044988 | 83428 | Ucn3 | 1.425 | 1.641 | 1.209 | 0.7486 |
Notable ligand (or their related enzyme) transcripts identified in female MeA Kiss1 cells.
Transcripts are listed in descending order based on total mean expression (average log CPM for E2 and GDX treatments combined). p <0.05 signifies significant differential expression between E2 and OVX conditions, denoted in bold type.
We examined transcripts for receptors in the RNA-seq data, which might provide insight into how MeA Kiss1 neurons are regulated, either by hormones or neural signaling. Sex steroid receptors were present, as might be predicted given estrogen’s known ability to upregulate Kiss1 in the MeA. Specifically, estrogen receptor alpha (Esr1), androgen receptor (Ar), and progesterone receptor (Pgr) were each moderately expressed, while estrogen receptor beta (Esr2) had lower expression levels (Table 3). Some additional receptors expressed in the RNA-seq data include Gabbr1, Gabbr2, Cnr1, Crhr1, Crhr2, Npy1r, Npy2r, Npy5r, Tacr1, and Thra. A more detailed list of the receptors expressed by MeA Kiss1 cells is in Table 3. Of note, the following gene transcripts are for some receptors that were absent (not expressed) in the current RNA-seq dataset: Chrna5, Ahrnb4, Pacapr1, Gpr50, Nmur2, P2rx2, Aplnr, Bdkrb2, Chrnb1, Lpar4, Npy4r, Rxfp2, Sctr, and Tbxa2r.
Table 3
| ENSEMBL | ENTREZ ID | Gene | Overall Mean expression | Mean E2 expression | Mean OVX expression | Adjusted p value |
|---|---|---|---|---|---|---|
| ENSMUSG00000058756 | 21833 | Thra | 9.906 | 9.842 | 9.969 | 0.4413 |
| ENSMUSG00000024462 | 54393 | Gabbr1 | 9.566 | 9.558 | 9.574 | 0.9644 |
| ENSMUSG00000026959 | 14810 | Grin1 | 9.173 | 9.137 | 9.209 | 0.7793 |
| ENSMUSG00000033981 | 14800 | Gria2 | 9.069 | 9.065 | 9.073 | 0.9881 |
| ENSMUSG00000020524 | 14799 | Gria1 | 8.891 | 8.857 | 8.925 | 0.7808 |
| ENSMUSG00000030209 | 14812 | Grin2b | 8.877 | 8.803 | 8.951 | 0.6134 |
| ENSMUSG00000039809 | 242425 | Gabbr2 | 8.383 | 8.299 | 8.466 | 0.4427 |
| ENSMUSG00000003378 | 14809 | Grik5 | 8.311 | 8.299 | 8.324 | 0.9638 |
| ENSMUSG00000001986 | 53623 | Gria3 | 8.224 | 8.194 | 8.254 | 0.8610 |
| ENSMUSG00000000560 | 14395 | Gabra2 | 8.120 | 8.143 | 8.097 | 0.9145 |
| ENSMUSG00000041380 | 15560 | Htr2c | 8.091 | 8.144 | 8.039 | 0.7981 |
| ENSMUSG00000033676 | 14402 | Gabrb3 | 8.053 | 8.051 | 8.056 | 0.9904 |
| ENSMUSG00000010803 | 14394 | Gabra1 | 7.970 | 8.057 | 7.882 | 0.4934 |
| ENSMUSG00000020436 | 14406 | Gabrg2 | 7.671 | 7.660 | 7.682 | 0.9753 |
| ENSMUSG00000031343 | 14396 | Gabra3 | 7.565 | 7.512 | 7.619 | 0.6177 |
| ENSMUSG00000029778 | 11517 | Adcyap1r1 | 7.560 | 7.550 | 7.571 | 0.9639 |
| ENSMUSG00000032773 | 12669 | Chrm1 | 7.521 | 7.470 | 7.573 | 0.6687 |
| ENSMUSG00000029212 | 14400 | Gabrb1 | 7.472 | 7.475 | 7.469 | 0.9920 |
| ENSMUSG00000049583 | 108071 | Grm5 | 7.443 | 7.445 | 7.441 | 0.9944 |
| ENSMUSG00000028020 | 14658 | Glrb | 7.101 | 7.141 | 7.062 | 0.8005 |
| ENSMUSG00000039579 | 242443 | Grin3a | 6.946 | 6.912 | 6.981 | 0.8741 |
| ENSMUSG00000042429 | 11539 | Adora1 | 6.770 | 6.714 | 6.826 | 0.7369 |
| ENSMUSG00000044288 | 12801 | Cnr1 | 6.736 | 6.694 | 6.778 | 0.7826 |
| ENSMUSG00000059003 | 14811 | Grin2a | 6.733 | 6.682 | 6.785 | 0.7542 |
| ENSMUSG00000027584 | 18389 | Oprl1 | 6.618 | 6.664 | 6.572 | 0.8261 |
| ENSMUSG00000027950 | 11444 | Chrnb2 | 6.569 | 6.524 | 6.614 | 0.8002 |
| ENSMUSG00000056755 | 108073 | Grm7 | 6.550 | 6.572 | 6.528 | 0.9218 |
| ENSMUSG00000030043 | 21336 | Tacr1 | 6.463 | 6.736 | 6.191 | 0.2038 |
| ENSMUSG00000029211 | 14397 | Gabra4 | 6.410 | 6.465 | 6.355 | 0.7056 |
| ENSMUSG00000020591 | 18217 | Ntsr2 | 6.407 | 6.501 | 6.312 | 0.5123 |
| ENSMUSG00000007653 | 14401 | Gabrb2 | 6.386 | 6.416 | 6.356 | 0.9205 |
| ENSMUSG00000001985 | 14807 | Grik3 | 6.370 | 6.214 | 6.526 | 0.2038 |
| ENSMUSG00000039059 | 99296 | Hrh3 | 6.345 | 6.284 | 6.407 | 0.6263 |
| ENSMUSG00000041078 | 14803 | Grid1 | 6.288 | 6.292 | 6.285 | 0.9895 |
| ENSMUSG00000024431 | 14815 | Nr3c1 | 6.257 | 6.244 | 6.269 | 0.9644 |
| ENSMUSG00000023192 | 108068 | Grm2 | 6.198 | 6.100 | 6.296 | 0.5813 |
| ENSMUSG00000028004 | 18167 | Npy2r | 6.066 | 6.413 | 5.718 | 0.0012 |
| ENSMUSG00000038257 | 110304 | Glra3 | 6.038 | 6.259 | 5.817 | 0.0828 |
| ENSMUSG00000001260 | 14405 | Gabrg1 | 5.923 | 6.018 | 5.828 | 0.6066 |
| ENSMUSG00000056073 | 14806 | Grik2 | 5.891 | 5.808 | 5.974 | 0.5503 |
| ENSMUSG00000025892 | 14802 | Gria4 | 5.847 | 5.921 | 5.773 | 0.6687 |
| ENSMUSG00000045092 | 13609 | S1pr1 | 5.797 | 5.910 | 5.684 | 0.5123 |
| ENSMUSG00000055078 | 110886 | Gabra5 | 5.759 | 5.751 | 5.766 | 0.9918 |
| ENSMUSG00000021779 | 21834 | Thrb | 5.664 | 5.533 | 5.795 | 0.2818 |
| ENSMUSG00000019828 | 14816 | Grm1 | 5.654 | 5.496 | 5.812 | 0.1479 |
| ENSMUSG00000030898 | 12426 | Cckbr | 5.648 | 5.632 | 5.664 | 0.9796 |
| ENSMUSG00000046532 | 11835 | Ar | 5.591 | 5.771 | 5.411 | 0.0781 |
| ENSMUSG00000044933 | 20607 | Sstr3 | 5.513 | 5.528 | 5.497 | 0.9639 |
| ENSMUSG00000046159 | 12671 | Chrm3 | 5.489 | 5.423 | 5.554 | 0.7779 |
| ENSMUSG00000033717 | 11551 | Adra2a | 5.424 | 5.543 | 5.305 | 0.4746 |
| ENSMUSG00000020734 | 14813 | Grin2c | 5.393 | 5.379 | 5.407 | 0.9753 |
| ENSMUSG00000029054 | 14403 | Gabrd | 5.234 | 5.257 | 5.210 | 0.9475 |
| ENSMUSG00000018589 | 237213 | Glra2 | 5.220 | 5.351 | 5.090 | 0.3503 |
| ENSMUSG00000055026 | 14407 | Gabrg3 | 5.165 | 5.241 | 5.089 | 0.8123 |
| ENSMUSG00000049112 | 18430 | Oxtr | 5.060 | 5.508 | 4.612 | 0.0010 |
| ENSMUSG00000021721 | 15550 | Htr1a | 4.978 | 4.945 | 5.011 | 0.9340 |
| ENSMUSG00000031344 | 57249 | Gabrq | 4.967 | 4.880 | 5.054 | 0.6818 |
| ENSMUSG00000047904 | 20606 | Sstr2 | 4.965 | 4.803 | 5.128 | 0.2973 |
| ENSMUSG00000045318 | 11553 | Adra2c | 4.897 | 4.837 | 4.957 | 0.8429 |
| ENSMUSG00000038760 | 22045 | Trhr | 4.884 | 4.972 | 4.797 | 0.7172 |
| ENSMUSG00000034997 | 15558 | Htr2a | 4.881 | 4.966 | 4.796 | 0.6762 |
| ENSMUSG00000019768 | 13982 | Esr1 | 4.807 | 4.455 | 5.159 | 0.0264 |
| ENSMUSG00000035431 | 20605 | Sstr1 | 4.777 | 4.974 | 4.579 | 0.1697 |
| ENSMUSG00000002771 | 14814 | Grin2d | 4.718 | 4.798 | 4.638 | 0.7071 |
| ENSMUSG00000071424 | 14804 | Grid2 | 4.716 | 4.700 | 4.732 | 0.9639 |
| ENSMUSG00000034009 | 381489 | Rxfp1 | 4.692 | 5.035 | 4.348 | 0.0141 |
| ENSMUSG00000027577 | 11438 | Chrna4 | 4.679 | 4.699 | 4.660 | 0.9562 |
| ENSMUSG00000031870 | 18667 | Pgr | 4.674 | 4.836 | 4.512 | 0.3616 |
| ENSMUSG00000022122 | 13618 | Ednrb | 4.647 | 4.815 | 4.479 | 0.4312 |
| ENSMUSG00000053004 | 15465 | Hrh1 | 4.623 | 4.616 | 4.630 | 0.9933 |
| ENSMUSG00000032017 | 110637 | Grik4 | 4.588 | 4.686 | 4.490 | 0.6539 |
| ENSMUSG00000018634 | 12921 | Crhr1 | 4.511 | 4.454 | 4.568 | 0.8928 |
| ENSMUSG00000021478 | 13488 | Drd1 | 4.475 | 4.549 | 4.400 | 0.8056 |
| ENSMUSG00000024798 | 15566 | Htr7 | 4.464 | 4.450 | 4.479 | 0.9861 |
| ENSMUSG00000022935 | 14805 | Grik1 | 4.452 | 4.660 | 4.244 | 0.1504 |
| ENSMUSG00000049511 | 15551 | Htr1b | 4.437 | 4.346 | 4.528 | 0.7290 |
| ENSMUSG00000036437 | 18166 | Npy1r | 4.359 | 4.322 | 4.395 | 0.9433 |
| ENSMUSG00000005268 | 19116 | Prlr | 4.320 | 4.529 | 4.111 | 0.6661 |
| ENSMUSG00000035283 | 11554 | Adrb1 | 4.279 | 4.215 | 4.342 | 0.8430 |
| ENSMUSG00000031340 | 14404 | Gabre | 4.274 | 3.804 | 4.744 | 0.4340 |
| ENSMUSG00000023964 | 12311 | Calcr | 4.269 | 3.855 | 4.683 | 0.2711 |
| ENSMUSG00000003974 | 108069 | Grm3 | 4.253 | 4.075 | 4.432 | 0.3367 |
| ENSMUSG00000031932 | 14608 | Gpr83 | 4.221 | 4.218 | 4.224 | 0.9961 |
| ENSMUSG00000039106 | 15563 | Htr5a | 4.201 | 4.320 | 4.083 | 0.6466 |
| ENSMUSG00000050164 | 207911 | Mchr1 | 4.172 | 4.207 | 4.138 | 0.9424 |
| ENSMUSG00000024211 | 14823 | Grm8 | 4.111 | 3.976 | 4.246 | 0.6594 |
| ENSMUSG00000020090 | 237362 | Npffr1 | 3.945 | 3.991 | 3.900 | 0.9638 |
| ENSMUSG00000050511 | 18386 | Oprd1 | 3.848 | 3.765 | 3.931 | 0.8311 |
| ENSMUSG00000025905 | 18387 | Oprk1 | 3.792 | 3.643 | 3.941 | 0.6070 |
| ENSMUSG00000063239 | 268934 | Grm4 | 3.670 | 3.609 | 3.730 | 0.9026 |
| ENSMUSG00000055737 | 14600 | Ghr | 3.668 | 3.835 | 3.502 | 0.6263 |
| ENSMUSG00000027568 | 18216 | Ntsr1 | 3.345 | 3.147 | 3.543 | 0.6070 |
| ENSMUSG00000045613 | 243764 | Chrm2 | 3.150 | 3.062 | 3.238 | 0.8905 |
| ENSMUSG00000035773 | 114229 | Kiss1r | 3.141 | 3.158 | 3.124 | 0.9873 |
| ENSMUSG00000050824 | 20609 | Sstr5 | 3.001 | 3.098 | 2.904 | 0.8421 |
| ENSMUSG00000047259 | 17202 | Mc4r | 2.493 | 2.699 | 2.287 | 0.6532 |
| ENSMUSG00000021055 | 13983 | Esr2 | 2.343 | 1.861 | 2.826 | 0.1881 |
| ENSMUSG00000045875 | 11549 | Adra1a | 2.275 | 2.480 | 2.070 | 0.7479 |
| ENSMUSG00000003476 | 12922 | Crhr2 | 1.862 | 1.733 | 1.991 | 0.8395 |
Notable receptor transcripts identified in female MeA Kiss1 cells.
Transcripts are listed in descending order based on total mean expression (average log CPM for E2 and GDX mice). p <0.05 signifies significant differential expression between E2 and OVX conditions, denoted in bold type.
3.3 E2-mediated differential expression of MeA Kiss1 cell gene transcripts
Kiss1 gene expression in the MeA is known to be upregulated with E2 treatment whereas Kiss1 levels in the MeA are very low or absent in gonadectomized mice lacking E2. Thus, we hypothesized that other gene transcripts in MeA Kiss1 cells might also change expression levels in the presence/absence of E2. Of the approximately 13,800 transcripts identified in the current RNA-seq data, only 45 genes had significantly different expression levels following 5-day E2 treatment, in comparison to OVX mice lacking E2 (Table 4; Figure 4). 10 of these genes were more highly expressed in OVX females (Figure 3, orange dots; Figure 4), while the remaining 35 genes were more highly expressed in E2-treated females (Figure 3, green dots; Figure 4). Table 4 provides a complete list of these differentially expressed genes, while Figure 4 is a heat map representing the expression patterns of each differentially expressed transcript for each of the 3 IP samples per treatment. As expected, Kiss1 is more highly expressed in E2-treated females in comparison to OVX females (Table 4, Figure 4). In addition to Kiss1, E2 treatment upregulated transcripts encoding Galanin (Gal) and oxytocin receptor (Oxtr) as well as those for fibroblast growth factor receptor 1 (Fgfr1) and prokineticin receptor 2 (Prokr2), two genes whose loss of function results in Kallmann syndrome (72, 73), and relaxin family peptide receptor 1 (Rxfp1), which is implicated in regulating sperm motility, pregnancy and birth (74, 75). Scg2 and Ecel1 (Endothelin Converting Enzyme Like 1) are important for neuropeptide release and are also higher in E2-treated than OVX females. E2 treatment also resulted in greater expression in several genes linked to obesity and/or diabetes (insulin receptor substrate 2, Irs2 (76); Neuropeptide Y receptor 2, Npy2r (77); Transcription Elongation Regulator 1 Like, Tcerg1l (78)), nervous system development (roundabout guidance receptor 3: Robo3 (79)), and cancer (acid sensing ion channel 2, Asic2 (80); Family With Sequence Similarity 107 Member A, FAM107A (81)). Though more gene transcripts were upregulated by E2, several genes were downregulated by E2 including Esr1, Cytochrome P450 Family 26 Subfamily B Member 1 (Cyp26b1; steroid synthesis), EPH receptor A4 (Epha4; nervous system development), and two genes linked to cancer (Paternally Expressed Gene 10, Peg10; Inka Box Actin Regulator 2, Inka2). Interestingly, most of the gene transcripts produced by MeA Kiss1 cells were not found to be significantly regulated by E2 in the present study (Figure 3, grey dots; Figure 4).
Table 4
| Gene transcripts stimulated by E2 | ||||||
|---|---|---|---|---|---|---|
| ENSEMBL ID | ENTREZ ID | Gene | Total mean expression | Mean E2 expression | Mean OVX expression | Adjusted p value |
| ENSMUSG00000053025 | 64176 | Sv2b | 8.8167 | 8.6590 | 8.9745 | 0.0287 |
| ENSMUSG00000030226 | 109593 | Lmo3 | 7.5022 | 7.3335 | 7.6709 | 0.0300 |
| ENSMUSG00000027298 | 22174 | Tyro3 | 7.0215 | 6.8356 | 7.2074 | 0.0489 |
| ENSMUSG00000092035 | 170676 | Peg10 | 6.8429 | 6.5499 | 7.1360 | 0.0055 |
| ENSMUSG00000026235 | 13838 | Epha4 | 6.5564 | 6.3050 | 6.8078 | 0.0479 |
| ENSMUSG00000074575 | 241794 | Kcng1 | 6.4170 | 6.1943 | 6.6397 | 0.0479 |
| ENSMUSG00000048458 | 109050 | Inka2 | 5.9357 | 5.7267 | 6.1448 | 0.0453 |
| ENSMUSG00000063415 | 232174 | Cyp26b1 | 5.2068 | 4.8840 | 5.5295 | 0.0479 |
| ENSMUSG00000019768 | 13982 | Esr1 | 4.8071 | 4.4547 | 5.1595 | 0.0264 |
| ENSMUSG00000117338 | NA | NA | -0.0650 | -3.4145 | 3.2846 | 0.0264 |
| Gene transcripts stimulated by E2 | ||||||
| ENSEMBL ID | ENTREZ ID | Gene | Total mean expression | Mean E2 expression | Mean OVX expression | Adjusted p value |
| ENSMUSG00000050711 | 20254 | Scg2 | 10.5768 | 10.8226 | 10.3311 | 0.0453 |
| ENSMUSG00000032479 | 17758 | Map4 | 8.9269 | 9.0713 | 8.7826 | 0.0453 |
| ENSMUSG00000051726 | 382571 | Kcnf1 | 8.1442 | 8.4029 | 7.8854 | 0.0012 |
| ENSMUSG00000030854 | 19259 | Ptpn5 | 7.9270 | 8.0982 | 7.7558 | 0.0251 |
| ENSMUSG00000048978 | 22360 | Nrsn1 | 7.5657 | 7.7171 | 7.4143 | 0.0287 |
| ENSMUSG00000031284 | 18481 | Pak3 | 7.3621 | 7.6020 | 7.1222 | 0.0010 |
| ENSMUSG00000031565 | 14182 | Fgfr1 | 7.3110 | 7.6590 | 6.9631 | 0.0010 |
| ENSMUSG00000069917 | 110257 | Hba-a2 | 7.3024 | 7.8218 | 6.7830 | 0.0441 |
| ENSMUSG00000026247 | 13599 | Ecel1 | 6.8612 | 7.4367 | 6.2858 | 0.0001 |
| ENSMUSG00000020704 | 11418 | Asic2 | 6.8365 | 7.0710 | 6.6021 | 0.0069 |
| ENSMUSG00000021750 | 268709 | Fam107a | 6.7427 | 6.9725 | 6.5128 | 0.0495 |
| ENSMUSG00000058897 | 77018 | Col25a1 | 6.6862 | 7.0609 | 6.3116 | 0.0016 |
| ENSMUSG00000117310 | 19243 | Ptp4a1 | 6.5580 | 6.7396 | 6.3763 | 0.0471 |
| ENSMUSG00000038894 | 384783 | Irs2 | 6.5400 | 6.7415 | 6.3385 | 0.0300 |
| ENSMUSG00000005973 | 19672 | Rcn1 | 6.3696 | 6.8672 | 5.8720 | 0.0005 |
| ENSMUSG00000028004 | 18167 | Npy2r | 6.0658 | 6.4133 | 5.7183 | 0.0012 |
| ENSMUSG00000033998 | 16525 | Kcnk1 | 5.8471 | 6.1833 | 5.5108 | 0.0010 |
| ENSMUSG00000069919 | 15122 | Hba-a1 | 5.8082 | 6.3147 | 5.3017 | 0.0158 |
| ENSMUSG00000000489 | 18591 | Pdgfb | 5.5636 | 5.8579 | 5.2693 | 0.0054 |
| ENSMUSG00000046593 | 320500 | Tmem215 | 5.3082 | 5.6580 | 4.9585 | 0.0145 |
| ENSMUSG00000049112 | 18430 | Oxtr | 5.0597 | 5.5075 | 4.6119 | 0.0010 |
| ENSMUSG00000001435 | 12822 | Col18a1 | 4.7290 | 5.0547 | 4.4034 | 0.0251 |
| ENSMUSG00000034009 | 381489 | Rxfp1 | 4.6916 | 5.0350 | 4.3482 | 0.0141 |
| ENSMUSG00000067578 | 228942 | Cbln4 | 4.6206 | 4.9293 | 4.3119 | 0.0479 |
| ENSMUSG00000041468 | 14738 | Gpr12 | 4.4888 | 4.8635 | 4.1142 | 0.0086 |
| ENSMUSG00000091002 | 70571 | Tcerg1l | 3.9913 | 4.4188 | 3.5638 | 0.0264 |
| ENSMUSG00000034640 | 99929 | Tiparp | 3.9528 | 4.3166 | 3.5890 | 0.0264 |
| ENSMUSG00000050558 | 246313 | Prokr2 | 3.7293 | 4.2241 | 3.2344 | 0.0264 |
| ENSMUSG00000001506 | 12842 | Col1a1 | 3.6909 | 4.2814 | 3.1005 | 0.0453 |
| ENSMUSG00000049892 | 19416 | Rasd1 | 3.3141 | 3.8900 | 2.7381 | 0.0075 |
| ENSMUSG00000057604 | 30937 | Lmcd1 | 3.2783 | 3.7636 | 2.7929 | 0.0264 |
| ENSMUSG00000019232 | 71760 | Etnppl | 3.1841 | 3.6521 | 2.7162 | 0.0479 |
| ENSMUSG00000115958 | 280287 | Kiss1 | 2.7010 | 3.6561 | 1.7460 | 0.0049 |
| ENSMUSG00000024907 | 14419 | Gal | 1.9249 | 2.9468 | 0.9030 | 0.0207 |
| ENSMUSG00000032128 | 19649 | Robo3 | 1.8956 | 2.6552 | 1.1360 | 0.0366 |
The 45 gene transcripts in MeA Kiss1 cells that are differentially expressed due to estrogen treatment (E2 vs OVX).
Adjusted p-value was set at 0.05. Gene transcripts are separated by those that are inhibited or stimulated by E2 and within each treatment, presented in descending order, beginning with the transcripts that have the highest Total Mean Expression (average expression of all E2 and OVX samples).
Figure 4
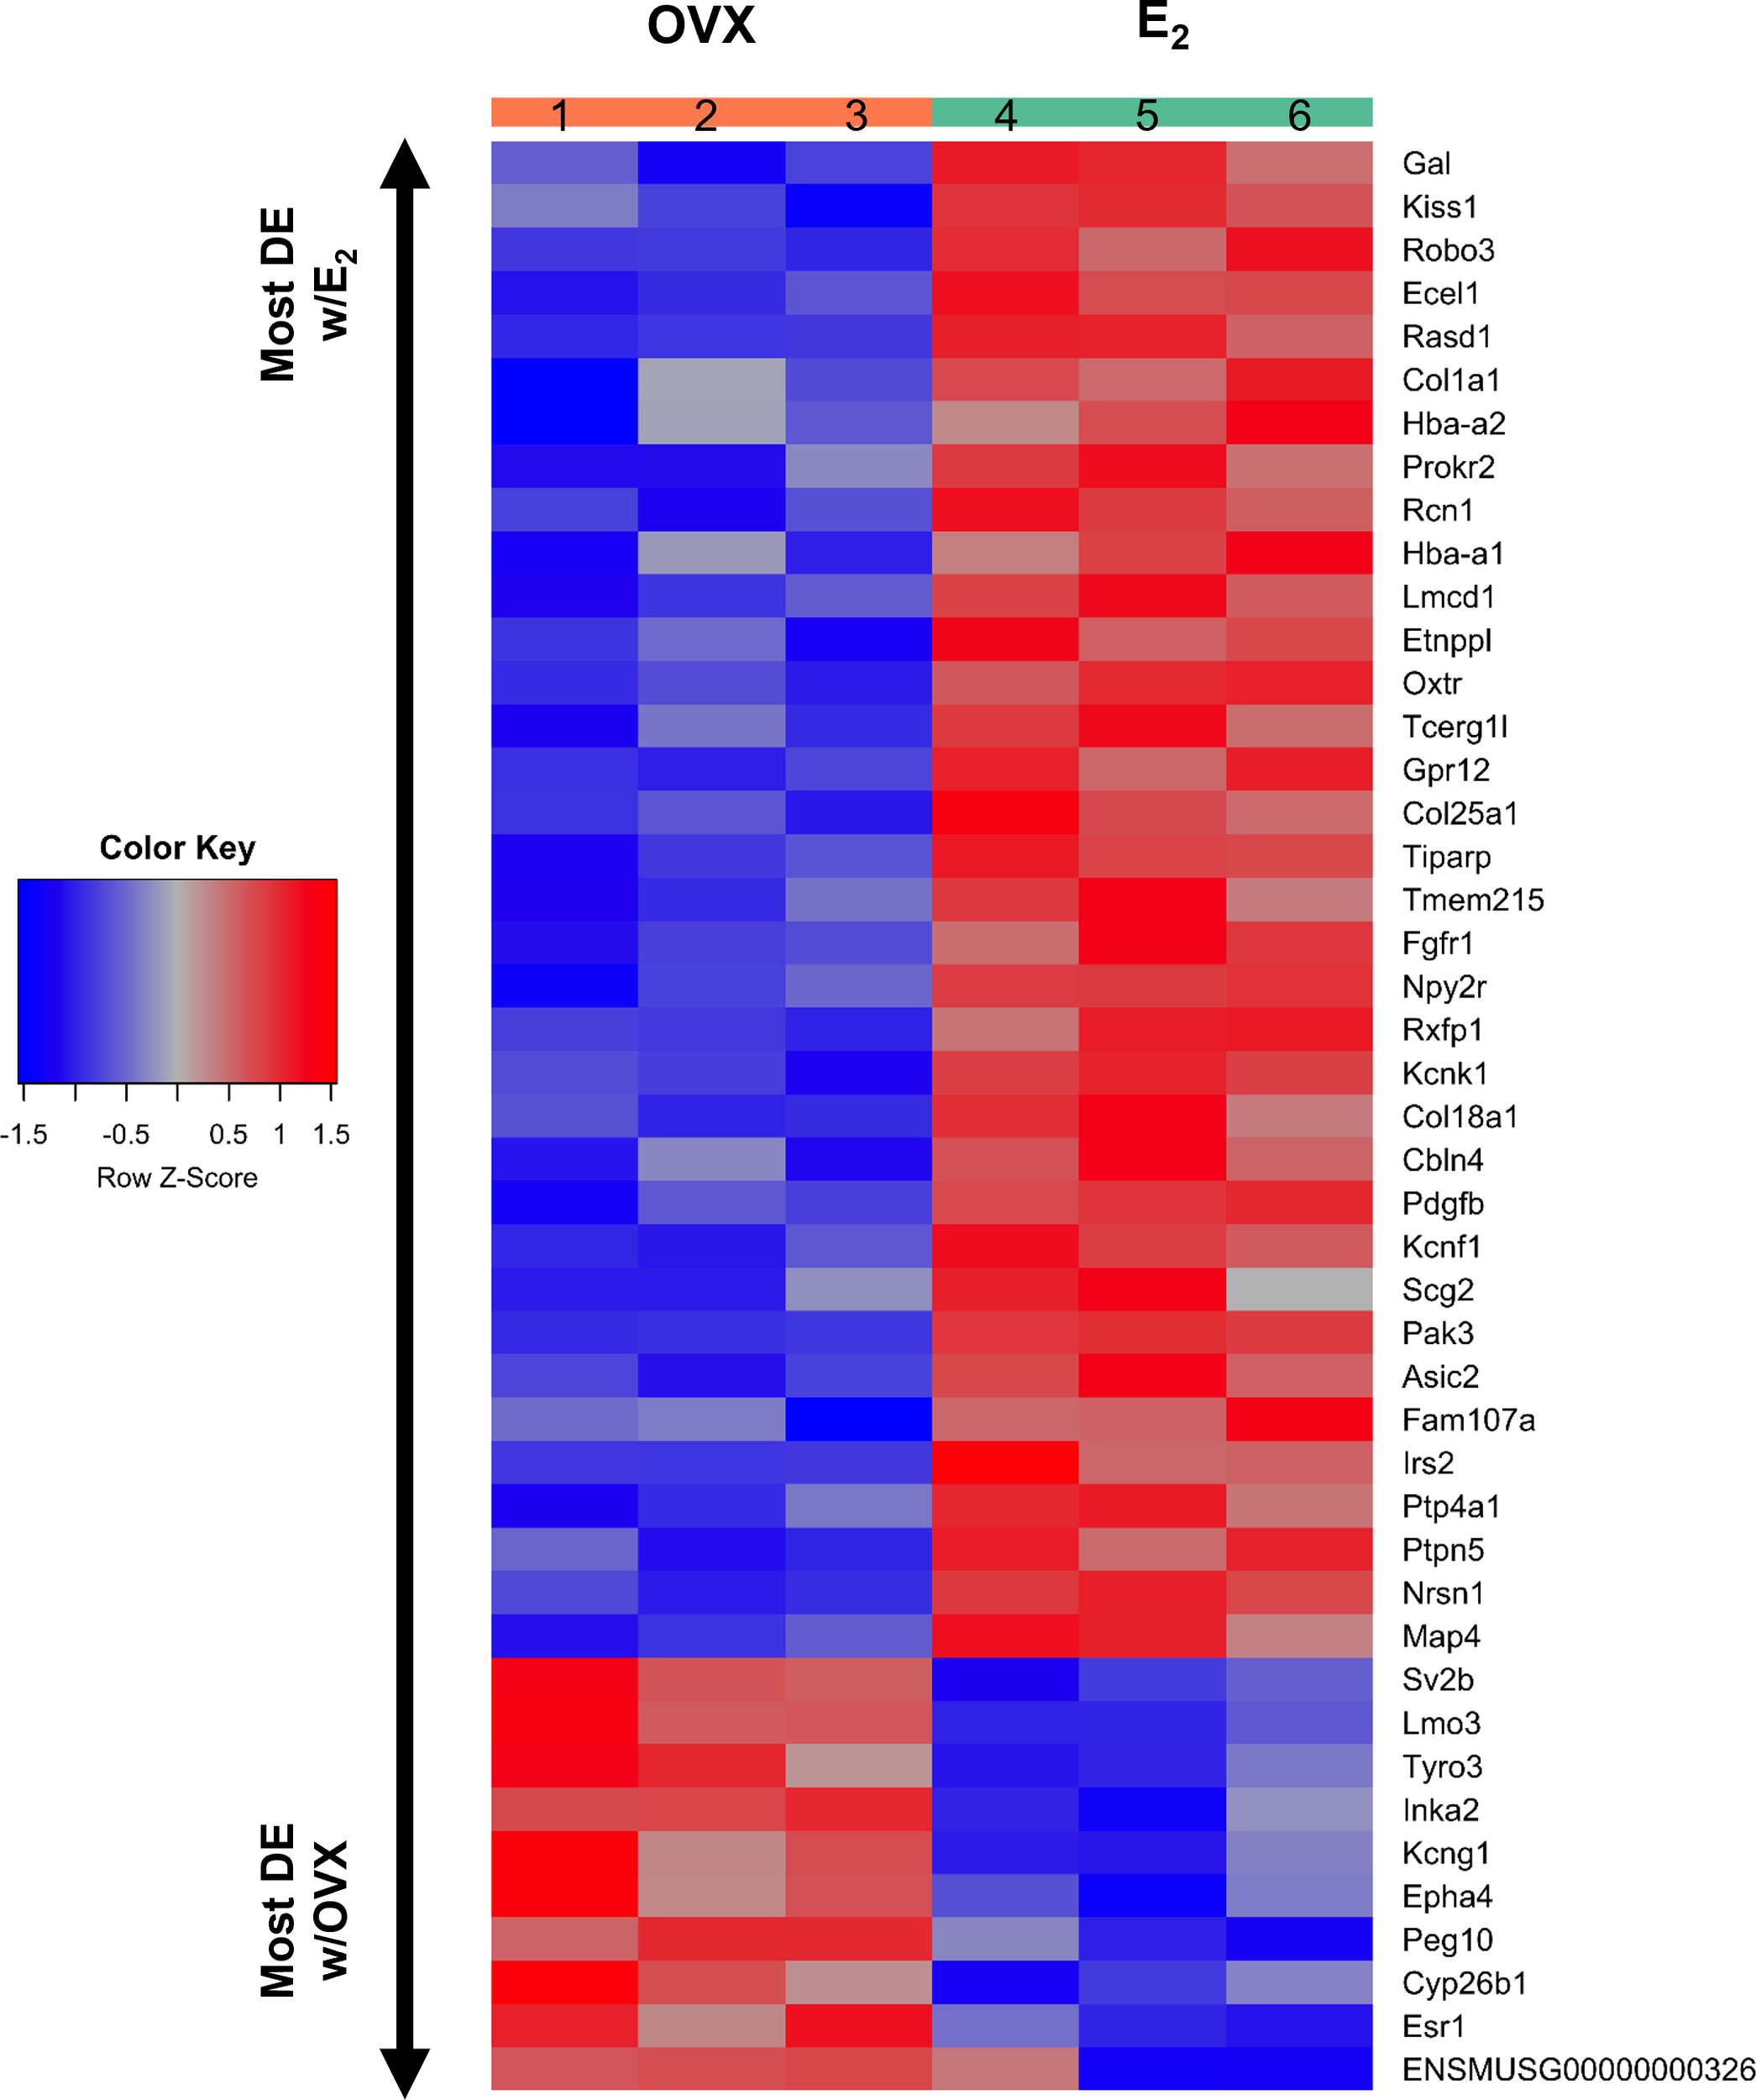
A heatmap of the 45 differentially expressed gene transcripts in MeA Kiss1 cells. Treatment conditions and pooled sample numbers are indicated at the top. Row Z-scores demonstrate the relationship between the expression level of that transcript in the sample in comparison to the total mean expression level of that transcript. Row Z-scores that are positive (red) indicate higher expression of a transcript in a sample, in comparison to the total mean expression of the transcript, whereas Row Z-scores that are negative (blue) represent lower expression of that transcript. 35 of the gene transcripts were upregulated by E2 treatment, whereas only 10 of the gene transcripts had greater expression levels in OVX females.
3.4 Biological KEGG pathways represented by gene transcripts present in MeA Kiss1 cells
Biological pathway analysis, using KEGG pathways (68), was completed to identify potential functions of MeA Kiss1 cells. Pathway analysis examines how sets of gene transcripts cluster together to affect various biological processes. The top biological KEGG pathways with the lowest false discovery rate (pGFdr) were identified (Table 5). These pathways involve signaling pathways, such as the MAPK signaling pathway, calcium signaling pathway, and neurotrophin signaling pathway. Other interesting pathways include pathways for amphetamine addiction and alcoholism, as well as those involved in regulating diseases, such as basal cell carcinoma and herpes simplex infection. There were no KEGG pathways identified that were significantly altered by E2 treatment.
Table 5
| Top 10 KEGG pathways (regardless of hormonal status) | |||
|---|---|---|---|
| Pathway Name | KEGG ID | # of pathway genes expressed in MeA Kiss1 cells | False discovery rate |
| Endocrine and other factor-regulated calcium reabsorption | 4961 | 40 | 0.00040 |
| Amphetamine addiction | 5031 | 61 | 0.00040 |
| Gastric acid secretion | 4971 | 60 | 0.00061 |
| Alcoholism | 5034 | 109 | 0.00061 |
| Focal adhesion | 4510 | 185 | 0.00061 |
| Glioma | 5214 | 60 | 0.00061 |
| ECM-receptor interaction | 4512 | 72 | 0.00061 |
| VEGF signaling pathway | 4370 | 63 | 0.00065 |
| Progesterone-mediated oocyte maturation | 4914 | 75 | 0.00065 |
| Prion diseases | 5020 | 25 | 0.00065 |
The top 10 biological KEGG pathways, regardless of estrogen status, represented by transcripts found in female MeA Kiss1 cells.
The pathways shown are sorted based on the false discovery rate (pGFdr) beginning with the lowest false discovery rate.
3.5 Validation of RNA-seq gene expression findings using double-label ISH/IHC
The RNA-seq data suggested that MeA Kiss1 cells express >13,800 gene transcripts, almost all of which have never been reported before for this specific Kiss1 population. Therefore, in addition to validating our immuno-pulldown procedure via RT-PCR (Figure 2), we performed double-label ISH/IHC on brains from female KisstdTom mice to confirm the co-expression of a gene identified in the RNA-seq dataset that was not previously known to be present in MeA Kiss1 neurons (Cartpt; Figure 5, Table 2). We found that Cartpt mRNA was highly expressed in MeA brain slices, including very high overlap with MeA kisspeptin cells (tdTomato fluorescence; Figure 5). Quantitatively, virtually all Kiss1TdTomato cells (99%) in the MeA expressed Cartpt in this ISH/IHC assay.
Figure 5
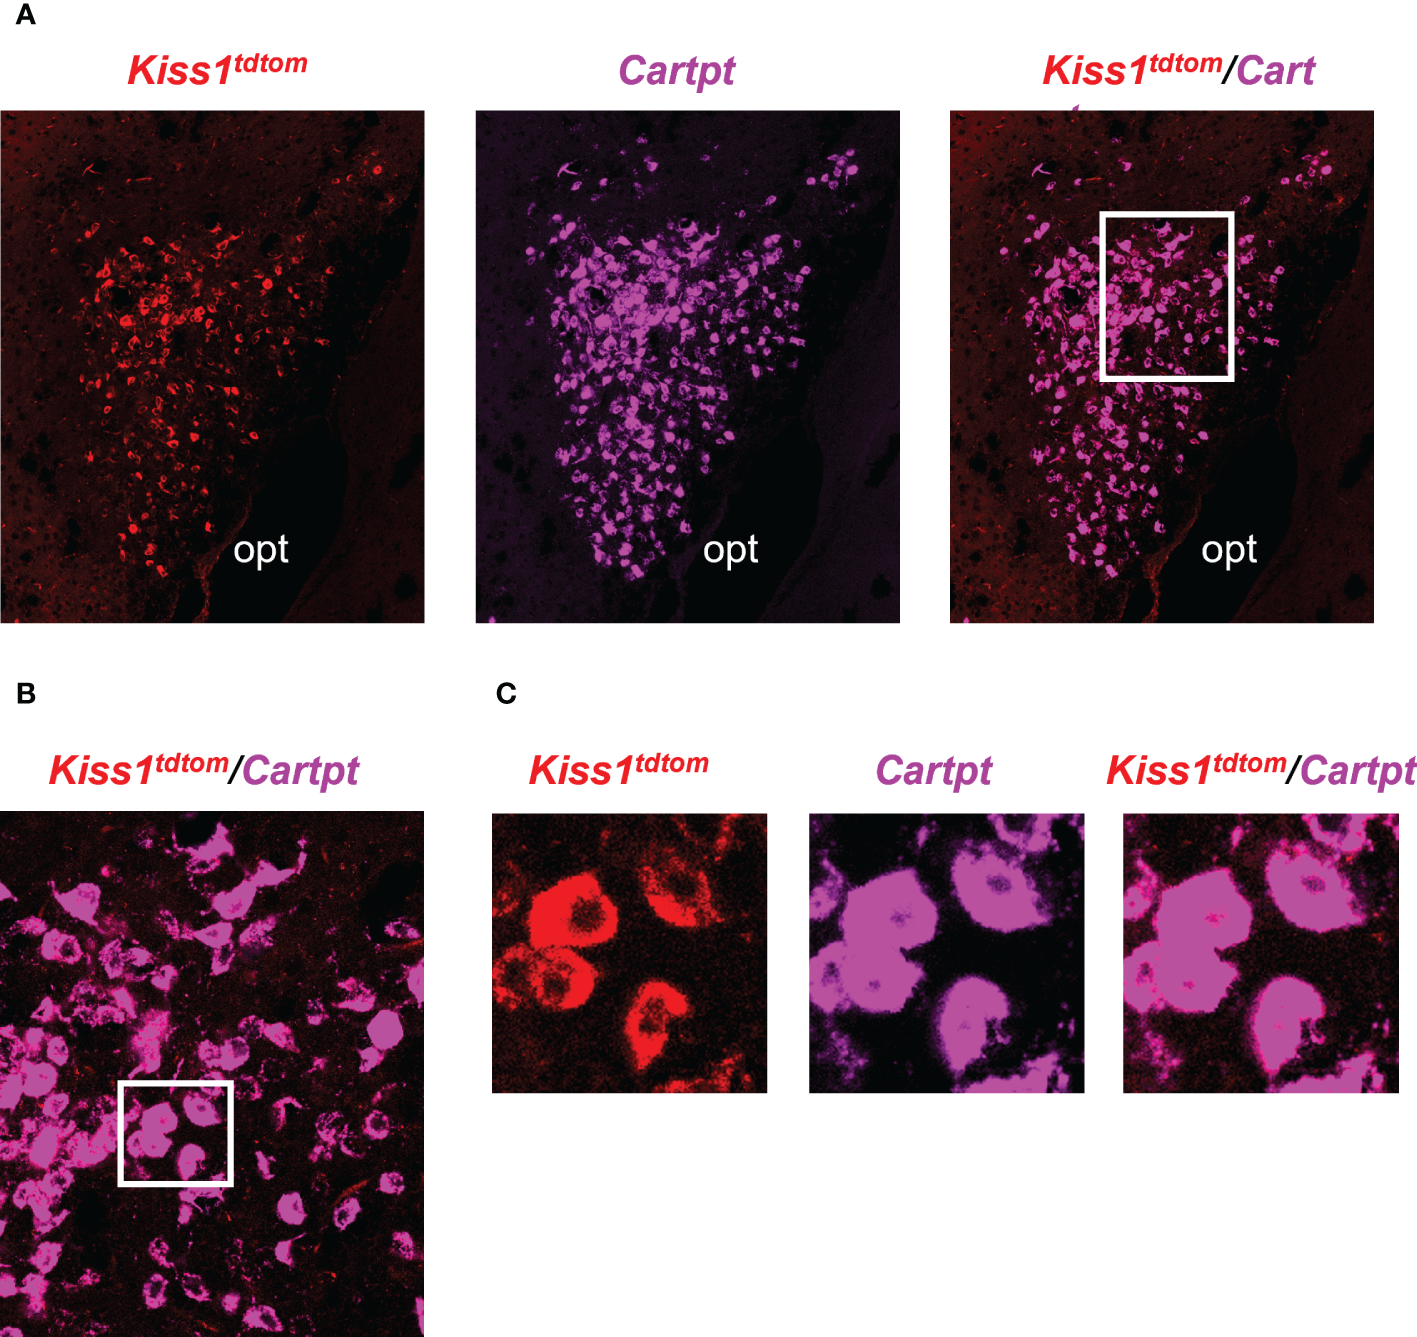
Double-label IHC/ISH of Kiss1TdTomato cells and Cartpt in the medial amygdala of an E2-treated female mouse. (A) A representative image of Kiss1TdTomato cells (red) and Cartpt (purple) of an E2-treated female mouse. (B, C) Higher magnification images of the area in the white box showing a high degree of Cartpt (purple) expression in Kiss1TdTomato cells (red). opt = optic tract.
4 Discussion
The MeA has been implicated in modulating numerous physiological and behavioral processes (32–44), including aspects of reproductive physiology. In females, lesions to the MeA disrupt ovarian cycles and prevent the E2-mediated LH surge, whereas acute electrical stimulation of the MeA stimulate LH release (34–37). However, the exact cellular and molecular mechanisms and specific cell types for these MeA effects on reproduction remain unknown. Kisspeptin is able to stimulate the reproductive axis, via direct action on GnRH neurons, but very little is known about the functions, reproductive or otherwise, of Kiss1 neurons in the MeA, or how these neurons are regulated. Recent studies have begun to examine the detailed molecular profiles of AVPV and ARC Kiss1 neurons, including identifying numerous gene transcripts in these populations that are regulated by E2 (25–27), but similar analyses have not been reported for other kisspeptin populations. In the current study, we use RNA-seq to examine the actively-translated transcripts of MeA Kiss1 neurons to identify, for the first time, what neuropeptides, signaling factors, and receptors these neurons produce.
In this study, we used the Ribotag technique to selectively isolate actively-translated mRNAs in MeA Kiss1 neurons. We first validated the success and specificity of this technique using RT-PCR. First, we found that both the Input (all cells in the MeA micropunch) and IP samples (only mRNAs from Kiss1 cells) were positive for Kiss1 mRNA from E2-treated females, as we would predict. Likewise, in OVX samples, Kiss1 was detected in both Input and IP samples as expected, with lower mRNA levels (lighter bands) than for E2 samples given that MeA Kiss1 expression is known to be stimulated by E2. The specificity of our technique was further confirmed by our samples from Cre- controls in which Kiss1 was present in the Input samples, as expected because they contain mRNA from all MeA cells in the micropunch including Kiss1 cells, but not in the IP samples. The lack of Kiss1 (and Cck) in the Cre- IP samples indicates that our Ribotag immuno-pulldown technique was specific to isolating mRNA from just Kiss1 cells in the micropunch. Our initial histological identification of Cck co-expression with Kiss1-TdTomato cells in the MeA (Figure 1) enabled us to use Cck as a positive control for MeA kisspeptin neurons in the RT-PCR validation step. Indeed, similar to Kiss1, we found that Cck mRNA was present in both Input and IP samples in E2-treated and OVX mice, with no Cck expression found in the IP samples of Cre- control mice, further supporting the specificity of the Ribotag technique. Knowing that Avp and Kiss1 are present in different regions of the MeA, we examined our Input and IP samples for the presence/absence of Avp as a negative control for kisspeptin cell transcripts. Whereas Input samples contained Avp mRNA, indicating its presence in the MeA region, no Avp was detected in any IP samples as we would predict if Avp is not expressed in Kiss1 cells. We also confirmed the co-expression of an RNAseq-identified gene in the Ribotag IP, Cartpt, in MeA kisspeptin neurons using histological assessment.
Our RNA-sequencing identified ~13,800 unique transcripts produced by MeA Kiss1 neurons. Most of the genes with the highest expression were for general cell maintenance, neuronal signaling, or protein synthesis and regulation. These results were further supported by the data regarding biological pathway analysis (KEGG pathways), which showed that many of the gene transcripts produced by MeA Kiss1 neurons are important for basic biological functions of neurons, such as the regulation of actin cytoskeleton, MAPK signaling pathway, and calcium signaling pathway, which are important processes for all cells, not just Kiss1 cells. Of interest, 2 of the 5 addiction pathways, amphetamine addiction and alcoholism, were represented in the top KEGG pathways, potentially because of the heavy involvement of dopamine, dynorphin, and glutamate in these pathways. Interestingly, many of the KEGG pathways identified for MeA Kiss1 cells were the same pathways identified for AVPV Kiss1 cells (25), which may suggest that some of these functions may be generalized to many cells in the brain and/or suggestive of undiscovered shared functions of Kiss1 neurons from several brain areas. We did not find any KEGG pathways that contained transcripts that were more represented in GDX or E2-treated mice. This result is not surprising given the low number of differentially expressed genes identified between the two hormone treatment groups, as discussed more below.
The mean expression analysis of gene transcripts in our dataset revealed >13,800 gene transcripts produced by MeA Kiss1 neurons, of which almost all are newly identified for this specific cell population. We identified genes for several neuropeptides found in other Kiss1 neuronal populations, such as Vgf, Penk, Tac1, Pdyn, Pnoc, and Gal, as well as several sex steroid receptors, Ar, Pgr, Esr1, and Esr2, though Esr2 levels were much lower than the other sex steroid receptors. The actions and targets of the identified neuropeptides co-expressed in MeA Kiss1 neurons remain unknown but may give clues into understanding the potential functions of these neurons. Interestingly, many of the identified neuropeptide genes, including the ones listed above, are also expressed in AVPV Kiss1 neurons (25, 27), and Kiss1 is upregulated by E2 in both the MeA and AVPV (13–15, 17, 18), which may indicate AVPV and MeA Kiss1 cells share some similar functions. The presence of Ar in MeA Kiss1 neurons is interesting because previous studies demonstrated that T or E2, but not DHT, can increase MeA Kiss1 expression (17). However, the MeA is a sexually dimorphic brain structure, both in anatomy and genes expressed (82–84), and this is hypothesized to be produced in part by androgen signaling. Thus, it may not be surprising that MeA Kiss1 cells (which have some sexually dimorphic qualities), express Ar, even if Kiss1 expression itself is not altered by AR signaling. Interestingly, we found that Cyp19a1, the gene encoding for aromatase, is not expressed in MeA Kiss1 cells, based on our current RNA-seq dataset, suggesting that the conversion of androgens to estrogens is occurring elsewhere. It is also possible that other gene transcripts in MeA Kiss1 neurons are regulated by AR signaling, even if the Kiss1 gene is not. Whether or not progesterone alters MeA Kiss1 expression remains unknown, but the importance of Pgr in these neurons could be interesting considering Pgr in Kiss1 cells is required for normal female fertility (52). Future research could evaluate whether Pgr specifically in MeA Kiss1 cells influences fertility. GABA signaling through GABABR is another proposed modulator of MeA Kiss1 expression (19), and previous ISH assays demonstrated that MeA Kiss1 neurons express GABABR mRNA (19, 20). Our present RNA-seq data support this finding as transcripts for both Gababr1 and Gababr2 subunits were highly expressed. Importantly, the expression of receptor transcripts by MeA Kiss1 cells does not automatically mean that the Kiss1 gene itself is regulated via activation of these receptors, as the receptor signaling may influence other genes or processes in these cells.
Surprisingly, only 45 of the 13,000+ gene transcripts produced by MeA Kiss1 neurons were found to be significantly regulated by E2 status, with a majority of these differentially expressed transcripts increasing with E2 treatment. This contrasts with AVPV Kiss1 cells in which 683 transcripts were altered by similar E2 treatment (25). Regardless, it is possible that some of these E2-senesitive transcripts in MeA Kiss1 neurons are involved in E2-regulated behavior and physiology, and future research can examine the roles of transcripts like Gal and Oxtr specifically in MeA Kiss1 neurons in such processes. It is unknown at present if E2’s effects on these 45 differentially expressed genes are due to E2 action directly or indirectly on MeA kisspeptin cells or via which ER subtype the effects are mediated. Supporting the possibility of some direct E2 regulation, our RNA-seq dataset indicated that MeA Kiss1 cells express Esr1 and, to a lesser degree, Esr2. However, some of the differential expression of gene transcripts may be due to indirect actions of E2 on other afferent cells that communicate with MeA kisspeptin neurons. Because so many transcripts were not differentially expressed with E2 treatment, it is possible that these MeA kisspeptin neurons have primary functions that are not dependent on E2 status. Future research might focus on the genes that were most highly expressed in these neurons (Tables 1–3) regardless of hormone status.
Recent studies by our group and Göcz and colleagues (2022) and have begun to examine the gene transcripts made by kisspeptin neurons in the murine AVPV (25) and ARC (26), respectively, and evaluated the role of E2 in regulating these gene transcripts (see Table 6 for a summary and comparison of these studies). In ARC kisspeptin neurons, 2,329 genes were found to be regulated by E2, with about an equal number of genes being upregulated vs downregulated by E2 (26). When these samples were analyzed differently with low-expressing genes removed, there were still 1,583 genes expressed by ARC kisspeptin neurons that were significantly altered by E2 treatment (27). In contrast to the ARC, kisspeptin neurons in the AVPV of the same mice only had 222 genes that were E2 regulated, with 142 of those genes being upregulated by E2 (27). Thus, more gene transcripts produced by ARC kisspeptin neurons appear to be responsive to E2 than in AVPV kisspeptin neurons. Our group previously examined gene transcripts made by female AVPV kisspeptin neurons using a different mouse model, E2 treatment paradigm, and RNA isolation techniques than used by Göcz and colleagues. In that prior study, we found a higher number of gene transcripts in AVPV kisspeptin neurons, 683 transcripts, that were regulated by E2 (25). It is possible the differences in isolation techniques (isolation from the ribosomes vs isolation from the entire kisspeptin neuron), E2 hormone treatment paradigms, or the parameters used to exclude low-expressing genes (summarized in Table 6) resulted in the different number of E2-regualted transcripts between these two AVPV studies. Despite these methodological differences, in both studies of AVPV kisspeptin neurons, more gene transcripts were upregulated by E2 than downregulated by E2, and over 50 of these gene transcripts that were E2 regulated were identified in both studies (25, 27). In the current study, we used the same mice and methodology as our prior AVPV study (25), and found that only 45 of >13,800 gene transcripts of MeA kisspeptin neurons were regulated by E2, with Kiss1 being one of them. Thus, our present data suggest that, in comparison to AVPV and ARC cells, most gene transcripts produced by MeA kisspeptin neurons are not sensitive to E2 and may be more strongly regulated by other signaling factors. Additional research is still needed to understand how MeA kisspeptin neurons are regulated, and the present RNA-seq dataset provides a starting point for such future research.
Table 6
| Mouse model | MeA | AVPV | ARC | |||
|---|---|---|---|---|---|---|
| Current Study | Stephens et al., 2021: Endocrinology | Göcz et al., 2022: Frontiers | Göcz et al., 2022: Frontiers | Göcz et al., 2022: PNAS | ||
| KissCre (Elias) x Ribotag mouse (HA tag on Rpl22 gene) | KissCre (Colledge) x ZsGreen mouse | |||||
| Hormone Treatment | All mice: OVX + 4 days E2 Silastic capsule (pre-treatment), E2 capsule removal & 1 wk washout; Treatment at collection: E2 mice receive another E2 Silastic capsule (5 days), OVX mice receive no capsule. | All mice: OVX for 9 days; Treatment at collection: 4 days Silastic E2 capsule or OVX (sac day 13) | ||||
| Brain dissection | Micropunch of MeA or AVPV regions | laser capture microdissection of kisspeptin cells | ||||
| RNA isolation | immunoprecipitation using HA+ antibody54; only isolates RNA from ribosomes in Kiss1 neurons | RNA extraction from entire kisspeptin neuron | ||||
| Samples | 4 mice pooled/sample; total of 3-4 pooled samples/hormone treatment | 300 kisspeptin cells/mouse, not pooled | ||||
| Library | Illumina mRNA unstranded library | TrueSeq Stranded Total RNA Library Preparation Gold kit (Illumina) | ||||
| RNA seq | Illumina HiSeq4000 | Illumina NextSeq500/550 High Output kit v2.5 | ||||
| Removal of low-expressing genes | CPM > 1 (comparative analysis); adjusted p-value | Basemean > 20 (comparative analysis); adjusted p-value | adjusted p-value | |||
| Total transcripts identified | ~13,800 | ~13,300 | 10623 | not stated | not stated | |
| # total genes regulated by E2 | 45 | 683* | 222* | 1583 | 2329 | |
| # genes up-regulated by E2 | 35 | 484 | 142 | not stated | 1190 | |
| # genes down-regulated by E2 | 10 | 199 | 80 | not stated | 1139 | |
| KEGG pathways significantly altered by E2 | 0 | 3 | not stated | not stated | 83 | |
A comparison of RNA-seq studies from the MeA, AVPV, and ARC kisspeptin neuron populations.
The mouse model, methodology, analysis, and results are compared between the current study and previous work looking in transcriptomics of kisspeptin neuron populations in female mice. *indicates over 50 of the same genes regulated by E2 were found in both AVPV studies.
The current RNA-seq data greatly expands upon the limited information regarding what signaling factors and receptors are produced by MeA Kiss1 neurons. We wanted to further validate our findings by performing an IHC/ISH for on a gene (Cartpt) identified for the first time by our RNAseq to be present in MeA kisspeptin neurons. This histological assay determined that virtually all of kisspeptin cells in the MeA region express Cartpt, supporting the very high expression levels of Cartpt in the RNA-seq dataset. At present, it is technically difficult to detect sufficient Kiss1 mRNA in the MeA using RNAscope methodology owing to lower levels of Kiss1 mRNA expressed per cell in this brain region than in the hypothalamus. One limitation in the current study is that the identification of MeA kisspeptin cells was achieved using a fluorescent reporter (TdTomato), instead of looking at actual Kiss1 mRNA expression. When more sensitive methodology becomes available, future research should examine MeA Kiss1 co-expression with other transcripts of interest identified in this RNA-seq dataset, to both confirm and better understand the co-expression of neuropeptides/receptors/enzymes and active Kiss1 expression.
In summary, the current dataset is the first large-scale examination of the identities of neuropeptides, receptors, and neurotransmitter-related genes produced by MeA Kiss1 cells. Other than being regulated by E2 and GABA, how Kiss1 in the MeA is regulated remains completely unknown. The current study identified additional receptor transcripts made by these kisspeptin neurons, which could drive future research directions on the regulation of these neurons and the Kiss1 gene itself. We also identified many neuropeptides and signaling factors not previously known to be produced by MeA Kiss1 neurons, some of which are implicated in MeA-influenced processes like reproduction and metabolism, along with transcripts important for basic cell maintenance and survival. Interestingly, while > 13,800 transcripts are made in these cells, only 45 transcripts were significantly regulated by E2. Whether and how this focused E2 regulation is related to these neurons’ functional roles remains to be determined. Very little is known about Kiss1 cells in the MeA and the current dataset therefore provides a valuable starting point for future research to examine the regulation and function of Kiss1 neurons in the MeA.
Statements
Data availability statement
The data presented in the study are deposited in the Gene Expression Omnibus data repository, accession number GSE224788.
Ethics statement
The animal study was reviewed and approved by IACUC committees at Albany Medical College and the University of California, San Diego.
Author contributions
The author contributions are as follows: experimental design (KMH, ASK, SBZS), data collection (KMH, LC, SBZS), data analysis (KMH, LC, ASK, SBZS), manuscript preparation and review (KMH, LC, ASK, SBZS). All authors contributed to the article and approved the submitted version.
Funding
This research was supported by NIH grants R01 HD090161, R01 HD100580, and P50 HD012303 to ASK and by NIH R00 HD092894 to SBZS. The University of Virginia Ligand Assay Core is supported by grant NIH R24HD102061. The Center for Computational Biology & Bioinformatics is funded through the Altman Clinical and Translational Research Institute (ACTRI) grant UL1TR001442. The UCSD IGM Genomics Center received support from NIH SIG grant S10 OD026929.
Acknowledgments
The authors thank Adriana Esparza, Paige Steffen, and Ruby Parra for general lab assistance and Chanond Nasamran of the CCBB for assistance with RNA-seq data analysis.
Conflict of interest
The authors declare that the research was conducted in the absence of any commercial or financial relationships that could be construed as a potential conflict of interest.
Publisher’s note
All claims expressed in this article are solely those of the authors and do not necessarily represent those of their affiliated organizations, or those of the publisher, the editors and the reviewers. Any product that may be evaluated in this article, or claim that may be made by its manufacturer, is not guaranteed or endorsed by the publisher.
References
1
SeminaraSBMessagerSChatzidakiEEThresherRRAciernoJSJr.ShagouryJKet al. The GPR54 gene as a regulator of puberty. N Engl J Med (2003) 349(17):1614–27. doi: 10.1056/NEJMoa035322
2
TopalogluAKTelloJAKotanLDOzbekMNYilmazMBErdoganSet al. Inactivating KISS1 mutation and hypogonadotropic hypogonadism. N Engl J Med (2012) 366(7):629–35. doi: 10.1056/NEJMoa1111184
3
LapattoRPallaisJCZhangDChanYMMahanACerratoFet al. Kiss1-/- mice exhibit more variable hypogonadism than Gpr54-/- mice. Endocrinology (2007) 148(10):4927–36. doi: 10.1210/en.2007-0078
4
DhilloWSChaudhriOBPattersonMThompsonELMurphyKGBadmanMKet al. Kisspeptin-54 stimulates the hypothalamic-pituitary gonadal axis in human males. J Clin Endocrinol Metab (2005) 90(12):6609–15. doi: 10.1210/jc.2005-1468
5
NavarroVMCastellanoJMFernandez-FernandezRTovarSRoaJMayenAet al. Characterization of the potent luteinizing hormone-releasing activity of KiSS-1 peptide, the natural ligand of GPR54. Endocrinology (2005) 146(1):156–63. doi: 10.1210/en.2004-0836
6
NavarroVMCastellanoJMFernandez-FernandezRTovarSRoaJMayenAet al. Effects of KiSS-1 peptide, the natural ligand of GPR54, on follicle-stimulating hormone secretion in the rat. Endocrinology (2005) 146(4):1689–97. doi: 10.1210/en.2004-1353
7
ShahabMMastronardiCSeminaraSBCrowleyWFOjedaSRPlantTM. Increased hypothalamic GPR54 signaling: a potential mechanism for initiation of puberty in primates. Proc Natl Acad Sci U.S.A. (2005) 102(6):2129–34. doi: 10.1073/pnas.0409822102
8
GottschMLCunninghamMJSmithJTPopaSMAcohidoBVCrowleyWFet al. A role for kisspeptins in the regulation of gonadotropin secretion in the mouse. Endocrinology (2004) 145(9):4073–7. doi: 10.1210/en.2004-0431
9
IrwigMSFraleyGSSmithJTAcohidoBVPopaSMCunninghamMJet al. Kisspeptin activation of gonadotropin releasing hormone neurons and regulation of KiSS-1 mRNA in the male rat. Neuroendocrinology (2004) 80(4):264–72. doi: 10.1159/000083140
10
MessagerSChatzidakiEEMaDHendrickAGZahnDDixonJet al. Kisspeptin directly stimulates gonadotropin-releasing hormone release via G protein-coupled receptor 54. Proc Natl Acad Sci U.S.A. (2005) 102(5):1761–6. doi: 10.1073/pnas.0409330102
11
d'Anglemont de TassignyXFaggLACarltonMBColledgeWH. Kisspeptin can stimulate gonadotropin-releasing hormone (GnRH) release by a direct action at GnRH nerve terminals. Endocrinology (2008) 149(8):3926–32. doi: 10.1210/en.2007-1487
12
FranceschiniILometDCateauMDelsolGTilletYCaratyA. Kisspeptin immunoreactive cells of the ovine preoptic area and arcuate nucleus co-express estrogen receptor alpha. Neurosci Lett (2006) 401(3):225–30. doi: 10.1016/j.neulet.2006.03.039
13
SmithJTDunganHMStollEAGottschMLBraunREEackerSMet al. Differential regulation of KiSS-1 mRNA expression by sex steroids in the brain of the male mouse. Endocrinology (2005) 146(7):2976–84. doi: 10.1210/en.2005-0323
14
SmithJTCunninghamMJRissmanEFCliftonDKSteinerRA. Regulation of Kiss1 gene expression in the brain of the female mouse. Endocrinology (2005) 146(9):3686–92. doi: 10.1210/en.2005-0488
15
KauffmanASGottschMLRoaJByquistACCrownACliftonDKet al. Sexual differentiation of Kiss1 gene expression in the brain of the rat. Endocrinology (2007) 148(4):1774–83. doi: 10.1210/en.2006-1540
16
KimWJessenHMAugerAPTerasawaE. Postmenopausal increase in KiSS-1, GPR54, and luteinizing hormone releasing hormone (LHRH-1) mRNA in the basal hypothalamus of female rhesus monkeys. Peptides (2009) 30(1):103–10. doi: 10.1016/j.peptides.2008.06.005
17
KimJSemaanSJCliftonDKSteinerRADhamijaSKauffmanAS. Regulation of Kiss1 expression by sex steroids in the amygdala of the rat and mouse. Endocrinology (2011) 152(5):2020–30. doi: 10.1210/en.2010-1498
18
StephensSBChahalNMunaganuruNParraRAKauffmanAS. Estrogen stimulation of Kiss1 expression in the medial amygdala involves estrogen receptor-alpha but not estrogen receptor-beta. Endocrinology (2016) 157(10):4021–31. doi: 10.1210/en.2016-1431
19
Di GiorgioNPSemaanSJKimJLopezPVBettlerBLibertunCet al. Impaired GABAB receptor signaling dramatically up-regulates Kiss1 expression selectively in nonhypothalamic brain regions of adult but not prepubertal mice. Endocrinology (2014) 155(3):1033–44. doi: 10.1210/en.2013-1573
20
StephensSBZDi GiorgioNPLiawRBParraRAYangJAChahalNet al. Estradiol-dependent and -independent stimulation of Kiss1 expression in the amygdala, BNST, and lateral septum of mice. Endocrinology (2018) 159(9):3389–402. doi: 10.1210/en.2018-00583
21
HerbisonAE. Estrogen positive feedback to gonadotropin-releasing hormone (GnRH) neurons in the rodent: the case for the rostral periventricular area of the third ventricle (RP3V). Brain Res Rev (2008) 57(2):277–87. doi: 10.1016/j.brainresrev.2007.05.006
22
KauffmanAS. Neuroendocrine mechanisms underlying estrogen positive feedback and the LH surge. Front Neurosci (2022) 16:953252. doi: 10.3389/fnins.2022.953252
23
RoaJVigoECastellanoJMGaytanFNavarroVMAguilarEet al. Opposite roles of estrogen receptor (ER)-alpha and ERbeta in the modulation of luteinizing hormone responses to kisspeptin in the female rat: implications for the generation of the preovulatory surge. Endocrinology (2008) 149(4):1627–37. doi: 10.1210/en.2007-1540
24
DuboisSLAcosta-MartinezMDeJosephMRWolfeARadovickSBoehmUet al. Positive, but not negative feedback actions of estradiol in adult female mice require estrogen receptor alpha in kisspeptin neurons. Endocrinology (2015) 156(3):1111–20. doi: 10.1210/en.2014-1851
25
StephensSBZKauffmanAS. Estrogen regulation of the molecular phenotype and active translatome of AVPV kisspeptin neurons. Endocrinology (2021) 162(9):1–20. doi: 10.1210/endocr/bqab080
26
GoczBRumplerESarvariMSkrapitsKTakacsSFarkasIet al. Transcriptome profiling of kisspeptin neurons from the mouse arcuate nucleus reveals new mechanisms in estrogenic control of fertility. Proc Natl Acad Sci U.S.A. (2022) 119(27):e2113749119. doi: 10.1073/pnas.2113749119
27
GoczBTakacsSSkrapitsKRumplerESolymosiNPoliskaSet al. Estrogen differentially regulates transcriptional landscapes of preoptic and arcuate kisspeptin neuron populations. Front Endocrinol (Lausanne) (2022) 13:960769. doi: 10.3389/fendo.2022.960769
28
XuZKagaSMochidukiATsubomizuJAdachiSSakaiTet al. Immunocytochemical localization of kisspeptin neurons in the rat forebrain with special reference to sexual dimorphism and interaction with GnRH neurons. Endocr J (2012) 59(2):161–71. doi: 10.1507/endocrj.EJ11-0193
29
ShinodaKMoriSOhtsukiTOsawaY. An aromatase-associated cytoplasmic inclusion, the "stigmoid body," in the rat brain: I. distribution in the forebrain. J Comp Neurol (1992) 322(3):360–76. doi: 10.1002/cne.903220306
30
WagnerCKMorrellJI. Distribution and steroid hormone regulation of aromatase mRNA expression in the forebrain of adult male and female rats: a cellular-level analysis using in situ hybridization. J Comp Neurol (1996) 370(1):71–84. doi: 10.1002/(SICI)1096-9861(19960617)370:1<71::AID-CNE7>3.0.CO;2-I
31
StanicDDuboisSChuaHKTongeBRinehartNHorneMKet al. Characterization of aromatase expression in the adult Male and female mouse brain. i. coexistence with oestrogen receptors alpha and beta, and androgen receptors. PloS One (2014) 9(3):e90451. doi: 10.1371/journal.pone.0090451
32
MarasPMPetrulisA. Anatomical connections between the anterior and posterodorsal sub-regions of the medial amygdala: integration of odor and hormone signals. Neuroscience (2010) 170(2):610–22. doi: 10.1016/j.neuroscience.2010.06.075
33
MarasPMPetrulisA. Chemosensory and steroid-responsive regions of the medial amygdala regulate distinct aspects of opposite-sex odor preference in male Syrian hamsters. Eur J Neurosci (2006) 24(12):3541–52. doi: 10.1111/j.1460-9568.2006.05216.x
34
BeltraminoCTaleisnikS. Facilitatory and inhibitory effects of electrochemical stimulation of the amygdala on the release of luteinizing hormone. Brain Res (1978) 144(1):95–107. doi: 10.1016/0006-8993(78)90437-7
35
ChateauDKauffmannMTAronC. Are the amygdaloid projections to the hypothalamic ventromedial nucleus involved in estrous rhythm regulation in the female rat? Exp Clin Endocrinol (1984) 83(3):303–9. doi: 10.1055/s-0029-1210345
36
VelascoMETaleisnikS. Effects of the interruption of amygdaloid and hippocampal afferents to the medial hypothalmus on gonadotrophin release. J Endocrinol (1971) 51(1):41–55. doi: 10.1677/joe.0.0510041
37
TylerJLGorskiRA. Effects of corticomedial amydgala lesions or olfactory bulbectomy on LH responses to ovarian steroids in the female rat. Biol Reprod (1980) 22(4):927–34. doi: 10.1095/biolreprod22.4.927
38
HuMHBashirZLiXFO'ByrneKT. Posterodorsal medial amygdala mediates tail-pinch induced food intake in female rats. J Neuroendocrinol (2016) 28(5):1–7. doi: 10.1111/jne.12390
39
AdekunbiDALiXFLassGShettyKAdegokeOAYeoSHet al. Kisspeptin neurones in the posterodorsal medial amygdala modulate sexual partner preference and anxiety in male mice. J Neuroendocrinol (2018) 30(3):e12572. doi: 10.1111/jne.12572
40
WangYHeZZhaoCLiL. Medial amygdala lesions modify aggressive behavior and immediate early gene expression in oxytocin and vasopressin neurons during intermale exposure. Behav Brain Res (2013) 245:42–9. doi: 10.1016/j.bbr.2013.02.002
41
LymerJMSheppardPASKuunTBlackmanAJaniNMahbubSet al. Estrogens and their receptors in the medial amygdala rapidly facilitate social recognition in female mice. Psychoneuroendocrinology (2018) 89:30–8. doi: 10.1016/j.psyneuen.2017.12.021
42
EbnerKRupniakNMSariaASingewaldN. Substance p in the medial amygdala: emotional stress-sensitive release and modulation of anxiety-related behavior in rats. Proc Natl Acad Sci U.S.A. (2004) 101(12):4280–5. doi: 10.1073/pnas.0400794101
43
FeketeEMZhaoYLiCSabinoVValeWWZorrillaEP. Social defeat stress activates medial amygdala cells that express type 2 corticotropin-releasing factor receptor mRNA. Neuroscience (2009) 162(1):5–13. doi: 10.1016/j.neuroscience.2009.03.078
44
PinedaRTorresETena-SempereM. Extrahypothalamic control of energy balance and its connection with reproduction: Roles of the amygdala. Metabolites (2021) 11(12):1–12. doi: 10.3390/metabo11120837
45
BurchanowskiBJSternbergerLA. Improved visualization of luteinizing hormone releasing hormone pathways by immunocytochemical staining of thick vibratome sections. J Histochem Cytochem (1980) 28(4):361–3. doi: 10.1177/28.4.6989900
46
UsunoffKGSchmittOItzevDEHaasSJLazarovNERolfsAet al. Efferent projections of the anterior and posterodorsal regions of the medial nucleus of the amygdala in the mouse. Cells Tissues Organs (2009) 190(5):256–85. doi: 10.1159/000209233
47
WheatonJEKrulichLMcCannSM. Localization of luteinizing hormone-releasing hormone in the preoptic area and hypothalamus of the rat using radioimmunoassay. Endocrinology (1975) 97(1):30–8. doi: 10.1210/endo-97-1-30
48
KauffmanASSunYKimJKhanARShuJNeal-PerryG. Vasoactive intestinal peptide modulation of the steroid-induced LH surge involves kisspeptin signaling in young but not in middle-aged female rats. Endocrinology (2014) 155(6):2222–32. doi: 10.1210/en.2013-1793
49
LassGLiXFBurghRAHeWKangYHwa-YeoSet al. Optogenetic stimulation of kisspeptin neurones within the posterodorsal medial amygdala increases luteinising hormone pulse frequency in female mice. J Neuroendocrinol (2020) 32(2):e12823. doi: 10.1111/jne.12823
50
LassGLiXFVoliotisMWallEBurghRAIvanovaDet al. GnRH pulse generator frequency is modulated by kisspeptin and GABA-glutamate interactions in the posterodorsal medial amygdala in female mice. J Neuroendocrinol (2022) p:e13207. doi: 10.1111/jne.13207
51
AggarwalSTangCSingKKimHWMillarRPTelloJA. Medial amygdala Kiss1 neurons mediate female pheromone stimulation of luteinizing hormone in Male mice. Neuroendocrinology (2019) 108(3):172–89. doi: 10.1159/000496106
52
StephensSBTolsonKPRouseMLJrPolingMCHashimoto-PartykaMKet al. Absent progesterone signaling in kisspeptin neurons disrupts the LH surge and impairs fertility in female mice. Endocrinology (2015) 156(9):3091–7. doi: 10.1210/en.2015-1300
53
LuoEStephensSBChaingSMunaganuruNKauffmanASBreenKM. Corticosterone blocks ovarian cyclicity and the LH surge via decreased kisspeptin neuron activation in female mice. Endocrinology (2016) 157(3):1187–99. doi: 10.1210/en.2015-1711
54
SanzEYangLSuTMorrisDRMcKnightGSAmieuxPS. Cell-type-specific isolation of ribosome-associated mRNA from complex tissues. Proc Natl Acad Sci U.S.A. (2009) 106(33):13939–44. doi: 10.1073/pnas.0907143106
55
SanzEYangLSuTMorrisDRMcKnightGSAmieuxPS. Cell-type-specific proteomics in the in vivo mouse brain. Nat Methods (2018) 15(2):100–0. doi: 10.1038/nbt.4056
56
SanzEBeanJCCareyDPQuintanaAMcKnightGS. RiboTag: Ribosomal tagging strategy to analyze cell-Type-Specific mRNA expression in vivo. Curr Protoc Neurosci (2019) 88(1):e77. doi: 10.1002/cpns.77
57
CravoRMMargathoLOOsborne-LawrenceSDonatoJJrAtkinSBookoutALet al. Characterization of Kiss1 neurons using transgenic mouse models. Neuroscience (2011) 173:37–56. doi: 10.1016/j.neuroscience.2010.11.022
58
MadisenLZwingmanTASunkinSMOhSWZariwalaHAGuHet al. A robust and high-throughput cre reporting and characterization system for the whole mouse brain. Nat Neurosci (2010) 13(1):133–40. doi: 10.1038/nn.2467
59
SimmonsDAYahrP. Distribution of catecholaminergic and peptidergic cells in the gerbil medial amygdala, caudal preoptic area and caudal bed nuclei of the stria terminalis with a focus on areas activated at ejaculation. J Chem Neuroanat (2011) 41(1):13–9. doi: 10.1016/j.jchemneu.2010.10.005
60
HollandKLNorbyLAMicevychPE. Peripubertal ontogeny and estrogen stimulation of cholecystokinin and preproenkephalin mRNA in the rat hypothalamus and limbic system. J Comp Neurol (1998) 392(1):48–57. doi: 10.1002/(SICI)1096-9861(19980302)392:1<48::AID-CNE4>3.0.CO;2-P
61
RoodBDMurrayEKLarocheJYangMKBlausteinJDVries DeGJ. Absence of progestin receptors alters distribution of vasopressin fibers but not sexual differentiation of vasopressin system in mice. Neuroscience (2008) 154(3):911–21. doi: 10.1016/j.neuroscience.2008.03.087
62
HuberWCareyVJGentlemanRAndersSCarlsonMCarvalhoBSet al. Orchestrating high-throughput genomic analysis with bioconductor. Nat Methods (2015) 12(2):115–21. doi: 10.1038/nmeth.3252
63
Development Core TeamR. R: A language and environment for statistical computing. Vienna, Austria: R Foundation for Statistical Computing (2016).
64
RitchieMEPhipsonBWuDHuYLawCWShiWet al. Limma powers differential expression analyses for RNA-sequencing and microarray studies. Nucleic Acids Res (2015) 43(7):e47. doi: 10.1093/nar/gkv007
65
LawCWChenYShiWSmythGK. Voom: Precision weights unlock linear model analysis tools for RNA-seq read counts. Genome Biol (2014) 15(2):R29. doi: 10.1186/gb-2014-15-2-r29
66
PhipsonBLeeSMajewskiIJAlexanderWSSmythGK. Robust hyperparameter estimation protects against hypervariable genes and improves power to detect differential expression. Ann Appl Stat (2016) 10(2):946–63. doi: 10.1214/16-AOAS920
67
WangJVasaikarSShiZGreerMZhangB. WebGestalt 2017: a more comprehensive, powerful, flexible and interactive gene set enrichment analysis toolkit. Nucleic Acids Res (2017) 45(W1):W130–7. doi: 10.1093/nar/gkx356
68
KanehisaMGotoSKawashimaSOkunoYHattoriM. The KEGG resource for deciphering the genome. Nucleic Acids Res (2004) 32(Database issue):D277–80. doi: 10.1093/nar/gkh063
69
LuoWBrouwerC. Pathview: an R/Bioconductor package for pathway-based data integration and visualization. Bioinformatics (2013) 29(14):1830–1. doi: 10.1093/bioinformatics/btt285
70
EdgarRDomrachevMLashAE. Gene expression omnibus: NCBI gene expression and hybridization array data repository. Nucleic Acids Res (2002) 30(1):207–10. doi: 10.1093/nar/30.1.207
71
BenjaminiYHochbergY. Controlling the false discovery rate - a practical and powerful approach to multiple testing. J R Stat Soc Ser B-Statistical Method (1995) 57(1):289–300. doi: 10.1111/j.2517-6161.1995.tb02031.x
72
DodeCLevilliersJDupontJMDe PaepeADu LeNSoussi-YanicostasNet al. Loss-of-function mutations in FGFR1 cause autosomal dominant kallmann syndrome. Nat Genet (2003) 33(4):463–5. doi: 10.1038/ng1122
73
DodeCTeixeiraLLevilliersJFouveautCBouchardPKottlerMLet al. Kallmann syndrome: mutations in the genes encoding prokineticin-2 and prokineticin receptor-2. PloS Genet (2006) 2(10):e175. doi: 10.1371/journal.pgen.0020175
74
FeugangJMRodriguez-MunozJCDillardDSCrenshawMAWillardSTRyanPL. Beneficial effects of relaxin on motility characteristics of stored boar spermatozoa. Reprod Biol Endocrinol (2015) 13:24. doi: 10.1186/s12958-015-0021-4
75
MarshallSASenadheeraSNParryLJGirlingJE. The role of relaxin in normal and abnormal uterine function during the menstrual cycle and early pregnancy. Reprod Sci (2017) 24(3):342–54. doi: 10.1177/1933719116657189
76
BottomleyWESoosMAAdamsCGuranTHowlettTAMackieAet al. IRS2 variants and syndromes of severe insulin resistance. Diabetologia (2009) 52(6):1208–11. doi: 10.1007/s00125-009-1345-4
77
CampbellCDLyonHNNemeshJDrakeJATuomiTGaudetDet al. Association studies of BMI and type 2 diabetes in the neuropeptide y pathway: a possible role for NPY2R as a candidate gene for type 2 diabetes in men. Diabetes (2007) 56(5):1460–7. doi: 10.2337/db06-1051
78
ChenGBentleyAAdeyemoAShrinerDZhouJDoumateyAet al. Genome-wide association study identifies novel loci association with fasting insulin and insulin resistance in African americans. Hum Mol Genet (2012) 21(20):4530–6. doi: 10.1093/hmg/dds282
79
HuangLGuoJXieYZhouYWuXLiHet al. Clinical features and genotypes of six patients from four families with horizontal gaze palsy with progressive scoliosis. Front Pediatr (2022) 10:949565. doi: 10.3389/fped.2022.949565
80
ZhouZHSongJWLiWLiuXCaoLWanLMet al. The acid-sensing ion channel, ASIC2, promotes invasion and metastasis of colorectal cancer under acidosis by activating the calcineurin/NFAT1 axis. J Exp Clin Cancer Res (2017) 36(1):130. doi: 10.1186/s13046-017-0599-9
81
KeSLiuZWangQZhaiGShaoHYuXet al. FAM107A inactivation associated with promoter methylation affects prostate cancer progression through the FAK/PI3K/AKT pathway. Cancers (Basel) (2022) 14(16):1–20. doi: 10.3390/cancers14163915
82
MatosHYHernandez-PinedaDCharpentierCMRuskACorbinJGJonesKS. Sex differences in biophysical signatures across molecularly defined medial amygdala neuronal subpopulations. eNeuro (2020) 7(4):1–15. doi: 10.1523/ENEURO.0035-20.2020
83
CookeBMStokasMRWoolleyCS. Morphological sex differences and laterality in the prepubertal medial amygdala. J Comp Neurol (2007) 501(6):904–15. doi: 10.1002/cne.21281
84
ChenPBHuRKWuYEPanLHuangSMicevychPEet al. Sexually dimorphic control of parenting behavior by the medial amygdala. Cell (2019) 176(5):1206–1221.e18. doi: 10.1016/j.cell.2019.01.024
Summary
Keywords
kisspeptin, KISS1, GnRH, amygdala, estrogen, Cck, RiboTag, RNAseq
Citation
Hatcher KM, Costanza L, Kauffman AS and Stephens SBZ (2023) The molecular phenotype of kisspeptin neurons in the medial amygdala of female mice. Front. Endocrinol. 14:1093592. doi: 10.3389/fendo.2023.1093592
Received
09 November 2022
Accepted
13 January 2023
Published
10 February 2023
Volume
14 - 2023
Edited by
Ali Abbara, Imperial College London, United Kingdom
Reviewed by
Stephanie Constantin, Eunice Kennedy Shriver National Institute of Child Health and Human Development (NIH), United States; Alejandro Lomniczi, Oregon Health & Science University, United States
Updates
Copyright
© 2023 Hatcher, Costanza, Kauffman and Stephens.
This is an open-access article distributed under the terms of the Creative Commons Attribution License (CC BY). The use, distribution or reproduction in other forums is permitted, provided the original author(s) and the copyright owner(s) are credited and that the original publication in this journal is cited, in accordance with accepted academic practice. No use, distribution or reproduction is permitted which does not comply with these terms.
*Correspondence: Shannon B. Z. Stephens, stephes3@amc.edu
This article was submitted to Translational Endocrinology, a section of the journal Frontiers in Endocrinology
Disclaimer
All claims expressed in this article are solely those of the authors and do not necessarily represent those of their affiliated organizations, or those of the publisher, the editors and the reviewers. Any product that may be evaluated in this article or claim that may be made by its manufacturer is not guaranteed or endorsed by the publisher.