Abstract
Background:
Thyroid dysfunction is common in patients with kidney disease. However, the relationship between thyroid dysfunction and idiopathic membranous nephropathy (IMN) remains unclear. This retrospective study aimed to investigate the clinicopathological characteristics and prognosis of patients with IMN and thyroid dysfunction compared to patients with IMN and without thyroid dysfunction.
Methods:
A total of 1052 patients with IMN diagnosed by renal biopsy were enrolled in this study, including 736 (70%) with normal thyroid function and 316 (30%) with abnormal thyroid function. We analyzed the clinicopathological features and prognostic data between the two groups, using propensity score matching (PSM) to reduce the bias. Logistic regression analysis was performed to investigate the risk factors for IMN combined with thyroid dysfunction. Kaplan-Meier curves and Cox regression analysis were used to evaluate the association between thyroid dysfunction and IMN.
Results:
Patients with IMN and thyroid dysfunction exhibited more severe clinical features. Female sex, lower albumin level, higher D-dimer level, severe proteinuria, and decreased estimated glomerular filtration rate were predictors of thyroid dysfunction in patients with IMN. After PSM, 282 pairs were successfully matched. Results from the Kaplan-Meier curves indicated that the thyroid dysfunction group had a lower complete remission rate (P = 0.044), higher relapse rate (P < 0.001), and lower renal survival rate (P = 0.004). The multivariate Cox regression analysis revealed that thyroid dysfunction was an independent risk factor for complete remission [hazard ratio (HR) = 0.810, P = 0.045], relapse (HR = 1.721, P = 0.001), and composite endpoint event (HR = 2.113, P = 0.014) in IMN.
Conclusions:
Thyroid dysfunction is relatively common in patients with IMN, and the clinical indicators are more severe in these patients. Thyroid dysfunction is an independent risk factor for poor prognosis in patients with IMN. More attention should be paid to thyroid function in patients with IMN.
Introduction
Idiopathic membranous nephropathy (IMN) is one of the most common types of renal pathology in adults with nephrotic syndrome and one of the leading causes of end-stage renal disease (ESRD) (1). Massive proteinuria and edema are hallmark clinical characteristics of IMN, and the predominant histopathological alterations include basement membrane thickening and subepithelial immune complex deposition (2). Sixty percent of patients with untreated IMN experience a gradual decline in renal function, and about 35% progress to ESRD within ten years (3). M-type phospholipase A2 receptor (PLA2R) is the main antigen expressed on the podocyte surface of IMN, which exists in 70%-80% of IMN cases (4, 5). Serum PLA2R autoantibody is highly specific for the diagnosis of IMN, and its level is closely related to disease severity, which plays a crucial role in predicting treatment response and disease activity (6–8). There is a close relationship between thyroid hormones and the kidney. Thyroid hormones play an essential role in the renal structure, blood perfusion, glomerular filtration, tubular function, and water-electrolyte balance. Furthermore, the kidney is not only a target organ for thyroid hormones but is also involved in the metabolism and elimination of thyroid hormones (9). Thyroid dysfunction has been reported in different glomerular diseases and increases the risk of developing chronic kidney disease (CKD) in the elderly (10, 11). However, the significance of thyroid dysfunction in the development and prognosis of IMN remains unclear. Therefore, this study analyzed the clinicopathological and prognostic data of patients with thyroid dysfunction and IMN in a large cohort to evaluate the relationship between thyroid function and IMN.
Materials and methods
Study participants
From January 2015 to December 2019, 1052 patients with biopsy-proven IMN from the First Affiliated Hospital of Zhengzhou University were included in this retrospective cohort analysis. The following inclusion criteria were applied: (1) complete baseline data and follow-up of ≥ 6 months; (2) age ≥ 18 years; (3) no previous history of thyroid disease; and (4) no glucocorticoids or immunosuppressants before the renal biopsy. Patients with other glomerular diseases, such as IgA nephropathy, diabetic nephropathy, minimal change disease, and/or secondary conditions, such as hepatitis, systemic lupus erythematosus, psoriasis, malignancy, serious infectious diseases, or severe cardiopulmonary diseases, were excluded. Blood was collected within 48 hours of admission to assess the free thyroxine (FT4), free triiodothyronine (FT3), and thyroid-stimulating hormone (TSH) levels. The patients were divided into euthyroid and thyroid dysfunction groups according to the thyroid hormone levels. Patients in the thyroid dysfunction group were further divided into three subgroups: hypothyroid, hyperthyroid, and non-thyroid illness syndrome (NTIS) groups.
This study followed the standards of the Helsinki Declaration and was supported by the Ethics Review Committee of the First Affiliated Hospital of Zhengzhou University (approval number:2022-KY-1187-002). Informed consent was waived owing to the retrospective nature of this study.
Data collection
Demographic and clinical data were collected at the time of renal biopsy, including age, sex, blood pressure, blood urea nitrogen (BUN), serum creatinine (SCr), uric acid (UA), triglycerides (TG), total cholesterol (TC), blood white blood cells (WBC), hemoglobin, platelets, albumin, estimated glomerular filtration rate (eGFR), M-type phospholipase A2 receptor (PLA2R) antibody, D-dimer, proteinuria, FT3, FT4, and TSH. FT3 and FT4 levels were measured using a commercial radioimmunoassay (RIA) kit (Roche Diagnostics, Mannheim, Germany). TSH levels were measured using a commercial RIA kit (Immunotech, Marseille, France). Two experienced renal pathologists diagnosed the renal biopsy specimens using light microscopy, electron microscopy, and immunofluorescence. Pathological changes were classified into two grades based on the presence or absence of glomerulosclerosis, crescents, mesangial cell proliferation, renal tubular atrophy, renal interstitial fibrosis, inflammatory cell infiltration, and renal arteriolar lesions. Follow-up data included time, proteinuria, SCr, eGFR, albumin, and medications, such as renin-angiotensin-aldosterone system inhibitor (RAASi), corticosteroids, and immunosuppressants.
Outcomes and definitions
The endpoint event was a composite of SCr doubling, eGFR decrease of >40% from baseline, ESRD, or death from kidney failure (12–14). ESRD was defined as eGFR <15 mL/min/1.73 m2 or the need for renal replacement therapy (dialysis or kidney transplantation). Follow-up time was defined as the interval from renal biopsy to the occurrence of the endpoint event or the last outpatient visit. Treatment response included clinical remission and relapse. Clinical remission included complete remission (CR) and partial remission (PR). CR was defined by proteinuria <0.3 g/d, serum albumin >35 g/L, and SCr stability. PR was defined as proteinuria <3.5 g/d with a >50% reduction from baseline. After clinical remission, the reappearance of proteinuria >3.5 g/d was defined as relapse. The reference ranges of FT3, FT4, and TSH levels were 3.28–6.47 pmol/L, 7.9–18.4 pmol/L, and 0.34–5.6 μIU/mL, respectively. NTIS, also known as euthyroid sick syndrome, includes low T3, low T4, low T3 and low T4, high T4, and other abnormalities (15). The time course of kidney disease was defined from discovery to renal biopsy. Hypertension was defined as systolic pressure ≥140 mmHg, diastolic pressure ≥90 mmHg, or the use of antihypertensive drugs. The mean arterial pressure was equal to one-third systolic pressure plus two-thirds diastolic pressure. Nephrotic syndrome was defined as proteinuria >3.5 g/d and serum albumin <30 g/L. The eGFR was calculated using the Chronic Kidney Disease Epidemiology Collaboration (CKD-EPI) equation (16).
Statistical analysis
Continuous variables with normal distribution were expressed as mean ± standard deviation, and the independent samples t-test, one-way analysis of variance, and Bonferroni method were used for comparisons between the groups. Data that did not follow the normal distribution were expressed as median and interquartile ranges (25%, 75%), and the differences were compared using the Mann-Whitney U test or Kruskal-Wallis test. Categorical variables were expressed as frequency (percentage) and compared between groups using the χ2 test or Fisher exact test. Logistic regression was used to analyze the risk factors of thyroid dysfunction in patients with IMN. To reduce confounders and balance baseline variables, we applied propensity score matching (PSM) (17). Matching was performed in a 1:1 ratio using the nearest neighbor approach with no replacement and a matching tolerance of 0.02. The covariates entered into the propensity score model included age, sex, hemoglobin, platelets, albumin, BUN, SCr, UA, TC, TG, eGFR, WBC, PLA2R antibody, D-dimer, proteinuria, and treatment. To compare the rates of CR, relapse, and renal survival between the groups, the Kaplan-Meier curve and log-rank test were used, as well as multiple testing with a Bonferroni correction method. The association between thyroid dysfunction and IMN prognosis was investigated using Cox regression analysis. SPSS version 26.0 (IBM Corp, Armonk, NY, USA) and GraphPad Prism version 8.0.2 (GraphPad Software, San Diego, CA, USA) software were used for statistical analysis and figure creation. All tests were two-sided. A P value <0.05 indicated statistical significance.
Results
Baseline characteristics
Of the 1052 patients with IMN, 736 (70%) had normal thyroid function and 316 (30.0%) had abnormal thyroid function. The most common type of thyroid dysfunction was hypothyroidism (n = 226; 21.5%) including 212 cases of subclinical hypothyroidism (20.2%) and 14 cases of clinical hypothyroidism (1.3%). This was followed by NTIS (n = 79; 7.5%). In contrast, hyperthyroidism occurred less frequently (n = 11; 1.0%) (Figure 1A). When eGFR (unit: mL/min/1.73 m2) was >90, 60–90, and <60, the incidence of thyroid dysfunction was 26.1% (224/857), 45.9% (78/170), and 56.0% (14/25), respectively (Figure 1B).
Figure 1
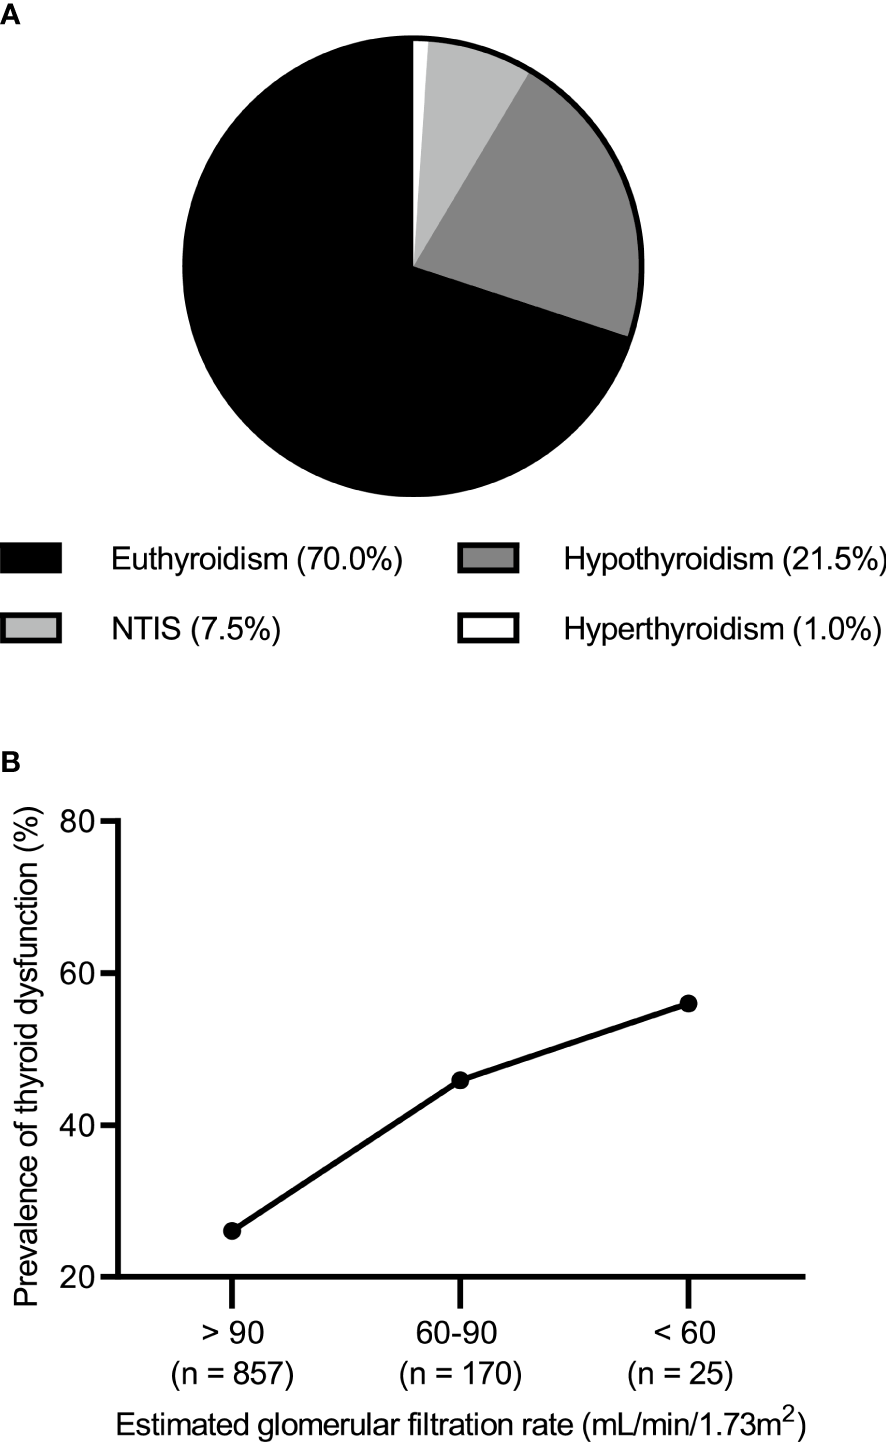
(A) Prevalence of thyroid dysfunction in idiopathic membranous nephropathy. (B) Prevalence of thyroid dysfunction by the level of estimated glomerular filtration rate.
Patients in the thyroid dysfunction group had a higher prevalence of nephrotic syndrome than those in the euthyroid group (68.4% versus 46.9%, P < 0.001). However, no significant variations in age, sex, course, or blood pressure were seen between the two groups (Table 1). Further subgroup analysis showed that, compared to the euthyroid group, the hypothyroid and NTIS groups had a higher incidence of nephrotic syndrome (Table S1).
Table 1
| Characteristic | Unmatched data | Matched data | ||||
|---|---|---|---|---|---|---|
| Euthyroidism (n = 736) | Thyroid dysfunction (n = 316) | P value | Euthyroidism (n = 282) | Thyroid dysfunction (n = 282) | P value | |
| General Information | ||||||
| Age (years)* | 46.51 ± 12.63 | 46.43 ± 13.86 | 0.931 | 45.74 ± 12.62 | 46.66 ± 13.76 | 0.411 |
| Male, n (%) | 437 (59.4) | 195 (61.7) | 0.479 | 159 (56.4) | 173 (61.3) | 0.231 |
| Course of disease (months) | 1 (1, 4) | 1 (1, 3) | 0.317 | 1 (1, 4) | 1 (1, 3) | 0.303 |
| Hypertension, n (%) | 335 (45.5) | 140 (44.3) | 0.717 | 138 (48.9) | 118 (41.8) | 0.091 |
| Systolic BP (mmHg) | 133.96 ± 15.80 | 134.78 ± 17.59 | 0.456 | 134.74 ± 17.05 | 134.10 ± 17.32 | 0.658 |
| Diastolic BP (mmHg) | 85.60 ± 11.53 | 86.33 ± 11.57 | 0.348 | 86.40 ± 12.22 | 85.75 ± 11.33 | 0.513 |
| Mean arterial pressure (mmHg) | 101.72 ± 11.70 | 102.48 ± 12.21 | 0.341 | 102.51 ± 12.54 | 101.87 ± 11.88 | 0.530 |
| Nephrotic syndrome, n (%) | 345 (46.9) | 216 (68.4) | < 0.001 | 184 (65.2) | 184 (65.2) | 1.000 |
| Laboratory Result | ||||||
| Blood urea nitrogen (mmol/L) | 4.90 ± 1.64 | 5.23 ± 2.31 | 0.021 | 4.97 ± 1.89 | 5.12 ± 1.86 | 0.338 |
| Serum creatinine (μmol/L) | 67.70 ± 17.49 | 74.87 ± 25.13 | < 0.001 | 70.32 ± 21.07 | 72.03 ± 18.85 | 0.311 |
| Uric acid (μmol/L) | 330.62 ± 88.85 | 320.81 ± 94.12 | 0.107 | 312.41 ± 79.67 | 324.86 ± 87.12 | 0.077 |
| Albumin (g/L) | 27.48 ± 6.35 | 23.36 ± 5.77 | < 0.001 | 23.87 ± 5.16 | 24.07 ± 5.61 | 0.661 |
| Total cholesterol (mmol/L) | 6.79 (5.50, 8.25) | 7.37 (6.09, 9.31) | < 0.001 | 7.38 (6.12, 9.31) | 7.29 (6.05, 9.05) | 0.465 |
| Triglycerides (mmol/L) | 1.99 (1.41, 2.99) | 2.19 (1.52, 3.32) | 0.017 | 2.02 (1.48, 3.12) | 2.12 (1.43, 3.21) | 0.613 |
| eGFR (mL/min/1.73 m2) | 104.13 ± 16.12 | 98.53 ± 20.24 | < 0.001 | 101.93 ± 18.73 | 100.41 ± 18.18 | 0.328 |
| White blood cell (×109/L) | 6.51 ± 1.88 | 6.65 ± 1.96 | 0.271 | 6.59 ± 1.96 | 6.61 ± 1.94 | 0.891 |
| Hemoglobin (g/L) | 134.71 ± 16.85 | 132.34 ± 18.05 | 0.041 | 131.47 ± 17.18 | 133.19 ± 17.63 | 0.241 |
| Platelet (×109/L) | 239.03 ± 62.47 | 248.33 ± 75.70 | 0.055 | 239.07 ± 60.09 | 242.41 ± 67.56 | 0.535 |
| Serum anti-PLA2R titer (RU/mL) | 41.85 (10.95, 122.90) | 86.25 (30.33, 215.05) | < 0.001 | 75.45 (21.75, 195.88) | 79.05 (28.28, 203.23) | 0.475 |
| Serum anti-PLA2R titer > 50 RU/mL, n (%) | 350 (47.6) | 207 (65.5) | < 0.001 | 168 (59.6) | 180 (63.8) | 0.299 |
| D-dimer (mg/L) | 0.21 (0.11, 0.36) | 0.29 (0.17, 0.58) | < 0.001 | 0.27 (0.16, 0.46) | 0.26 (0.16, 0.51) | 0.950 |
| Proteinuria (g/d) | 4.14 (2.25, 6.36) | 5.56 (3.66, 8.25) | < 0.001 | 5.28 (3.17, 8.02) | 5.25 (3.47, 7.89) | 0.623 |
| Renal Pathology | ||||||
| Glomerulosclerosis, n (%) | 440 (59.8) | 197 (62.3) | 0.436 | 178 (63.1) | 175 (62.1) | 0.794 |
| Crescents, n (%) | 47 (6.4) | 26 (8.2) | 0.281 | 23 (8.2) | 22 (7.8) | 0.877 |
| Mesangial cell proliferation, n (%) | 10 (1.4) | 8 (2.5) | 0.179 | 8 (2.8) | 7 (2.5) | 0.794 |
| Tubular atrophy, n (%) | 376 (51.1) | 161 (50.9) | 0.967 | 152 (53.9) | 142 (50.4) | 0.399 |
| Interstitial fibrosis, n (%) | 367 (49.9) | 170 (53.8) | 0.242 | 143 (50.7) | 150 (53.2) | 0.555 |
| Inflammatory cell infiltration, n (%) | 453 (61.5) | 216 (68.4) | 0.035 | 187 (66.3) | 188 (66.7) | 0.929 |
| Arteriolar lesions, n (%) | 488 (66.3) | 222 (70.3) | 0.210 | 175 (62.1) | 196 (69.5) | 0.062 |
| Treatment | ||||||
| RAASi, n (%) | 488 (66.3) | 186 (58.9) | 0.021 | 168 (59.6) | 167 (59.2) | 0.932 |
| Glucocorticoid or immunosuppressants alone, n (%) | 341 (46.3) | 133 (42.1) | 0.205 | 122 (43.3) | 120 (42.6) | 0.865 |
| Glucocorticoid and immunosuppressants, n (%) | 259 (35.2) | 148 (46.8) | < 0.001 | 134 (47.5) | 131 (46.5) | 0.800 |
| Outcome | ||||||
| Complete remission, n (%) | 526 (71.5) | 196 (62.0) | 0.002 | 205 (72.7) | 180 (63.8) | 0.024 |
| Relapse, n (%) | 196 (28.2) | 101 (34.6) | 0.046 | 90 (33.8) | 90 (34.5) | 0.875 |
| Composite endpoint, n (%) | 55 (7.5) | 35 (11.1) | 0.055 | 19 (6.7) | 33 (11.7) | 0.042 |
Clinicopathologic characteristics, treatment, and outcome of IMN patients without or with thyroid dysfunction before and after propensity score matching.
Data were presented as means ± standard deviation, medians (interquartile range), or frequency (percentage). *The age range was 19-83 years old.
BP, blood pressure; eGFR, estimated glomerular filtration rate; PLA2R, phospholipase A2 receptor; RAASi, renin-angiotensin-aldosterone system inhibitor.
Clinicopathological features and treatment before and after PSM
Patients in the thyroid dysfunction group exhibited higher levels of BUN, SCr, TG, TC, PLA2R antibody titer, D-dimer, and proteinuria and a greater percentage of PLA2R antibody titer > 50 RU/mL than those in the euthyroid group, but lower eGFR, albumin, and hemoglobin levels (all P < 0.05). Moreover, more patients in the thyroid dysfunction group had pathological changes in renal interstitial inflammatory cell infiltration (68.4% versus 61.5%, P = 0.035). Furthermore, the thyroid dysfunction group used a lower proportion of RAASi (58.9% versus 66.3%, P = 0.021) but a higher proportion of glucocorticoids combined with immunosuppressants (46.8% versus 35.2%, P < 0.001) (Table 1). Further subgroup analysis revealed that compared to the euthyroid group, the hypothyroid and NTIS groups had higher levels of SCr, TC, D-dimer, and PLA2R antibody titer, proteinuria, and a higher proportion of PLA2R antibody titer >50 RU/mL, but lower albumin and eGFR levels. In addition, the NTIS group had higher BUN and lower hemoglobin levels, while the hypothyroid group had higher levels of TG, platelets, and a higher proportion of glucocorticoids combined with immunosuppressants (Tables S1, S2).
After PSM, 282 pairs were successfully matched, including 282 cases in the euthyroid group and 282 cases in the thyroid dysfunction group. The baseline data of the two groups reached a balance (Table 1).
Risk factors of thyroid dysfunction in IMN
The univariate logistic regression analysis showed that BUN, SCr, albumin, TC, TG, eGFR, hemoglobin, platelets, D-dimer, PLA2R antibody, proteinuria, and renal interstitial inflammatory cell infiltration were predictors of thyroid dysfunction in patients with IMN. Age, sex, and significant variables in the univariate analysis were included in the multivariate logistic regression. The results of the multivariate logistic regression revealed that female sex, lower albumin and eGFR levels, higher D-dimer level, and more proteinuria were independent risk factors for thyroid dysfunction in patients with IMN (Table 2).
Table 2
| Characteristic | Univariate logistic | Multivariate logistic* | ||
|---|---|---|---|---|
| OR (95% CI) | P value | OR (95% CI) | P value | |
| Sex (male vs female) | 1.103 (0.841–1.455) | 0.479 | 0.729 (0.540–0.985) | 0.039 |
| Age (years) | 1.000 (0.989–1.010) | 0.928 | ||
| Hypertension (yes vs no) | 0.952 (0.730–1.241) | 0.717 | ||
| Blood urea nitrogen (mmol/L) | 1.095 (1.021–1.175) | 0.011 | ||
| Serum creatinine (μmol/L) | 1.017 (1.010–1.024) | 0.000 | ||
| Uric acid (μmol/L) | 0.999 (0.997–1.000) | 0.108 | ||
| Albumin (g/L) | 0.892 (0.870–0.914) | < 0.001 | 0.910 (0.885–0.935) | < 0.001 |
| Total cholesterol (mmol/L) | 1.148 (1.085–1.215) | < 0.001 | ||
| Triglycerides (mmol/L) | 1.090 (1.013–1.173) | 0.021 | ||
| eGFR (mL/min/1.73 m2) | 0.982 (0.975–0.990) | < 0.001 | 0.990 (0.982–0.998) | 0.017 |
| White blood cell (×109/L) | 1.039 (0.971–1.112) | 0.271 | ||
| Hemoglobin (g/L) | 0.992 (0.984–1.000) | 0.041 | ||
| Platelet (×109/L) | 1.002 (1.000–1.004) | 0.039 | ||
| D-dimer (mg/L) | 1.917 (1.474–2.493) | < 0.001 | 1.347 (1.044–1.738) | 0.022 |
| Serum anti-PLA2R titer (RU/mL) | 1.001 (1.001–1.002) | < 0.001 | ||
| Proteinuria (g/d) | 1.133 (1.092–1.176) | < 0.001 | 1.064 (1.021–1.108) | 0.003 |
| Glomerulosclerosis (yes vs no) | 1.114 (0.849–1.460) | 0.436 | ||
| Crescents (yes vs no) | 1.314 (0.799–2.163) | 0.282 | ||
| Mesangial cell proliferation (yes vs no) | 1.886 (0.737–4.824) | 0.186 | ||
| Tubular atrophy (yes vs no) | 0.995 (0.764–1.295) | 0.967 | ||
| Interstitial fibrosis (yes vs no) | 1.171 (0.899–1.525) | 0.242 | ||
| Inflammatory cell infiltration (yes vs no) | 1.349 (1.020–1.785) | 0.036 | ||
| Arteriolar lesions (yes vs no) | 1.200 (0.902–1.597) | 0.210 | ||
Risk factors of thyroid dysfunction in patients with IMN.
*The values of multivariate logistic analysis were reported only for the statistically significant results.
OR, odd ratio; CI, confidence interval; eGFR, estimated glomerular filtration rate; PLA2R, phospholipase A2 receptor.
Follow-up and prognosis analysis
The median follow-up durations in the euthyroid and thyroid dysfunction groups were 28 (range =17-40) months and 24 (range = 14-34) months, respectively. The incidence rates of treatment response and composite events in the two groups are shown in Table 1. Results from the Kaplan-Meier curves revealed that the thyroid dysfunction group had a lower cumulative CR probability (P = 0.002, Figure 2A), higher cumulative relapse probability (P < 0.001, Figure 2B), and lower cumulative renal survival probability (P = 0.013, Figure 2C) than the euthyroid group. In the subgroup comparisons (Figures 3, S1), the thyroid dysfunction subgroups were separately compared with the euthyroid group. Kaplan-Meier curves identified a lower cumulative CR probability in the hypothyroid (P = 0.023) and NTIS groups (P = 0.017), but the differences were not statistically significant. Additionally, the cumulative relapse probabilities were higher in the hypothyroid (P < 0.001) and NTIS groups (P = 0.002), while the cumulative renal survival probability was lower in the hypothyroid group (P = 0.011). In the unadjusted model, Cox regression analysis revealed that thyroid dysfunction was a significant predictor of CR [hazard ratio (HR) = 0.781, P = 0.003], relapse (HR = 1.699, P = 0.001), and composite endpoint event (HR = 1.703, P = 0.014) in patients with IMN. After adjusting for age, sex, hypertension, proteinuria, albumin, eGFR, PLA2R antibody, and treatment, thyroid dysfunction remained an independent risk factor for IMN relapse (HR = 1.726, P < 0.001) and composite endpoint event (HR = 1.576, P = 0.043), but not for CR (HR = 0.941, P = 0.486) (Table 3).
Figure 2
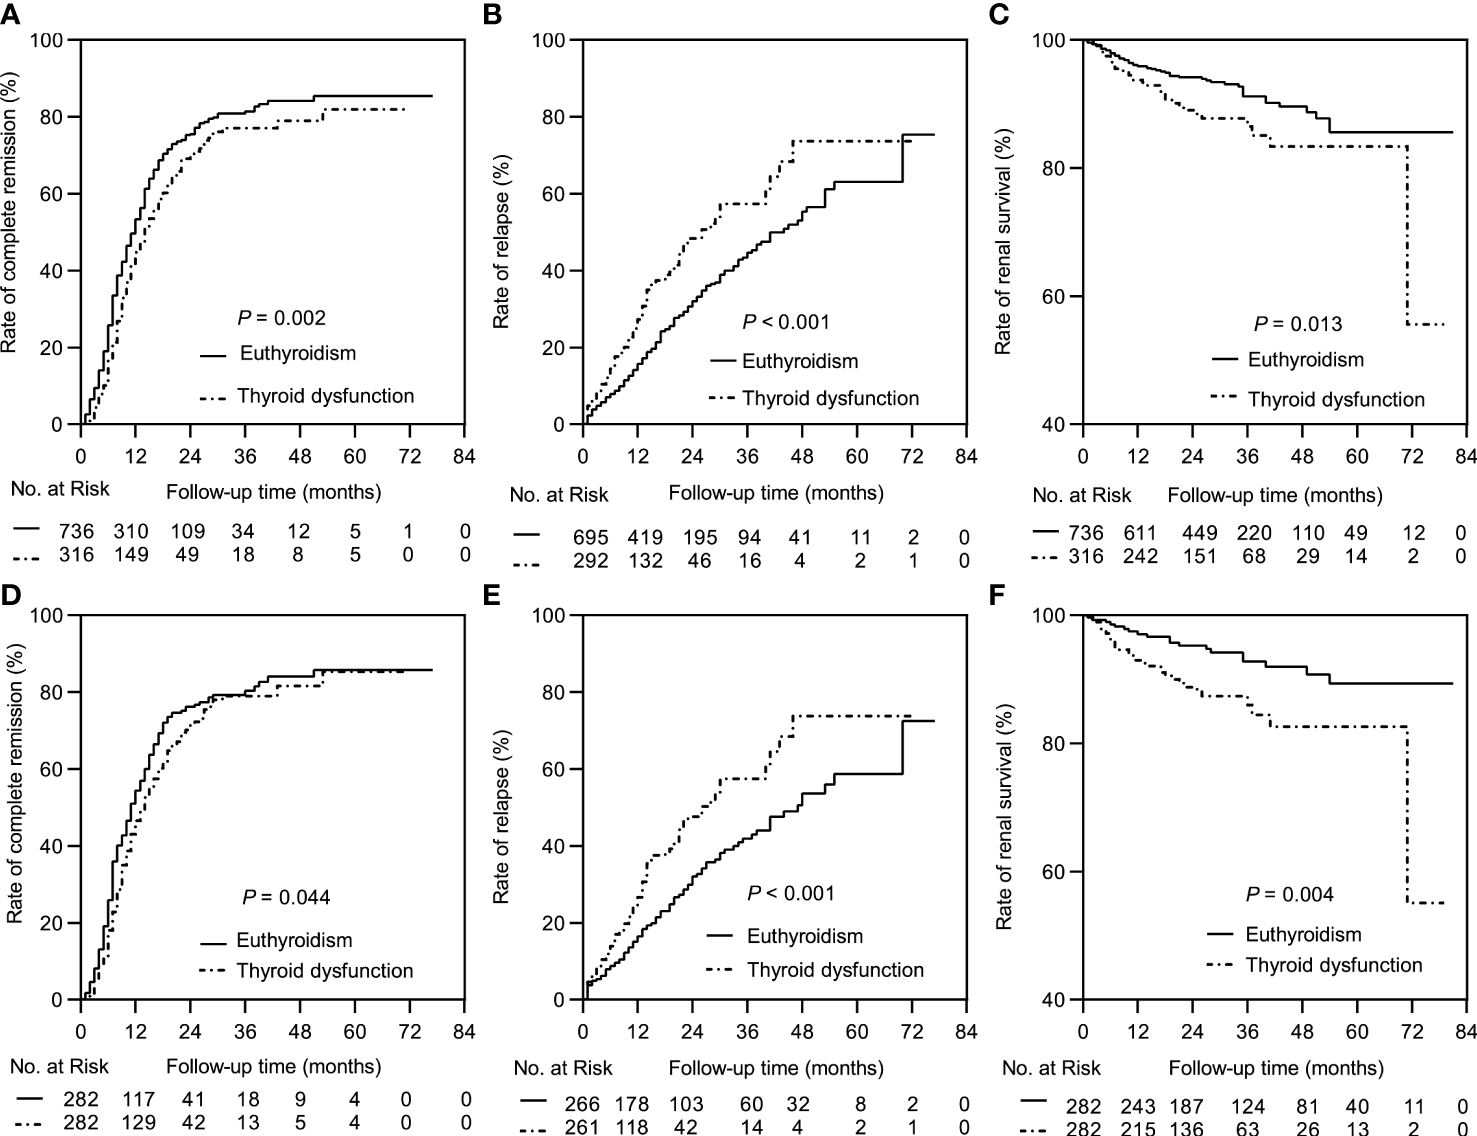
Kaplan-Meier curves between the euthyroid group and thyroid dysfunction group. In the complete dataset: (A) Complete remission rate; (B) Relapse rate; (C) Renal survival rate. In the propensity matched dataset: (D) Complete remission rate; (E) Relapse rate; (F) Renal survival rate.
Figure 3
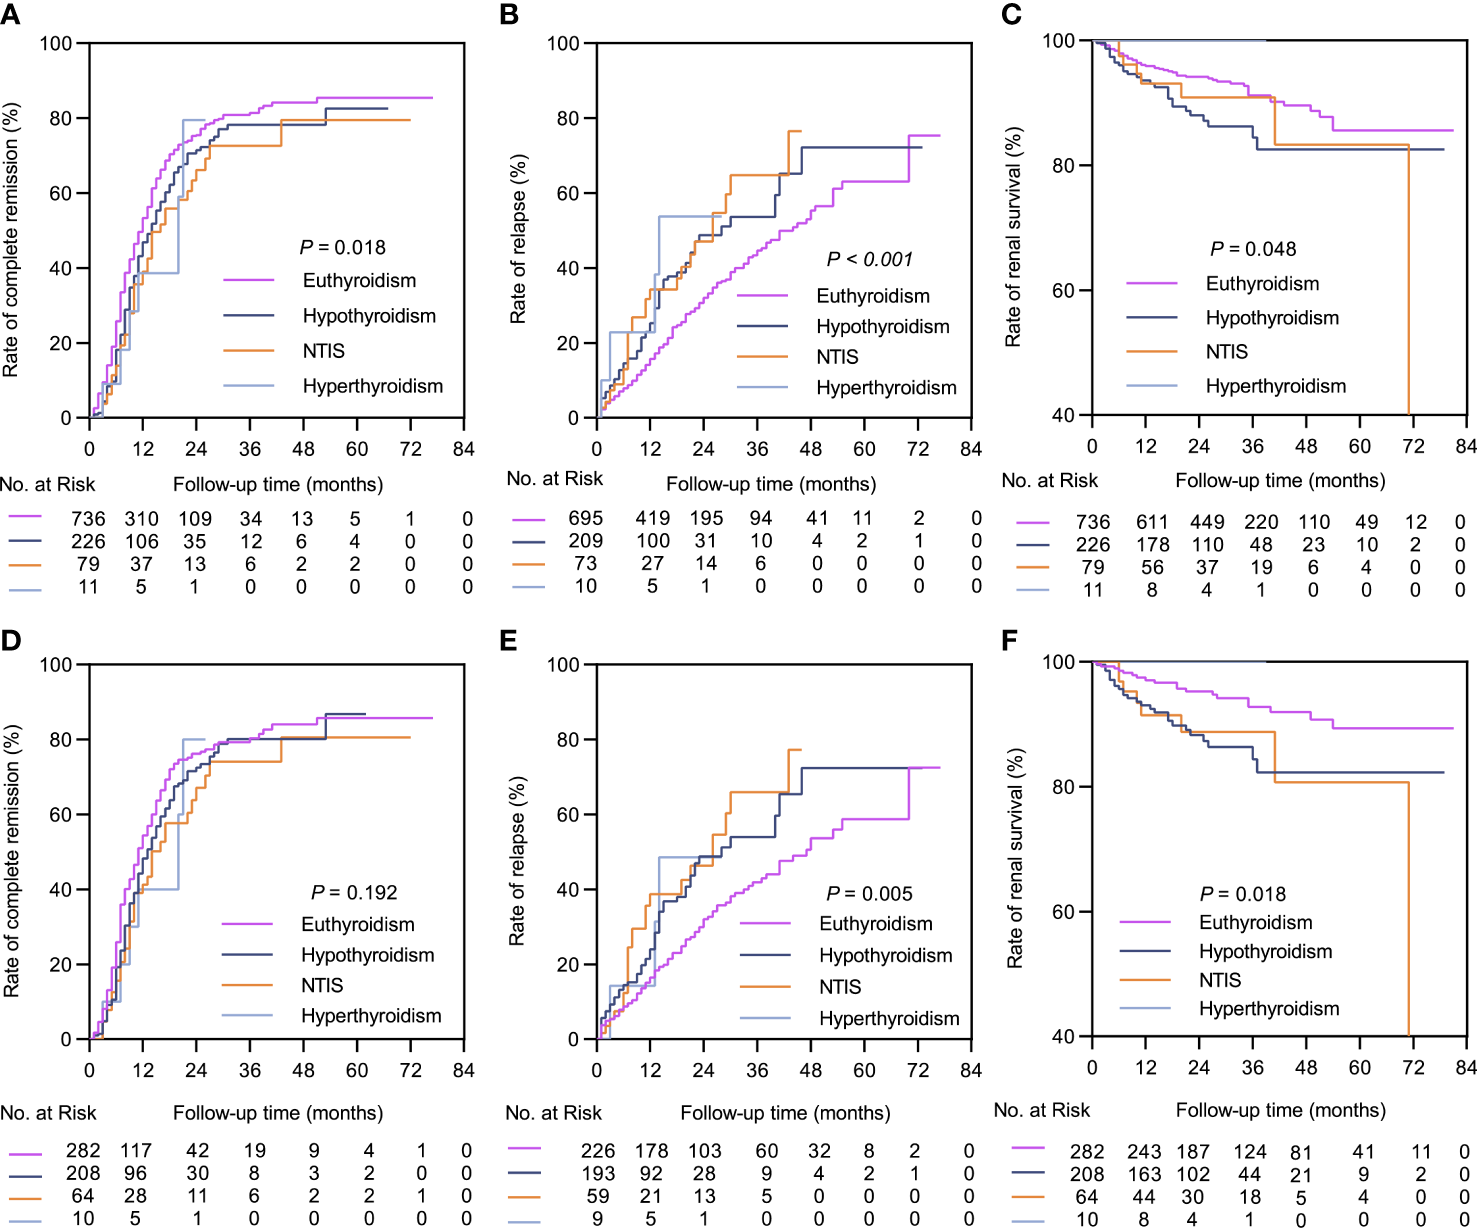
Kaplan-Meier curves between the euthyroid group and thyroid dysfunction subgroups. In the complete dataset: (A) Complete remission rate; (B) Relapse rate; (C) Renal survival rate. In the propensity matched dataset: (D) Complete remission rate; (E) Relapse rate; (F) Renal survival rate. NTIS, non-thyroid illness syndrome.
Table 3
| Unadjusted | Model 1a | Model 2b | Model 3c | |||||
|---|---|---|---|---|---|---|---|---|
| HR (95% CI) | P value | HR (95% CI) | P value | HR (95% CI) | P value | HR (95% CI) | P value | |
| Complete remission | 0.781 (0.663–0.920) | 0.003 | 0.777 (0.659–0.915) | 0.003 | 0.934 (0.786–1.110) | 0.439 | 0.941 (0.791–1.118) | 0.486 |
| Relapse | 1.699 (1.259–2.292) | 0.001 | 1.660 (1.231–2.240) | 0.001 | 1.746 (1.291–2.360) | < 0.001 | 1.726 (1.277–2.333) | < 0.001 |
| Composite endpoint event | 1.703 (1.113–2.605) | 0.014 | 1.716 (1.121–2.625) | 0.013 | 1.507 (0.958–2.369) | 0.076 | 1.576 (1.014–2.450) | 0.043 |
Cox regression analyses of complete remission, relapse, and composite endpoint event before propensity score matching.
Model 1 was adjusted for age, sex and hypertension.
Model 2 was adjusted for covariates in model 1 plus albumin, eGFR, proteinuria, and serum anti-PLA2R titer.
Model 3 was adjusted for covariates in model 2 plus treatment strategies.
HR, hazard ratio; CI, confidence interval; eGFR, estimated glomerular filtration rate; PLA2R, phospholipase A2 receptor.
In the matched cohort, the median follow-up time in the euthyroid and thyroid dysfunction groups was 34 (20, 53) months and 24 (14, 34) months, respectively. The incidence rates of the different outcomes are also presented in Table 1. The thyroid dysfunction group had a lower cumulative CR probability (P = 0.044, Figure 2D), a higher cumulative relapse probability (P < 0.001, Figure 2E), and a poorer cumulative renal survival probability (P = 0.004, Figure 2F) than the euthyroid group. Subgroup analysis revealed that compared with the euthyroid group, the hypothyroid group (P = 0.003) and NTIS group (P = 0.004) had a higher cumulative relapse probability; the hypothyroid group (P = 0.006) had a lower cumulative renal survival probability, but differences in cumulative CR probability between the groups were not significant (Figures 3, S2). Results from the multivariate Cox regression analysis showed that after adjusting for the confounding factors, thyroid dysfunction remained an independent risk factor for CR (HR = 0.810, P = 0.045), relapse (HR = 1.721, P = 0.001), and composite endpoint event (HR = 2.113, P = 0.014) in patients with IMN (Table 4).
Table 4
| Unadjusted | Model 1a | Model 2b | Model 3c | |||||
|---|---|---|---|---|---|---|---|---|
| HR (95% CI) | P value | HR (95% CI) | P value | HR (95% CI) | P value | HR (95% CI) | P value | |
| Complete remission | 0.819 (0.671–1.001) | 0.051 | 0.831 (0.679–1.016) | 0.071 | 0.791 (0.644–0.970) | 0.024 | 0.810 (0.659–0.996) | 0.045 |
| Relapse | 1.699 (1.259–2.292) | 0.001 | 1.657 (1.228–2.236) | 0.001 | 1.726 (1.266–2.355) | 0.001 | 1.721 (1.261–2.348) | 0.001 |
| Composite endpoint event | 2.292 (1.292–4.066) | 0.005 | 2.127 (1.194–3.787) | 0.010 | 2.153 (1.192–3.888) | 0.011 | 2.113 (1.165–3.831) | 0.014 |
Cox regression analyses of complete remission, relapse, and composite endpoint event after propensity score matching.
Model 1 was adjusted for age, sex and hypertension.
Model 2 was adjusted for covariates in model 1 plus albumin, eGFR, proteinuria, and serum anti-PLA2R titer.
Model 3 was adjusted for covariates in model 2 plus treatment strategies.
HR, hazard ratio; CI, confidence interval; eGFR, estimated glomerular filtration rate; PLA2R, phospholipase A2 receptor.
Discussion
In non-iodine deficient areas, the prevalence of hyperthyroidism, clinical hypothyroidism, and subclinical hypothyroidism is approximately 0.2%–1.3%, 1%–2%, and 4%–10%, respectively (18, 19). In our study (n= 1052), the prevalence of thyroid dysfunction was approximately 30%. Of this 30%, hypothyroidism accounted for 21.5% (subclinical hypothyroidism was about 20.2% and clinical hypothyroidism was about 1.3%), followed by NTIS (approximately 7.5%), while hyperthyroidism was low at about 1%. The prevalence of thyroid dysfunction was significantly higher in patients with IMN than in the general population, and the incidence increased with decreasing eGFR levels, as reported in the CKD cohorts (20). This may be related to several issues. First, massive proteinuria increases the excretion of carrier proteins, such as thyroid-binding globulin, transthyretin, and albumin. Second, the conversion of T4 to T3 is inhibited, and iodine clearance is also impaired. Finally, metabolic acidosis, inflammatory status, and diet are factors to consider (21, 22). The epidemiology of MN shows that it is more common in middle-aged and elderly people, with a 2:1 male predominance (3). This is reflected in our study sample of 1052 patients with IMN, in which the female-to-male ratio was 0.66:1.
This study also found that females, lower albumin and eGFR levels, higher D-dimer level, and severe proteinuria, were independent predictor variables for thyroid dysfunction in patients with IMN. Li et al. (10), in their cohort of 317 patients with nephrotic syndrome, found that SCr, TC, platelets, hemoglobin, albumin, and proteinuria were predictors of thyroid dysfunction. Li et al.’s findings are consistent with part of our results. The discrepancy may be related to different study samples and sizes between the two studies. Therefore, the thyroid functions of patients with IMN who have one or more of the risk factors should be monitored to avoid missed diagnoses and delayed treatment.
We found that patients in the thyroid dysfunction group had higher levels of SCr and proteinuria, and lower levels of albumin and eGFR. These factors have been identified as risk predictors of kidney disease progression, indicating that patients with IMN and thyroid dysfunction have more severe clinical manifestations (2). Thyroid hormones play an essential role in lipid metabolism, and thyroid dysfunction, particularly hypothyroidism, increases the likelihood of hyperlipidemia (23). Hyperlipidemia has been linked to an acceleration of renal function decline in patients with CKD (24). In this study, we discovered that patients with IMN and thyroid dysfunction tended to have higher levels of TC and TG, suggesting that thyroid dysfunction may induce more severe renal disorders by altering lipid levels. Research has also demonstrated that abnormal thyroid function increases the risk of anemia by affecting erythrocyte production and survival, together with iron metabolism and utilization (25). Moreover, anemia has been associated with poor prognosis in CKD (26). Furthermore, we observed that patients in the thyroid dysfunction group had a lower hemoglobin level, implying that thyroid dysfunction may negatively impact patients with IMN by reducing hemoglobin levels. Therefore, correcting the levels of blood lipids and hemoglobin in patients with IMN may be helpful.
PLA2R is the primary target antigen of IMN (70%–80%), and a PLA2R antibody titer greater than 50RU/mL is defined as a high risk for IMN according to the Kidney Disease Improving Global Outcomes (KDIGO) 2021 guideline. Additionally, a high level of PLA2R antibodies is an independent risk factor for persistent deterioration of renal function (2, 7, 27). Our study found that both the PLA2R antibody titer and the proportion of titers greater than 50 RU/mL were higher in the thyroid dysfunction group, inferring that thyroid dysfunction may have adverse effects on the development of IMN through an immune mechanism. Further investigations on this aspect are warranted.
Venous thromboembolism (VTE) is a potentially fatal complication of nephrotic syndrome, with the highest incidence in membranous nephropathy (7%–60%), and D-dimer is a vital biomarker for assessing VTE (28). Recent evidence suggests that thyroid hormones can affect the coagulation and fibrinolytic systems, increasing the risk of bleeding or thrombosis (29). Our study revealed that patients in the thyroid dysfunction group had a higher D-dimer level, implying that abnormal thyroid function may increase the risk of VTE in patients with IMN, which should be taken seriously in clinical practice. Regarding renal pathology, we found that patients in the thyroid dysfunction group demonstrated increased renal interstitial inflammatory cell infiltration relative to those in the euthyroid group, but there was no significant difference in glomerulopathy and arteriolar lesions. The investigation of thyroid dysfunction on pathological changes in patients with IMN is limited and requires further exploration.
Previous studies have reported that thyroid dysfunction increases the risk of cardiorenal injury and all-cause death in CKD (30–34). To date, there have been no large-scale clinical studies on thyroid dysfunction and the prognosis of IMN. In our large study cohort, patients with IMN combined with thyroid dysfunction demonstrated a poor prognosis, as well as severe clinical manifestations. Patients with thyroid dysfunction had a lower CR rate, a greater relapse rate, and a poorer kidney survival rate even after applying the PSM approach to minimize bias. The subgroup analysis further indicated that patients in the hypothyroid group had a higher relapse rate and a lower renal survival rate, whereas those in the NTIS group only had a higher relapse rate. There was no significant difference in the prognosis between the hyperthyroid and euthyroid groups, which may be due to the limited number of cases in our study. Notably, the multivariate Cox analysis confirmed that thyroid dysfunction was an independent risk factor for CR, relapse, and composite endpoint event in patients with IMN.
Thyroid dysfunction affects kidney function in several ways (21, 22). First, it can damage the renal structure, resulting in decreased kidney volume, thickened glomerular basement membrane, increased mesangial matrix, and capillary permeability. Second, thyroid hormone disorders alter eGFR through water-sodium metabolism, renal tubular ion transporters, and tubular-glomerular feedback. Thyroid dysfunction can also disrupt the autonomic regulation of renal blood perfusion via the renin-angiotensin-aldosterone system. Moreover, thyroid dysfunction influences cardiac output and blood volume by changing myocardial contractility, peripheral vascular resistance, and erythropoietin production, thereby altering renal blood flow. Consequently, patients with IMN and thyroid disorders should be regularly monitored. According to previous studies, thyroid hormone supplementation improves renal function in patients with thyroid deficiency, which may be related to thyroid hormone-enhanced circulating blood volume, renal blood flow, and endothelial function (35, 36). For patients with IMN and thyroid dysfunction, correcting abnormal thyroid function as soon as possible may be beneficial. Nevertheless, studies on the effectiveness and safety of thyroid hormone replacement therapy in patients with IMN are scarce. Hence, more basic research and multicenter cohort studies are required.
This study has some limitations. As a single-center retrospective study, the causal relationship between thyroid dysfunction and the prognosis of IMN could not be determined. The follow-up duration was also insufficient. Moreover, thyroid hormone levels were not dynamically observed during the follow-up period and patients with thyroid dysfunction were not treated or monitored regularly. We will continue to investigate this in future research.
In conclusion, using the PSM method in a large cohort of patients with IMN, this study found that patients with IMN and thyroid dysfunction have more severe clinical characteristics and worse prognoses, especially those with hypothyroidism. Moreover, thyroid dysfunction is an independent risk factor for poor prognosis in patients with IMN. Therefore, the thyroid function of patients with IMN should be monitored in clinical practice.
Statements
Data availability statement
The original contributions presented in the study are included in the article/Supplementary Material. Further inquiries can be directed to the corresponding author.
Ethics statement
The studies involving human participants were reviewed and approved by The Ethics Review Committee of the First Affiliated Hospital of Zhengzhou University (approval number: 2022-KY-1187-002). Written informed consent for participation was not required for this study in accordance with the national legislation and the institutional requirements.
Author contributions
PW and JZ designed the study. YML, YCL, and HC collected the data. SW and BH analyzed the data. PW drafted the manuscript. All authors critically reviewed the article. All authors contributed to the article and approved the submitted version.
Funding
This study was supported by the National Nature Science Foundation of China (grant number 82170721).
Acknowledgments
The authors would like to acknowledge the service provided by the staff of the department of Nephrology, The First Affiliated Hospital of Zhengzhou University.
Conflict of interest
The authors declare that the research was conducted in the absence of any commercial or financial relationships that could be construed as a potential conflict of interest.
Publisher’s note
All claims expressed in this article are solely those of the authors and do not necessarily represent those of their affiliated organizations, or those of the publisher, the editors and the reviewers. Any product that may be evaluated in this article, or claim that may be made by its manufacturer, is not guaranteed or endorsed by the publisher.
Supplementary material
The Supplementary Material for this article can be found online at: https://www.frontiersin.org/articles/10.3389/fendo.2023.1133521/full#supplementary-material
References
1
Cattran DC Brenchley PE . Membranous nephropathy: Integrating basic science into improved clinical management. Kidney Int (2017) 91(3):566–74. doi: 10.1016/j.kint.2016.09.048
2
Ronco P Beck L Debiec H Fervenza FC Hou FF Jha V et al . Membranous nephropathy. Nat Rev Dis Primers (2021) 7(1):69. doi: 10.1038/s41572-021-00303-z
3
Couser WG . Primary membranous nephropathy. Clin J Am Soc Nephrol (2017) 12(6):983–97. doi: 10.2215/CJN.11761116
4
Beck LH Jr. Bonegio RG Lambeau G Beck DM Powell DW Cummins TD et al . M-type phospholipase A2 receptor as target antigen in idiopathic membranous nephropathy. N Engl J Med (2009) 361(1):11–21. doi: 10.1056/NEJMoa0810457
5
Hoxha E Reinhard L Stahl RAK . Membranous nephropathy: New pathogenic mechanisms and their clinical implications. Nat Rev Nephrol (2022) 18(7):466–78. doi: 10.1038/s41581-022-00564-1
6
Beck LH Jr. Fervenza FC Beck DM Bonegio RG Malik FA Erickson SB et al . Rituximab-induced depletion of anti-Pla2r autoantibodies predicts response in membranous nephropathy. J Am Soc Nephrol (2011) 22(8):1543–50. doi: 10.1681/ASN.2010111125
7
Hoxha E Harendza S Pinnschmidt H Panzer U Stahl RA . M-type phospholipase A2 receptor autoantibodies and renal function in patients with primary membranous nephropathy. Clin J Am Soc Nephrol (2014) 9(11):1883–90. doi: 10.2215/CJN.03850414
8
Tesar V Hruskova Z . Autoantibodies in the diagnosis, monitoring, and treatment of membranous nephropathy. Front Immunol (2021) 12:593288. doi: 10.3389/fimmu.2021.593288
9
Iglesias P Bajo MA Selgas R Diez JJ . Thyroid dysfunction and kidney disease: An update. Rev Endocr Metab Disord (2017) 18(1):131–44. doi: 10.1007/s11154-016-9395-7
10
Li LZ Hu Y Ai SL Cheng L Liu J Morris E et al . The relationship between thyroid dysfunction and nephrotic syndrome: A clinicopathological study. Sci Rep (2019) 9(1):6421. doi: 10.1038/s41598-019-42905-4
11
Chuang MH Liao KM Hung YM Wang PY Chou YC Chou P . Abnormal thyroid-stimulating hormone and chronic kidney disease in elderly adults in Taipei city. J Am Geriatr Soc (2016) 64(6):1267–73. doi: 10.1111/jgs.14102
12
Maschio G Alberti D Janin G Locatelli F Mann JF Motolese M et al . Effect of the angiotensin-Converting-Enzyme inhibitor benazepril on the progression of chronic renal insufficiency. the angiotensin-Converting-Enzyme inhibition in progressive renal insufficiency study group. N Engl J Med (1996) 334(15):939–45. doi: 10.1056/NEJM199604113341502
13
Brenner BM Cooper ME de Zeeuw D Keane WF Mitch WE Parving HH et al . Effects of losartan on renal and cardiovascular outcomes in patients with type 2 diabetes and nephropathy. N Engl J Med (2001) 345(12):861–9. doi: 10.1056/NEJMoa011161
14
Coresh J Turin TC Matsushita K Sang Y Ballew SH Appel LJ et al . Decline in estimated glomerular filtration rate and subsequent risk of end-stage renal disease and mortality. JAMA (2014) 311(24):2518–31. doi: 10.1001/jama.2014.6634
15
Lee S Farwell AP . Euthyroid sick syndrome. Compr Physiol (2016) 6(2):1071–80. doi: 10.1002/cphy.c150017
16
Levey AS Stevens LA Schmid CH Zhang YL Castro AF 3rd Feldman HI et al . A new equation to estimate glomerular filtration rate. Ann Intern Med (2009) 150(9):604–12. doi: 10.7326/0003-4819-150-9-200905050-00006
17
Austin PC . An introduction to propensity score methods for reducing the effects of confounding in observational studies. Multivariate Behav Res (2011) 46(3):399–424. doi: 10.1080/00273171.2011.568786
18
Biondi B Cooper DS . The clinical significance of subclinical thyroid dysfunction. Endocr Rev (2008) 29(1):76–131. doi: 10.1210/er.2006-0043
19
Taylor PN Albrecht D Scholz A Gutierrez-Buey G Lazarus JH Dayan CM et al . Global epidemiology of hyperthyroidism and hypothyroidism. Nat Rev Endocrinol (2018) 14(5):301–16. doi: 10.1038/nrendo.2018.18
20
Lo JC Chertow GM Go AS Hsu CY . Increased prevalence of subclinical and clinical hypothyroidism in persons with chronic kidney disease. Kidney Int (2005) 67(3):1047–52. doi: 10.1111/j.1523-1755.2005.00169.x
21
Narasaki Y Sohn P Rhee CM . The interplay between thyroid dysfunction and kidney disease. Semin Nephrol (2021) 41(2):133–43. doi: 10.1016/j.semnephrol.2021.03.008
22
Echterdiek F Ranke MB Schwenger V Heemann U Latus J . Kidney disease and thyroid dysfunction: The chicken or egg problem. Pediatr Nephrol (2022) 37(12):3031–42. doi: 10.1007/s00467-022-05640-z
23
Su X Peng H Chen X Wu X Wang B . Hyperlipidemia and hypothyroidism. Clin Chim Acta (2022) 527:61–70. doi: 10.1016/j.cca.2022.01.006
24
Tsai CW Huang HC Chiang HY Chung CW Chang SN Chu PL et al . Longitudinal lipid trends and adverse outcomes in patients with ckd: A 13-year observational cohort study. J Lipid Res (2019) 60(3):648–60. doi: 10.1194/jlr.P084590
25
Wopereis DM Du Puy RS van Heemst D Walsh JP Bremner A Bakker SJL et al . The relation between thyroid function and anemia: A pooled analysis of individual participant data. J Clin Endocrinol Metab (2018) 103(10):3658–67. doi: 10.1210/jc.2018-00481
26
Sato Y Fujimoto S Konta T Iseki K Moriyama T Yamagata K et al . Anemia as a risk factor for all-cause mortality: Obscure synergic effect of chronic kidney disease. Clin Exp Nephrol (2018) 22(2):388–94. doi: 10.1007/s10157-017-1468-8
27
Kidney Disease: Improving Global Outcomes Glomerular Diseases Work G . Kdigo 2021 clinical practice guideline for the management of glomerular diseases. Kidney Int (2021) 100(4S):S1–S276. doi: 10.1016/j.kint.2021.05.021
28
Li SJ Guo JZ Zuo K Zhang J Wu Y Zhou CS et al . Thromboembolic complications in membranous nephropathy patients with nephrotic syndrome-a prospective study. Thromb Res (2012) 130(3):501–5. doi: 10.1016/j.thromres.2012.04.015
29
Elbers LPB Squizzato A Gerdes VEA . Thyroid disorders and hemostasis. Semin Thromb Hemost (2018) 44(7):676–82. doi: 10.1055/s-0038-1666825
30
You AS Sim JJ Kovesdy CP Streja E Nguyen DV Brent GA et al . Association of thyroid status prior to transition to end-stage renal disease with early dialysis mortality. Nephrol Dial Transplant (2019) 34(12):2095–104. doi: 10.1093/ndt/gfy289
31
Rhee CM Kalantar-Zadeh K Ravel V Streja E You AS Brunelli SM et al . Thyroid status and death risk in us veterans with chronic kidney disease. Mayo Clin Proc (2018) 93(5):573–85. doi: 10.1016/j.mayocp.2018.01.024
32
Rhee CM You AS Nguyen DV Brunelli SM Budoff MJ Streja E et al . Thyroid status and mortality in a prospective hemodialysis cohort. J Clin Endocrinol Metab (2017) 102(5):1568–77. doi: 10.1210/jc.2016-3616
33
Rhee CM Ravel VA Streja E Mehrotra R Kim S Wang J et al . Thyroid functional disease and mortality in a national peritoneal dialysis cohort. J Clin Endocrinol Metab (2016) 101(11):4054–61. doi: 10.1210/jc.2016-1691
34
Rhee CM Kim S Gillen DL Oztan T Wang J Mehrotra R et al . Association of thyroid functional disease with mortality in a national cohort of incident hemodialysis patients. J Clin Endocrinol Metab (2015) 100(4):1386–95. doi: 10.1210/jc.2014-4311
35
Blackaller GN Chavez-Iniguez JS Carreon-Bautista EE Gonzalez-Torres FJ Villareal-Contreras M Barrientos Avalos JR et al . A pilot trial on the effect of levothyroxine on proteinuria in patients with advanced ckd. Kidney Int Rep (2021) 6(1):110–9. doi: 10.1016/j.ekir.2020.10.016
36
Gondil VS Chandrasekaran A Rastogi A Yadav AK Sood A Ramachandran R et al . Proteinuria in severe hypothyroidism: A prospective study. J Clin Endocrinol Metab (2021) 106(2):e749–56. doi: 10.1210/clinem/dgaa871
Summary
Keywords
thyroid function, clinicopathological features, prognosis, propensity score matching, idiopathic membranous nephropathy
Citation
Wang P, Wang S, Huang B, Liu Y, Liu Y, Chen H and Zhang J (2023) Clinicopathological features and prognosis of idiopathic membranous nephropathy with thyroid dysfunction. Front. Endocrinol. 14:1133521. doi: 10.3389/fendo.2023.1133521
Received
29 December 2022
Accepted
03 March 2023
Published
16 March 2023
Volume
14 - 2023
Edited by
Salvatore Benvenga, University of Messina, Italy
Reviewed by
Giusy Elia, University of Pisa, Italy; Valeria Cernaro, University of Messina, Italy
Updates
Copyright
© 2023 Wang, Wang, Huang, Liu, Liu, Chen and Zhang.
This is an open-access article distributed under the terms of the Creative Commons Attribution License (CC BY). The use, distribution or reproduction in other forums is permitted, provided the original author(s) and the copyright owner(s) are credited and that the original publication in this journal is cited, in accordance with accepted academic practice. No use, distribution or reproduction is permitted which does not comply with these terms.
*Correspondence: Junjun Zhang, fcczhangjj1@zzu.edu.cn
This article was submitted to Renal Endocrinology, a section of the journal Frontiers in Endocrinology
Disclaimer
All claims expressed in this article are solely those of the authors and do not necessarily represent those of their affiliated organizations, or those of the publisher, the editors and the reviewers. Any product that may be evaluated in this article or claim that may be made by its manufacturer is not guaranteed or endorsed by the publisher.