 Yiran Zheng1,2*‡
 Luisa Sophie Rajcsanyi1,2
 Manuela Kowalczyk3Johanna Giuranna1
 Beate Herpertz-Dahlmann4
 Jochen Seitz4
 Martina de Zwaan5Wolfgang Herzog6
 Stefan Ehrlich7,8
 Stephan Zipfel9,10
 Katrin Giel9,10Karin Egberts11Roland Burghardt12
 Manuel Föcker13
 Saad Al-Lahham14
 Johannes Hebebrand1,2Dagmar Fuhrer3,15Susanne Tan15
 Denise Zwanziger3
 Triinu Peters1,2†
 Anke Hinney1,2†
- 1Department of Child and Adolescent Psychiatry, Psychosomatics and Psychotherapy, University Hospital Essen, University of Duisburg-Essen, Essen, Germany
- 2Center for Translational Neuro- and Behavioral Sciences, University Hospital Essen, University of Duisburg-Essen, Essen, Germany
- 3Department of Endocrinology, Diabetes and Metabolism and Clinical Chemistry – Division of Laboratory Research, University Hospital Essen, University of Duisburg-Essen, Essen, Germany
- 4Department of Child and Adolescent Psychiatry and Psychotherapy, University Hospital of the RWTH Aachen, Aachen, Germany
- 5Department of Psychosomatic Medicine and Psychotherapy, Hannover Medical School, Hannover, Germany
- 6Department of Internal Medicine II, General Internal and Psychosomatic Medicine, University of Heidelberg, Heidelberg, Germany
- 7Translational Developmental Neuroscience Section, Department of Child and Adolescent Psychiatry, TU-Dresden, University Hospital Carl Gustav Carus, Dresden University of Technology, Dresden, Germany
- 8Eating Disorders Research and Treatment Center, Department of Child and Adolescent Psychiatry, Faculty of Medicine, TU Dresden, Dresden, Germany
- 9Department of Psychosomatic Medicine and Psychotherapy, Medical University Hospital, Tübingen, Germany
- 10Centre of Excellence for Eating Disorders, University of Tübingen, Tübingen, Germany
- 11Department of Child and Adolescent Psychiatry, Psychosomatics and Psychotherapy, University of Würzburg, Würzburg, Germany
- 12Department of Child and Adolescent Psychiatry, Psychosomatics and Psychotherapy, Oberberg Fachklinik Fasanenkiez, Berlin, Germany
- 13Department of Child and Adolescent Psychiatry, University of Münster, Münster, Germany
- 14Department of Biomedical Sciences, Faculty of Medicine and Health Sciences, An-Najah National University, Nablus, Palestine
- 15Department of Endocrinology, Diabetes and Metabolism, University Hospital Essen, University of Duisburg-Essen, Essen, Germany
Context: The bone-derived adipokine lipocalin-2 is relevant for body weight regulation by stimulating the leptin-melanocortin pathway.
Objective: We aimed to (i) detect variants in the lipocalin-2 gene (LCN2) which are relevant for body weight regulation and/or anorexia nervosa (AN); (ii) describe and characterize the impact of LCN2 and MC4R variants on circulating lipocalin-2 level.
Methods: Sanger sequencing of the coding region of LCN2 in 284 children and adolescents with severe obesity or 287 patients with anorexia nervosa. In-silico analyses to evaluate functional implications of detected LCN2 variants. TaqMan assays for rare non-synonymous variants (NSVs) in additional independent study groups. Serum levels of lipocalin-2 were measured by ELISA in 35 females with NSVs in either LCN2 or MC4R, and 33 matched controls without NSVs in the two genes.
Results: Fourteen LCN2-variants (five NSVs) were detected. LCN2-p.Leu6Pro and p.Gly9Val located in the highly conserved signal peptide region may induce functional consequences. The secondary structure change of lipocalin-2 due to LCN2-p.Val89Ile may decrease solubility and results in a low lipocalin-2 level in a heterozygotes carrier (female recovered from AN). Lean individuals had lower lipocalin-2 levels compared to patients with obesity (p = 0.033).
Conclusion: Lipocalin-2 levels are positively associated with body mass index (BMI). Single LCN2-variants might have a profound effect on lipocalin-2 levels.
1 Introduction
Body weight regulation is based on energy intake and expenditure. When energy balance is disturbed, a number of disorders can ensue, such as obesity (1) and anorexia nervosa (AN). Obesity is a global health hazard and is in adults commonly defined with a body mass index (BMI, kg/m2) at or above 30 kg/m2 (2–4), and with BMI at or above the 97th percentile (5) in children and adolescents. AN is a life-threatening disorder accompanied with severely low body weight (6) (DSM-IV (7) and DSM-5 criteria (8). Genetic and environmental factors influence energy homeostasis (9).
Lipocalin-2 was initially considered as an adipokine highly expressed by murine fat cells (10) and later recognized as a bone-derived hormone associated with appetite regulation (11). A study in mice demonstrated that lipocalin-2 could reduce appetite and decrease fat mass via crossing the blood-brain barrier and binding to the melanocortin 4 receptor protein (MC4R) in the hypothalamus (11). Mosialou et al. showed that MC4R is necessary for lipocalin-2 to regulate appetite in a Mc4r knockout mouse model (11).
The MC4R plays an essential role in the leptin-melanocortin pathway and thus in energy homeostasis (12). Mutations in the MC4R gene (MC4R) display the most common cause of monogenic obesity (13) and affect 2-4% of severely obese individuals (14). Patients with AN show increased α-MSH-reactive IgG, leading to rapid MC4R internalization and potentially improved satiety and reduced hunger (15). The first Mc4r knockout mouse model was generated in 1997. A dominant effect of Mc4r mutations of body weight was reported, whereby the effect was more pronounced in female mice (16). In humans, different mutations in MC4R have a major gene effect in obesity (17–20). Up to now more than 160 different mutations in MC4R had been reported mainly in severely obese individuals (12).
We had shown that MC4R and lipocalin-2 gene (LCN2) mutations were detected in 2.42% and 0.84%, respectively, of Spanish children with obesity. Some individuals with functionally relevant mutations in MC4R or LCN2 were able to reduce their BMI-SDS in a lifestyle intervention (21). We hypothesized that mutations in MC4R or LCN2 may have an effect on the lipocalin-2 level and thus influence weight regulation.
Bone marrow, where lipocalin-2 is mainly expressed, consists of red (hematopoietic) and yellow (adipose tissue) components. Although lipocalin-2 can be secreted by both hematopoietic and bone marrow adipose tissue (BMA) cell types, the expression level is significantly higher in osteoblasts (22). Therefore, the expression level of lipocalin-2 may be affected by the phase of accelerated marrow adiposity accumulation and the total bone mass. BMI is a proxy indicator for body weight without describing the composition. Body weight is composed of body fat (BF) and lean body mass (LBM). LBM has been declared to be positively associated with measurements of bone mass or density for decades (23, 24). Thus, we expect a correlation between lipocalin-2 level and BMI or LBM.
2 Methods
2.1 Study population
2.1.1 Mutation screen and TaqMan assay
To detect variants in LCN2, 571 German individuals consisting of (i) 287 females with diagnosed AN [acute or recovered, diagnosed with DSM-IV criteria (7)], (ii) 284 children, adolescents and young adults (younger than 25 years of age (25) with (severe) obesity [91.7% individuals were severely obese with BMI percentage ≥ 97th percentile (5)] were Sanger sequenced. TaqMan assays for detected rare non-synonymous variants (NSVs) were performed in additional independent study groups consisting of (i) 170 German females with AN, (ii) 200 children or adolescents with severe obesity (99.5% individuals younger than 25 years of age).
2.1.2 LBM calculation for all analyzed individuals
LBM was calculated for each individual with the equations shown in the Supplementary Material (Method 1). The LBM percentage (LBM%) refers to the percentage of LBM within the total body weight.
2.1.3 ELISA assay
For the analysis of lipocalin-2 level in female individuals of whom serum was available, we used (i) two heterozygous carriers of NSVs in LCN2 (n = 2), (ii) individuals heterozygous for 12 MC4R NSVs (n = 33) and (iii) matched (for disorder, sex, age (± 3 years), LBM% (± 3%)) controls homozygous for a reference genotype at the respective genes (n = 33).
MC4R NSVs were derived from our previous studies (Rajcsanyi et al. unpublished data (14, 19, 26, 27), which contained mutation screens for a total of 4,985 individuals of German descent. All individuals involved in the LCN2 mutation screen and ELISA assay were sequenced for MC4R variants in our previous studies. Additional Sanger sequencing for LCN2 was performed for the individuals for whom LCN2 genotypes were not available: (i) female patients with AN (n = 7), (ii) children or adolescents with obesity (n = 39), and (iii) healthy-lean individuals (BMI percentage ≤ 15th percentile, n = 9).
Briefly, the 464 unrelated female patients with AN included 381 individuals with acute AN and 83 individuals with AN history were recruited in our study. The patients with acute AN had a mean age of 19.47 (SD = 7.68) years and a mean BMI of 15.6 (SD = 1.8) kg/m2. The individuals recovered from AN had a mean age of 27.09 (SD = 9.88) years and a mean BMI of 20.56 (SD = 2.75) kg/m2. The phenotype distribution of analyzed study groups is shown in Table 1. All participants gave written informed consent in case of minors their parents. The study was approved by the Ethics Committees of the Universities of Aachen, Dresden, Essen, Frankfurt, Hannover, Heidelberg, Marburg, Tübingen and Würzburg, and was performed in accordance with the Declaration of Helsinki.
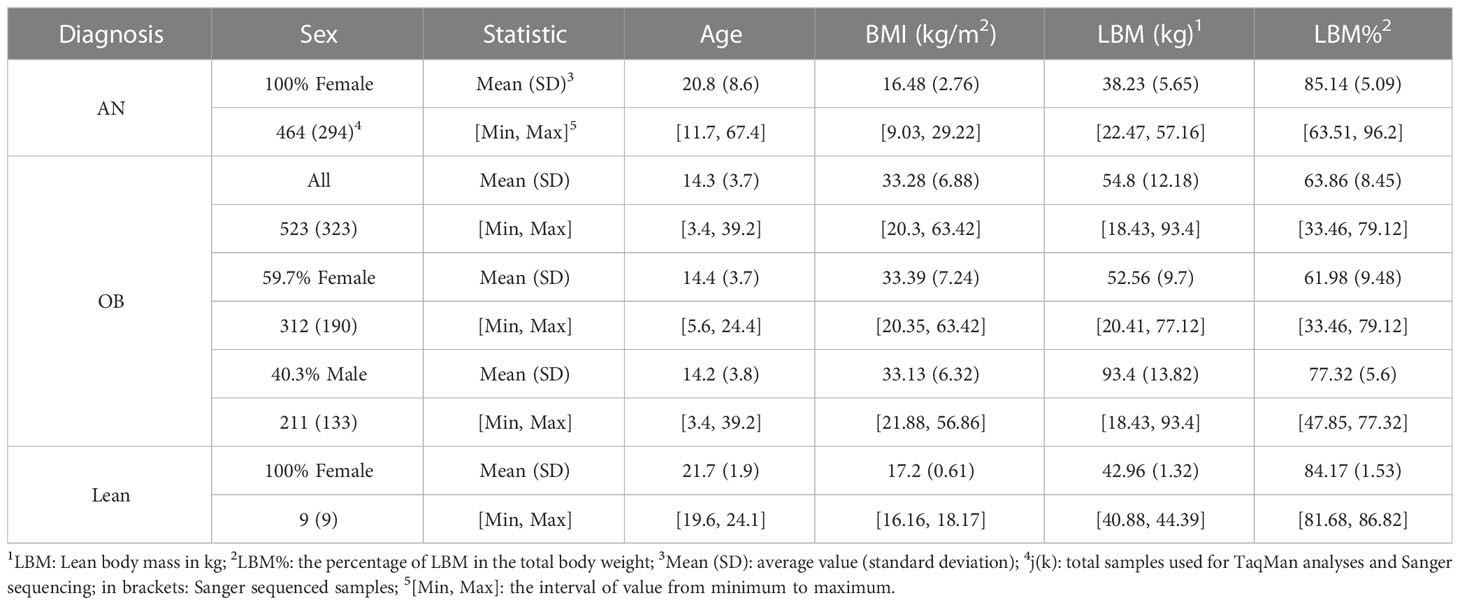
Table 1 Phenotypes of the study groups.
2.2 Mutation screen
The transcript variant 1 (LCN2-201, ENST00000277480.7) of LCN2 (Chr9: 128,149,071 ~ 128,153,453, GRCh38.p13) was extracted from the Ensembl Database (28) (http://www.ensembl.org/index.html). Its coding region was divided into four PCR fragments [(primers located in the introns, Supplementary Material Method 2)]. The polymerase chain reaction (PCR) amplified DNA samples were sequenced unidirectional by Microsynth Seqlab GmbH (Göttingen, Germany). All sequenced samples passed internal quality control and were genotyped with SeqMan Pro software (v.11.0.0, DNAstar, Inc., Madison, WI, USA) by two experienced individuals independently. Samples with variant pattern were confirmed with sequencing of the other strand. Hardy-Weinberg Equilibrium (HWE) was performed for all analyzed variants.
2.3 In-silico functional analyses on detected variants in LCN2 and MC4R
2.3.1 GWAS look-up for detected variants in GWASs and linkage disequilibrium analysis
Detected variants with dbSNP numbers were looked up in the GWAS for BMI by Pulit et al. (for females, males and combined sexes) (29) and in the GWAS for AN by Watson et al. (30). The data of variants located in the genomic region upstream and downstream (±) 500kb of LCN2 was extracted from GWAS summary statistics (Supplementary Material Tables 1, 2) and plotted in GraphPad Prism 9.4.0. The detected LCN2 variants were analyzed for LD scores with genome-wide significant variants in GWAS for BMI (29) which were located in the genomic ± 500kb region in LD matrix (31) (https://ldlink.nci.nih.gov/?tab=ldmatrix, population: European, genotype data from 1000G Project). If the LD scores between detected variants and GWAS hits were D’ > 0.6 and R2 > 0.3, the paired variants were analyzed for haplotype in LDpair (31) (https://ldlink.nci.nih.gov/?tab=ldpair).
2.3.2 Conservation analysis on detected variants
The conservation analysis for detected single nucleotide LCN2 variants was performed by human LCN2 gDNA and 30 different species from three superorders (ten primates, ten rodents and related species, ten laurasiatherian, Supplementary Material Table 3). The gDNA sequences align was utilized the cluster W method in the software MegAlign by DNAStar, Inc. (version 10.1.0). The conservation percentiles (Cper.) were calculated for all detected variants. The variants with a value of Cper. larger than 85% were identified as “highly conserved”.
2.3.3 Recruited in-silico tools analyses
All detected LCN2 variants and the MC4R variants involved in ELISA analysis were analyzed for deleteriousness and mRNA splicing pattern alteration due to nucleotide exchange, protein stability and secondary structure variance caused by non-synonymous variants by 12 in-silico tools. The procedure of variants in-silico analyses can be found in Supplementary Material Method 3. We then looked up previous functional analyses for MC4R and classified the tested mutation in our study into GOF (gain of function), RF (reduce function), and LOF (loss of function).
2.4 ELISA assays for lipocalin-2 serum levels
The blood sampling of 35 females harboring LCN2 or MC4R variants and 33 age and sex-matched controls without mutations in these genes was performed in the morning after an overnight fast. Serum samples were stored at -80°C and accurate temperature was controlled by an in-house master display. Six serum samples (two from LCN2-variant carriers, four from MC4R-variant carriers) were measured twice. For the repeated samples mean values were calculated. Circulating serum lipocalin-2 concentrations were measured using a quantitative sandwich enzyme immunoassay (Human Lipocalin-2/NGAL Quantikine ELISA Kit, Catalog: DLCN20, RRID: AB_2894833, R&D Systems, UK, Abingdon) and optical densities were detected using the SpectraMax M5 microplate reader (Molecular Devices Germany GmbH, Germany, Munich) according to the manufacture’s instructions. The intra-assay variation was < 4.4%, the inter-assay variation was < 7.9% and the detection limit was 0.012 ng/ml (according to the product insert). The 95% confidence intervals (CI) for matched controls were calculated in R studio (version: 2022.12.0 + 353 for MAC). ELISA results were plotted in R studio by the “lattice” package (32). The evaluated samples with phenotypes are shown in Supplementary Material Table 4.
2.5 TaqMan
The identified rare missense variants in LCN2 (p.Gly9Val, rs147787222; p.Val89Ile, rs200876706; p.Arg174Ser, rs546790138) were genotyped in larger study groups by performing TaqMan assays (Thermo Fisher Scientific, Inc., Waltham, MA, USA). The phenotypes of the individuals used for the three mutated genotypes determinations are summarized in Table 1.
2.6 Statistics
Association analyses between the detected variants and phenotypes were performed with Fisher’s exact test (Supplementary Material Method 4). Associations between LBM%, BMI and lipocalin-2 levels were analyzed with non-parametric Spearman correlation analyses. The differences in measurements for lipocalin-2 levels between groups were tested with Mann-Whitney U or Kruskal-Wallis 2-way ANOVA. Analyses were performed using IBM ® SPSS ® Statistics v29.0.0 for Windows. Exact two-sided significances were calculated, the alpha level was set to 0.05. To control for the overall type I error rate, Bonferroni correction was applied.
2.7 Study procedure
Our study design is shown in the following workflow figure (Figure 1).
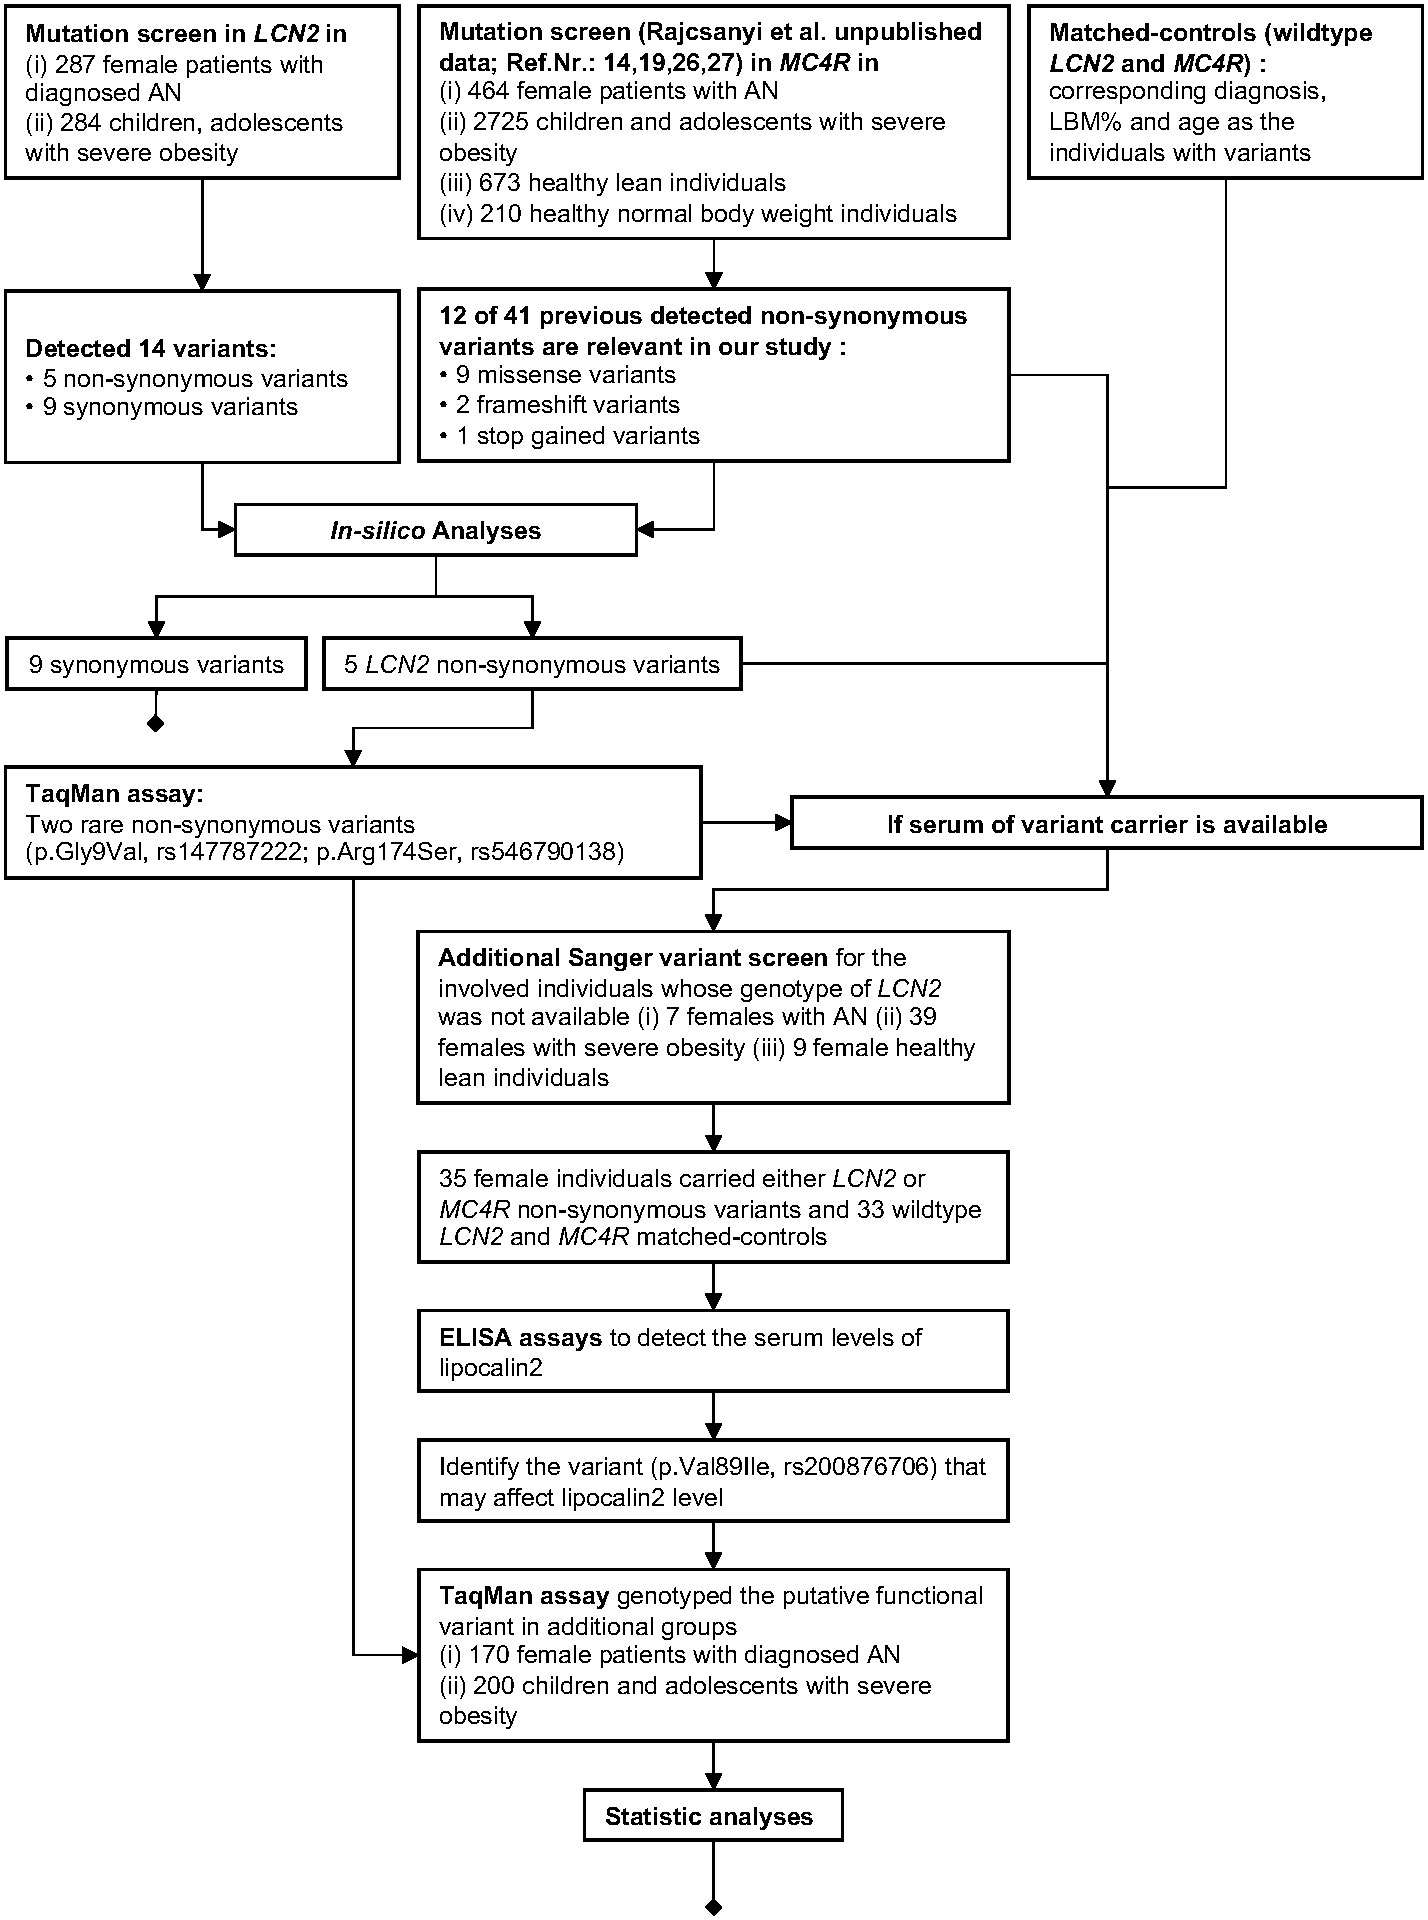
Figure 1 Workflow of our study.
3 Results
3.1 Detected LCN2 variants
We initially Sanger-sequenced the LCN2 gene in 287 female patients with AN and 284 children, adolescents with severe obesity. Seven patients with AN and 39 children or adolescents with obesity were then Sanger sequenced for ELISA assay. All six coding exons of LCN2 and intronic parts flanking the coding regions were sequenced. Fourteen variants were detected, including five coding non-synonymous variants, six intronic SNPs, two intronic deletions and one novel intronic insertion (Figure 2). The genotype distribution of all detected variants is shown in Supplementary Material Tables 5-1).
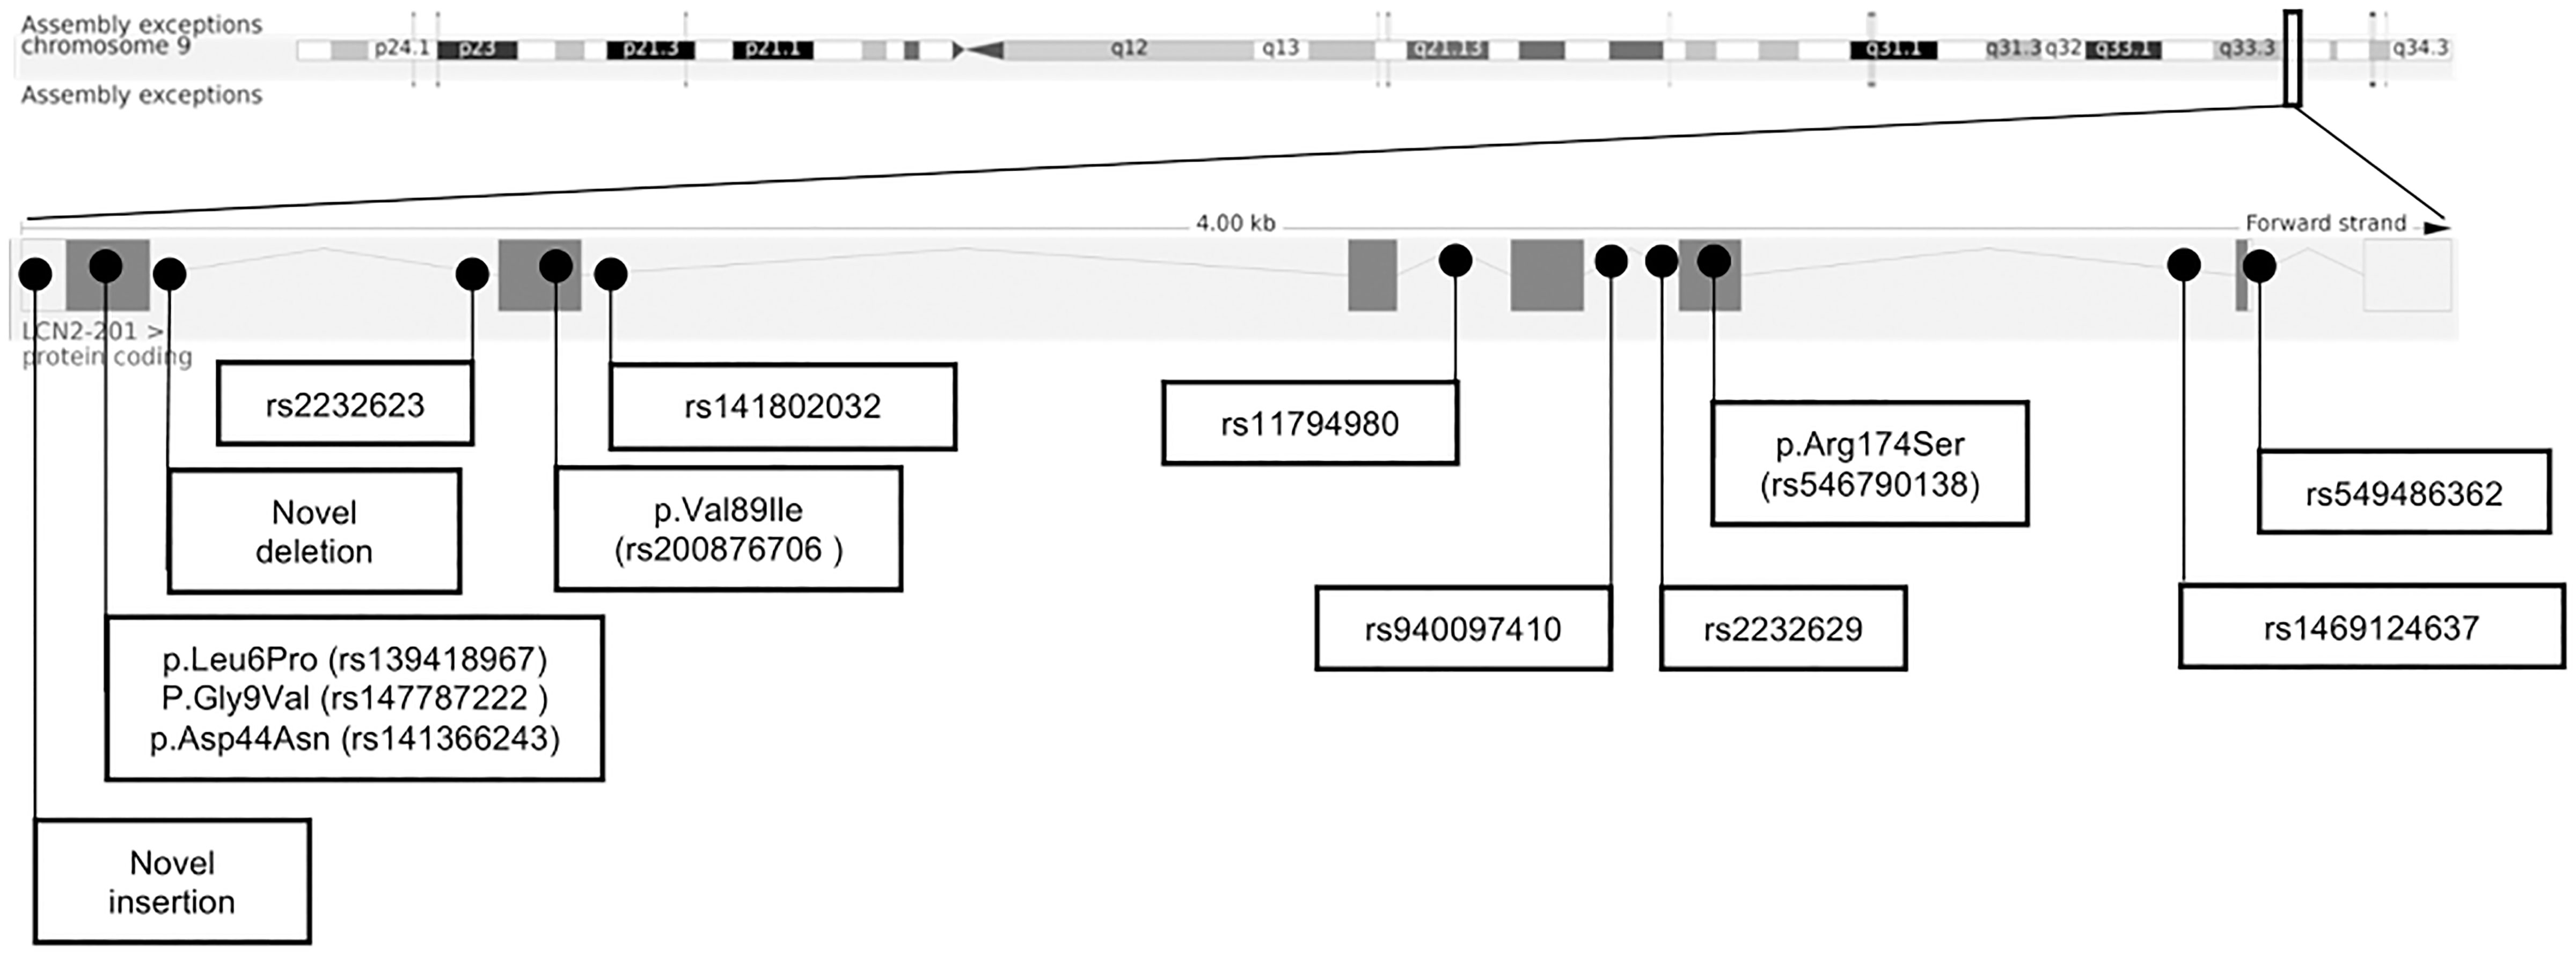
Figure 2 Chromosomal structure of LCN2 (GRCh38.p13, Ensembl) and genomic location of 14 detected variants (28).
Three missense variants (p.Leu6Pro, p.Asp44Asn, p.Val89Ile) were identified in both study groups. Two additional missense variants (p.Gly9Val, p.Arg174Ser) were only detected once in two female patients with obesity, each. For these two missense variants TaqMan assays were performed in additional independent study groups (170 females with AN; 200 children and adolescents with obesity). To sum up, 464 females with AN and 523 children or adolescents with severe obesity were genotyped for p.Gly9Val and p.Arg174Ser (Supplementary Material Tables 5-2). In total, two females with AN, two females and one male with obesity were heterozygous for p.Gly9Val. For p.Arg174Ser no additional variant carriers were identified.
The genotype frequencies of all detected variants were in the HWE. The genotype distribution of detected missense and structural variants are shown in Table 2.
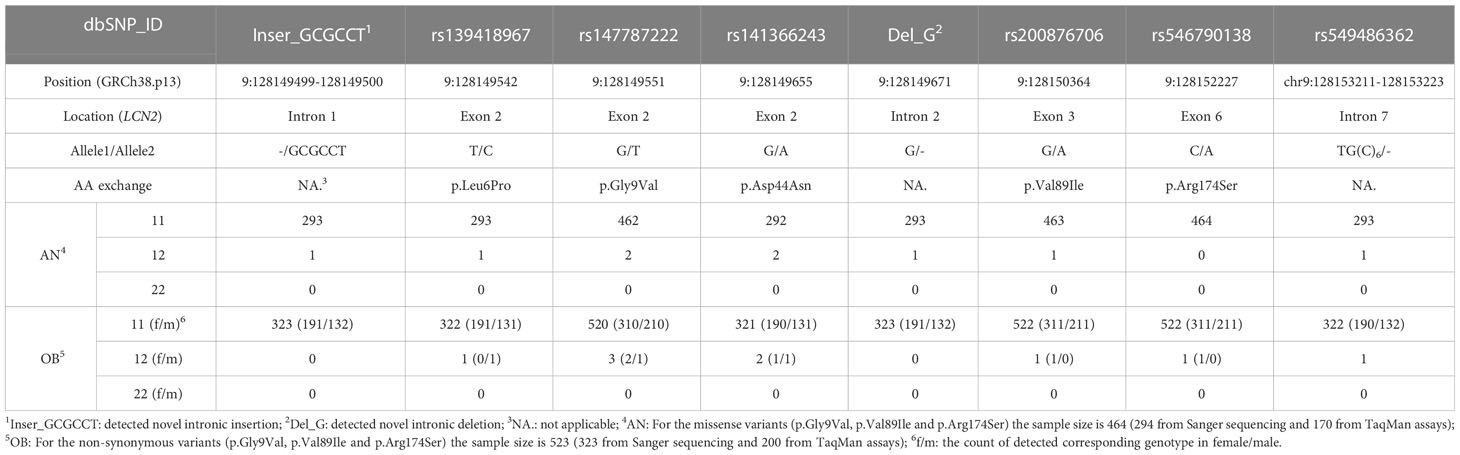
Table 2 The genotype distribution of detected missense and structure variants in LCN2 via Sanger sequencing and TaqMan assays.
3.2 In-silico analyses
3.2.1 Analyses for LCN2 variants
3.2.1.1 Association analysis for detected LCN2 variants and obesity or AN
All detected variants were in HWE. None of the detected variants was associated with AN nor obesity (Supplementary Material Tables 6-1, 2).
3.2.1.2 Two missense LCN2 variants with putative functional consequences
The in-silico analyses were applied in three dimensions deleteriousness analyses on nucleotide changes (seven predictors), putative splicing site alteration analyses (two predictors) and likelihood of protein stability reduction due to single amino acid changes (four predictors). When the detected variants were predicted as pathogenic in at least one predictor of all three dimensions and Cper. value higher than 85%, we assumed that the variant may have functional consequences. As shown in Table 3 (detailed data shown in Supplementary Materials Tables7–9), the two missense variants (p.Leu6Pro and p.Gly9Val) are highly conserved with Cper. values above 90% and were predicted as pathogenic in all in-silico analyses dimensions.
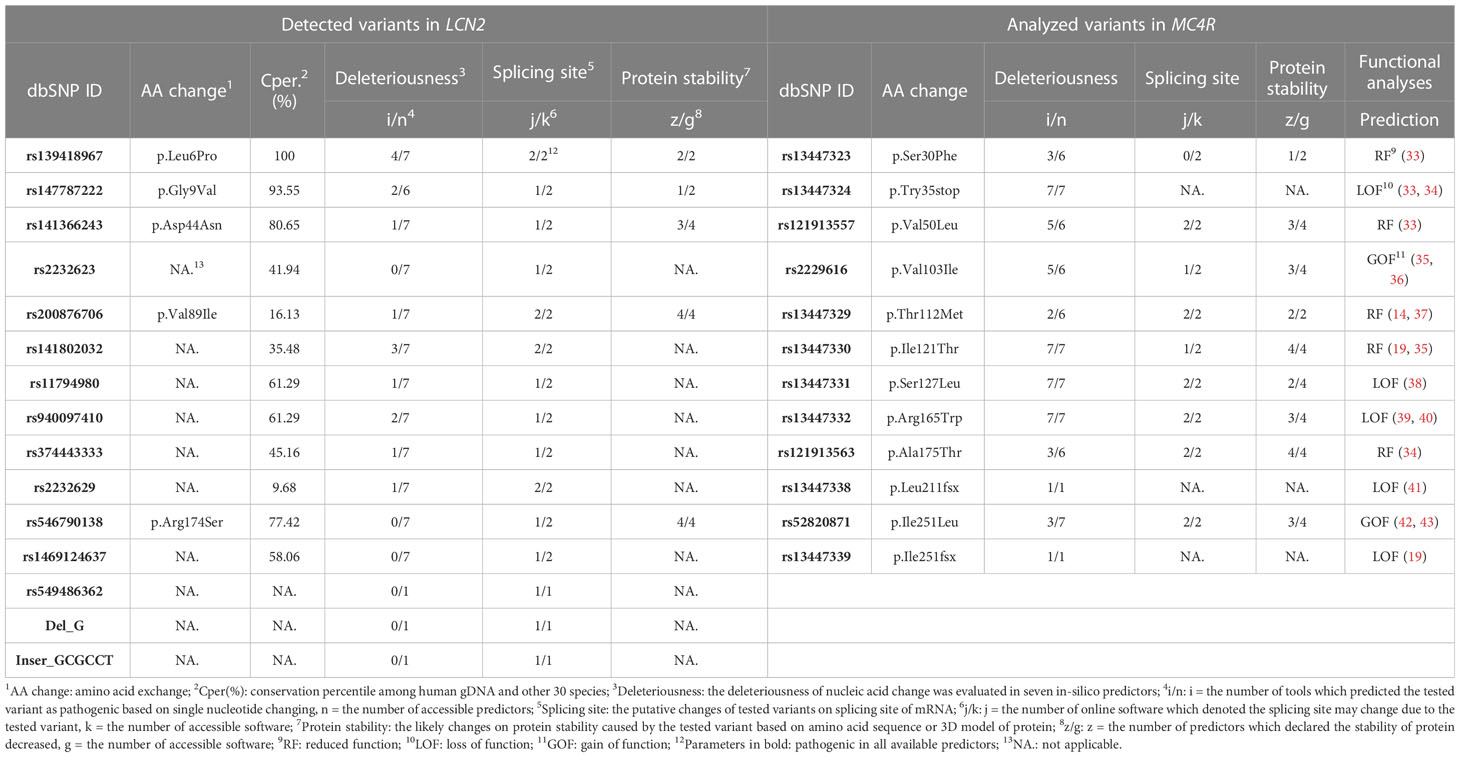
Table 3 In-silico analyses for detected variants in LCN2 and those MC4R variants subjected to ELISA assays.
3.2.1.3 One detected intronic variant in strong linkage disequilibrium with one BMI GWAS hit
Two GWAS summary statistic datasets [BMI GWAS by Pulit et al. (29) and AN GWAS by Watson et al. (30)] were used to analyze the putative association between LCN2 and the two traits. Thus, the plots of the LCN2 genomic region ± 500kb denoted that no AN and BMI GWAS hit located within LCN2 and a few variants in the downstream ~ 100kb associated with BMI [(plots are shown in Supplementary Material Figure 1)], data extracted from GWAS were collected in Supplementary Material Tables 1, 2. The detected variants with dbSNP IDs and those BMI GWAS hits were calculated LD scores in LDmatrix (Supplementary Material Figure 2, Table 10-1, 2).
One detected frequent intronic SNP rs11794980 and one GWAS hit rs2502728 are in strong linkage disequilibrium (R2 = 0.346; D’ = 0.622). LDpair showed the haplotypes of these two SNPs (Supplementary Material Figure 3]). BMI GWAS hit rs2502728(T) minor allele is in LD with rs11794980(C) allele (χ2 test for haplotypes p < 0.0001, distance between two SNPs: ~ 59 kb). The allele T of rs2502728 is associated with increased BMI in the combined sexes GWAS (p = 3.28 × 10⁻⁸, β = 0.0097) (29). Other detected variants with known dbSNP IDs were analyzed for haplotype formation with rs11794980 (LDpair tool). All of them are in linkage equilibrium with rs11794980 (Supplementary Material Tables10-3.
3.2.1.4 Missense variants causing secondary structure changes in LCN2
All five mutated and wildtype amino acid sequences of lipocalin-2 were evaluated in PredictProtein (44). The secondary protein structure is relatively robust and over 50%-80% of point variants may not significantly change the two- and three-dimensional structure of a protein (45). For all five detected point missense variants in LCN2 the secondary elements were not altered (Supplementary Material Tables 9-4). Only the solvent accessibility of polymorphism p.Val89Ile was predicted as ‘exposed’ instead of ‘buried’. Solvent accessibility is essential for determining protein folding patterns and stability in structural bioinformatics (46). Variants p.Leu6Pro and p.Gly9Val are located in the signal peptide region of lipocalin-2. Signal peptides mediate the targeting of precursor secretory proteins to the correct organelle, such as cell membrane or endoplasmic reticulum (47). Besides, it was demonstrated that signal peptides control the secretion of protein by preventing the premature or misfolding of secretory proteins (48).
3.2.2 Analyses for MC4R missense variants
Twelve NSVs in MC4R were analyzed with ELISA assays. Based on the previous studies on functions of variants, including three frameshift variants, they were classified into GOF (two NSVs), RF (five NSVs) and LOF (five NSVs). Based on the in-silico prediction eight of the nine single nucleotide alterations were predicted as pathogenic in all dimensions [(Table 3, detailed information in Supplementary Material Tables 11, 12)].
3.3 ELISA assays for lipocalin-2 serum levels
Circulating lipocalin-2 levels were measured in two heterozygous LCN2-variant carriers (p.Val89Ile and p.Asp44Asn), 33 MC4R-variant carriers and 33 female matched controls (age/LBM%/diagnosis) without MC4R or LCN2 variants.
3.3.1 Negative correlation between BMI and LBM%
All 68 analyzed individuals were plotted in Figure 3 with lipocalin-2 levels and BMI or LBM%. The analyzed group was firstly divided by diagnosis, no difference could be observed between healthy-lean individuals and the females with acute or recovered AN (Supplementary Material Figure 4, Supplementary Material Tables 13-2). The analyzed group was then divided into lean (both healthy lean individuals and females with AN were included) and obese groups (the patients with obesity). There was no overlap between the lipocalin-2 serum concentrations between the two groups. The opposite pattern of lipocalin-2 scaled by BMI and LBM% were shown. BMI was negatively correlated with LBM% (Spearman’s rho = -0.975, p < 0.001), whereas BMI was positively correlated with LBM (Spearman’s rho = 0.866, p < 0.001) based on 33 individuals without variants in the MC4R and LCN2 genes. Thus, the LBM of patients with obesity increased with BMI, while the percentage of LBM decreased (Supplementary Material Tables 13-1). However, no correlation between BMI or LBM% and lipocalin-2 serum levels could be observed (Supplementary Material Tables 13-1).
3.3.2 Low lipocalin-2 level in the LCN2-p.Val89Ile carrier
The genotypes and phenotypes of included individuals are shown in the Supplementary Materials Tables 4-1. In two individuals who carried LCN2 variants (p.Asp44Asn heterozygote in a female with acute AN and p.Val89Ile heterozygote in a female recovered from AN) lipocalin-2 levels were analyzed. We detected a low concentration of serum lipocalin-2 in the p.Val89Ile heterozygous carrier. This female had a lower lipocalin-2 level (average value: 12.5 ng/ml) than the lower bound of the 95% CI for lean individuals (50.47 ng/ml), and its matched controls (average value: 57.36 ng/ml) (Supplementary Material Tables 4-1-3).
3.3.3 No significant effect of MC4R missense variants on lipocalin-2 levels
The MC4R variants with functional classifications were divided into three groups (GOF: gain of function, RF: reduced function, LOF: loss of function) and concentration of lipocalin-2 in serum (ng/ml) within each group was described (Supplementary Material Tables 4-1). The two non-synonymous MC4R polymorphisms (p.Val103Ile and p.Ile251Leu) lead to a gain of function (19, 35, 36, 42, 43). Detected LOF MC4R mutations in our previous studies consisted of two non-synonymous variants [p.Ser127Leu (38), p.Arg165Trp (39, 40)] and three frameshift mutations [p.Try35stop (33, 34), p.Leu211fsX (41), p.Ile251fsX (19)]. Besides, five non-synonymous variants [p.Ser30Phe (33), p.Val50Leu (33), p.Thr112Met (14, 37), p.Ile121Thr (19, 35), p.Ala175Thr (34)] with reduced MC4R protein function were included. The MC4R variants which lead to reduced function were considered together (RF and LOF) in Figure 3. However, there is no significant difference between RF/LOF and GOF.
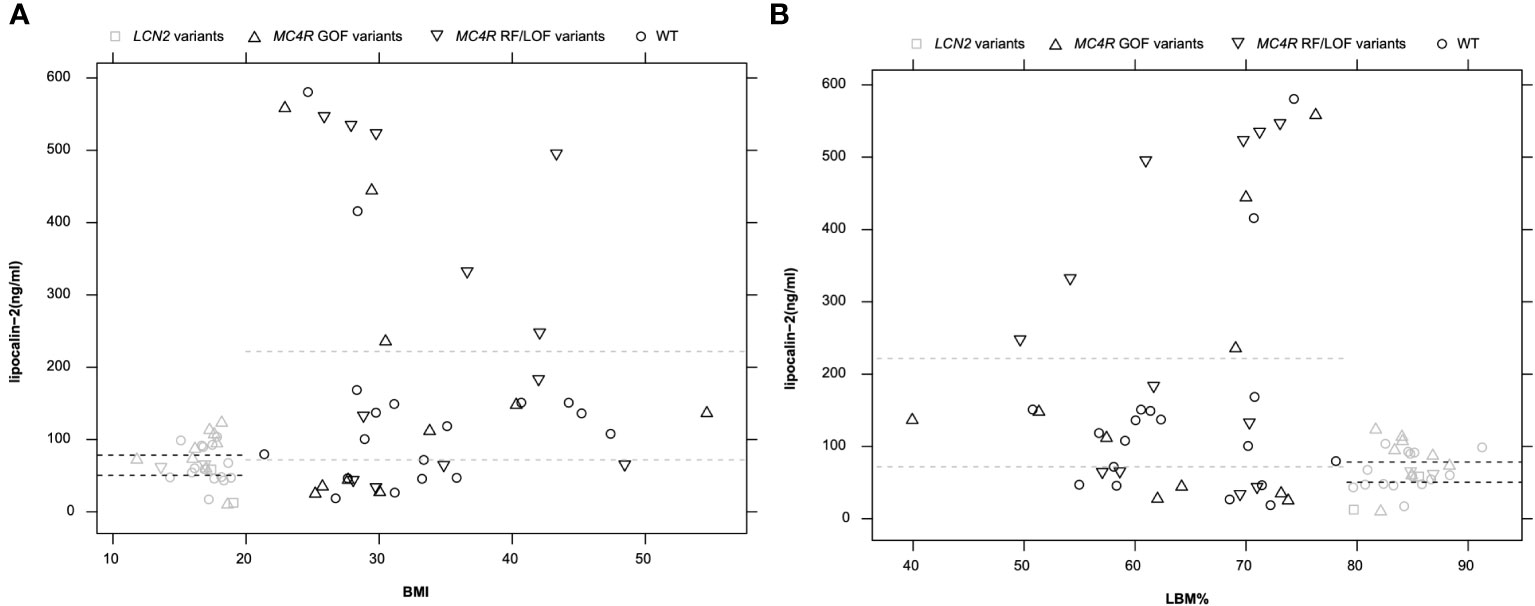
Figure 3 Circulating lipocalin-2 level in 68 analyzed individuals including LCN2-variant carriers (n = 2), MC4R-variant carriers (n = 33), and individuals without variant in these two genes (n = 33). (A): The pattern of lipocalin-2 levels of all samples was shown along with BMI. (B): LBM% as a scaled parameter for lipocalin-2 levels (one sample, p.Val103Ile_k, was excluded from this figure due to missing LBM% value). Dashed lines indicate the 95% CI of lipocalin-2 in serum in groups of individuals with leanness or obesity. Black symbols indicate obese individuals and grey symbols indicate individuals with leanness.
3.3.4 Positive correlation between BMI and lipocalin-2 levels
Figure 3 showed a clear difference between patients with obesity and those with low BMI (healthy lean and patients with AN). The independent samples Mann-Whitney U tests were applied in subgroups to reveal the impact of MC4R variants or body shape on lipocalin-2 levels. To exclude the effects of variants, the test was first examined in individuals with normal LCN2 and MC4R genotypes (Supplementary Material Tables 13-3). Increased lipocalin-2 levels (p = 0.033) could be observed between individuals with obesity (n = 18) compared to lean individuals (n = 15). When the effects of MC4R variants were considered, BMI in the individuals with MC4R variants between lean (n = 11) and individuals with obesity (n = 22) was not significant (p = 0.105) (Supplementary Material Tables 13-4).
3.4 Additional genotyping for the LCN2-p.Val89Ile variant
The circulating lipocalin-2 level of the patient recovered from AN who carried the rare LCN2 NSV p.Val89Ile heterozygously (12.5 ng/ml) was reduced compared to the lower bound of 95% CI of lean individuals (lower bound: 50.47 ng/ml), the mean value of two matched controls (57.36 ng/ml), and one female with acute AN who carried another LCN2 missense variant (p.Asn44Asp, 58.45 ng/ml). Thus, a TaqMan assay ensued for p.Val89Ile in an additional study group (170 female patients with AN [acute and recovered] and 200 children or adolescents with severe obesity). We detected a female patient with severe obesity also heterozygous for p.Val89Ile. However, a serum sample of this patient was not available (Table 2).
4 Discussion
Numerous studies showed elevated lipocalin-2 levels in patients with obesity (11, 49, 50). Lipocalin-2 is highly expressed by fat cells both in-vivo and in-vitro (10). Mosialou et al. described that lipocalin-2 regulates body weight by binding to the MC4R in the hypothalamus (11). In our study, Sanger sequencing for the LCN2 gene, in-silico analyses for detected variants, and ELISA assays for LCN2 or MC4R variants carriers and matched controls were performed.
4.1 LCN2 is associated with both body weight regulation and AN
By Sanger sequencing, 14 variants were detected in LCN2. Two missense variants (p.Leu6Pro and p.Gly9Val) were highly conserved. predicted as pathogenic in all dimensions of in-silico tools and located in the signal peptide structure of lipocalin-2. Thus, they are highly likely to induce functional consequences for protein structure and function. A detected frequent intronic SNP rs11794980 strongly linked to one BMI GWAS hit rs2502728 (R2 = 0.346, D’ = 0.622) (29). Allele C of rs11794980 is likely to be inherited with the minor allele T of rs2502728 which is associated with increased BMI (combined sexes BMI: β = 0.0097, p = 3.3 x 10⁻⁸) (29). Thus, the infrequent C allele rs11794980 may be associated with increase body weight.
4.2 Non-synonymous variant p.Val89Ile in LCN2 may decrease circulating lipocalin-2 level
Due to the serum sample limitation, only for two of five non-synonymous LCN2 variants (p.Asp44Asn and p.Val89Ile) ELISA assays were used to evaluate circulating lipocalin-2 levels in heterozygous carriers. Lipocalin-2 is mainly secreted by osteoblasts and the ratio of adipocytes to bone cells can be reflected by adipose marrow (22). MRI assessments showed that the adipose marrow increased in patients with acute AN (51, 52), and no difference was observed between patients with recovered AN and healthy individuals (53). Moreover, the two variants were predicted as pathogenic in all three dimensions of computational annotations, whereas p.Asp44Asn is in a higher conservation position (80.65%) than p.Val89Ile (16.13%). Thus, we expected p.Asp44Asn may decrease the stability of lipocalin-2 and downregulate lipocalin-2 levels. However, lower serum level of lipocalin-2 was detected in the heterozygote of p.Val89Ile.
LCN2-p.Val89Ile may change the solvent accessibility of protein from ‘buried’ to ‘exposed’. Around 67% of wild type amino acid residues related to diseases were located in the buried position of protein (54), which may imply that the solvent accessibility of the 89th amino acid of lipocalin-2 has an impact on protein structure and might be associated with diseases. Moreover, the hydrophobic scale of isoleucine is higher than valine depending on all five popular calculation methods (55–59). ELISA assays of the p.Val89Ile NSV carrier (one female recovered from AN) showed a lower lipocalin-2 level in serum than all other comparable groups (lower bound of 95% CI, matched controls, another LCN2 NSV carrier). The low expression level of lipocalin-2 may be due to the changed solvent accessibility and decreased protein stability.
4.3 Multiple factors can influence lipocalin-2 levels in wildtype LCN2 individuals
Lipocalin-2 is secreted by hematopoietic and BMA cell types. The bone mass of young premenopausal women is significantly correlated to LBM (22–24, 60). Thus, when bone mass cannot be measured, LBM can be used as an indicator of presumed bone mass and the amount of lipocalin-2 secretion. LBM is influenced directly by body weight. Thus we used normalized LBM (LBM%, normalized by body weight). LBM% and BMI are significantly negatively correlated. Here, we analyzed LBM% and BMI in all individuals screened for lipocalin-2 level. However, the calculation of LBM in our study is based on formulas and might lead to inaccurate or ambiguous results. In future investigations, an actual bone mass and body composition could be determined by MRI and may show a more defined correlation between body composition and lipocalin-2 levels.
4.3.1 High BMI is a factor that can influence lipocalin-2 serum levels
A previous study reported that lipocalin-2 levels were positively correlated to BMI (50). We hypothesized significantly different lipocalin-2 levels existed in individuals with low BMI (healthy lean individuals and females with AN) and patients with obesity. Mean serum lipocalin-2 levels were increased in obese versus lean individuals (p = 0.033). Thus, lipocalin-2 levels in individuals (normal genotypes at LCN2 and MC4R, excluded the impact of NSVs) with a BMI above 30 kg/m2 or BMI percentile greater than 97th are likely to have a higher lipocalin-2 concentration in serum than controls with normal body weight. In future investigations, it might be possible to use MRI or dual-energy X-ray absorptiometry to determine the actual bone mass of individuals, which may show a clearer pattern between body composition and lipocalin-2 levels. Previous studies reported that the putatively negative correlation between BMA percentile and lipocalin-2 levels (22, 61) and the increased BMA percentile in patients with acute AN and severe obesity (22, 52, 62), determination of the bone components may reveal the impact of diseases on lipocalin-2 secretion.
4.3.2 MC4R variants may influence lipocalin-2 levels
Although tests for the impact of MC4R variants were not significant in both groups (lean or obese individuals), the non-significance might be due to the multi-direction of MC4R variants on the protein function (GOF, RF, or LOF). The small sample size reduces the power of our analysis and limits the analysis methods that can be used. Thus, it is impossible to analyze the impact of MC4R variants according to variants catalogs or single variants.
Many genes are involved in the leptin-melanocortin pathway that has been associated with monogenic obesity through their influence on food intake and energy expenditure (63). Thus, the varied expression of MC4R may affect lipocalin-2 expression and the increasing BMI or decreasing LBM% can elevate lipocalin-2 in serum secretion. However, the mutations of diminished function may be compensated by other factors so that the potential pattern of lipocalin-2 secretion is not observed. Thus, we cannot confirm that a feedback loop exists between lipocalin-2 and MC4R, but the results of ELISA implied that protein function changes of MC4R might influence lipocalin-2 concentration in serum.
Limitations of our study include the relatively low number of mutation carriers that could be used for the lipocalin level analyses and the lack of functional in-vitro studies.
5 Conclusion
We detected fourteen variants in LCN2, including five non-synonymous variants. The highly conserved variants p.Leu6Pro and p.Gly9Val are located in the signal peptide region of the lipocalin-2 and might result in functional consequences. According to the GWAS datasets, LD analyses, and gene network look-up, LCN2 might be relevant for both AN and body weight regulation. A low lipocalin-2 level in the female who carried LCN2 NSVp.Val89Ile and recovered from AN was observed. This might be caused by decreased protein stability, the increased hydrophobic scale of the protein and altered solvent accessibility. The ELISA assays of all MC4R and LCN2 wildtype samples implied increased lipocalin-2 levels in the individuals with high BMI (p = 0.033). Although no clear pattern of impacts of single MC4R variants on lipocalin-2 levels was found, an additional ELISA assay with an expanding sample size of variant carriers may reveal the masked pathway between LCN2 and MC4R.
Data availability statement
The original contributions presented in the study are included in the article/Supplementary Material. Further inquiries can be directed to the corresponding author.
Ethics statement
Written informed consent was given by all underage participants and in case of minors by their parents. The study was approved by the Ethics committees of the Universities of Essen, Marburg, Aachen, Dresden, Frankfurt, Hannover, Heidelberg, Tübingen and Würzburg and was performed in accordance with the Declaration of Helsinki.
Author contributions
YZ and AH designed the study. DF, ST, BH-D, JS, MdZ, WH, SE, SZ, KG, KE, RB, and MF recruited the probands. YZ and AH were responsible with the experimental design. YZ and JG performed the molecular genetic experiments and assembled the datasets. DZ and MK performed the ELISA analysis. YZ performed the bioinformatic analyses. YZ and TP performed the statistical analyses. YZ, LR, JH, SA-L and AH interpreted the data. YZ wrote the draft of the manuscript and included input of all authors. All authors contributed to the article and approved the submitted version.
Funding
This study was funded by the Deutsche Forschungsgemeinschaft (DFG; HI 865/2-1), the BMBF (01GS0820; PALGER 2017-33: 01DH19010) and the Stiftung Universitätsmedizin Essen.
Acknowledgments
We thank all participants for their participation. We are further indebted to Sieglinde Düerkop for her excellent technical support.
Conflict of interest
The authors declare that the research was conducted in the absence of any commercial or financial relationships that could be construed as a potential conflict of interest.
Publisher’s note
All claims expressed in this article are solely those of the authors and do not necessarily represent those of their affiliated organizations, or those of the publisher, the editors and the reviewers. Any product that may be evaluated in this article, or claim that may be made by its manufacturer, is not guaranteed or endorsed by the publisher.
Supplementary material
The Supplementary Material for this article can be found online at: https://www.frontiersin.org/articles/10.3389/fendo.2023.1137308/full#supplementary-material
References
1. Hill JO, Wyatt HR, Peters JC. Energy balance and obesity. Circulation (2012) 126(1):126–32. doi: 10.1161/CIRCULATIONAHA.111.087213
2. World Health Organization. Physical status: the use and interpretation of anthropometry. Report of a WHO Expert Committee. World Health Organ Tech Rep Ser. (1995) 845:1–452.
3. Monteleone P, Tortorella A, Martiadis V, Serritella C, Fuschino A, Maj M. Opposite changes in the serum brain-derived neurotrophic factor in anorexia nervosa and obesity. Psychosomatic Med (2004) 66(5):744–8. doi: 10.1097/01.psy.0000138119.12956.99
4. World Health Organization. Obesity: preventing and managing the global epidemic. Report of a WHO Consultation. World Health Organ Tech Rep Ser. (2000) 894:i–253.
5. Ogden CL, Carroll MD, Curtin LR, Lamb MM, Flegal KM. Prevalence of high body mass index in US children and adolescents, 2007-2008. Jama (2010) 303(3):242–9. doi: 10.1001/jama.2009.2012
6. World Health Organization. The international statistical classification of diseases and health related problems ICD-10: Tenth revision Vol. 1. Tabular List: World Health Organization (2004).
8. American Psychiatric Association D, Association AP. Diagnostic and statistical manual of mental disorders: DSM-5. Washington, DC: American Psychiatric Association (2013).
9. Ogden CL, Yanovski SZ, Carroll MD, Flegal KM. The epidemiology of obesity. Gastroenterology (2007) 132(6):2087–102. doi: 10.1053/j.gastro.2007.03.052
10. Yan Q-W, Yang Q, Mody N, Graham TE, Hsu C-H, Xu Z, et al. The adipokine lipocalin 2 is regulated by obesity and promotes insulin resistance. Diabetes (2007) 56(10):2533–40. doi: 10.2337/db07-0007
11. Mosialou I, Shikhel S, Liu J-M, Maurizi A, Luo N, He Z, et al. MC4R-dependent suppression of appetite by bone-derived lipocalin 2. Nature (2017) 543(7645):385–90. doi: 10.1038/nature21697
12. Hinney A, Volckmar A-L, Knoll N. Chapter five - melanocortin-4 receptor in energy homeostasis and obesity pathogenesis. In: Tao Y-X, editor. Progress in molecular biology and translational science, vol. 114 . Academic Press (2013). p. 147–91.
13. Chami N, Preuss M, Walker RW, Moscati A, Loos RJ. The role of polygenic susceptibility to obesity among carriers of pathogenic mutations in MC4R in the UK biobank population. PloS Med (2020) 17(7):e1003196. doi: 10.1371/journal.pmed.1003196
14. Hinney A, Bettecken T, Tarnow P, Brumm H, Reichwald K, Lichtner P, et al. Prevalence, spectrum, and functional characterization of melanocortin-4 receptor gene mutations in a representative population-based sample and obese adults from Germany. J Clin Endocrinol Metab (2006) 91(5):1761–9. doi: 10.1210/jc.2005-2056
15. Lucas N, Legrand R, Bôle-Feysot C, Breton J, Coëffier M, Akkermann K, et al. Immunoglobulin G modulation of the melanocortin 4 receptor signaling in obesity and eating disorders. Trans Psychiatry (2019) 9(1):1–13. doi: 10.1038/s41398-019-0422-9
16. Huszar D, Lynch CA, Fairchild-Huntress V, Dunmore JH, Fang Q, Berkemeier LR, et al. Targeted disruption of the melanocortin-4 receptor results in obesity in mice. Cell (1997) 88(1):131–41. doi: 10.1016/S0092-8674(00)81865-6
17. Yeo GS, Farooqi IS, Aminian S, Halsall DJ, Stanhope RG, O'Rahilly S. A frameshift mutation in MC4R associated with dominantly inherited human obesity. Nat Genet (1998) 20(2):111–2. doi: 10.1038/2404
18. Vaisse C, Clement K, Guy-Grand B, Froguel P. A frameshift mutation in human MC4R is associated with a dominant form of obesity. Nat Genet (1998) 20(2):113–4. doi: 10.1038/2407
19. Hinney A, Hohmann S, Geller F, Vogel C, Hess C, Wermter A-K, et al. Melanocortin-4 receptor gene: case-control study and transmission disequilibrium test confirm that functionally relevant mutations are compatible with a major gene effect for extreme obesity. J Clin Endocrinol Metab (2003) 88(9):4258–67. doi: 10.1210/jc.2003-030233
20. Farooqi IS. Monogenic human obesity syndromes. Handb Clin Neurol (2021) 181:301–10. doi: 10.1016/B978-0-12-820683-6.00022-1
21. Morell-Azanza L, Ojeda-Rodríguez A, Giuranna J, Azcona-SanJulián MC, Hebebrand J, Marti A, et al. Melanocortin-4 receptor and lipocalin 2 gene variants in Spanish children with abdominal obesity: effects on BMI-SDS after a lifestyle intervention. Nutrients (2019) 11(5):960. doi: 10.3390/nu11050960
22. Veldhuis-Vlug AG, Rosen CJ. Clinical implications of bone marrow adiposity. J Internal Med (2018) 283(2):121–39. doi: 10.1111/joim.12718
23. Khosla S, Atkinson EJ, Riggs BL, Melton LJ III. Relationship between body composition and bone mass in women. J Bone Mineral Res (1996) 11(6):857–63. doi: 10.1002/jbmr.5650110618
24. Sayers A, Tobias JH. Fat mass exerts a greater effect on cortical bone mass in girls than boys. J Clin Endocrinol Metab (2010) 95(2):699–706. doi: 10.1210/jc.2009-1907
25. Sawyer SM, Azzopardi PS, Wickremarathne D, Patton GC. The age of adolescence. Lancet Child Adolesc Health (2018) 2(3):223–8. doi: 10.1016/S2352-4642(18)30022-1
26. Volckmar A-L, Han CT, Pütter C, Haas S, Vogel CIG, Knoll N, et al. Analysis of genes involved in body weight regulation by targeted re-sequencing. PloS One (2016) 11(2):e0147904. doi: 10.1371/journal.pone.0147904
27. Sina M, Hinney A, Ziegler A, Neupert T, Mayer H, Siegfried W, et al. Phenotypes in three pedigrees with autosomal dominant obesity caused by haploinsufficiency mutations in the melanocortin-4 receptor gene. Am J Hum Genet (1999) 65(6):1501–7. doi: 10.1086/302660
28. Cunningham F, Allen JE, Allen J, Alvarez-Jarreta J, Amode MR, Armean Irina M, et al. Ensembl 2022. Nucleic Acids Res (2021) 50(D1):D988–95. doi: 10.1093/nar/gkab1049
29. Pulit SL, Stoneman C, Morris AP, Wood AR, Glastonbury CA, Tyrrell J, et al. Meta-analysis of genome-wide association studies for body fat distribution in 694 649 individuals of European ancestry. Hum Mol Genet (2018) 28(1):166–74. doi: 10.1093/hmg/ddy327
30. Watson HJ, Yilmaz Z, Thornton LM, Hübel C, Coleman JR, Gaspar HA, et al. Genome-wide association study identifies eight risk loci and implicates metabo-psychiatric origins for anorexia nervosa. Nat Genet (2019) 51(8):1207–14. doi: 10.1038/s41588-019-0439-2
31. Machiela MJ, Chanock SJ. LDlink: A web-based application for exploring population-specific haplotype structure and linking correlated alleles of possible functional variants. Bioinformatics (2015) 31(21):3555–7. doi: 10.1093/bioinformatics/btv402
33. Lubrano-Berthelier C, Durand E, Dubern B, Shapiro A, Dazin P, Weill J, et al. Intracellular retention is a common characteristic of childhood obesity-associated MC4R mutations. Hum Mol Genet (2003) 12(2):145–53. doi: 10.1093/hmg/ddg016
34. Larsen LH, Echwald SM, Sørensen TI, Andersen T, Wulff BS, Pedersen O. Prevalence of mutations and functional analyses of melanocortin 4 receptor variants identified among 750 men with juvenile-onset obesity. J Clin Endocrinol Metab (2005) 90(1):219–24. doi: 10.1210/jc.2004-0497
35. Xiang Z, Proneth B, Dirain ML, Litherland SA, Haskell-Luevano C. Pharmacological characterization of 30 human melanocortin-4 receptor polymorphisms with the endogenous proopiomelanocortin-derived agonists, synthetic agonists, and the endogenous agouti-related protein antagonist. Biochemistry (2010) 49(22):4583–600. doi: 10.1021/bi100068u
36. Nowacka-Woszuk J, Cieslak J, Skowronska B, Majewska KA, Stankiewicz W, Fichna P, et al. Missense mutations and polymorphisms of the MC4R gene in polish obese children and adolescents in relation to the relative body mass index. J Appl Genet (2011) 52(3):319–23. doi: 10.1007/s13353-011-0036-2
37. Xiang Z, Litherland SA, Sorensen NB, Proneth B, Wood MS, Shaw AM, et al. Pharmacological characterization of 40 human melanocortin-4 receptor polymorphisms with the endogenous proopiomelanocortin-derived agonists and the agouti-related protein (AGRP) antagonist. Biochemistry (2006) 45(23):7277–88. doi: 10.1021/bi0600300
38. Calton MA, Ersoy BA, Zhang S, Kane JP, Malloy MJ, Pullinger CR, et al. Association of functionally significant melanocortin-4 but not melanocortin-3 receptor mutations with severe adult obesity in a large north American case–control study. Hum Mol Genet (2009) 18(6):1140–7. doi: 10.1093/hmg/ddn431
39. Granell S, Mohammad S, Ramanagoudr-Bhojappa R, Baldini G. Obesity-linked variants of melanocortin-4 receptor are misfolded in the endoplasmic reticulum and can be rescued to the cell surface by a chemical chaperone. Mol Endocrinol (2010) 24(9):1805–21. doi: 10.1210/me.2010-0071
40. Nijenhuis WA, Garner KM, van Rozen RJ, Adan RA. Poor cell surface expression of human melanocortin-4 receptor mutations associated with obesity. J Biol Chem (2003) 278(25):22939–45. doi: 10.1074/jbc.M211326200
41. Farooqi IS, Keogh JM, Yeo GS, Lank EJ, Cheetham T, O'Rahilly S. Clinical spectrum of obesity and mutations in the melanocortin 4 receptor gene. New Engl J Med (2003) 348(12):1085–95. doi: 10.1056/NEJMoa022050
42. Cole SA, Butte NF, Voruganti VS, Cai G, Haack K, Kent JW Jr., et al. Evidence that multiple genetic variants of MC4R play a functional role in the regulation of energy expenditure and appetite in Hispanic children. Am J Clin Nutr (2010) 91(1):191–9. doi: 10.3945/ajcn.2009.28514
43. Stutzmann F, Vatin V, Cauchi S, Morandi A, Jouret B, Landt O, et al. Non-synonymous polymorphisms in melanocortin-4 receptor protect against obesity: the two facets of a janus obesity gene. Hum Mol Genet (2007) 16(15):1837–44. doi: 10.1093/hmg/ddm132
44. Bernhofer M, Dallago C, Karl T, Satagopam V, Heinzinger M, Littmann M, et al. PredictProtein - predicting protein structure and function for 29 years. Nucleic Acids Res (2021) 49(W1):W535–W40. doi: 10.1093/nar/gkab354
45. Schaefer C, Rost B eds. Predict impact of single amino acid change upon protein structure. BMC genomics. BioMed Central (2012).
46. Lee B, Richards FM. The interpretation of protein structures: Estimation of static accessibility. J Mol Biol (1971) 55(3):379–IN4. doi: 10.1016/0022-2836(71)90324-X
47. Choo KH, Ranganathan S. Flanking signal and mature peptide residues influence signal peptide cleavage. BMC Bioinf (2008) 9(12):1–11. doi: 10.1186/1471-2105-9-S12-S15
48. Kurys G, Tagaya Y, Bamford R, Hanover JA, Waldmann TA. The long signal peptide isoform and its alternative processing direct the intracellular trafficking of interleukin-15. J Biol Chem (2000) 275(39):30653–9. doi: 10.1074/jbc.M002373200
49. Auguet T, Quintero Y, Terra X, Martínez S, Lucas A, Pellitero S, et al. Upregulation of lipocalin 2 in adipose tissues of severely obese women: positive relationship with proinflammatory cytokines. Obesity (2011) 19(12):2295–300. doi: 10.1038/oby.2011.61
50. Mosialou I, Shikhel S, Luo N, Petropoulou PI, Panitsas K, Bisikirska B, et al. Lipocalin-2 counteracts metabolic dysregulation in obesity and diabetes. J Exp Med (2020) 217(10). doi: 10.1084/jem.20191261
51. Cawthorn WP, Scheller EL, Learman BS, Parlee SD, Simon BR, Mori H, et al. Bone marrow adipose tissue is an endocrine organ that contributes to increased circulating adiponectin during caloric restriction. Cell Metab (2014) 20(2):368–75. doi: 10.1016/j.cmet.2014.06.003
52. Bredella MA, Fazeli PK, Miller KK, Misra M, Torriani M, Thomas BJ, et al. Increased bone marrow fat in anorexia nervosa. J Clin Endocrinol Metab (2009) 94(6):2129–36. doi: 10.1210/jc.2008-2532
53. Fazeli PK, Bredella MA, Freedman L, Thomas BJ, Breggia A, Meenaghan E, et al. Marrow fat and preadipocyte factor-1 levels decrease with recovery in women with anorexia nervosa. J Bone Mineral Res (2012) 27(9):1864–71. doi: 10.1002/jbmr.1640
54. Savojardo C, Manfredi M, Martelli PL, Casadio R. Solvent accessibility of residues undergoing pathogenic variations in humans: from protein structures to protein sequences. Front Mol Biosci (2021) 7:460. doi: 10.3389/fmolb.2020.626363
55. Kyte J, Doolittle RF. A simple method for displaying the hydropathic character of a protein. J Mol Biol (1982) 157(1):105–32. doi: 10.1016/0022-2836(82)90515-0
56. Wimley WC, White SH. Experimentally determined hydrophobicity scale for proteins at membrane interfaces. Nat Struct Biol (1996) 3(10):842–8. doi: 10.1038/nsb1096-842
57. Hessa T, Kim H, Bihlmaier K, Lundin C, Boekel J, Andersson H, et al. Recognition of transmembrane helices by the endoplasmic reticulum translocon. Nature (2005) 433(7024):377–81. doi: 10.1038/nature03216
58. Moon CP, Fleming KG. Side-chain hydrophobicity scale derived from transmembrane protein folding into lipid bilayers. Proc Natl Acad Sci USA (2011) 108(25):10174–7. doi: 10.1073/pnas.1103979108
59. Zhao G, London E. An amino acid "transmembrane tendency" scale that approaches the theoretical limit to accuracy for prediction of transmembrane helices: relationship to biological hydrophobicity. Protein Sci (2006) 15(8):1987–2001. doi: 10.1110/ps.062286306
60. Kerr DA, Papalia S, Morton A, Dick I, Dhaliwal S, Prince RL. Bone mass in young women is dependent on lean body mass. J Clin Densitomet (2007) 10(3):319–26. doi: 10.1016/j.jocd.2007.05.001
61. Attané C, Estève D, Chaoui K, Iacovoni JS, Corre J, Moutahir M, et al. Human bone marrow is comprised of adipocytes with specific lipid metabolism. Cell Rep (2020) 30(4):949–58. e6. doi: 10.1016/j.celrep.2019.12.089
62. Cohen A, Dempster DW, Recker RR, Lappe JM, Zhou H, Zwahlen A, et al. Abdominal fat is associated with lower bone formation and inferior bone quality in healthy premenopausal women: a transiliac bone biopsy study. J Clin Endocrinol Metab (2013) 98(6):2562–72. doi: 10.1210/jc.2013-1047
Keywords: Energy homeostasis, bone marrow, secondary structure of protein, GWAS, lean body mass (LBM)
Citation: Zheng Y, Rajcsanyi LS, Kowalczyk M, Giuranna J, Herpertz-Dahlmann B, Seitz J, de Zwaan M, Herzog W, Ehrlich S, Zipfel S, Giel K, Egberts K, Burghardt R, Föcker M, Al-Lahham S, Hebebrand J, Fuhrer D, Tan S, Zwanziger D, Peters T and Hinney A (2023) Lipocalin 2 – mutation screen and serum levels in patients with anorexia nervosa or obesity and in lean individuals. Front. Endocrinol. 14:1137308. doi: 10.3389/fendo.2023.1137308
Received: 04 January 2023; Accepted: 09 March 2023;
Published: 21 March 2023.
Edited by:
Jochen Georg Schneider, University of Luxembourg, LuxembourgReviewed by:
Heike Vogel, German Institute of Human Nutrition Potsdam-Rehbruecke (DIfE), GermanyStephanie Brandt, Ulm University Medical Center, Germany
Copyright © 2023 Zheng, Rajcsanyi, Kowalczyk, Giuranna, Herpertz-Dahlmann, Seitz, de Zwaan, Herzog, Ehrlich, Zipfel, Giel, Egberts, Burghardt, Föcker, Al-Lahham, Hebebrand, Fuhrer, Tan, Zwanziger, Peters and Hinney. This is an open-access article distributed under the terms of the Creative Commons Attribution License (CC BY). The use, distribution or reproduction in other forums is permitted, provided the original author(s) and the copyright owner(s) are credited and that the original publication in this journal is cited, in accordance with accepted academic practice. No use, distribution or reproduction is permitted which does not comply with these terms.
*Correspondence: Yiran Zheng, eWlyYW4uemhlbmdAdWstZXNzZW4uZGU=
†These authors have contributed equally to this work
‡ORCID: Yiran Zheng, orcid.org/0000-0001-7436-8631