 Barbara Zupančič1*†
 Chiedozie Kenneth Ugwoke2†
 Mohamed Elwy Abdelhamed Abdelmonaem1,3Armin Alibegović4
 Erika Cvetko2
 Jože Grdadolnik1
 Anja Šerbec2
 Nejc Umek2*
- 1Laboratory for Molecular Structural Dynamics, Theory Department, National Institute of Chemistry, Ljubljana, Slovenia
- 2Institute of Anatomy, Faculty of Medicine, University of Ljubljana, Ljubljana, Slovenia
- 3Biotechnical Faculty, University of Ljubljana, Ljubljana, Slovenia
- 4Department of Forensic Medicine and Deontology, Faculty of Medicine, University of Ljubljana, Ljubljana, Slovenia
Introduction: The global burden of diabetes mellitus is escalating, and more efficient investigative strategies are needed for a deeper understanding of underlying pathophysiological mechanisms. The crucial role of skeletal muscle in carbohydrate and lipid metabolism makes it one of the most susceptible tissues to diabetes-related metabolic disorders. In tissue studies, conventional histochemical methods have several technical limitations and have been shown to inadequately characterise the biomolecular phenotype of skeletal muscle to provide a holistic view of the pathologically altered proportions of macromolecular constituents.
Materials and methods: In this pilot study, we examined the composition of five different human skeletal muscles from male donors diagnosed with type 2 diabetes and non-diabetic controls. We analysed the lipid, glycogen, and collagen content in the muscles in a traditional manner with histochemical assays using different staining techniques. This served as a reference for comparison with the unconventional analysis of tissue composition using Fourier-transform infrared spectroscopy as an alternative methodological approach.
Results: A thorough chemometric post-processing of the infrared spectra using a multi-stage spectral decomposition allowed the simultaneous identification of various compositional details from a vibrational spectrum measured in a single experiment. We obtained multifaceted information about the proportions of the different macromolecular constituents of skeletal muscle, which even allowed us to distinguish protein constituents with different structural properties. The most important methodological steps for a comprehensive insight into muscle composition have thus been set and parameters identified that can be used for the comparison between healthy and diabetic muscles.
Conclusion: We have established a methodological framework based on vibrational spectroscopy for the detailed macromolecular analysis of human skeletal muscle that can effectively complement or may even serve as an alternative to histochemical assays. As this is a pilot study with relatively small sample sets, we remain cautious at this stage in drawing definitive conclusions about diabetes-related changes in skeletal muscle composition. However, the main focus and contribution of our work has been to provide an alternative, simple and efficient approach for this purpose. We are confident that we have achieved this goal and have brought our methodology to a level from which it can be successfully transferred to a large-scale study that allows the effects of diabetes on skeletal muscle composition and the interrelationships between the macromolecular tissue alterations due to diabetes to be investigated.
1 Introduction
Diabetes mellitus (DM) has become a global epidemic, representing a significant public health challenge in the 21st century with a staggering burden on both healthcare systems and individuals (1, 2). According to the International Diabetes Federation (IDF), 537 million adults (20-79 years) had DM in 2021, and this number is expected to increase to 643 million by 2030. In 2021, DM caused 6.7 million deaths (3). These worrisome realities have prompted a global consensus to halt the rise in diabetes and obesity by 2025 (1), highlighting the urgent need for more effective preventive and therapeutic strategies based on a better understanding of the pathophysiological mechanisms underlying the disease. However, the multifactorial nature of DM, including its complex aetiology and diverse clinical manifestations, presents considerable challenges for diagnosis and treatment.
Among the various organs affected, skeletal muscles play a critical role in the pathophysiology and metabolic complications of DM (4–10). Comprising approximately 40% of the total body mass in humans, skeletal muscles are major contributors to whole-body glucose homeostasis and energy expenditure. As the largest endocrine tissue involved in glucose metabolism, it mediates about 80% of insulin-stimulated glucose uptake (11). Decreased sensitivity for this uptake in skeletal muscle contributes to whole-body metabolic dysregulation and cardiovascular risk and is a core pathophysiological factor in several metabolic phenotypes (12, 13). Skeletal muscles are structurally composed of multiple fascicles or bundles of physiochemically and metabolically distinct fibre types, which are classified based on the expression of different isoforms of the myosin heavy chain (14, 15). Depending on their oxidative and glycolytic capacity, healthy skeletal muscles can rapidly switch between carbohydrate and lipid fuels according to bioenergetic demand. Loss of this flexibility is one of the hallmarks of metabolic diseases (16).
The pathobiochemical changes in diabetic muscle remain a focal point of several studies aiming to clarify the molecular and cellular mechanisms of insulin resistance in diabetes and associated clinical complications. For instance, proteomic profiling of skeletal muscle from diabetic animal models and diabetic human skeletal muscle have been considered in an attempt to identify protein factors to monitor diabetic progression (17). The study by Öhman et al. (18) on the skeletal muscle proteome in biopsies of vastus lateralis muscle showed altered phosphorylation in several signalling pathways in impaired fasting glucose, impaired glucose tolerance and type 2 DM. Gilbert reviewed the role of skeletal muscle lipids in the pathogenesis of insulin resistance in obesity and type 2 DM, but left unanswered the question of whether fatty acids are causative molecular players or markers of reduced insulin sensitivity (19). It has been shown that changes in glucose transport activity appear to stem from disruptions in intramyocellular fatty acid metabolism, where fatty acids induce insulin resistance through a serine kinase cascade activation, resulting in reduced tyrosine phosphorylation of IRS-1 and diminished IRS-1-associated phosphatidylinositol 3-kinase activity, which is crucial for insulin-mediated glucose transport in muscle (20). Most studies agree that it is not intramuscular lipids per se that cause insulin resistance, but rather lipid intermediates such as diacylglycerols, fatty acyl-CoAs and ceramides, and that it is the localisation, composition and turnover of these intermediates that play an important role in the development of insulin resistance and type 2 DM (21–23). Nevertheless, lipid accumulation in skeletal muscle cells is both muscle and fibre-type specific. As shown by Umek et al. (15), intramyocellular lipid accumulation was most pronounced in type 2a and 2x/d fibres of fast-twitch gastrocnemius and intermediate plantaris muscles in obese insulin-resistant mice compared to lean mice, whereas no significant lipid accumulation was observed in the slow-twitch soleus muscle in the obese animals. He et al. (24) reported higher lipid content within each fibre type of muscles from obese and type 2 diabetic subjects. The review by Chang et al. (25) provides insight into the experimental and clinical studies implicating the role of phospholipids in a diverse range of physiological processes, including their role as critical mediators of insulin action on skeletal muscle.
In type 2 DM, a reduction of muscle glycogen was observed, where the deficit was marked in type IIa (fast oxidative) fibres, which make up almost 50% of muscle fibres in vastus lateralis, and was minor in types I and IIb (slow oxidative and fast glycolytic, respectively) fibres (26). A key novel finding by Frankenberg et al. was that the majority of glycogen in human skeletal muscle is loosely bound or cytosolic. The proportion of this diffusible glycogen pool was significantly lower in the type I fibres in type 2 diabetic muscle compared to the control group, whereby the hyperinsulinemic clamp in people with type 2 diabetes had no effect on the proportion of diffusible glycogen (27). In addition, increased collagen content has been identified as a hallmark of insulin-resistant skeletal muscle in overweight and type 2 diabetic individuals. Immunofluorescence staining of muscle biopsies showed increased abundance of type I and III collagen (28–30).
Molecular, histochemical, and immunohistochemical assays are the most commonly employed methods to investigate skeletal muscle changes in DM and other metabolic disorders. However, these techniques have several drawbacks, including the inability to provide a comprehensive molecular profile of the alterations occurring in the tissue and reliance on methods that may introduce subjective interpretation biases (31–33). To overcome these challenges, there is a need for advanced analytical techniques with improved quantitative capabilities, efficiency and objectivity.
Vibrational spectroscopy techniques, such as Fourier-transform infrared (FTIR) spectroscopy, have emerged as powerful tools that can provide a reliable and promising alternative for the analysis of biological tissues (34, 35). The spectra obtained provide highly informative data on tissue composition via characteristic absorption bands that can be used to identify and quantify different macromolecules within a sample. FTIR has the advantage of rapidness and high molecular specificity with minimal sample preparation compared to histochemical analyses (33, 36). This allows sensitive detection of biomolecular changes in many functional groups simultaneously (37). The technique has been successfully applied in diverse biological tissue analysis. For example, for the diagnosis of cutaneous neoplasia and the detection of carcinogenesis-associated bimolecular changes (38–43), for the classification of different subtypes of cancer (44) and for prediction of metastatic behaviour (45, 46). Other examples of the successful application of infrared (IR) spectroscopy include the detection of DM-induced lipid peroxidation in rat liver microsomal membranes (47), noninvasive estimation of blood haemoglobin A1c (HbA1c) levels (48), investigation of biochemical and structural changes in neurodegenerative diseases (49, 50), and other tissue dysfunctions (51–54). Regarding diabetes, the review by Ralbovsky and Lednev summarises the recent applications of vibrational spectroscopy in DM diagnostic research (55). In particular, the potential of FTIR spectroscopy for investigating of various tissues for novel biomarkers in diabetes has been reported, e.g. considering tissues such as blood (56), saliva (57–59), urine (60), bone (61, 62), pulmonary oedema fluid (63). On the other hand, there are studies presenting the use of FTIR to analyse molecular profiles of muscle tissue in animal models (64–66) and human muscle (67, 68). Nevertheless, there are only a few studies that have used FTIR spectroscopy to investigate modifications in muscle tissue associated with DM, and even these have been performed in animal models (69–71).
Our recently published study also focused on the detection of changes in skeletal muscle composition due to obesity with insulin resistance and STZ-induced diabetes in a mouse model using FTIR (72). Building on the lessons and outcomes of this study, in the present work, we aim to transition from our research on metabolic disorders affecting skeletal muscle tissue in animal models and investigate the macromolecular composition of different human skeletal muscles in type 2 DM. In this context, we present an improved methodology that combines FTIR experiments and powerful chemometric tools to study wet samples from five functionally and histologically diverse human skeletal muscles obtained from diabetic and non-diabetic male donors. The improved approach to analysing the FTIR spectra involves a multi-stage decomposition of the IR spectra into several spectral components related to the vibrational properties of the particular biomolecular constituents of skeletal muscle, allowing a detailed characterisation of their composition. We would like to emphasise that this is a pilot study whose main purpose is primarily to establish a solid methodological background for an in-depth analysis of the composition of healthy and diabetic human muscles based on vibrational spectroscopy. With this, we aim to have available a versatile and efficient experimental-chemometric tool for the large-scale study of diabetes-related alterations in skeletal muscle composition in the subsequent of our research.
2 Materials and methods
The study was conducted in accordance with the Declaration of Helsinki. The protocols for the use of human skeletal muscle tissue were reviewed and approved by the Republic of Slovenia National Medical Ethic Committee (Permit No.: 0120-536/2019/4).
2.1 Donors and skeletal muscle samples
Skeletal muscle tissue samples were harvested from 32 deceased adult (≥ 18 years) male bodies, including 16 diabetic (further abbreviated as diabetic group DM) and 16 non-diabetic donors (further abbreviated as control group CO) within 24 hours postmortem during standard autopsy procedures at the Institute of Forensic Medicine, University of Ljubljana, Slovenia. The age structure and body mass index (BMI) of the 16 diabetic male donors and 16 non-diabetic male donors are presented in Figure 1; Supplementary Figure 1 shows their scatterplots. The data are for information only, and their effects were not analysed in this pilot work but will be considered in the scale-up study with larger statistical samples in the next phase of our research. Type 2 DM status was established based on clinical and biochemical evidence from the patients’ medical records. All diabetic patients included had a history of treatment with both oral antidiabetic medications and insulin. Subjects with type 1 DM and other morbidities or recent history of therapy that is known to influence skeletal muscle fibre typology and biochemical composition (e.g. genetic myopathies, chronic heart failure, chronic obstructive pulmonary disease, glucocorticoid treatment, etc.) were excluded. The non-diabetic donors consist of male subjects with no history of diabetes or other conditions known to specifically impact skeletal muscle phenotype. For non-diabetic controls, DM or related glycaemic phenotypes were ruled out based on a thorough examination of the donors’ medical records and additionally confirmed with a normal postmortem result for the glycated haemoglobin (HbA1c), which shows the glycaemic status in the preceding two months. The donors’ basic clinical data, including age, body mass, and height, were recorded, and the obtained samples and data were pseudonymised.
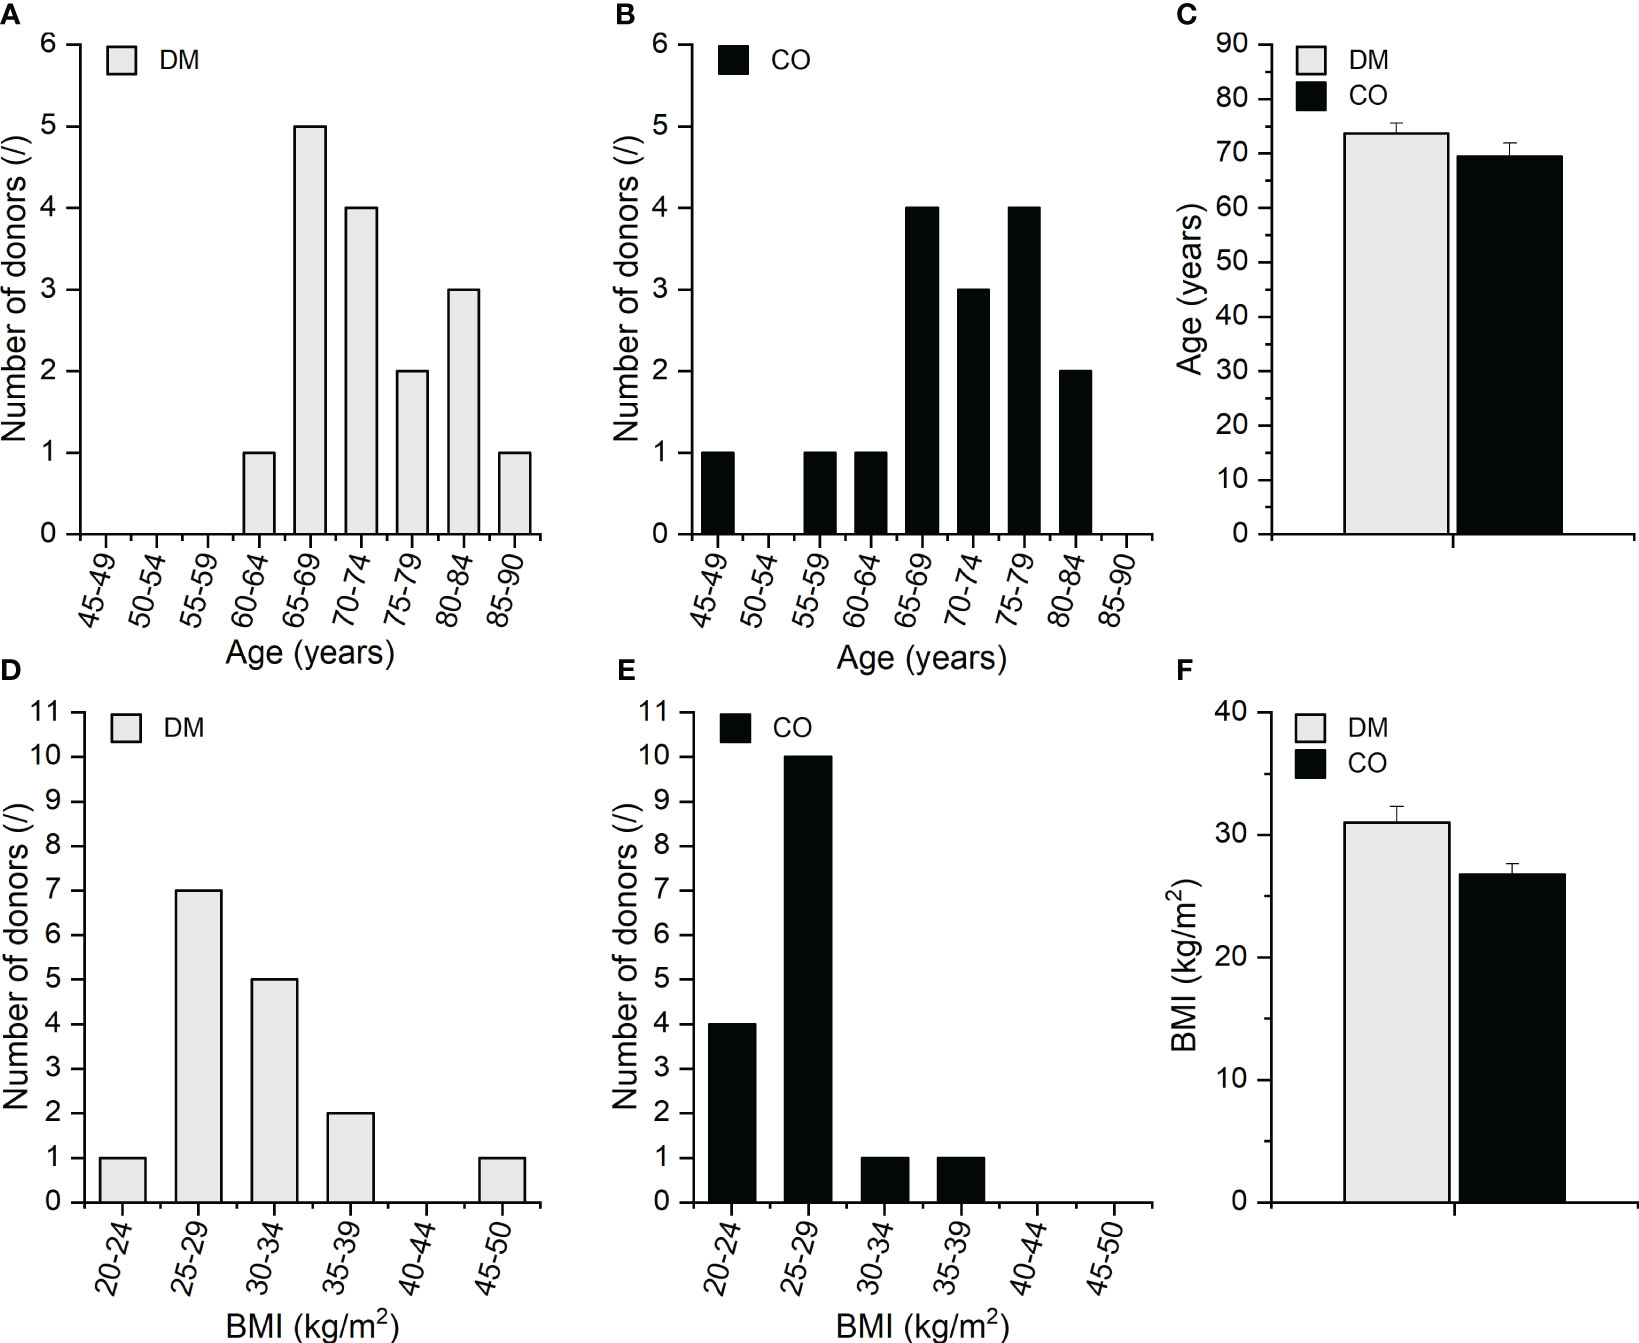
Figure 1 Age distribution of the (A) DM and (B) CO donors; (C) average age of the DM and CO donors, body mass index (BMI) distribution of the (D) DM and (E) CO donors; (F) average BMI of the DM and CO donors. Data in (C, F) are means with standard errors of the mean (SEM).
Five different skeletal muscles, including axial, appendicular, and respiratory muscles, were harvested, i.e. levator scapulae muscle (LEV), splenius capitis muscle (SPL), vastus lateralis muscle (VL), diaphragm (DIA), and external intercostal muscles (EXT). Given the structural, metabolic, and functional diversity of human skeletal muscles, a differential effect of DM on the phenotype of skeletal muscles in different anatomical regions is expected (73). Accordingly, these five functionally distinct skeletal muscles were selected to better understand the heterogeneous effects of DM on various skeletal muscle types. The VL is a commonly studied limb muscle in humans due to its easy accessibility and is, therefore, a reference muscle for biomedical investigations. However, like most locomotor muscles, physical activity status may influence its metabolic phenotype and confound disease-attributable effects (74). The EXT and DIA are respiratory muscles metabolically adapted to sustain continuous activity during life (75). The axial skeletal muscles, such as the LEV and the SPL, are less commonly investigated due to the difficulty of clinical biopsies but may be less profoundly impacted by physical activity than limb muscles. The DIA muscle was harvested from the mid-portion of the muscle along the right midclavicular line; EXT from the sixth intercostal space along the right midclavicular line; LEV from the superior aspect of the left muscle, beneath the superior aspect of the sternocleidomastoid (around C3/4 vertebral levels); SPL from the mid-portion of the left muscle, at the C4 vertebral level, along the plane of the fibres running superolaterally from the proximal attachment at the nuchal ligament to the distal attachment at the mastoid process of the left temporal bone; and VL from the mid-portion of the left muscle, midway between the greater trochanter of the femur and the upper border of the patella. Samples were immediately processed, frozen in liquid nitrogen, and stored at -80°C until sectioning for histochemical assays and spectroscopic measurements.
2.2 FTIR spectroscopy experiments
FTIR spectroscopy measurements were performed in attenuated total reflection (ATR) mode on the Bruker Vertex 80 spectrometer. For ATR sampling, the Specac Golden Gate accessory with a single reflection diamond was used. The temperature of the ATR cell was kept constant at 24°C using the temperature controller. The spectrometer optics and the ATR cell were purged with technical dry nitrogen during the measurements. One ATR-FTIR spectrum was measured for each specimen by averaging 128 interferograms in the range 4000 cm-1–600 cm-1 with a spectral resolution of 2 cm-1 using the software OPUS, version 7.8 (Bruker, Billerica, MA, USA).
One hundred and sixty (160) wet skeletal muscle specimens (5 different muscles from 32 donors) for FTIR measurements were prepared in the form of several 20 μm cryosections with a mass of about 1 mg and stored in microcentrifuge tubes at -20°C before the experiments. The frozen tissue specimen was placed on the ATR cell, and the temperature was allowed to stabilize. In the meantime, it was thoroughly kneaded with a spatula to homogenize the tissue constituents. It was then pressed against the ATR crystal to ensure good contact between the crystal and the tissue. In addition to the spectroscopic measurements of the muscle tissue, the ATR-FTIR spectrum of water was also recorded every time to serve as a reference to delineate the vibrational properties of water and macromolecular components of the wet tissue when analysing spectral data. It should be noted that for certain samples, it was not possible to mechanically remove all the adipose tissue during sample preparation. Therefore, in these cases, the measured FTIR spectra reflected not only the vibrational properties of the skeletal muscle but also those of the adipose tissue. We took this into account and managed to separate the vibrational spectrum of the adipose tissue from the spectra of the skeletal muscle by analysing the spectra chemometrically using a multi-level spectral decomposition, as explained in the sequel.
2.3 FTIR spectral data analysis
The OPUS software version 7.8 (Bruker, Billerica, MA, USA) was used for compensation of atmospheric water and CO2 and for baseline correction of the measured ATR-FTIR spectra of tissue samples and water. No ATR correction was performed. The water spectra measured each time we performed experiments were averaged, and normalisation factors were calculated based on the intensity of the OH stretching peak relative to the intensity of the OH stretching peak of the average water spectrum. These normalisation factors were further used to normalise the ATR-FTIR spectra of skeletal muscles measured on the same occasion as the corresponding water spectrum. The normalised ATR-FTIR spectra (abbreviated as in the following) are presented in Supplementary Figure 2 in the form of average spectrum and the dispersion of the spectra around the average.
We then subjected the normalised spectra to multivariate curve resolution decomposition with alternating least square optimization (MCR-ALS decomposition) using MATLAB software MCR-ALS GUI v4c (76, 77). The decomposition was performed in three steps, where in the first decomposition the spectral component was identified as the one reflecting the vibrational spectrum of the adipose tissue. This component was subtracted from the spectra to treat only the spectra representing the vibrational properties of skeletal muscle tissue in the subsequent steps of the decomposition. The second MCR decomposition step resulted in the spectral component and after its subtraction from the spectra, we obtained the spectral components , and in the third MCR decomposition step. For each decomposition step, more than 99% of the total variance was explained. Thus, after the three-step decomposition, the normalised spectra from the experiments were split into several spectral components as follows.
for
The spectral component in Eq. (1) represents the body water content in skeletal muscle and was not analysed further. In addition, the component , representing adipose tissue, was considered a side result due to sample preparation limitations to completely remove adipose from skeletal muscle.
Eq. (2) represents the vibrational spectra as obtained after removing the spectral components of body water and adipose tissue from the normalised ATR-FTIR spectra, from Eq. (1), i.e.,
for
The three spectral components , and , represent vibrational properties of the skeletal muscle tissue and were used to identify its macromolecular constituents. The term in Eq. (1) represents the remaining part that compensates for the difference from the normalised ATR-FTIR spectra as measured for the wet samples. The weights (concentrations) , , and corresponding to the spectral components , and , respectively, were further elaborated statistically by reporting their mean values with the standard error of the mean (SEM). Two-way mixed ANOVA (with Greenhouse–Geisser correction) was performed for weights , , and to analyse the statistical significance of the effects of skeletal muscle type and diabetes on macromolecular composition. We performed a post-hoc Tukey test to assess the significance of differences between muscles within the group and between DM and CO groups for a given muscle. The level of significance was 0.05.
2.4 Histochemical assays and data analysis
The histochemical analysis of skeletal muscle samples employed 10 μm thick serial transverse cryosections obtained using a Leica CM 1950 microtome (Leica Microsystems, Germany) thermostatically regulated at -25°C. Each section was mounted on a clean slide and examined prior to staining to verify the accuracy of the cross-sectional cuts. Haematoxylin- and eosin-stained slides were used to observe the general tissue morphology, following which semiquantitative methods were employed to assess the lipid, glycogen, and collagen content of the tissue based on previously published protocols (78–83). Sudan black B powder (Sigma-Aldrich Corp, St. Louis, MO, USA), which specifically stains neutral lipids black (78), was used for lipid staining. The Periodic Acid-Schiff (PAS) method described by McManus (81) was employed for staining polysaccharides, including glycogen. The staining of collagen bundles in tissue sections was performed using 0.1% Sirius red in saturated aqueous picric acid, as previously described by Junqueira et al. (83). The stained tissue sections were examined under a Nikon Eclipse 80i microscope (20x objective, numerical aperture: 0.50), which was equipped with an ODC-84 Kern-Sohndigital camera and VIS Pro microscope KERN OXM 902 software (Kern-Sohn, Germany) for image acquisition. A minimum of three randomly sampled fields of view free of artefacts were captured for each muscle section at a resolution of 5440 x 3648 pixels, using consistent settings for all similarly stained sections. Semiquantitative image analysis was performed with ImageJ (http://rsbweb.nih.gov/ij/) software, which can differentiate and precisely quantify areas stained with various colours by analysing and converting the pixels within the image into corresponding area values. The lipid content of the tissue was semiquantitatively assessed using ImageJ software, where the intensity of staining in greyscale mode was measured. The estimation of glycogen content was performed using ImageJ software, where the intensity of staining in the red channel obtained using the colour deconvolution plugin was measured. The mean grey value was calculated after converting the red channel to an 8-bit grayscale image (84). Completely white and completely black areas were assigned values of 0 and 255, respectively. The intensity of colour was expressed as relative intensity calculated as the ratio of measured mean grey value to 255. The collagen content index (defined as 100 times the ratio of the area of collagen-stained skeletal muscle tissue to the cross-sectional area of skeletal muscle tissue) was calculated using the same software by segmenting the red (collagen) and yellow (muscle fibres)-stained tissue with the thresholding and colour deconvolution plugin (82, 84). Two-way mixed ANOVA (with Greenhouse–Geisser correction) was performed for all three skeletal muscle indices (lipid, collagen and glycogen content) to analyse the statistical significance of the effects of skeletal muscle type and DM on macromolecular composition. The post-hoc Tukey test was performed to evaluate the significance of differences between muscles within the group and between DM and CO groups for a given muscle. The level of significance was 0.05. All investigative protocols, including muscle tissue sectioning, staining, and image acquisition and analysis, were performed in a blinded manner throughout the study.
3 Results
3.1 Skeletal muscle composition analysed by FTIR
In the Supplementary Figure 3 we show the spectra after removal of the body water spectral component in the form of an average and the dispersion of the spectra around the average. The images with the most dispersed data (the most pronounced grey shaded area in Supplementary Figure 3) in the regions 3500-2700 cm-1, 1800-1700 cm-1 and 1250-700 cm-1 indicate that this variability stems from variable amount of fats. Indeed, as given in subsections 2.2 and 2.3 of the Materials and methods section, in the first MCR decomposition step we obtained the spectral component , which is presumably attributed to the adipose tissue. This was a part of the samples that could not be mechanically removed from the skeletal muscle tissue during sample preparation. Figure 2 shows this component and the corresponding weights, ad.
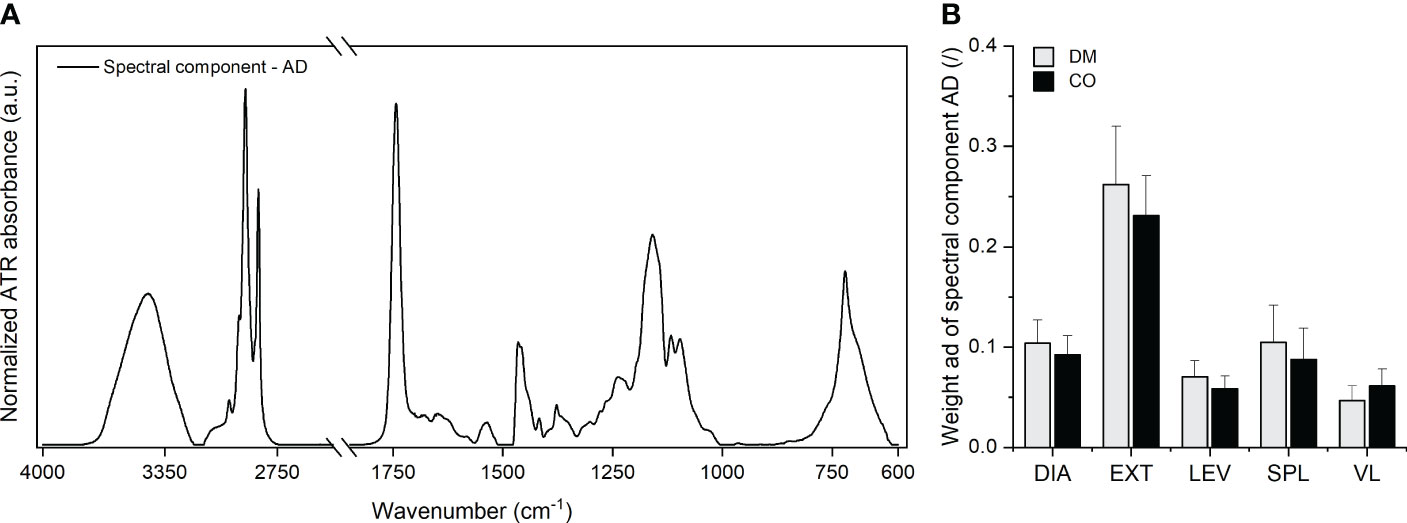
Figure 2 (A) Adipose tissue spectral component and (B) the corresponding weight obtained for five different muscles from 16 diabetic donors (DM group) and 16 non-diabetic donors (CO group) from the first MCR decomposition step. Skeletal muscles are abbreviated as follows: diaphragm (DIA), external intercostal muscles (EXT), levator scapulae muscle (LEV), splenius capitis muscle (SPL), vastus lateralis muscle (VL). Data in (B) are means with standard errors of the mean (SEM).
The absorption bands seen in Figure 2A correspond to the absorption bands observed in the spectra of various animal body fats, as shown in the work of Rohman and Che Man (85). In addition, the spectral component indicates the absorption peaks that are attributable to body water in adipose tissue (OH stretching band in the range between 3000-4000 cm-1), amide I and amide II bands of proteins, nucleic acids (low intensity bands in the range between 900-1000 cm-1). Here, the proportions between the intensities of the absorption bands reflect the proportions of these constituents characteristic of the composition of adipose tissue, as presented in the work of Stroh et al. (86). The weights in Figure 2B determine the amount of adipose tissue in the analysed samples. The bar graphs indicate that the largest amount of adipose tissue was present in the EXT muscle samples. Supplementary Figure 9 shows the corresponding scatterplots of ad and indicates that the EXT muscle samples had larger variance in the amount of adherent adipose tissue than other muscles. These trends are consistent with the challenges we faced in removing adipose tissue during sample preparation.
The spectra obtained after removing the spectral components of body water and adipose tissue [see Eqs. (1) and (2)], are shown in Figure 3.
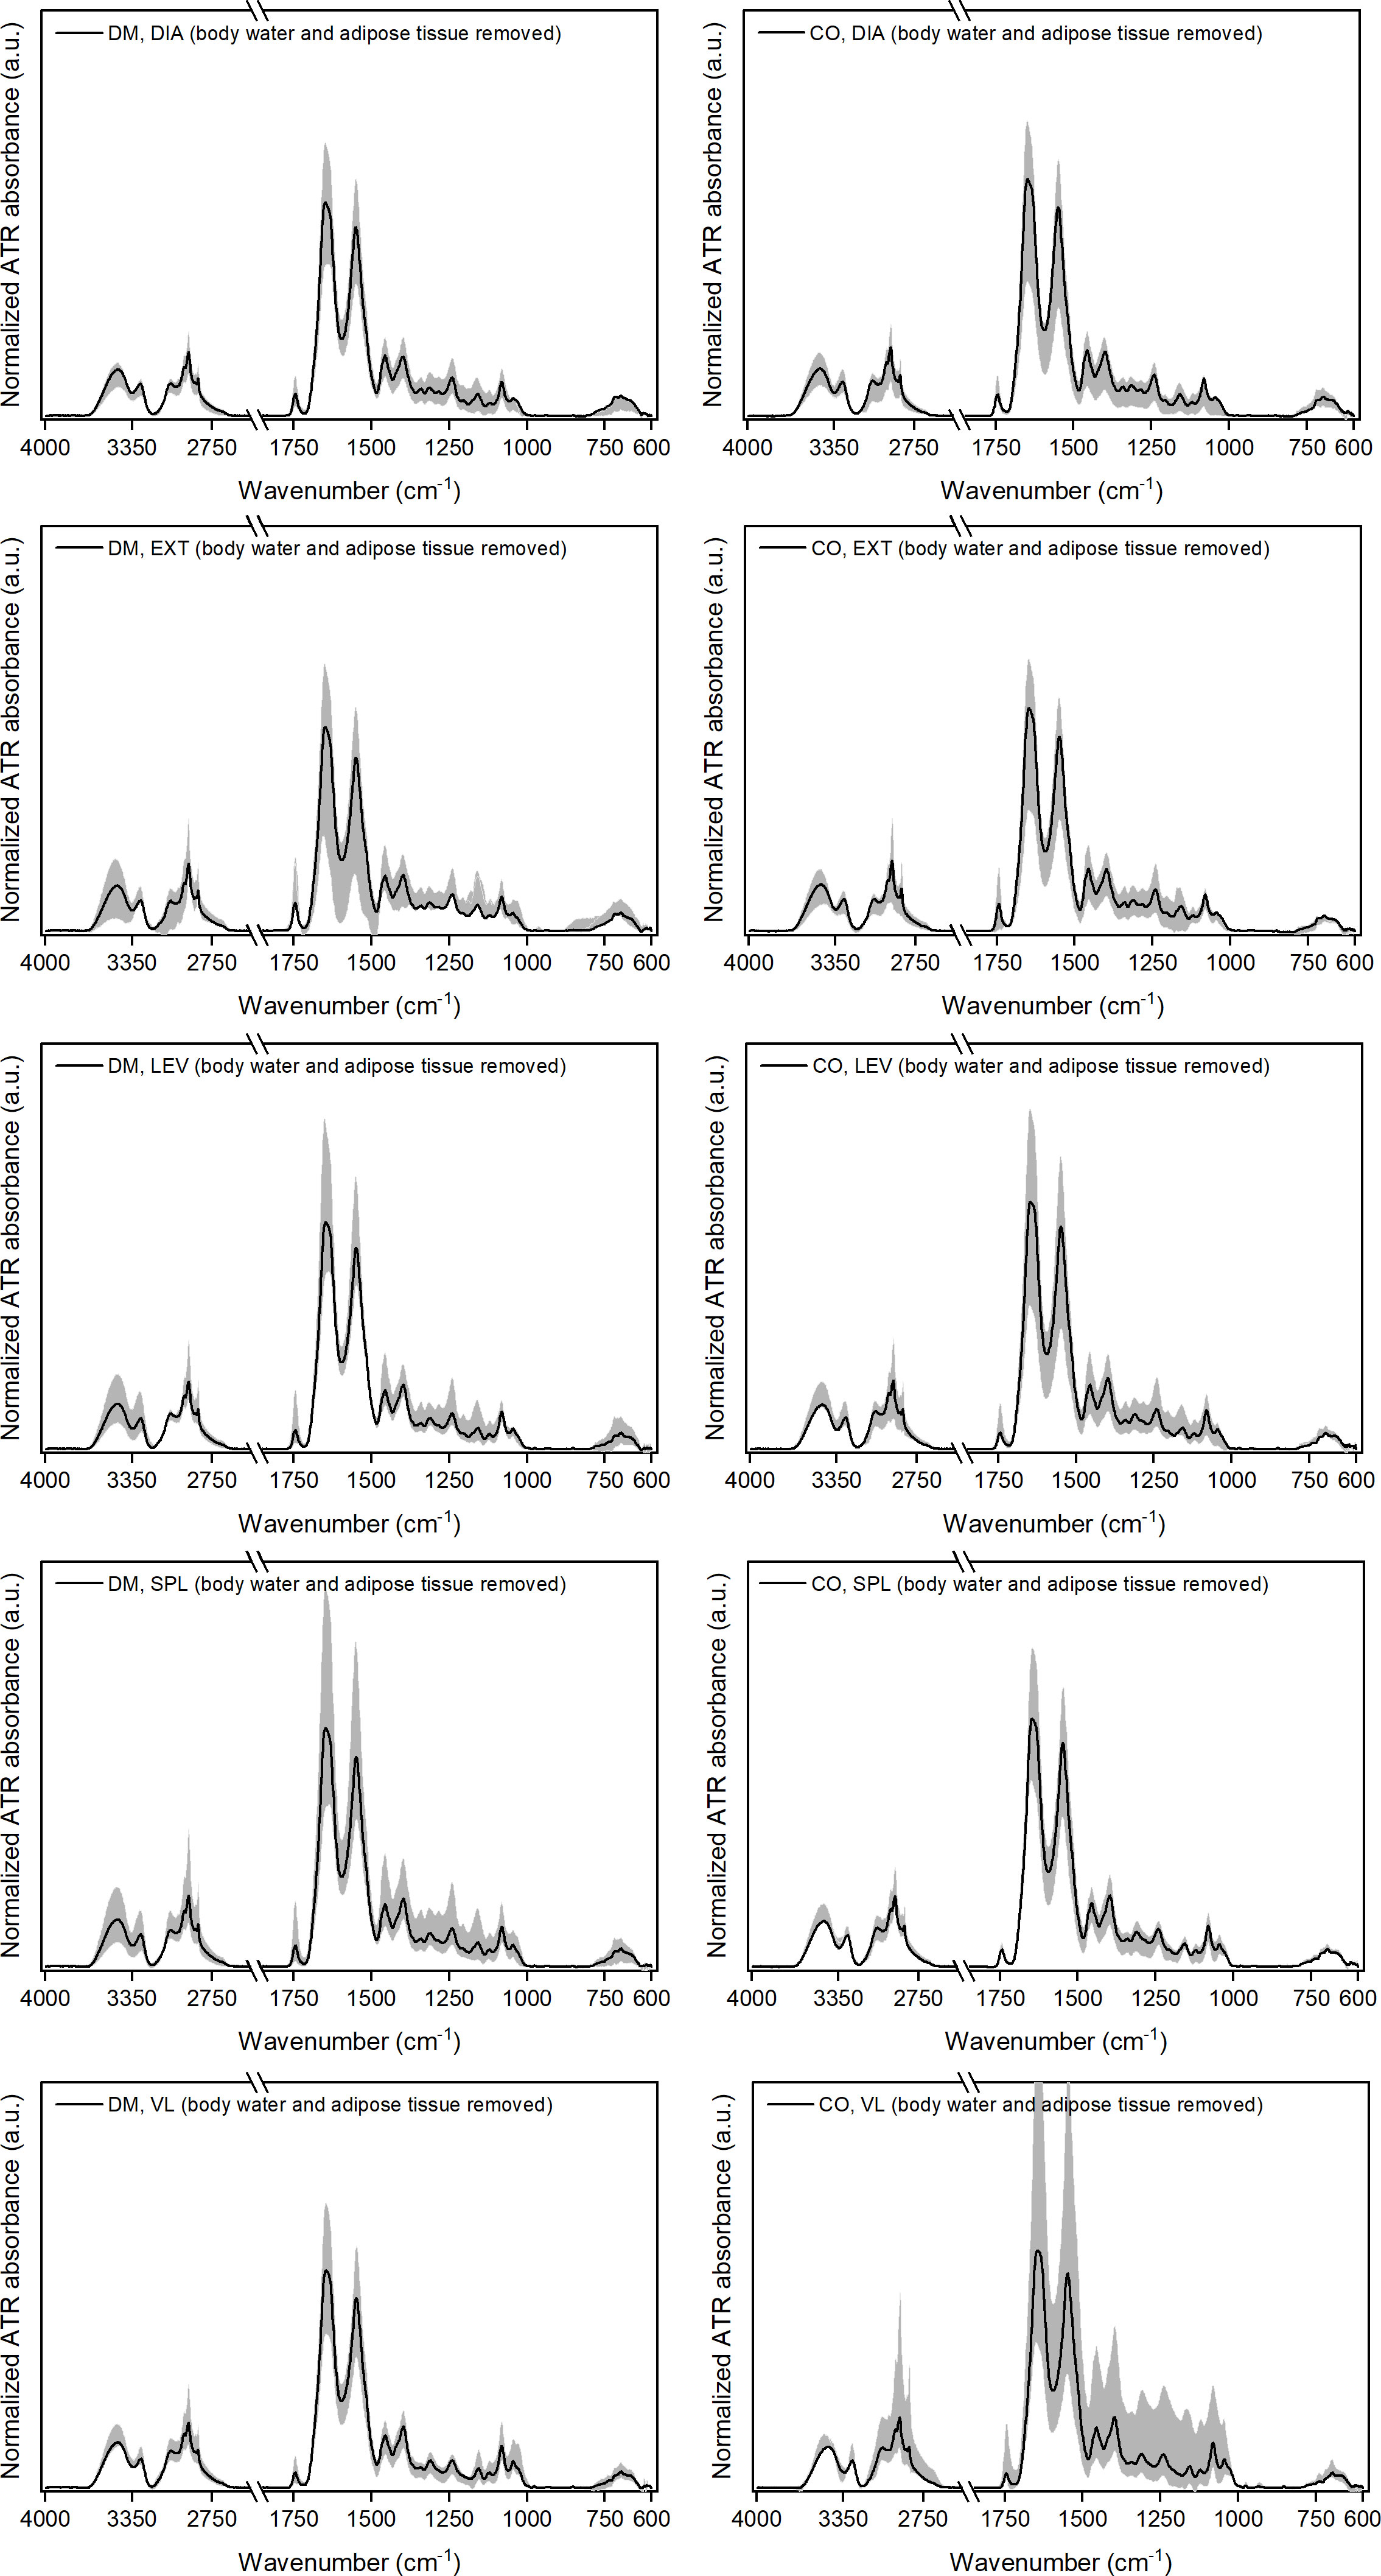
Figure 3 Normalised ATR-FTIR spectra after removing the weighted spectral components representing body water, BW, and adipose tissue, AD (i.e. ) for five different muscles from 16 diabetic donors (DM group) and 16 non-diabetic donors (CO group). Diagrams in the left-hand column correspond to the DM group and in the right-hand column to the CO group. Skeletal muscles are abbreviated as follows: diaphragm (DIA), external intercostal muscles (EXT), levator scapulae muscle (LEV), splenius capitis muscle (SPL), vastus lateralis muscle (VL). The solid black line in each graph shows the average spectrum for each of the five skeletal muscles for both study groups. The grey shaded area represents the dispersion of the spectra, with the lower and upper contours of this area corresponding to the spectra that deviate the most from the average.
After removing the corresponding proportion of adipose tissue from the spectra, the dispersion of the spectra around the average becomes smaller (see grey shaded areas of individual diagrams in Supplementary Figure 3; Figure 3 for comparison). The only exception here is the non-diabetic VL muscle, where the grey shaded area (dispersion of the data) remains wide, but we will see in continuation that this is due to the outlier related to the component.
To demonstrate the intermediate results after each decomposition step, Supplementary Figure 4 shows the spectra after removing the weighted spectral components , and , and Supplementary Figure 5 shows the spectra after removing the weighted spectral components , , and , i.e. the spectra. Comparing the corresponding individual plots in these two figures, it can be seen that the joint contribution of the and components has a relatively low dispersion (see relatively narrow grey shaded areas in Supplementary Figure 4), while the contributions of and separately appear to be widely dispersed (see wide grey shaded areas in Supplementary Figure 5).
The final result of the decomposition, which reflects the biochemical profiles of skeletal muscle, is shown in Figure 4 in the form of the spectral components , and with the corresponding weights , and for further consideration.
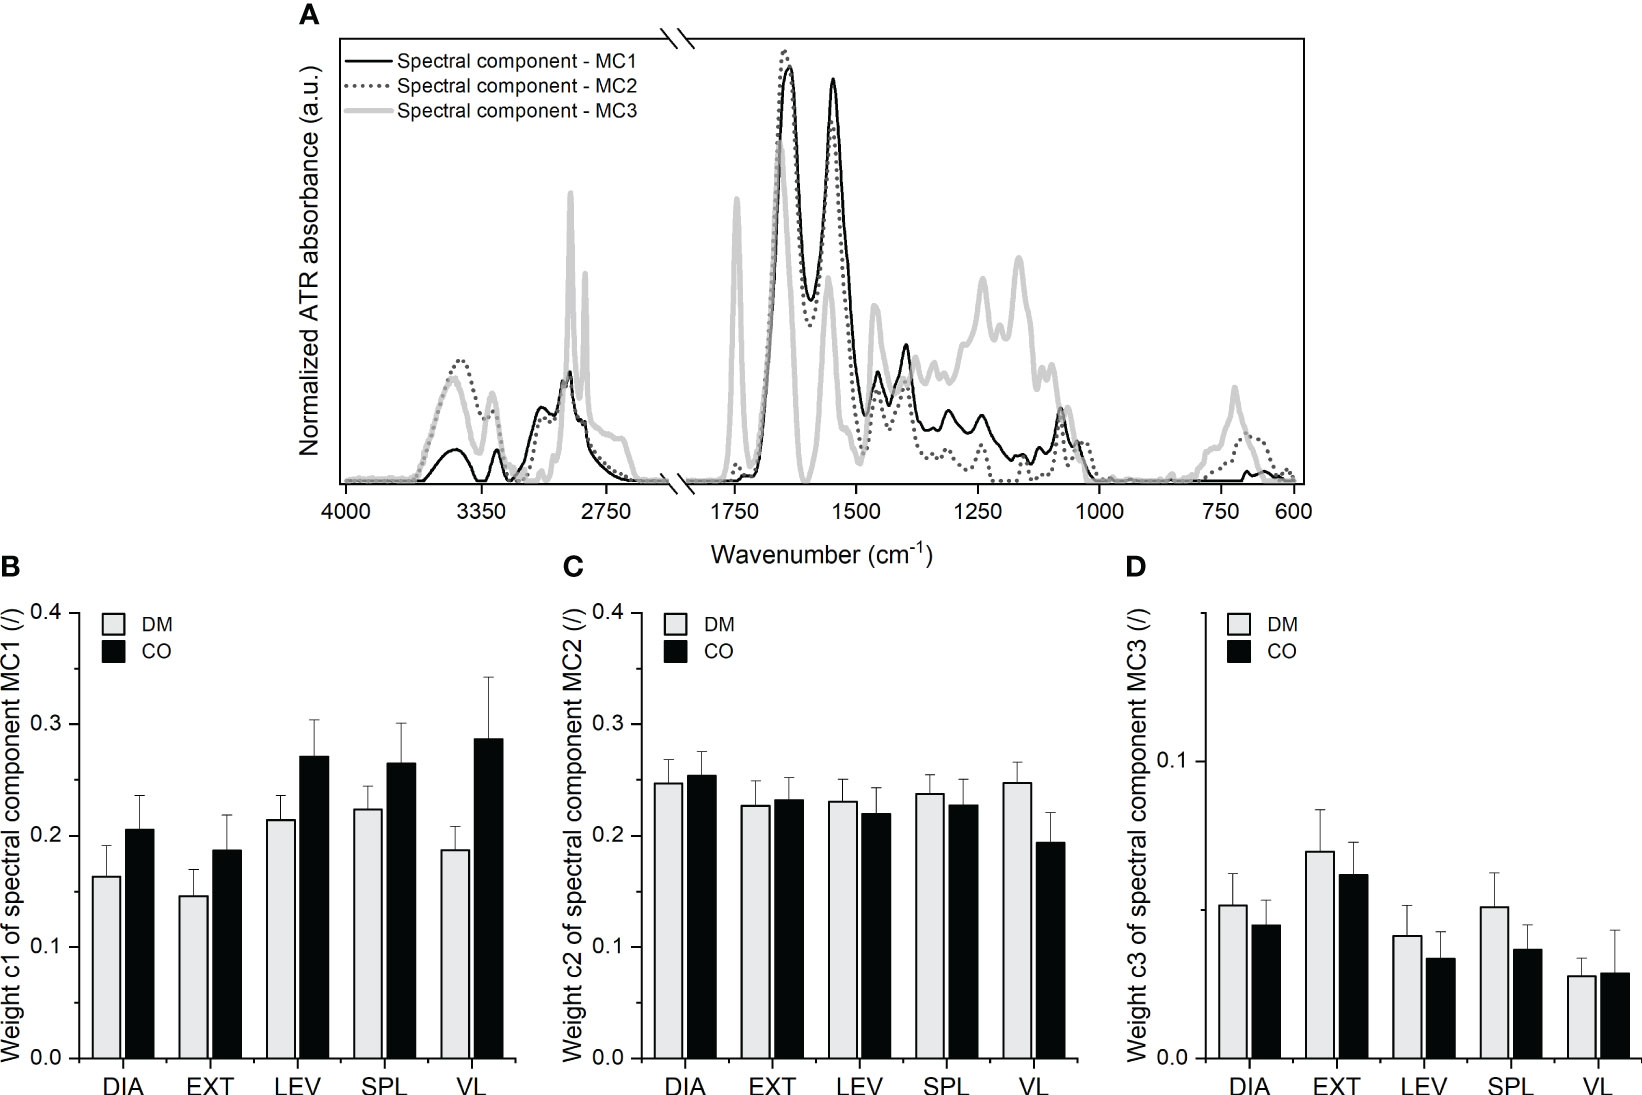
Figure 4 (A) Three spectral components, MC1, MC2 and MC3 with the corresponding (B) weight c1, (C) weight and (D) weight obtained for five different muscles from 16 diabetic donors (DM group) and 16 non-diabetic donors (CO group) from the second and third MCR decomposition steps. Skeletal muscles are abbreviated as follows: diaphragm (DIA), external intercostal muscles (EXT), levator scapulae muscle (LEV), splenius capitis muscle (SPL), vastus lateralis muscle (VL). Data in (B–D) are means with standard errors of the mean (SEM).
The analysis of the spectral components shown in Figure 4A with their second derivatives enabled the identification of the absorption peak wavenumbers and the tentative assignment of vibrational bands. The second derivatives are shown in Supplementary Figures 6–8, with a list of wavenumbers in Supplementary Tables 1–3 corresponding to the peaks of the second derivative. Tentative assignment of the peaks, i.e. the absorption bands, can be found below in Table 1.
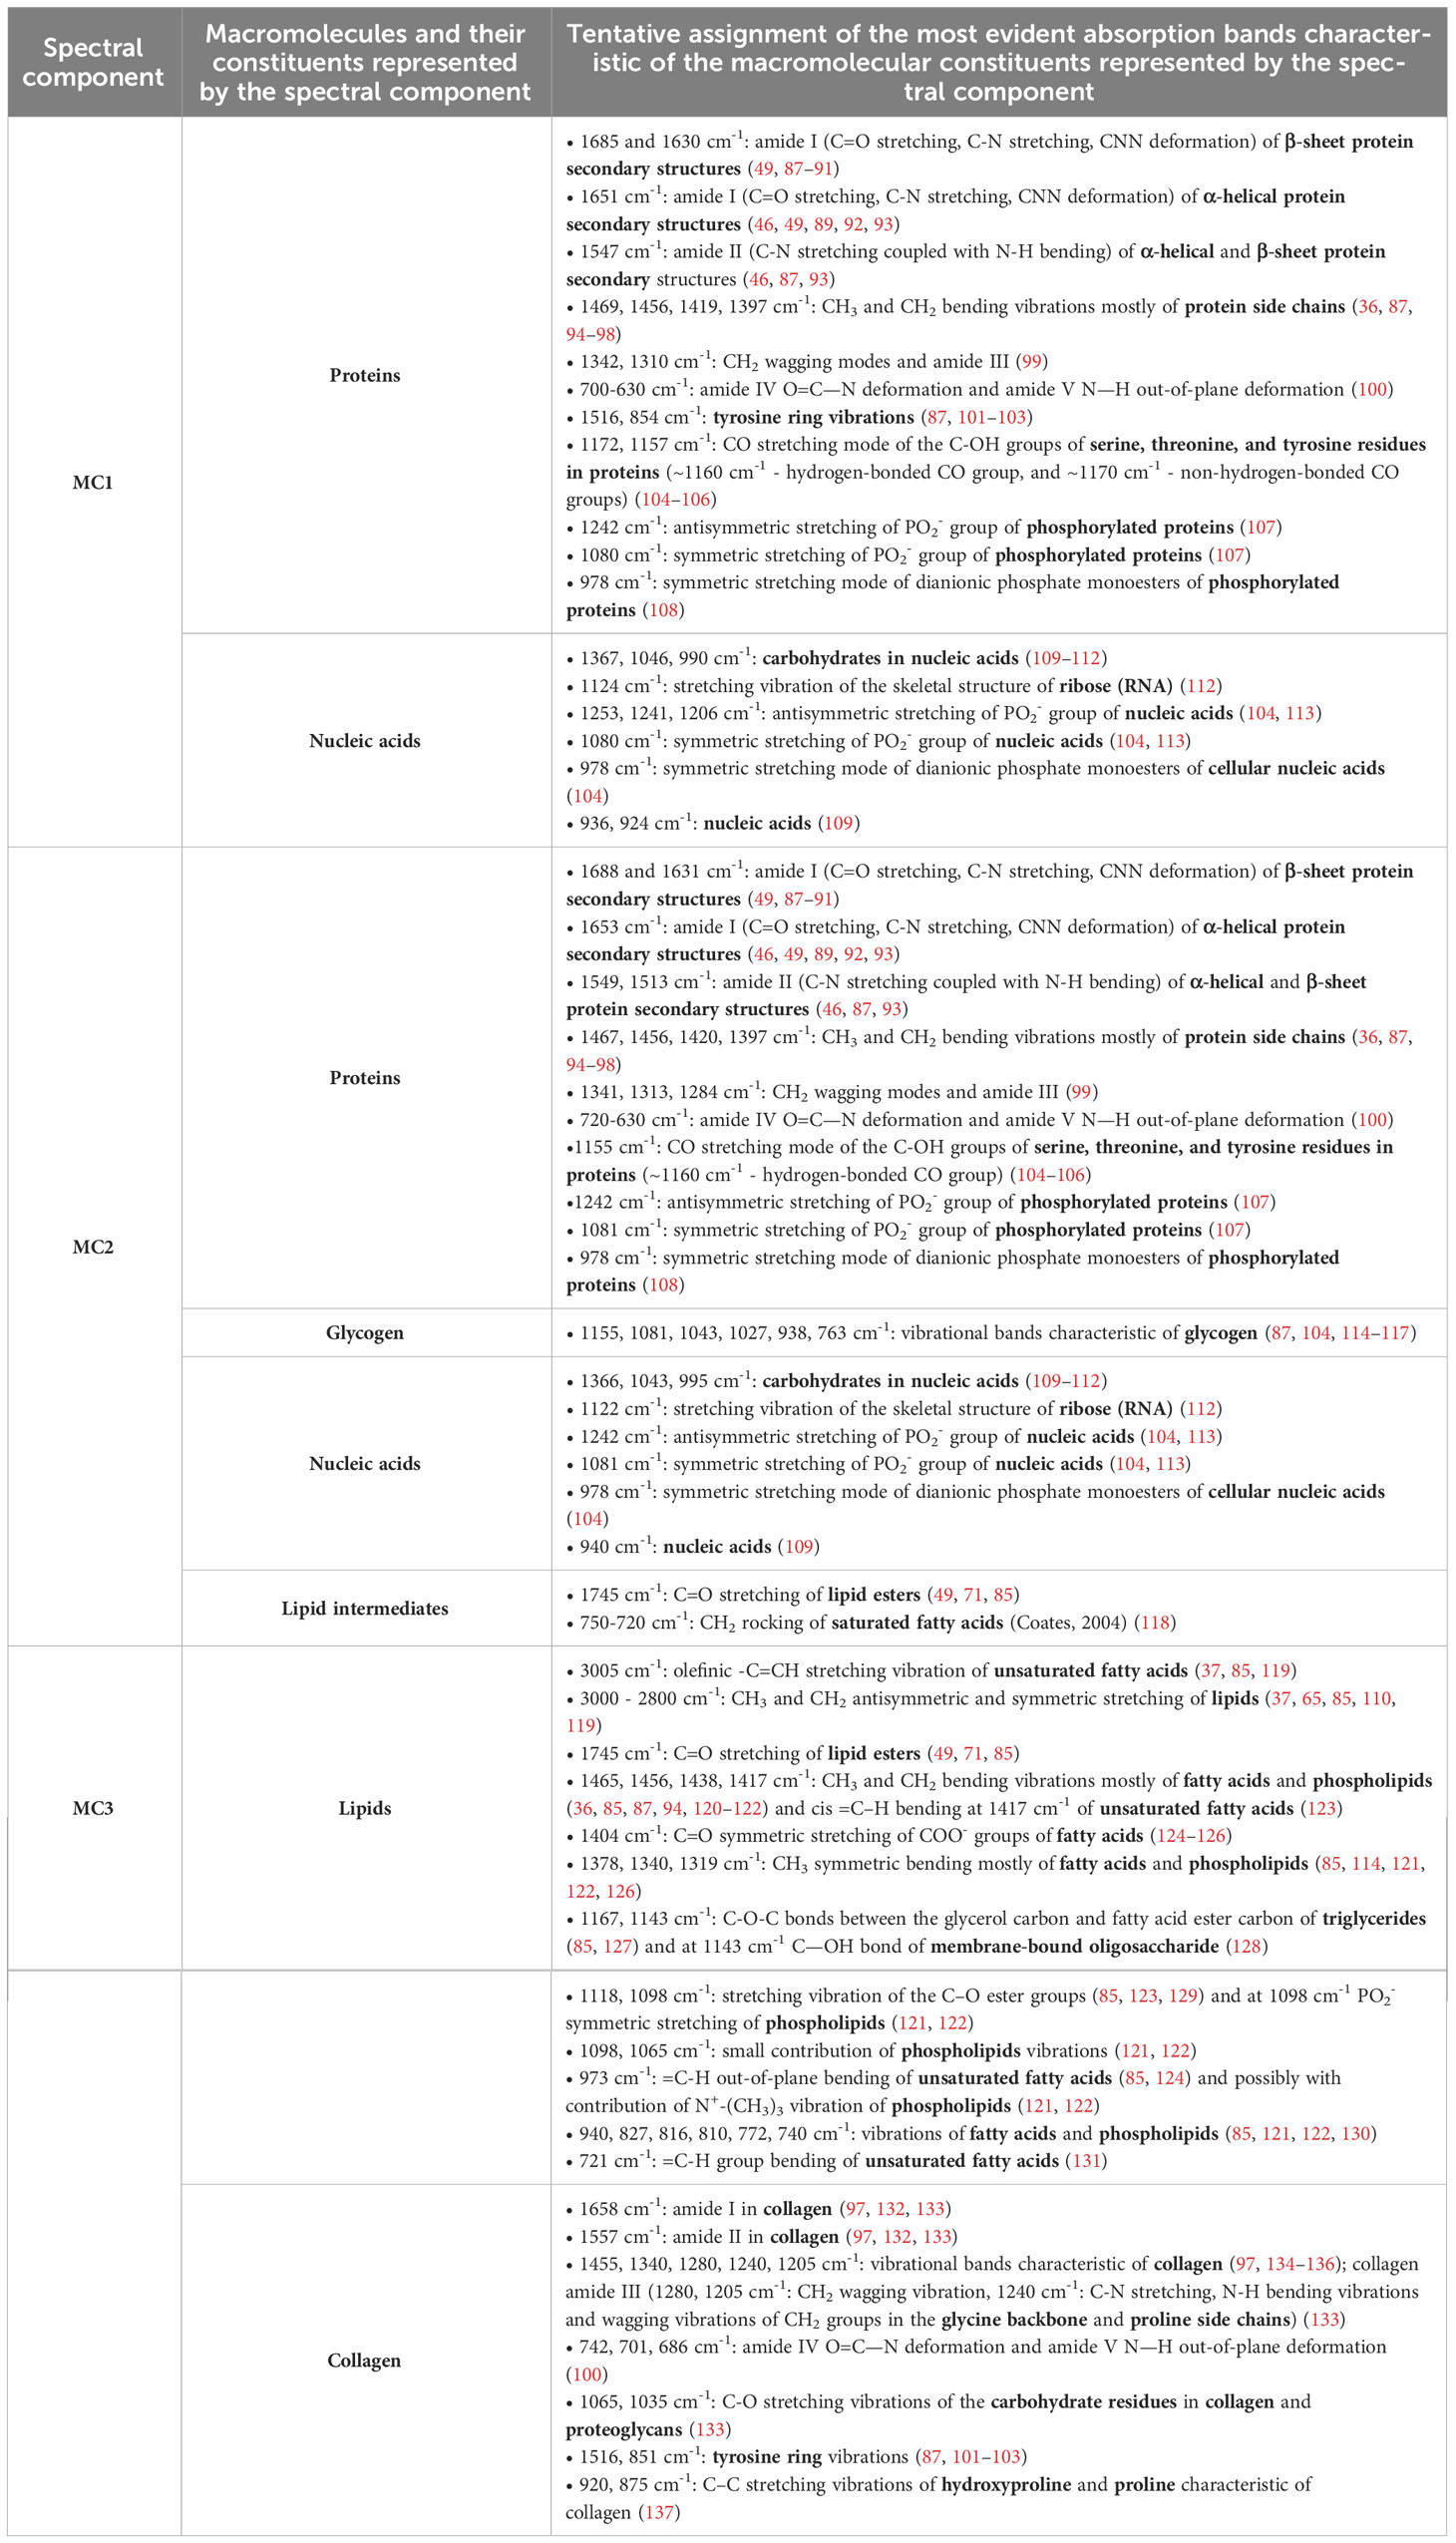
Table 1 Tentative assignment of vibrational bands with the identification of the macromolecular constituents.
As presented in Table 1, the multi-stage MCR decomposition into spectral components gives a relatively detailed insight into the macromolecular composition of skeletal muscle that can be obtained from the vibrational spectrum of the tissue sample measured in a single experiment. In general, components and are dominated by proteins (except for collagen), indicating variations in the ratios of the different secondary structures and the level of protein phosphorylation, as well as nucleic acids. In , a lipid ester band with lower intensity and an absorption range between 750-720 cm-1 also indicate the presence of lipid intermediates. The third spectral component is dominated by the vibrational absorption of lipid esters (mainly triglycerides, but also phospholipids) and collagen. Since in the spectral component certain absorption peaks are assigned exclusively to lipids and certain peaks exclusively to collagen, a higher/lower weight corresponding to simultaneously means a higher/lower proportion of lipids and a higher/lower proportion of collagen. On may note that all three spectral components contain information about proteins, but it is evident (especially from the amide I and II bands, their shape, frequencies and intensity ratios) that each spectral component reflects vibrational characteristics of proteins with specific structural properties. These hidden details, which can be revealed by spectral decomposition, provide a useful basis for the search for the possible structural changes in skeletal muscle proteins due to their impairment by diabetes. It is important to emphasise [as provided in Eq. (1)] that all analysed ATR-FTIR spectra have been described as a linear combination of the same spectral components obtained from the multi-stage decomposition, where the corresponding weights define the contribution of each spectral component to a given spectrum. In other words, the same spectral components for all analysed spectra reflect the same biomolecular profiles which have been contained in different proportions in the analysed samples. Therefore, the weights determine these proportions, i.e. the contribution of the macromolecular constituents represented by a given spectral component to the overall composition of the samples. In particular, the weights , and are distinguished parameters that reflect the contribution of the macromolecular species represented by the spectral components , and in skeletal muscle tissue. Examination of the mean values of the weights and in Figures 4B, D indicates the differences in the macromolecular composition of the tissue between the diabetic group and the control group for a given muscle. Nevertheless, the two-way mixed ANOVA did not yield a statistically significant effect of the group, but did show statistical significance of the effect of muscle type on weights (F3.072, 92.15 = 5.223; p = 0.0021) and (F3.320, 99.60 = 6.847; p = 0.0002). Supplementary Figures 10–12 additionally show the scatterplots for all three weights, where we can observe a lower variance of c1 for diabetic muscles compared to non-diabetic ones. The scatterplots in Supplementary Figure 11 show a similar variance for for diabetic and non-diabetic muscles. The variance of for diabetic DIA, EXT and VL (when the outlier is excluded) muscles appears to be larger than for control muscles, while LEV and SPL muscles seem to have the same tendency, but it is less clear whether certain data should be considered as outliers. Further comments can be found in subsection 3.3 for comparison with the histochemical results.
3.2 Skeletal muscle composition analysed by histochemical assays
Figure 5 depicts representative images of histochemically stained sections, while Figure 6 summarises the results of the histochemical analysis of the early postmortem macromolecular composition of the skeletal muscles in diabetic and non-diabetic individuals.
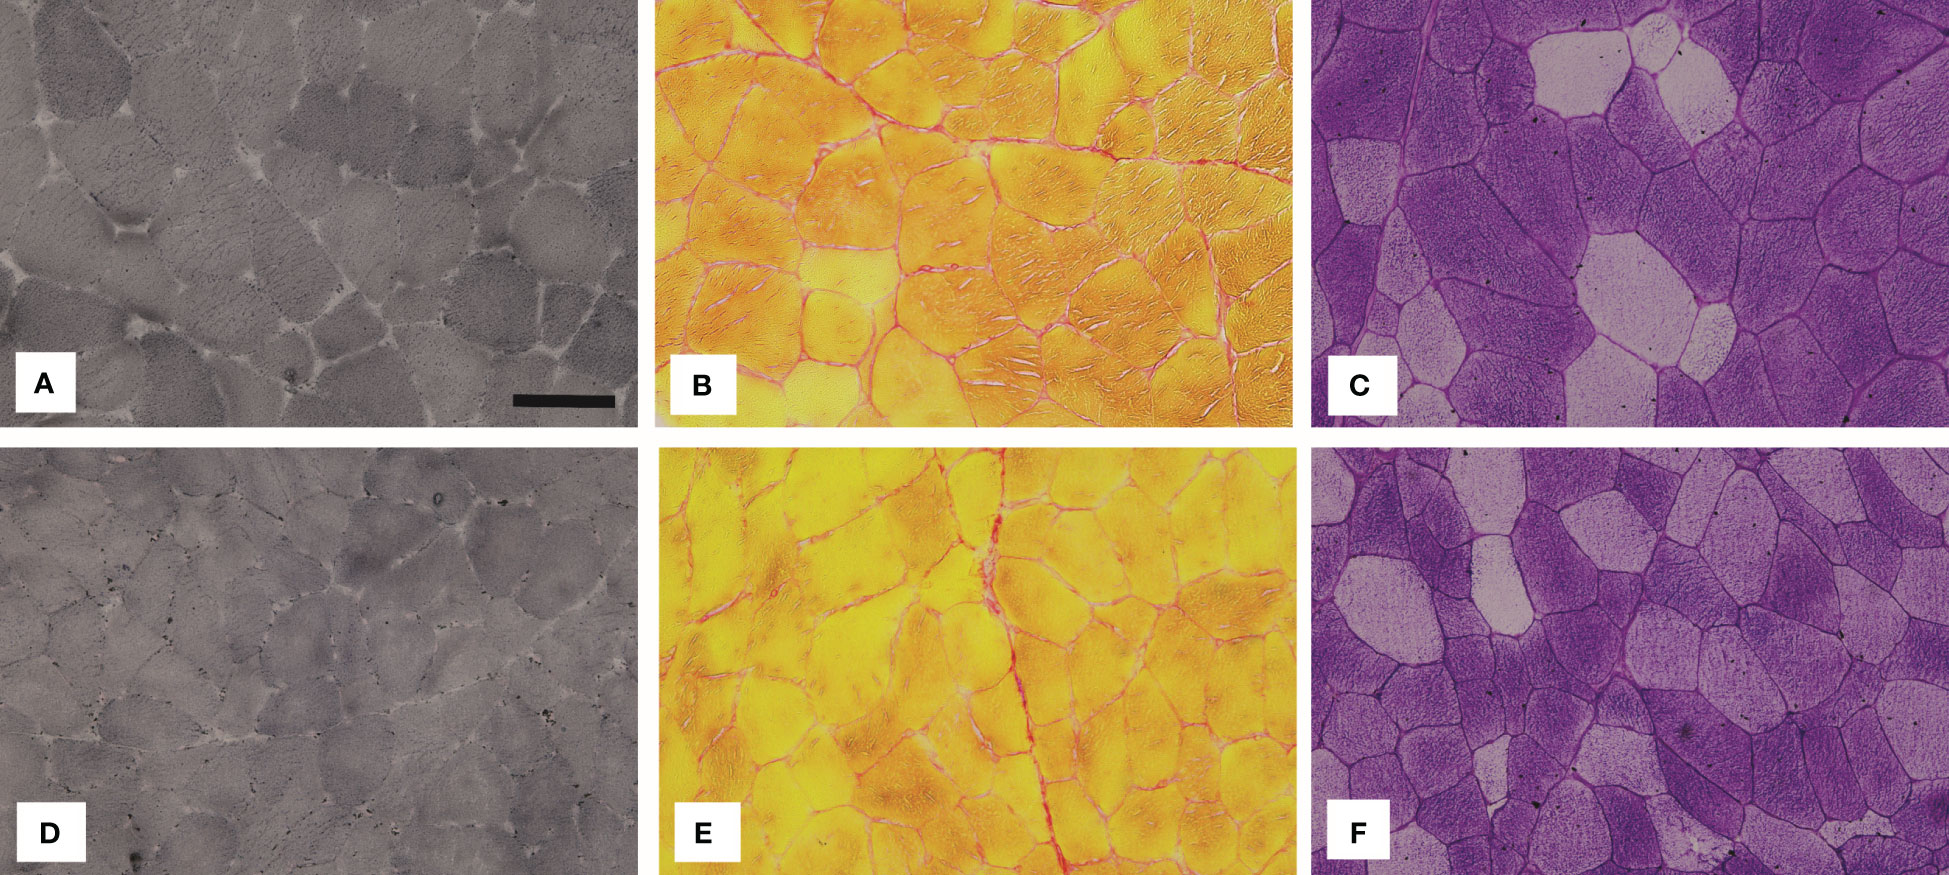
Figure 5 Representative images of the vastus lateralis muscle (VL) stained with (A, D) Sudan Black B (lipids), (B, E) Sirius red (collagen) and (C, F) PAS (glycogen). The images in the top row show the muscle VL of diabetic (DM) individuals and the images in the bottom row of non-diabetic (CO) individuals. The black bar in (A) represents 50 µm.
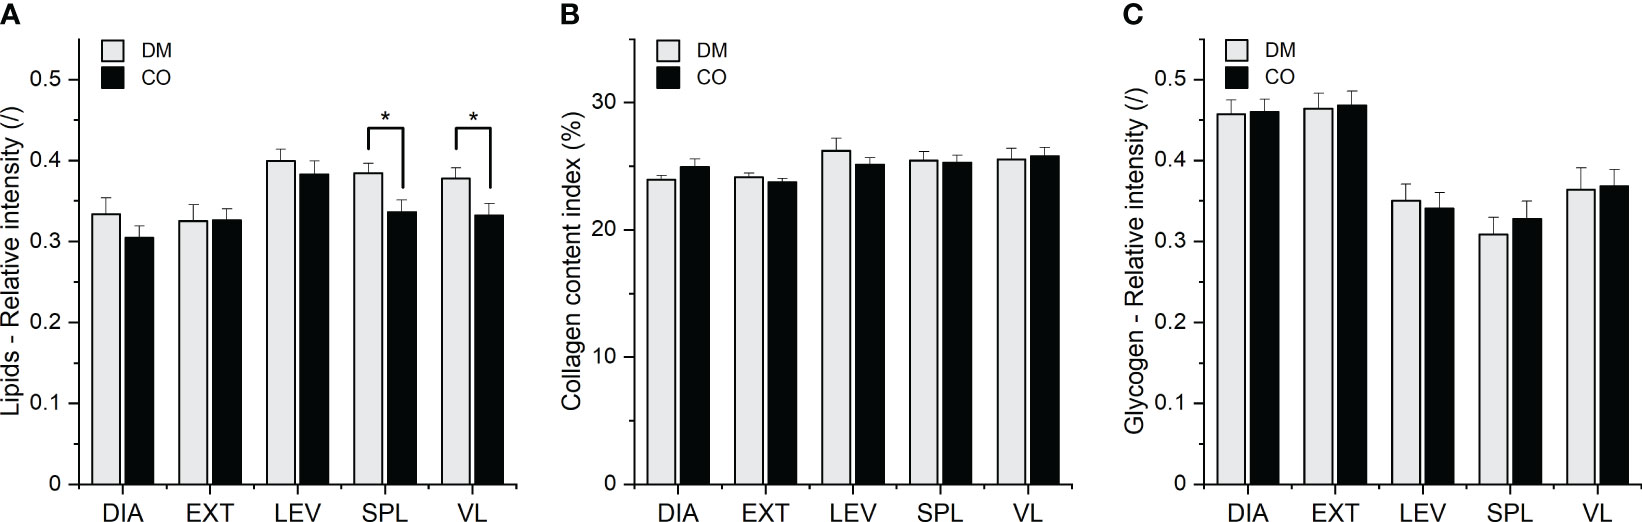
Figure 6 (A) Lipid, (B) collagen and (C) glycogen composition of five different muscles from 16 diabetic donors (DM group) and 16 non-diabetic donors (CO group) determined by histochemical analysis. Skeletal muscles are abbreviated as follows: diaphragm (DIA), external intercostal muscles (EXT), levator scapulae muscle (LEV), splenius capitis muscle (SPL), vastus lateralis muscle (VL). Data are means with standard errors of the mean (SEM); *p < 0.05, two-way mixed ANOVA.
The two-way mixed ANOVA showed the statistical significance of the effect of the group (DM and CO) on lipid content (F1, 30 = 4.420; p = 0.0440), but not on collagen and glycogen content. There was also a statistically significant effect of muscle type on lipid content (F2.092, 62.77 = 8.396; p = 0.0005), collagen (F2.781, 83.42 = 3.523; p = 0.0211) and glycogen content (F2.465, 73.95 = 31.69; p< 0.0001) in different skeletal muscles. The post-hoc Tukey test revealed statistically significant differences between the diabetic (DM) group and non-diabetic (CO) group for muscles SPL and VL, as shown in Figure 6A. Supplementary Figures 13–15 show the scatterplots for the three macromolecular species. When outliers are excluded, the variance in lipid amount appears to be greater in diabetic DIA and EXT muscles than in control muscles, whereas the variances are similar in diabetic and non-diabetic LEV, SPL and VL muscles. After excluding the outliers, one may also argue that the variances of collagen and glycogen amounts are similar for diabetic and control muscles, with the exception of LEV muscle, where the variance of collagen content is greater for diabetic than for non-diabetic muscle. Further comments can be found in the following subsection 3.3 for comparison with the spectroscopic results.
3.3 Comparison of the spectroscopic and histochemical results
In order to compare the two sets of results, we had to identify the outcomes of the spectroscopic analysis that matched the outcomes of the histochemical analysis, i.e. the lipid, collagen and glycogen content. Based on the assignments of the vibrational bands of the spectral components shown in Table 1, the lipid and collagen contents in the macromolecular composition of the muscles are controlled by the weight and the glycogen content by the weight . The qualitative comparison of the spectroscopic and histochemical results is given across the matched parameter pairs, i.e. histochemically determined lipid content compared to , histochemically determined collagen content compared to , histochemically determined glycogen content compared to .
The scatterplots in Supplementary Materials point to the greater variance in the data obtained in spectral decomposition than in the data obtained in histochemical test. Nevertheless, the two approaches provide similar overall picture about the significance of disease status (diabetic or control), both revealing differences between the diabetic and non-diabetic groups, mainly in the form of increased intramuscular lipid content. Although the spectroscopic approach showed no statistically significant differences between the groups in terms of lipid content, there is a general trend towards an increased amount of lipids in diabetic muscles compared to control muscles (see weight c3 in Figure 4D; Supplementary Figure 12). This is mainly consistent with the corresponding trends in histochemical analysis (see Figure 6A; Supplementary Figure 13). As far as collagen and glycogen content are concerned, both methods agree that up to this point there are no significant differences between the groups with regard to these two macromolecular components.
Regarding the influence of muscle type on tissue composition in general, both methods agree that muscle type has an influence on lipid content (histochemistry: p = 0.0005; ATR-FTIR via c3: p = 0.0002) and collagen content (histochemistry: p = 0.0211; ATR-FTIR via c3: p = 0.0002), but differ with respect to glycogen content (histochemistry: p< 0.0001; ATR-FTIR via c2: no statistical significance of muscle type effect on glycogen content). However, when comparing the muscles with each other, the spectroscopic analysis seems to show a somewhat different picture than the histochemistry. For example, the mean value of c3 (which determines the amount of lipids) and its variance seem to be higher for the EXT muscle (see Figure 4D; Supplementary Figure 12) than for other muscles. On the other hand, the bar graphs and scatterplots representing the lipids analysed in the histochemical test do not show the same (see Figure 6A; Supplementary Figure 13).
The observed discrepancies between the outcomes of the spectroscopic approach and the histochemical analysis could primarily be due to differences in sample preparation, the form and amount of the sample analysed and the sample treatment during the histochemical analysis.
In addition, we analysed relatively small sample sets and are aware of the natural variability of the metabolic phenotype of human skeletal muscle. Accordingly, we remain cautious about further statistical details and definitive conclusions about DM-induced changes in tissue composition. Nevertheless, we have developed the key methodological steps to obtain numerous compositional details from the vibrational spectra that can be transferred to large sample sets relevant for commenting on DM-induced alteration in skeletal muscle biomolecular phenotype.
4 Discussion
The information in a single ATR-FTIR spectrum, derived from the spectral components and their corresponding weights, can provide a very valuable insight into the macromolecular composition of the tissues. Spectral decomposition yields a set of spectral components, which reflect a set of distinct chemical profiles, i.e. particular macromolecular species, which are common to all analysed spectra. As shown in Table 1, the amide I and amide II bands of the α-helical and β-sheet protein secondary structures present in the spectral components MC1 and MC2, and the structures belonging to collagen represented by MC3, suggest the changes in the overall protein structural pattern. The changing proportions of particular protein structures, due either to different muscle types or to the effects of DM, can be tracked by the weights c1, c2 and c3 of the spectral components. Similarly, the degree of phosphorylation of proteins, elevated or decreased levels of certain amino acids, nucleic acids, glycogen, lipid intermediates can be assessed from the weights c1 and c2 and, using the weight c3, the proportions of lipids, phospholipids and collagen. These spectroscopic analyses reflect detailed insights into the potential diabetic alterations in skeletal muscle metabolic phenotype, such as changes in protein expression and post-translational modifications, intramyocellular lipid deposition, impaired glycogen synthesis and impaired mitochondrial function. Therefore, the weights obtained from the spectral decomposition can serve as the main parameters for comparing diabetic and non-diabetic muscles and for analysing the correlations between the altered proportions of particular macromolecular species.
To comment on the discrepancies between the spectroscopic and histochemical results, we would like to argue that the former reflect a more realistic picture of composition. Our arguments are based on the fact that in the spectroscopic measurements we used a larger amount of the tissue sample, which was kneaded well to distribute the constituents as evenly as possible, in contrast to the histochemical tests where individual sections were used for analysis. Additionally, the possible effects of the staining procedure and the biases in the assessment of the stained localised areas belonging to a specific molecular species under investigation should be considered. On the other hand, the use of wet samples for FTIR spectroscopy could be a potential weakness. The large amount of body water in the tissue absorbs a large amount of the energy emitted by the infrared source in the FTIR experiment. Therefore, the absorption intensities of the solid part of the tissue are relatively low compared to the absorption intensities of the water, which may affect the dispersion of the spectra of the solid part of the tissue to a certain extent. Nevertheless, it is important to work with wet samples in order to exclude possible effects of drying the samples, which can strongly alter the structural properties of the proteins.
Despite numerous studies addressing skeletal muscle myopathy as a possible cause and/or consequence of DM, the understanding of the interactions remains incomplete. While most research have focused on the specific molecular mechanism, we believe that methodological approaches that provide insight into more macromolecular indicators simultaneously are the most efficient way to obtain a comprehensive picture and a deeper understanding of the molecular mechanisms of disease and their interactions. The methodology we have proposed in this article, using FTIR spectroscopy and the resourceful spectral decomposition approach, directly follows and supports this aspect.
We are aware that our pilot study uses relatively small sample sets and it is therefore too early to draw definitive conclusions about DM-induced changes in the composition of human skeletal muscle, although the results already suggest certain trends. However, the most important contribution expected from this preliminary study has been the development of an alternative, simple and efficient methodology to study the macromolecular composition of skeletal muscle tissue. The established methodological framework will ensure the feasibility of a large-scale study with statistically representative sample sizes, which are essential for obtaining robust data on the DM-related macromolecular changes in skeletal muscle. We believe that our spectroscopic approach can make an important contribution to DM research by providing a tool for monitoring disease progression in terms of its effects on skeletal muscle composition and the interrelationships between macromolecular alterations in tissue.
5 Conclusion
In summary, this paper proposes an alternative methodology for examining macromolecular constituents of biological tissue based on information in the vibrational spectrum. The approach was developed on a pilot sample set of five different skeletal muscles from 16 diabetic and 16 non-diabetic human donors. We have shown that with appropriate spectral decomposition steps we can obtain much more information about the macromolecular composition of skeletal muscle than with several different histochemical tests. Within the proposed methodological framework we have:
- established detailed protocols for skeletal muscle sample preparation and the implementation of the spectroscopic experiments to minimise the impact of these procedures on the measured FTIR spectra;
- laid the foundations for the multi-stage spectral decomposition of FTIR spectra into the spectral components for the simultaneous identification of various macromolecular species and their contributions to the overall composition of skeletal muscle;
- identified the characteristic spectral absorption bands in order to identify the individual macromolecular species represented by a particular spectral component;
- identified the parameters for comparing the contribution of macromolecular species to the overall composition of different skeletal muscles in diabetic and non-diabetic subjects and for analysing their correlations;
- demonstrated the versatility and efficiency of the proposed spectroscopic approach in comprehensively revealing subtle changes in the composition of skeletal muscle.
On this basis, we are confident that we have brought our methodology to a level from which it can be successfully transferred to a large-scale study that allows for statistically representative analyses and suitable conditions to search for statistically significant changes in skeletal muscle composition due to DM.
Data availability statement
The raw data supporting the conclusions of this article will be made available by the authors, without undue reservation.
Ethics statement
The studies involving humans were approved by the Republic of Slovenia National Medical Ethic Committee (Permit No.: 0120-536/2019/4). The human samples used in this study were acquired from skeletal muscle tissue of deceased adult (≥ 18 years) male bodies within 24 hours postmortem. The skeletal muscle tissue was harvested during standard autopsy procedures at the Institute of Forensic Medicine, University of Ljubljana, Slovenia. The tissue samples and the data obtained were pseudonymized, and only the authorized forensic medicine specialist had access to the data of the deceased included in the study. Written informed consent for participation was not required from the participants or the participants' legal guardians/next of kin in accordance with the national legislation and institutional requirements. The ethical policies are regulated by the national directive »PRAVILNIK o pogojih in načinu opravljanja mrliško pregledne službe«; Uradni list RS, pp. 7430 / No. 99 / 22. 7. 2022; https://www.uradni-list.si/_pdf/2022/Ur/u2022099.pdf, according to which the standard autopsy procedures are carried out on the basis of the coroner's decision (Article 10 of the directive) and not on the basis of the informed consent of the participants or the participants' legal guardians/next of kin. For standard autopsies, the recommendations of the Council of Europe are followed, i.e., »Recommendation No. R (99) 3 of the Committee of Ministers to Member States on harmonization of medico-legal autopsy rules« and the »Appendix to Recommendations No. R (99) 3«; https://www.coe.int/t/dg3/healthbioethic/texts_and_documents/RecR(99)3.pdf.
Author contributions
BZ: Conceptualization, Data curation, Formal analysis, Investigation, Methodology, Project administration, Software, Supervision, Validation, Visualization, Writing – original draft. CKU: Data curation, Investigation, Methodology, Writing – review & editing. MEAA: Data curation, Formal analysis, Investigation, Methodology, Writing – original draft. AA: Investigation, Methodology, Writing – review & editing. EC: Conceptualization, Funding acquisition, Resources, Supervision, Writing – review & editing. JG: Conceptualization, Funding acquisition, Methodology, Resources, Supervision, Writing – review & editing. AŠ: Data curation, Investigation, Methodology, Writing – review & editing. NU: Conceptualization, Data curation, Formal analysis, Investigation, Methodology, Supervision, Writing – review & editing.
Funding
The author(s) declare financial support was received for the research, authorship, and/or publication of this article. This research was funded by the Slovenian Research and Innovation Agency (ARIS), Slovenia, through the research core funding No. P1-0010, P3-0043, N3-0256, and by the Czech Science Foundation (GACR) grant 22-02756K.
Acknowledgments
We thank Majda Črnak Maasarani, Andreja Vidmar, Marko Slak, and Nataša Pollak for their technical assistance.
Conflict of interest
The authors declare that the research was conducted in the absence of any commercial or financial relationships that could be construed as a potential conflict of interest.
Publisher’s note
All claims expressed in this article are solely those of the authors and do not necessarily represent those of their affiliated organizations, or those of the publisher, the editors and the reviewers. Any product that may be evaluated in this article, or claim that may be made by its manufacturer, is not guaranteed or endorsed by the publisher.
Supplementary material
The Supplementary Material for this article can be found online at: https://www.frontiersin.org/articles/10.3389/fendo.2023.1308373/full#supplementary-material
References
1. World Health Organization, Health topics/Diabetes. World Heal Organ (2023). Available at: https://www.who.int/health-topics/ (Accessed May 2, 2023).
2. Saklayen MG. The global epidemic of the metabolic syndrome. Curr Hypertens Rep (2018) 20:1–8. doi: 10.1007/s11906-018-0812-z
3. Diabetes around the world in 2021 (2023). Int Diabetes Fed. Available at: https://diabetesatlas.org/ (Accessed May 20, 2023).
4. Argilés JM, Campos N, Lopez-Pedrosa JM, Rueda R, Rodriguez-Mañas L. Skeletal muscle regulates metabolism via interorgan crosstalk: roles in health and disease. J Am Med Dir Assoc (2016) 17:789–96. doi: 10.1016/j.jamda.2016.04.019
5. Richter-Stretton GL, Fenning AS, Vella RK. Skeletal muscle–A bystander or influencer of metabolic syndrome? Diabetes Metab Syndr Clin Res Rev (2020) 14:867–75. doi: 10.1016/j.dsx.2020.06.006
6. Ugwoke CK, Cvetko E, Umek N. Skeletal muscle microvascular dysfunction in obesity-related insulin resistance: pathophysiological mechanisms and therapeutic perspectives. Int J Mol Sci (2022) 23:847. doi: 10.3390/ijms23020847
7. Albers PH, Pedersen AJT, Birk JB, Kristensen DE, Vind BF, Baba O, et al. Human muscle fiber type-specific insulin signaling: impact of obesity and type 2 diabetes. Diabetes (2015) 64:485–97. doi: 10.2337/db14-0590
8. Sylow L, Tokarz VL, Richter EA, Klip A. The many actions of insulin in skeletal muscle, the paramount tissue determining glycemia. Cell Metab (2021) 33:758–80. doi: 10.1016/j.cmet.2021.03.020
9. Merz KE, Thurmond DC. Role of skeletal muscle in insulin resistance and glucose uptake. Compr Physiol (2020) 10:785–809. doi: 10.1053/j.gastro.2016.08.014.CagY
10. Feraco A, Gorini S, Armani A, Camajani E, Rizzo M, Caprio M. Exploring the role of skeletal muscle in insulin resistance: lessons from cultured cells to animal models. Int J Mol Sci (2021) 22:9327. doi: 10.3390/ijms22179327
11. Thiebaud D, Jacot E, Defronzo RA, Maeder E, Jequier E, Felber JP. The effect of graded doses of insulin on total glucose uptake, glucose oxidation, and glucose storage in man. Diabetes (1982) 31:957–63. doi: 10.2337/diacare.31.11.957
12. Czech MP. Insulin action and resistance in obesity and type 2 diabetes. Nat Med (2017) 23:804–14. doi: 10.1038/nm.4350
13. Stump CS, Henriksen EJ, Wei Y, Sowers JR. The metabolic syndrome: role of skeletal muscle metabolism. Ann Med (2006) 38:389–402. doi: 10.1080/07853890600888413
14. Schiaffino S. Muscle fiber type diversity revealed by anti-myosin heavy chain antibodies. FEBS J (2018) 285:3688–94. doi: 10.1111/febs.14502
15. Umek N, Horvat S, Cvetko E. Skeletal muscle and fiber type-specific intramyocellular lipid accumulation in obese mice. Bosn J Basic Med Sci (2021) 21:729–37. doi: 10.17305/bjbms.2021.5876
16. Goodpaster BH, Wolf D. Skeletal muscle lipid accumulation in obesity, insulin resistance, and type 2 diabetes. Pediatr Diabetes (2004) 5:219–26. doi: 10.1111/j.1399-543X.2004.00071.x
17. Ohlendieck K. Pathobiochemical changes in diabetic skeletal muscle as revealed by mass-spectrometry-based proteomics. J Nutr Metab (2012) 2012:1–12. doi: 10.1155/2012/893876
18. Öhman T, Teppo J, Datta N, Mäkinen S, Varjosalo M, Koistinen HA. Skeletal muscle proteomes reveal downregulation of mitochondrial proteins in transition from prediabetes into type 2 diabetes. iScience (2021) 24:1–22. doi: 10.1016/j.isci.2021.102712
19. Gilbert M. Role of skeletal muscle lipids in the pathogenesis of insulin resistance of obesity and type 2 diabetes. J Diabetes Investig (2021) 12:1934–41. doi: 10.1111/jdi.13614
20. Petersen KF, Shulman GI. Pathogenesis of skeletal muscle insulin resistance in type 2 diabetes mellitus. Am J Cardiol (2002) 90:11G–8G. doi: 10.1016/S0002-9149(02)02554-7
21. Amati F, Dubé JJ, Alvarez-Carnero E, Edreira MM, Chomentowski P, Coen PM, et al. Skeletal muscle triglycerides, diacylglycerols, and ceramides in insulin resistance: Another paradox in endurance-trained athletes? Diabetes (2011) 60:2588–97. doi: 10.2337/db10-1221
22. Perreault L, Newsom SA, Strauss A, Kerege A, Kahn DE, Harrison KA, et al. Intracellular localization of diacylglycerols and sphingolipids influences insulin sensitivity and mitochondrial function in human skeletal muscle. JCI Insight (2018) 3:0–21. doi: 10.1172/jci.insight.96805
23. Brøns C, Grunnet LG. Mechanisms in endocrinology: skeletal muscle lipotoxicity in insulin resistance and type 2 diabetes: a causal mechanism or an innocent bystander? Eur J Endocrinol (2017) 176:R67–78. doi: 10.1530/EJE-16-0488
24. He J, Watkins S, Kelley DE. Skeletal muscle lipid content and oxidative enzyme activity in relation to muscle fiber type in type 2 diabetes and obesity. Diabetes (2001) 50:817–23. doi: 10.2337/diabetes.50.4.817
25. Chang W, Hatch GM, Wang Y, Yu F, Wang M. The relationship between phospholipids and insulin resistance: From clinical to experimental studies. J Cell Mol Med (2019) 23:702–10. doi: 10.1111/jcmm.13984
26. He J, Kelley DE. Muscle glycogen content in type 2 diabetes mellitus. Am J Physiol Metab (2004) 287:E1002–7. doi: 10.1152/ajpendo.00015.2004
27. Frankenberg NT, Mason SA, Wadley GD, Murphy RM. Skeletal muscle cell-specific differences in type 2 diabetes. Cell Mol Life Sci (2022) 79:256. doi: 10.1007/s00018-022-04265-7
28. Ahmad K, Choi I, Lee Y-H. Implications of skeletal muscle extracellular matrix remodeling in metabolic disorders: diabetes perspective. Int J Mol Sci (2020) 21:3845. doi: 10.3390/ijms21113845
29. Berria R, Wang L, Richardson DK, Finlayson J, Belfort R, Pratipanawatr T, et al. Increased collagen content in insulin-resistant skeletal muscle. Am J Physiol - Endocrinol Metab (2006) 290:E560–5. doi: 10.1152/ajpendo.00202.2005
30. Kang L, Ayala JE, Lee-Young RS, Zhang Z, James FD, Neufer PD, et al. Diet-induced muscle insulin resistance is associated with extracellular matrix remodeling and interaction with integrin α2β1 in mice. Diabetes (2011) 60:416–26. doi: 10.2337/db10-1116
31. Gurina TS, Simms L. Histology, staining. Treasure Island (FL: StatPearls Publishing (2022) 1–15.
32. Wu B. Histology stains . Available at: https://dermnetnz.org/topics/histology-stains (Accessed June 13, 2023).
33. Beć KB, Grabska J, Huck CW. Biomolecular and bioanalytical applications of infrared spectroscopy – A review. Anal Chim Acta (2020) 1133:150–77. doi: 10.1016/j.aca.2020.04.015
34. Blat A, Dybas J, Chrabaszcz K, Bulat K, Jasztal A, Kaczmarska M, et al. FTIR, Raman and AFM characterization of the clinically valid biochemical parameters of the thrombi in acute ischemic stroke. Sci Rep (2019) 9:1–10. doi: 10.1038/s41598-019-51932-0
35. Sahu RK, Mordechai S. Spectroscopic techniques in medicine: The future of diagnostics. Appl Spectrosc Rev (2016) 51:484–99. doi: 10.1080/05704928.2016.1157809
36. Balan V, Mihai CT, Cojocaru FD, Uritu CM, Dodi G, Botezat D, et al. Vibrational spectroscopy fingerprinting in medicine: From molecular to clinical practice. Materials (Basel) (2019) 12:2884. doi: 10.3390/ma12182884
37. Dogan A, Lasch P, Neuschl C, Millrose MK, Alberts R, Schughart K, et al. ATR-FTIR spectroscopy reveals genomic loci regulating the tissue response in high fat diet fed BXD recombinant inbred mouse strains. BMC Genomics (2013) 14:386. doi: 10.1186/1471-2164-14-386
38. Crupi V, De Domenico D, Interdonato S, Majolino D, Maisano G, Migliardo P, et al. FT-IR spectroscopy study on cutaneous neoplasie. J Mol Struct (2001) 563–564:115–8. doi: 10.1016/S0022-2860(00)00955-8
39. Podshyvalov A, Sahu RK, Mark S, Kantarovich K, Guterman H, Goldstein J, et al. Distinction of cervical cancer biopsies by use of infrared microspectroscopy and probabilistic neural networks. Appl Opt (2005) 44:3725–34. doi: 10.1364/AO.44.003725
40. Nallala J, Diebold MD, Gobinet C, Bouché O, Sockalingum GD, Piot O, et al. Infrared spectral histopathology for cancer diagnosis: a novel approach for automated pattern recognition of colon adenocarcinoma. Analyst (2014) 139:4005–15. doi: 10.1039/C3AN01022H
41. Wang R, Naidu A, Wang Y. Oral cancer discrimination and novel oral epithelial dysplasia stratification using FTIR imaging and machine learning. Diagnostics (2021) 11:2133. doi: 10.3390/diagnostics11112133
42. Li L, Wu J, Yang L, Wang H, Xu Y, Shen K. Fourier transform infrared spectroscopy: An innovative method for the diagnosis of ovarian cancer. Cancer Manag Res (2021) 13:2389–99. doi: 10.2147/CMAR.S291906
43. Su KY, Lee WL. Fourier transform infrared spectroscopy as a cancer screening and diagnostic tool: A review and prospects. Cancers (Basel) (2020) 12:1–19. doi: 10.3390/cancers12010115
44. Luo Y, Liu H, Wu C, Paraskevaidi M, Deng Y, Shi W, et al. Diagnostic segregation of human breast tumours using Fourier-transform infrared spectroscopy coupled with multivariate analysis: Classifying cancer subtypes. Spectrochim Acta - Part A Mol Biomol Spectrosc (2021) 255:119694. doi: 10.1016/j.saa.2021.119694
45. Gazi E, Baker M, Dwyer J, Lockyer NP, Gardner P, Shanks JH, et al. A correlation of FTIR spectra derived from prostate cancer biopsies with gleason grade and tumour stage. Eur Urol (2006) 50:750–61. doi: 10.1016/j.eururo.2006.03.031
46. Baker MJ, Gazi E, Brown MD, Shanks JH, Gardner P, Clarke NW. FTIR-based spectroscopic analysis in the identification of clinically aggressive prostate cancer. Br J Cancer (2008) 99:1859–66. doi: 10.1038/sj.bjc.6604753
47. Severcan F, Gorgulu G, Gorgulu ST, Guray T. Rapid monitoring of diabetes-induced lipid peroxidation by Fourier transform infrared spectroscopy: Evidence from rat liver microsomal membranes. Anal Biochem (2005) 339:36–40. doi: 10.1016/j.ab.2005.01.011
48. Yoshida S, Yoshida M, Yamamoto M, Takeda J. Optical screening of diabetes mellitus using non-invasive Fourier-transform infrared spectroscopy technique for human lip. J Pharm BioMed Anal (2013) 76:169–76. doi: 10.1016/j.jpba.2012.12.009
49. Caine S, Heraud P, Tobin MJ, McNaughton D, Bernard CCA. The application of Fourier transform infrared microspectroscopy for the study of diseased central nervous system tissue. Neuroimage (2012) 59:3624–40. doi: 10.1016/j.neuroimage.2011.11.033
50. Lovergne L, Ghosh D, Schuck R, Polyzos AA, Chen AD, Martin MC, et al. An infrared spectral biomarker accurately predicts neurodegenerative disease class in the absence of overt symptoms. Sci Rep (2021) 11:1–19. doi: 10.1038/s41598-021-93686-8
51. Yang X, Wei X, Yu K, Wan C, Wang Y, Huang S, et al. Identification of myocardial fibrosis by ATR-FTIR spectroscopy combined with chemometrics. Spectrochim Acta - Part A Mol Biomol Spectrosc (2022) 264:120238. doi: 10.1016/j.saa.2021.120238
52. Linus A, Ebrahimi M, Turunen MJ, Saarakkala S, Joukainen A, Kröger H, et al. High-resolution infrared microspectroscopic characterization of cartilage cell microenvironment. Acta Biomater (2021) 134:252–60. doi: 10.1016/j.actbio.2021.08.001
53. Ramakrishnan N, Xia Y. Fourier-transform infrared spectroscopic imaging of articular cartilage and biomaterials: A review. Trends Appl Spectrosc (2013) 10:1–23.
54. Rakib F, Al-Saad K, Ahmed T, Ullah E, Barreto GE, Md Ashraf G, et al. Biomolecular alterations in acute traumatic brain injury (TBI) using Fourier transform infrared (FTIR) imaging spectroscopy. Spectrochim Acta - Part A Mol Biomol Spectrosc (2021) 248:119189. doi: 10.1016/j.saa.2020.119189
55. Ralbovsky NM, Lednev IK. Vibrational spectroscopy for detection of diabetes: A review. Appl Spectrosc (2021) 75:929–46. doi: 10.1177/00037028211019130
56. Yang X, Fang T, Li Y, Guo L, Li F, Huang F, et al. Pre-diabetes diagnosis based on ATR-FTIR spectroscopy combined with CART and XGBoots. Optik (Stuttg) (2019) 180:189–98. doi: 10.1016/j.ijleo.2018.11.059
57. Caixeta DC, Aguiar EMG, Cardoso-Sousa L, Coelho LMD, Oliveira SW, Espindola FS, et al. Salivary molecular spectroscopy: A sustainable, rapid and non-invasive monitoring tool for diabetes mellitus during insulin treatment. PloS One (2020) 15:1–18. doi: 10.1371/journal.pone.0223461
58. Nogueira MS, Barreto AL, Furukawa M, Rovai ES, Bastos A, Bertoncello G, et al. FTIR spectroscopy as a point of care diagnostic tool for diabetes and periodontitis: A saliva analysis approach. Photodiagnosis Photodyn Ther (2022) 40:103036. doi: 10.1016/j.pdpdt.2022.103036
59. Bottoni U, Tiriolo R, Pullano SA, Dastoli S, Amoruso GF, Nistico SP, et al. Infrared saliva analysis of psoriatic and diabetic patients: similarities in protein components. IEEE Trans BioMed Eng (2015) 63:379–84. doi: 10.1109/TBME.2015.2458967
60. Caixeta DC, Lima C, Xu Y, Guevara-Vega M, Espindola FS, Goodacre R, et al. Monitoring glucose levels in urine using FTIR spectroscopy combined with univariate and multivariate statistical methods. Spectrochim Acta - Part A Mol Biomol Spectrosc (2023) 290:122259. doi: 10.1016/j.saa.2022.122259
61. Bozkurt O, Bilgin MD, Evis Z, Pleshko N, Severcan F, Bozkurt O, et al. Early alterations in bone characteristics of type I diabetic rat femur: a Fourier transform infrared (FT-IR) imaging study. Appl Spectrosc (2016) 70:2005–15. doi: 10.1177/0003702816671059
62. Sihota P, Yadav RN, Dhaliwal R, Bose JC, Dhiman V, Neradi D, et al. Investigation of mechanical, material, and compositional determinants of human trabecular bone quality in type 2 diabetes. J Clin Endocrinol Metab (2021) 106:E2271–89. doi: 10.1210/clinem/dgab027
63. Wu D, Luo YW, Zhang J, Luo B, Zhang K, Yu K, et al. Fourier-transform infrared microspectroscopy of pulmonary edema fluid for postmortem diagnosis of diabetic ketoacidosis. Spectrochim Acta - Part A Mol Biomol Spectrosc (2021) 258:1–8. doi: 10.1016/j.saa.2021.119882
64. Geers R, Decanniere C, Villé H, Van Hecke P, Bosschaerts L. Variability within intramuscular fat content of pigs as measured by gravimetry, FTIR and NMR spectroscopy. Meat Sci (1995) 40:373–8. doi: 10.1016/0309-1740(94)00036-7
65. Jerônimo DP, De Souza RA, Da Silva FF, Camargo GL, Miranda HL, Xavier M, et al. Detection of creatine in rat muscle by FTIR spectroscopy. Ann BioMed Eng (2012) 40:2069–77. doi: 10.1007/s10439-012-0549-9
66. Magalhães S, Almeida I, Martins F, Camões F, Soares AR, Goodfellow BJ, et al. Ftir spectroscopy as a tool to study age-related changes in cardiac and skeletal muscle of female c57bl/6j mice. Molecules (2021) 26:1–12. doi: 10.3390/molecules26216410
67. Quaroni L, Christensen CR, Chen B, Vogl W, Monsalve MV. Detection of protein structure of frozen ancient human remains recovered from a glacier in Canada using synchrotron fourier transform infrared microspectroscopy. Microsc Microanal (2013) 19:565–75. doi: 10.1017/S1431927613000615
68. Gervasoni J, Primiano A, Marini F, Sabino A, Biancolillo A, Calvani R, et al. Fourier-transform infrared spectroscopy of skeletal muscle tissue: Expanding biomarkers in primary mitochondrial myopathies. Genes (Basel) (2020) 11:1–8. doi: 10.3390/genes11121522
69. Toyran N, Lasch P, Naumann D, Turan B, Severcan F. Early alterations in myocardia and vessels of the diabetic rat heart: An FTIR microspectroscopic study. Biochem J (2006) 397:427–36. doi: 10.1042/BJ20060171
70. Bozkurt O, Severcan M, Severcan F. Diabetes induces compositional, structural and functional alterations on rat skeletal soleus muscle revealed by FTIR spectroscopy: A comparative study with EDL muscle. Analyst (2010) 135:3110–9. doi: 10.1039/c0an00542h
71. Sen I, Bozkurt O, Aras E, Heise S, Brockmann GAnn, Severcan F. Lipid profiles of adipose and muscle tissues in mouse models of juvenile onset of obesity without high fat diet induction: a Fourier transform infrared (FT-IR) spectroscopic study. Appl Spectrosc (2015) 69:679–88. doi: 10.1366/14-07443
72. Zupančič B, Umek N, Ugwoke CK, Cvetko E, Horvat S, Grdadolnik J. Application of FTIR spectroscopy to detect changes in skeletal muscle composition due to obesity with insulin resistance and STZ-induced diabetes. Int J Mol Sci (2022) 23:12498. doi: 10.3390/ijms232012498
73. Rabøl R, Larsen S, Højberg PMV, Almdal T, Boushel R, Haugaard SB, et al. Regional anatomic differences in skeletal muscle mitochondrial respiration in type 2 diabetes and obesity. J Clin Endocrinol Metab (2010) 95:857–63. doi: 10.1210/jc.2009-1844
74. Green HJ, Reichmann H, Pette D. Fibre type specific transformations in the enzyme activity pattern of rat vastus lateralis muscle by prolonged endurance training. Pflügers Arch (1983) 399:216–22. doi: 10.1007/BF00656718
75. Polla B, D’Antona G, Bottinelli R, Reggiani C. Respiratory muscle fibres: Specialisation and plasticity. Thorax (2004) 59:808–17. doi: 10.1136/thx.2003.009894
76. MCR-ALS GUI v4c (2016). Umeå Univ Sweden. Available at: https://www.umu.se/en/research/infrastructure/visp/downloads/ (Accessed November 18, 2020).
77. Gorzsás A. Vibrational Spectroscopy Core Facility (2016). Umeå Univ Sweden. Available at: https://www.umu.se/en/research/infrastructure/visp/downloads/ (Accessed October 21, 2020).
78. Goodpaster BH, Theriault R, Watkins SC, Kelley DE. Intramuscular lipid content is increased in obesity and decreased by weight loss. Metabolism (2000) 49:467–72. doi: 10.1016/S0026-0495(00)80010-4
79. Masgrau A, Mishellany-Dutour A, Murakami H, Beaufrère AM, Walrand S, Giraudet C, et al. Time-course changes of muscle protein synthesis associated with obesity-induced lipotoxicity. J Physiol (2012) 590:5199–210. doi: 10.1113/jphysiol.2012.238576
80. Fairchild TJ, Fournier PA. Glycogen determination using periodic acid-schiff: Artifact of muscle preparation. Med Sci Sports Exerc (2004) 36:2053–8. doi: 10.1249/01.MSS.0000147586.85615.C4
81. McManus JFA. Histological and histochemical uses of periodic acid. Biotech Histochem (1948) 23:99–108. doi: 10.3109/10520294809106232
82. Vesentini G, Marini G, Piculo F, Damasceno DC, Matheus SMM, Felisbino SL, et al. Morphological changes in rat rectus abdominis muscle induced by diabetes and pregnancy. Braz J Med Biol Res (2018) 51:e7035. doi: 10.1590/1414-431x20177035
83. Junqueira LCU, Bignolas G, Brentani RR. Picrosirius staining plus polarization microscopy, a specific method for collagen detection in tissue sections. Histochem J (1979) 11:447–55. doi: 10.1007/BF01002772
84. Ruifrok AC, Johnston DA. Quantification of histochemical staining by color deconvolution. Anal Quant Cytol Histol (2001) 23:291–9.
85. Rohman A, Che Man YB. The optimization of FTIR spectroscopy combined with partial least square for analysis of animal fats in quartenary mixtures. Spectroscopy (2011) 25:169–76. doi: 10.3233/SPE-2011-0500
86. Stroh AM, Lynch CE, Lester BE, Minchev K, Chambers TL, Montenegro CF, et al. Human adipose and skeletal muscle tissue DNA, RNA, and protein content. J Appl Physiol (2021) 131:1370–9. doi: 10.1152/japplphysiol.00343.2021
87. Wang Q, He H, Li B, Lin H, Zhang Y, Zhang J, et al. UV–Vis and ATR–FTIR spectroscopic investigations of postmortem interval based on the changes in rabbit plasma. PloS One (2017) 12:e0182161. doi: 10.1371/journal.pone.0182161
88. Ami D, Neri T, Natalello A, Mereghetti P, Doglia SM, Zanoni M, et al. Embryonic stem cell differentiation studied by FT-IR spectroscopy. Biochim Biophys Acta - Mol Cell Res (2008) 1783:98–106. doi: 10.1016/j.bbamcr.2007.08.003
89. Alhazmi HA. FT-IR spectroscopy for the identification of binding sites and measurements of the binding interactions of important metal ions with bovine serum albumin. Sci Pharm (2019) 87:5. doi: 10.3390/scipharm87010005
90. Röhr D, Boon BDC, Schuler M, Kremer K, Hoozemans JJM, Bouwman FH, et al. Label-free vibrational imaging of different Aβ plaque types in Alzheimer’s disease reveals sequential events in plaque development. Acta Neuropathol Commun (2020) 8:1–13. doi: 10.1186/s40478-020-01091-5
91. Qin L, Bi JR, Li DM, Dong M, Zhao ZY, Dong XP, et al. Unfolding/refolding study on collagen from sea cucumber based on 2D Fourier transform infrared spectroscopy. Molecules (2016) 21:1546. doi: 10.3390/molecules21111546
92. Goormaghtigh E, Ruysschaert JM, Raussens V. Evaluation of the information content in infrared spectra for protein secondary structure determination. Biophys J (2006) 90:2946–57. doi: 10.1529/biophysj.105.072017
93. Murray-Wijelath J, Lyman DJ, Wijelath ES. Vascular graft healing. III. FTIR analysis of ePTFE graft samples from implanted bigrafts. J BioMed Mater Res - Part B Appl Biomater Off J Soc Biomater Japanese Soc Biomater Aust Soc Biomater Korean Soc Biomater (2004) 70:223–32. doi: 10.1002/jbm.b.30044
94. Volpe MG, Costantini S, Coccia E, Parrillo L, Paolucci M. Evaluation of metabolic changes induced by polyphenols in the crayfish Astacus leptodactylus by metabolomics using Fourier transformed infrared spectroscopy. J Biosci (2018) 43:585–96. doi: 10.1007/s12038-018-9774-1
95. Heys K. Vibrational spectroscopy as a tool to investigate the effects of environmental contaminants in predatory birds. United Kingdom: Lancaster University (2017).
96. Ami D, Mereghetti P, Leri M, Giorgetti S, Natalello A, Doglia SM, et al. A FTIR microspectroscopy study of the structural and biochemical perturbations induced by natively folded and aggregated transthyretin in HL-1 cardiomyocytes. Sci Rep (2018) 8:1–15. doi: 10.1038/s41598-018-30995-5
97. Belbachir K, Noreen R, Gouspillou G, Petibois C. Collagen types analysis and differentiation by FTIR spectroscopy. Anal Bioanal Chem (2009) 395:829–37. doi: 10.1007/s00216-009-3019-y
98. Wang TD, Triadafilopoulos G, Crawford JM, Dixon LR, Bhandari T, Sahbaie P, et al. Detection of endogenous biomolecules in Barrett’s esophagus by Fourier transform infrared spectroscopy. Proc Natl Acad Sci USA (2007) 104:15864–9. doi: 10.1073/pnas.0707567104
99. Serdiuk V, Shogren KL, Kovalenko T, Rasulev B, Yaszemski M, Maran A, et al. Detection of macromolecular inversion–induced structural changes in osteosarcoma cells by FTIR microspectroscopy. Anal Bioanal Chem (2020) 412:7253–62. doi: 10.1007/s00216-020-02858-4
100. Diem M. Modern vibrational spectroscopy and micro-spectroscopy: theory, instrumentation and biomedical applications. (Chichester, West Sussex, United Kingdom: John Wiley & Sons, Ltd) (2015). doi: 10.1002/9781118824924
101. Gremlich H-U, Yan B. Infrared and Raman spectroscopy of biological materials. (Boca Raton, Florida, United States: CRC Press) (2000).
102. Scott DA, Renaud DE, Krishnasamy S, Meriç P, Buduneli N, Çetinkalp Ş, et al. Diabetes-related molecular signatures in infrared spectra of human saliva. Diabetol Metab Syndr (2010) 2:1–9. doi: 10.1186/1758-5996-2-48
103. Rehman IU, Movasaghi Z, Rehman S. Vibrational spectroscopy for tissue analysis. (Boca Raton, Florida, United States: CRC press) (2019).
104. Wong PTT, Wong RK, Caputo TA, Godwin TA, Rigas B. Infrared spectroscopy of exfoliated human cervical cells: Evidence of extensive structural changes during carcinogenesis. Proc Natl Acad Sci USA (1991) 88:10988–92. doi: 10.1073/pnas.88.24.10988
105. Wong PT, Goldstein SM, Grekin RC, Godwin TA, Pivik C, Rigas B. Distinct infrared spectroscopic patterns of human basal cell carcinoma of the skin. Cancer Res (1993) 53:762–5.
106. Bellisola G, Della Peruta M, Vezzalini M, Moratti E, Vaccari L, Birarda G, et al. Tracking infrared signatures of drugs in cancer cells by Fourier transform microspectroscopy. Analyst (2010) 135:3077–86. doi: 10.1039/c0an00509f
107. Martinez-Cuazitl A, Vazquez-Zapien GJ, Sanchez-Brito M, Limon-Pacheco JH, Guerrero-Ruiz M, Garibay-Gonzalez F, et al. ATR-FTIR spectrum analysis of saliva samples from COVID-19 positive patients. Sci Rep (2021) 11:1–14. doi: 10.1038/s41598-021-99529-w
108. Sanchez-Ruiz JM, Martinez-Carrion M. A Fourier-transform infrared spectroscopic study of the phosphoserine residues in hen egg phosvitin and ovalbumin. Biochemistry (1988) 27:3338–42. doi: 10.1021/bi00409a033
109. Banyay M, Sarkar M, Gräslund A. A library of IR bands of nucleic acids in solution. Biophys Chem (2003) 104:477–88. doi: 10.1016/S0301-4622(03)00035-8
110. Ferreira ICC, Aguiar EMG, Silva ATF, Santos LLD, Cardoso-Sousa L, Araújo TG, et al. Attenuated total reflection-fourier transform infrared (ATR-FTIR) spectroscopy analysis of saliva for breast cancer diagnosis. J Oncol (2020) 2020:1–11. doi: 10.1155/2020/4343590
111. Heidari A. An analytical and computational infrared spectroscopic review of vibrational modes in nucleic acids. Austin J Anal Pharm Chem (2016) 3:1058.
112. Zucchiatti P, Mitri E, Kenig S, Bille F, Kourousias G, Bedolla DE, et al. Contribution of Ribonucleic Acid (RNA) to the fourier transform infrared (FTIR) Spectrum of eukaryotic cells. Anal Chem (2016) 88:12090–8. doi: 10.1021/acs.analchem.6b02744
113. Dovbeshko GI, Gridina NY, Kruglova EB, Pashchuk OP. FTIR spectroscopy studies of nucleic acid damage. Talanta (2000) 53:233–46. doi: 10.1016/S0039-9140(00)00462-8
114. Simonova D, Karamancheva I. Application of Fourier transform infrared spectroscopy for tumor diagnosis. Biotechnol Biotechnol Equip (2013) 27:4200–7. doi: 10.5504/BBEQ.2013.0106
115. Wiercigroch E, Szafraniec E, Czamara K, Pacia MZ, Majzner K, Kochan K, et al. Raman and infrared spectroscopy of carbohydrates: A review. Spectrochim Acta - Part A Mol Biomol Spectrosc (2017) 185:317–35. doi: 10.1016/j.saa.2017.05.045
116. Chiriboga L, Xie P, Yee H, Vigorita V, Zarou D, Zakim D, et al. Infrared spectroscopy of human tissue. I. Differentiation and maturation of epithelial cells in the human cervix. Biospectroscopy (1998) 4:47–53. doi: 10.1002/(sici)1520-6343(1998)4:1<47::aid-bspy5>3.0.co;2-p
117. Koch C, Brandstetter M, Wechselberger P, Lorantfy B, Plata MR, Radel S, et al. Ultrasound-enhanced attenuated total reflection mid-infrared spectroscopy in-line probe: Acquisition of cell spectra in a bioreactor. Anal Chem (2015) 87:2314–20. doi: 10.1021/ac504126v
118. Olsztyńska-Janus S, Pietruszka A, Kiełbowicz Z, Czarnecki MA. ATR-IR study of skin components: Lipids, proteins and water. Part I: Temperature effect. Spectrochim Acta - Part A Mol Biomol Spectrosc (2018) 188:37–49. doi: 10.1016/j.saa.2017.07.001
119. Movasaghi Z, Rehman S, Rehman IU. Fourier transform infrared (FTIR) spectroscopy of biological tissues. Appl Spectrosc Rev (2008) 43:134–79. doi: 10.1080/05704920701829043
120. Tamosaityte S, Galli R, Uckermann O, Sitoci-Ficici KH, Later R, Beiermeister R, et al. Biochemical monitoring of spinal cord injury by FT-IR spectroscopy-effects of therapeutic alginate implant in rat models. PloS One (2015) 10:e0142660. doi: 10.1371/journal.pone.0142660
121. Derenne A, Claessens T, Conus C, Goormaghtigh E. Encyclopedia of biophysics. In: Roberts GCK, editor. Encyclopedia of Biophysics. European Biophysical Societies’ Association (EBSA) (Berlin, Heidelberg, Germany: Springer) (2013). p. 1074–81. doi: 10.1007/978-3-642-16712-6
122. Fringeli UP, Günthard HH. Infrared membrane spectroscopy. Mol Biol Biochem Biophys (1981) 31:270–332. doi: 10.1007/978-3-642-81537-9_6
123. Liang P, Wang H, Chen C, Ge F, Liu D, Li S, et al. The use of fourier transform infrared spectroscopy for quantification of adulteration in virgin walnut oil. J Spectrosc (2013) 2013:1–6. doi: 10.1155/2013/305604
124. Najbjerg H, Afseth NK, Young JF, Bertram HC, Pedersen ME, Grimmer S, et al. Monitoring cellular responses upon fatty acid exposure by Fourier transform infrared spectroscopy and Raman spectroscopy. Analyst (2011) 136:1649–58. doi: 10.1039/c0an00916d
125. Böcker U, Ofstad R, Wu Z, Bertram HC, Sockalingum GD, Manfait M, et al. Revealing covariance structures in fourier transform infrared and Raman microspectroscopy spectra: A study on pork muscle fiber tissue subjected to different processing parameters. Appl Spectrosc (2007) 61:1032–9. doi: 10.1366/000370207782217707
126. Lopes JS. FTIR, a potential tool to dementia diagnosis through analysis of plasma. (Aveiro, Portugal: Aveiro University) (2015).
127. Yoshida S, Yoshida H. Nondestructive analyses of unsaturated fatty acid species in dietary oils by attenuated total reflectance with Fourier transform IR spectroscopy. Biopolymers (2003) 70:604–13. doi: 10.1002/bip.10505
128. Yoshida S, Miyazaki M, Sakai K, Takeshita M, Yuasa S, Sato A, et al. Fourier transform infrared spectroscopic analysis of rat brain microsomal membranes modified by dietary fatty acids: Possible correlation with altered learning behavior. Biospectroscopy (1997) 3:281–90. doi: 10.1002/(SICI)1520-6343(1997)3:4<281::AID-BSPY3>3.0.CO;2-7
129. Guillén MD, Cabo N. Study of the effects of smoke flavourings on the oxidative stability of the lipids of pork adipose tissue by means of Fourier transform infrared spectroscopy. Meat Sci (2004) 66:647–57. doi: 10.1016/S0309-1740(03)00185-2
130. Wrobel T P, Mateuszuk L, Chlopicki S, Malek K, Baranska M. Imaging of lipids in atherosclerotic lesion in aorta from ApoE/LDLR -/- mice by FT-IR spectroscopy and Hierarchical Cluster Analysis. Analyst (2011) 136:5247–55. doi: 10.1039/c1an15311k
131. Aminullah, Mardiah, Sutsuga H, Kemala T. Study of different extraction methods on finger print and fatty acid of raw beef fat using fourier transform infrared and gas chromatography-mass spectrometry. Open Chem (2018) 16:1099–105. doi: 10.1515/chem-2018-0109
132. Bridelli MG, Stani C, Bedotti R. Fourier transform infrared conformational investigation of type I collagen aged by in vitro induced dehydration and non-enzymatic glycation treatments. J Biol Res della Soc Ital di Biol Sper (2017) 90:45–50. doi: 10.4081/JBR.2017.6254
133. Sanden KW, Kohler A, Afseth NK, Böcker U, Rønning SB, Liland KH, et al. The use of Fourier-transform infrared spectroscopy to characterize connective tissue components in skeletal muscle of Atlantic cod (Gadus morhua L.). J Biophotonics (2019) 12:e201800436. doi: 10.1002/jbio.201800436
134. Zohdi V, Whelan DR, Wood BR, Pearson JT, Bambery KR, Black MJ. Importance of tissue preparation methods in FTIR micro-spectroscopical analysis of biological tissues: “Traps for new users.” PloS One (2015) 10:1–11. doi: 10.1371/journal.pone.0116491
135. Petibois C, Gouspillou G, Wehbe K, Delage JP, Déléris G. Analysis of type I and IV collagens by FT-IR spectroscopy and imaging for a molecular investigation of skeletal muscle connective tissue. Anal Bioanal Chem (2006) 386:1961–6. doi: 10.1007/s00216-006-0828-0
136. Jackson M, Choo LP, Watson PH, Halliday WC, Mantsch HH. Beware of connective tissue proteins: Assignment and implications of collagen absorptions in infrared spectra of human tissues. BBA - Mol Basis Dis (1995) 1270:1–6. doi: 10.1016/0925-4439(94)00056-V
Keywords: diabetes mellitus, skeletal muscle, metabolism, macromolecular composition, infrared spectroscopy, multivariate analysis, histochemical assays
Citation: Zupančič B, Ugwoke CK, Abdelmonaem MEA, Alibegović A, Cvetko E, Grdadolnik J, Šerbec A and Umek N (2023) Exploration of macromolecular phenotype of human skeletal muscle in diabetes using infrared spectroscopy. Front. Endocrinol. 14:1308373. doi: 10.3389/fendo.2023.1308373
Received: 06 October 2023; Accepted: 29 November 2023;
Published: 21 December 2023.
Edited by:
Xuebin Fu, Ann & Robert H. Lurie Children’s Hospital of Chicago, United StatesReviewed by:
Krzysztof Czamara, Jagiellonian University, PolandChen Li, Free University of Berlin, Germany
Kai Song, University of California, Los Angeles, United States
Copyright © 2023 Zupančič, Ugwoke, Abdelmonaem, Alibegović, Cvetko, Grdadolnik, Šerbec and Umek. This is an open-access article distributed under the terms of the Creative Commons Attribution License (CC BY). The use, distribution or reproduction in other forums is permitted, provided the original author(s) and the copyright owner(s) are credited and that the original publication in this journal is cited, in accordance with accepted academic practice. No use, distribution or reproduction is permitted which does not comply with these terms.
*Correspondence: Nejc Umek, bmVqYy51bWVrQG1mLnVuaS1sai5zaQ==; Barbara Zupančič, YmFyYmFyYS56dXBhbmNpY0BraS5zaQ==
†These authors have contributed equally to this work and share first authorship