 Xiaobin Zeng1
 Shiyang Li
- 1Division of Cardiology, Panzhihua Central Hospital, Panzhihua, China
- 2Clinical Laboratory, Panzhihua Central Hospital, Panzhihua, China
- 3Department of Geriatrics, Panzhihua Central Hospital, Panzhihua, China
- 4Department of Geriatrics, Panzhihua Central Hospital Affiliated to Dali University, Dali, China
Background: The triglyceride–glucose (TyG) index has been confirmed to be a predictor of cardiovascular diseases. The present study aimed to assess the predictive value of TyG index for left ventricular aneurysm (LVA) formation and prognosis in patients with acute ST-segment elevation myocardial infarction (STEMI) who underwent primary percutaneous coronary intervention (PCI).
Methods: This prospective study included 991 patients with acute STEMI who underwent primary PCI. Multivariable logistic regression and receiver operating characteristic (ROC) curve analysis were used to assess the predictive value of TyG index for LVA formation. Prognosis analysis was performed with cox proportional hazard regression.
Results: The prevalence of LVA was 14.4%. A higher TyG index was associated with a greater incidence of LVA (23.1% vs. 11.8%, P< 0.001). The TyG index was also higher in the LVA group than in the non-LVA group (9.4 ± 0.9 vs. 9.0 ± 0.8, P<0.001). Multivariable logistic regression analysis revealed that the TyG index was independently associated with the risk of LVA [odds ratio (OR)= 2.4, 95% confidence interval (CI)= 1.51-3.82, P< 0.001]. The predictive value of the TyG index remained significant even after cross-validation by dividing the study population into a training set (OR= 2.32, 95% CI= 1.24-4.35, P= 0.009) and validation set (OR= 3.19, 95% CI= 1.42-7.19, P= 0.005). Higher TyG index was correlated with increased risk of cardiac death (HR= 2.17, P= 0.04). The maximal length and width of LVA were significantly increased in patients with TyG index ≥ 9.68 compared with < 9.68 (P< 0.001). The discriminant power of TyG index for LVA was 0.742, which was superior to both triglyceride (C statistic= 0.666) and fasting blood glucose (C statistic= 0.613). The combination of TyG index, left ventricular ejection fraction, gensini score, and left anterior descending artery as the culprit vessel could significantly improve the predictive ability (C statistic= 0.908).
Conclusions: A higher TyG index was an independent predictor for LVA formation and increased risk of cardiac death in patients with STEMI who underwent primary PCI.
Introduction
ST-segment elevation myocardial infarction (STEMI) is the most dramatic manifestation of acute myocardial infarction (AMI) associated with increased short- and long-term cardiac death (1). Left ventricular aneurysm (LVA) is a common and severe complication of AMI, characterized by the outward expansion of the infarcted myocardium during both systole and diastole (2). Patients with AMI and LVA have a six-fold higher cardiac death rate compared to those without LVA, primarily due to the higher incidence of arrhythmias, thromboembolic phenomena, congestive heart failure, and cardiac rupture (3, 4). Given the high incidence rate (10%-38% of patients with AMI) (5) and poor prognosis associated with LVA, it is crucial to identify risk factors that contribute to its formation for effective prophylactic treatment.
The triglyceride-glucose (TyG) index, which is calculated using fasting triglyceride and blood glucose level data, has been identified as a reliable biomarker for evaluating insulin resistance (IR) (6). Additionally, numerous studies have indicated an association between TyG index and cardiovascular diseases. In a prospective cohort study involving 823 patients, a high TyG index was found to be correlated with an increased risk for cardiac death and rehospitalization in patients with heart failure with preserved ejection fraction (7). Furthermore, Chen. et al. reported that the TyG index was associated with recurrent revascularization in patients with type 2 diabetes mellitus after percutaneous coronary intervention (8). Moreover, the TyG index has been demonstrated to be an effective prognostic factor and for risk stratification in patients with acute coronary syndrome (ACS) (9–13). More importantly, the molecular mechanisms of TyG index as a marker for predicting cardiovascular diseases have also been studied, and included metabolic fexibility, endothelial dysfunction, coagulation disorders, and smooth muscle cell dysfunction (9). However, no study has investigated the association between TyG index and the risk of LVA formation. As such, the purpose of the present study was to assess the predictive value of the TyG index for the risk of LVA formation in patients with acute STEMI in a sample of the Chinese population.
Methods
Study design and participants
This study was approved by the Review Board of Panzhihua central hospital (Sichuan, Panzhihua, China) and adhered to the principles of the Declaration of Helsinki. Written informed consents were obtained from all participants. A total of 1201 consecutive patients with acute STEMI, who underwent primary PCI at the Cardiology Division of Panzhihua Central Hospital between March 2018 and June 2023, were recruited. Acute STEMI was diagnosed based on the fourth universal definition of myocardial infarction (14), which includes the following criteria: typical chest pain lasting > 30 minutes, with new ST-segment elevation at the J point in at least two contiguous leads of > 2 mm (0.2 mV) in males or > 1.5 mm (0.15 mV) in females on admission electrocardiogram, and an increase in cardiac enzyme levels > 99th percentile cut-off point for cardiac troponin I (cTnI). The exclusion criteria consisted of non-ischemic cardiomyopathy (including hypertrophic and dilated cardiomyopathy), congenital heart disease, renal or liver failure, active infection, malignant tumors or a life expectancy < 1 year, thrombolytic therapy before admission, or loss to follow-up. Ultimately, a total of 991 patients were included in the association analysis.
PCI procedure and definitions
Before primary PCI, all patients were administered aspirin (300 mg loading dose followed by 100 mg daily), clopidogrel (of 600 mg loading dose followed by 75 mg daily), or ticagrelor (180 mg loading dose followed by 90 mg twice daily). In addition, a bolus of unfractionated heparin (UFH) was administered intravenously at a dose of 70 U/kg of body weight. The primary PCI procedure was performed using either the standard radial or femoral approach, in accordance with current guidelines. A stent was deployed in the culprit artery of all patients. During the PCI procedure, the operator had the discretion to decide whether to use balloon pre-dilatation or post-dilatation, type of stents (bare metal or drug-eluting), and the application of thrombus aspiration. The glycoprotein IIb/IIIa receptor inhibitor tirofiban was initiated during the PCI procedure, at the operator’s discretion, with a 10 μg/kg intracoronary bolus followed by a 0.15 μg/kg/min intravenous infusion. A technically successful stent implantation was defined as residual postprocedural stenosis < 10% in the culprit lesion. Two independent experts assessed and confirmed the results of coronary angiograms, as well as the extent and degree of stenosis in each major coronary artery vessel. On discharge, medical therapy was prescribed based on individual patient condition and guideline recommendations for secondary prevention.
Clinical follow-up and data collection
In this study, we conducted follow-up every 3 months through outpatient interview or by telephone contact. The primary endpoint was defined as development of LVA. The secondary endpoint was defined as cardiac deaths. Trained physicians blinded to the study’s purpose were charged with collecting information regarding patient demographics and clinical characteristics, including age, sex, hypertension, diabetes, smoking status, and medication used at discharge from the electronic medical recording system. Venous blood samples for laboratory investigations were collected from all patients on admission to the emergency room before primary PCI, as well as 8–12 h after PCI. To determine the peak value of cardiac enzyme levels, blood samples for troponin I (TnI) and lactate dehydrogenase (LDH) were obtained from a peripheral vein, after admission to the intensive coronary care unit, every 12 h during the first 48 h and every 24 h during the remainder of the stay in the intensive coronary care unit. Fasting blood-glucose (FBG) and lipid levels were measured after PCI. The TyG index was calculated using the following equation (9): In (fasting triglyceride [mg/dl] × FBG [mg/dl])/2.
Definitions
The diagnosis of left ventricular aneurysm (LVA) was performed in accordance with the protocol outlined in the Coronary Artery Surgery Study (CASS) (15). The criteria for diagnosing LVA included the following: (I) bulging of the left ventricular wall during both diastole and systole, exhibiting either akinesia or dyskinesia; (II) clear demarcation of the infarcted segment; and (III) absence of trabeculation in the affected segment. After admission, two-dimensional transthoracic echocardiography (TTE) was performed within 3 days, and at 1 and 6 months during the follow-up period. LVA was diagnosed using TTE at the 6-month follow-up. Additionally, hypertension was defined as treatment for hypertension before admission or a blood pressure > 140/90 mmHg. Diabetes mellitus was defined as a fasting plasma glucose level > 7.0 mmol/L, a postprandial blood glucose level > 11.1 mmol/L, a hemoglobin A1c level > 6.5%, or treatment for diabetes mellitus. Smoking history was defined as having smoked > 2 pack-years and/or having smoked within the past year.
The Gensini score was calculated using the method developed by Celebi et al. (16). In summary, a severity score was assigned to each coronary stenosis based on the degree of narrowing (in %), as follows: ≤ 25% (1 point); 26% to 50% (2 points); 51% to 75% (4 points); 76% to 90% (8 points); 91% to 99% (16 points); and total occlusion (32 points). Additionally, each coronary stenosis score was multiplied by a factor that considered the importance of the lesion’s position in the coronary circulation: 5 for the left main coronary artery; 2.5 for the proximal segment of the left anterior descending coronary artery (LAD); 2.5 for the proximal segment of the circumflex artery; 1.5 for the mid-segment of the LAD; 1.0 for the right coronary artery, the distal segment of LAD, the posterolateral artery, or the obtuse marginal artery; and 0.5 for the other segments. The sum of the scores for each coronary segment yielded the Gensini score.
Statistical analysis
Statistical analyses were performed using SPSS 26 (IBM Corporation Armonk, NY, USA). Descriptive statistics were expressed as number (percent) for categorical variables and as median and interquartile range (IQR) or mean and standard deviation (SD) for continuous variables. The best cut-off value of TyG index to stratify patients into two groups was determined to be 8.98 according to the receiver operating characteristic (ROC) curve analysis. Differences among groups were assessed using appropriate statistical tests, including the chi-squared, independent-sample t, or Mann–Whitney U tests. Univariate logistic regression analysis was used to examine the association between different variables and the risk for LVA formation. Variables with P< 0.05 in the univariate analysis were included in the multivariate logistic regression analysis. Cox proportional hazard regression models were performed to calculate the hazard ratio (HR) and 95% confidence intervals (95% CIs) for the associations between the TyG index and the prognosis of patients. All comparisons were two-sided, and differences with P< 0.05 were considered to be statistically significant.
Results
Patient characteristics
A flow-diagram depicting the overall workflow of the study is presented in Figure 1. Baseline characteristics of the cohort (n = 991) are summarized in Table 1. The mean (± SD) age of the study cohort (78.4% male) was 61.1 ± 12.8 years. Throughout the follow-up period for TTE, a total of 143 LVA incidents (14.4%) were observed.
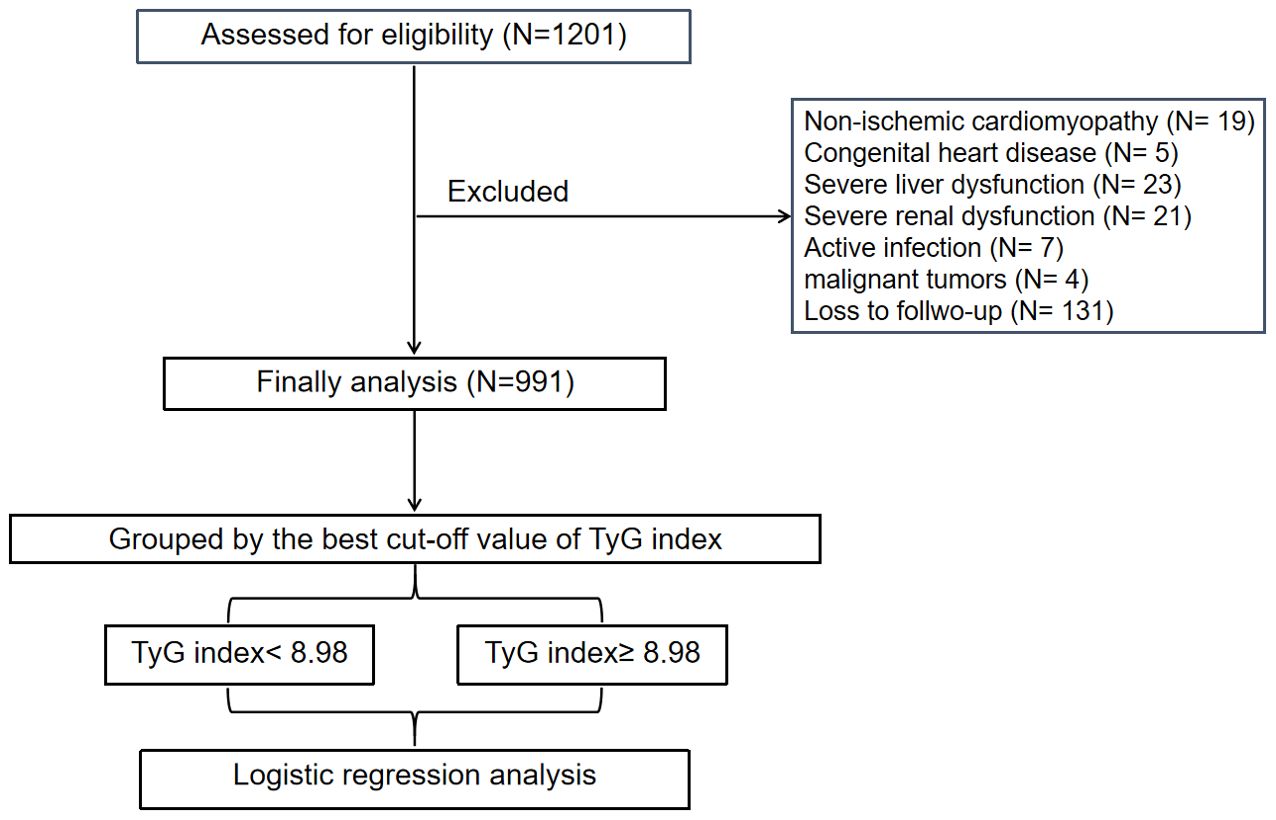
Figure 1. The overall workflow of methodology in the present study. TyG, triglyceride-glucose.
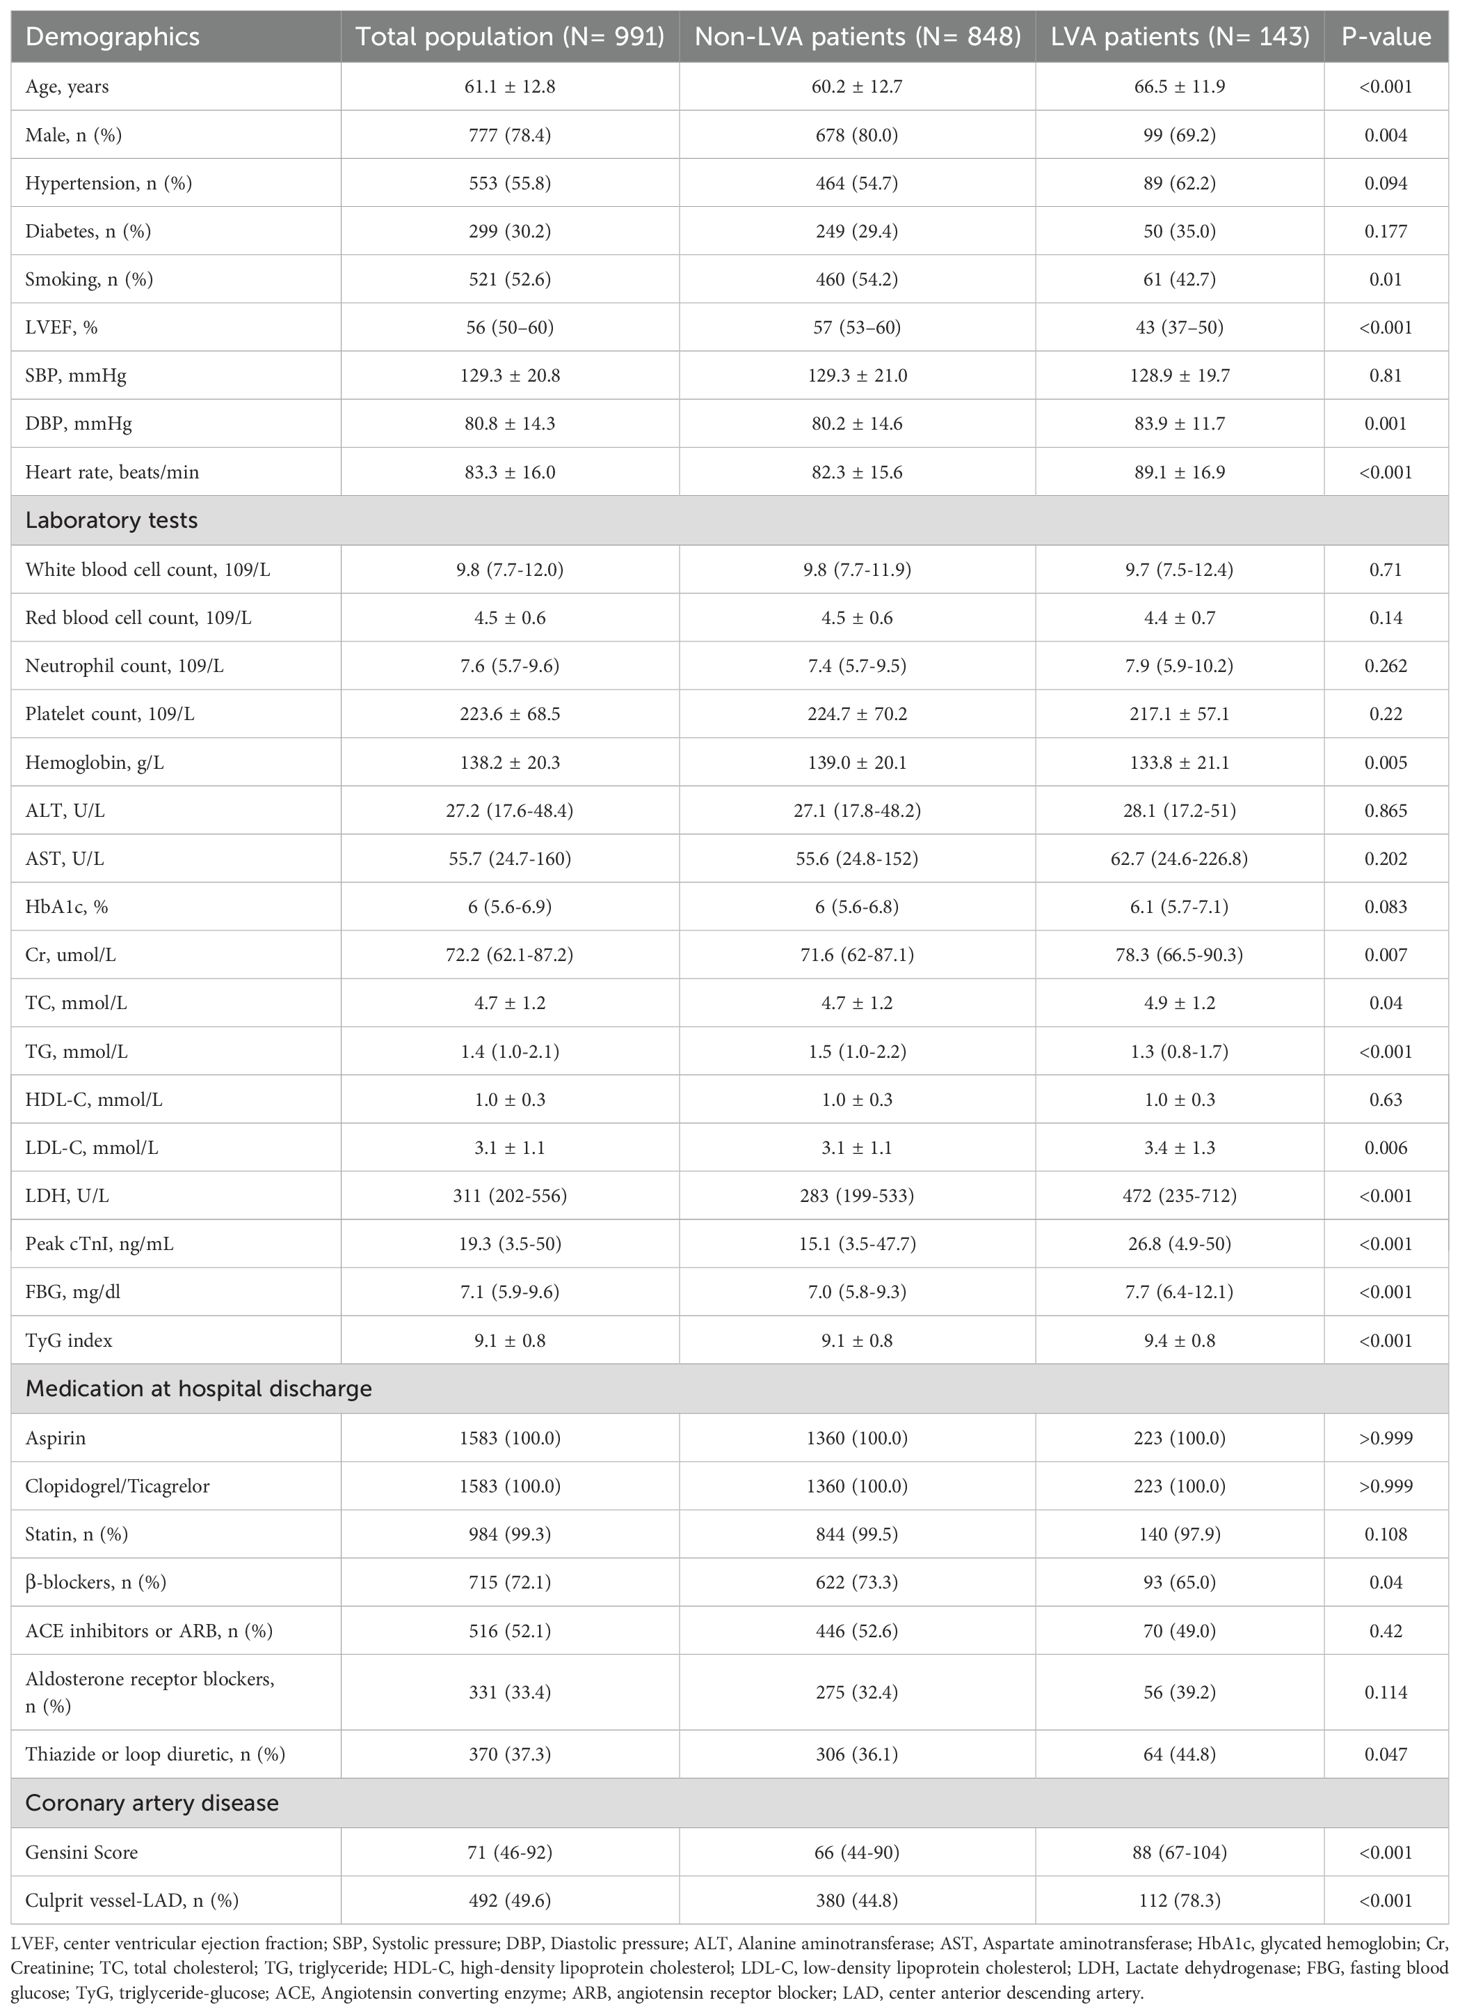
Table 1. Baseline characteristics and laboratory findings of study population according to the presence of center ventricular aneurysmus.
Subsequently, baseline demographics and clinical characteristics of the patients in groups with and without LVA formation were compared. As shown in Table 1, patients in the LVA group were older, more likely to be female, and exhibited higher levels of diastolic blood pressure (DBP), heart rate, creatinine (Cr), total cholesterol (TC), low-density lipoprotein cholesterol (LDL-C), LDH, Peak cTnI, fasting blood glucose (FBG), TyG index, gensini score, and a higher proportion of thiazide or loop diuretic use, and LAD as the culprit vessel (P< 0.05) compared with those in the non-LVA group. Conversely, the proportion of patients who smoked and used β-blockers, the level of left ventricular ejection fraction (LVEF), hemoglobin, and triglycerides (TG) were lower in patients with LVA formation compared to those without LVA (P< 0.05).
According to the maximum Youden Index criterion and ROC curve analysis, the optimal cut-off value for the TyG index to stratify patients into two groups was determined to be < 8.98 and ≥ 8.98. As shown in Table 2, patients in the TyG≥ 8.98 group were younger, more likely to be female, and had higher systolic pressure (SBP), DBP, red blood cell count, hemoglobin, HbA1c, TC, TG, LDL-C, and FBG, as well as a higher prevalence of diabetes and LVA formation. In contrast, patients with TyG≥ 8.98 had lower levels of AST, high-density lipoprotein cholesterol (HDL-C), and Peak cTnI compared to those with TyG< 8.98.
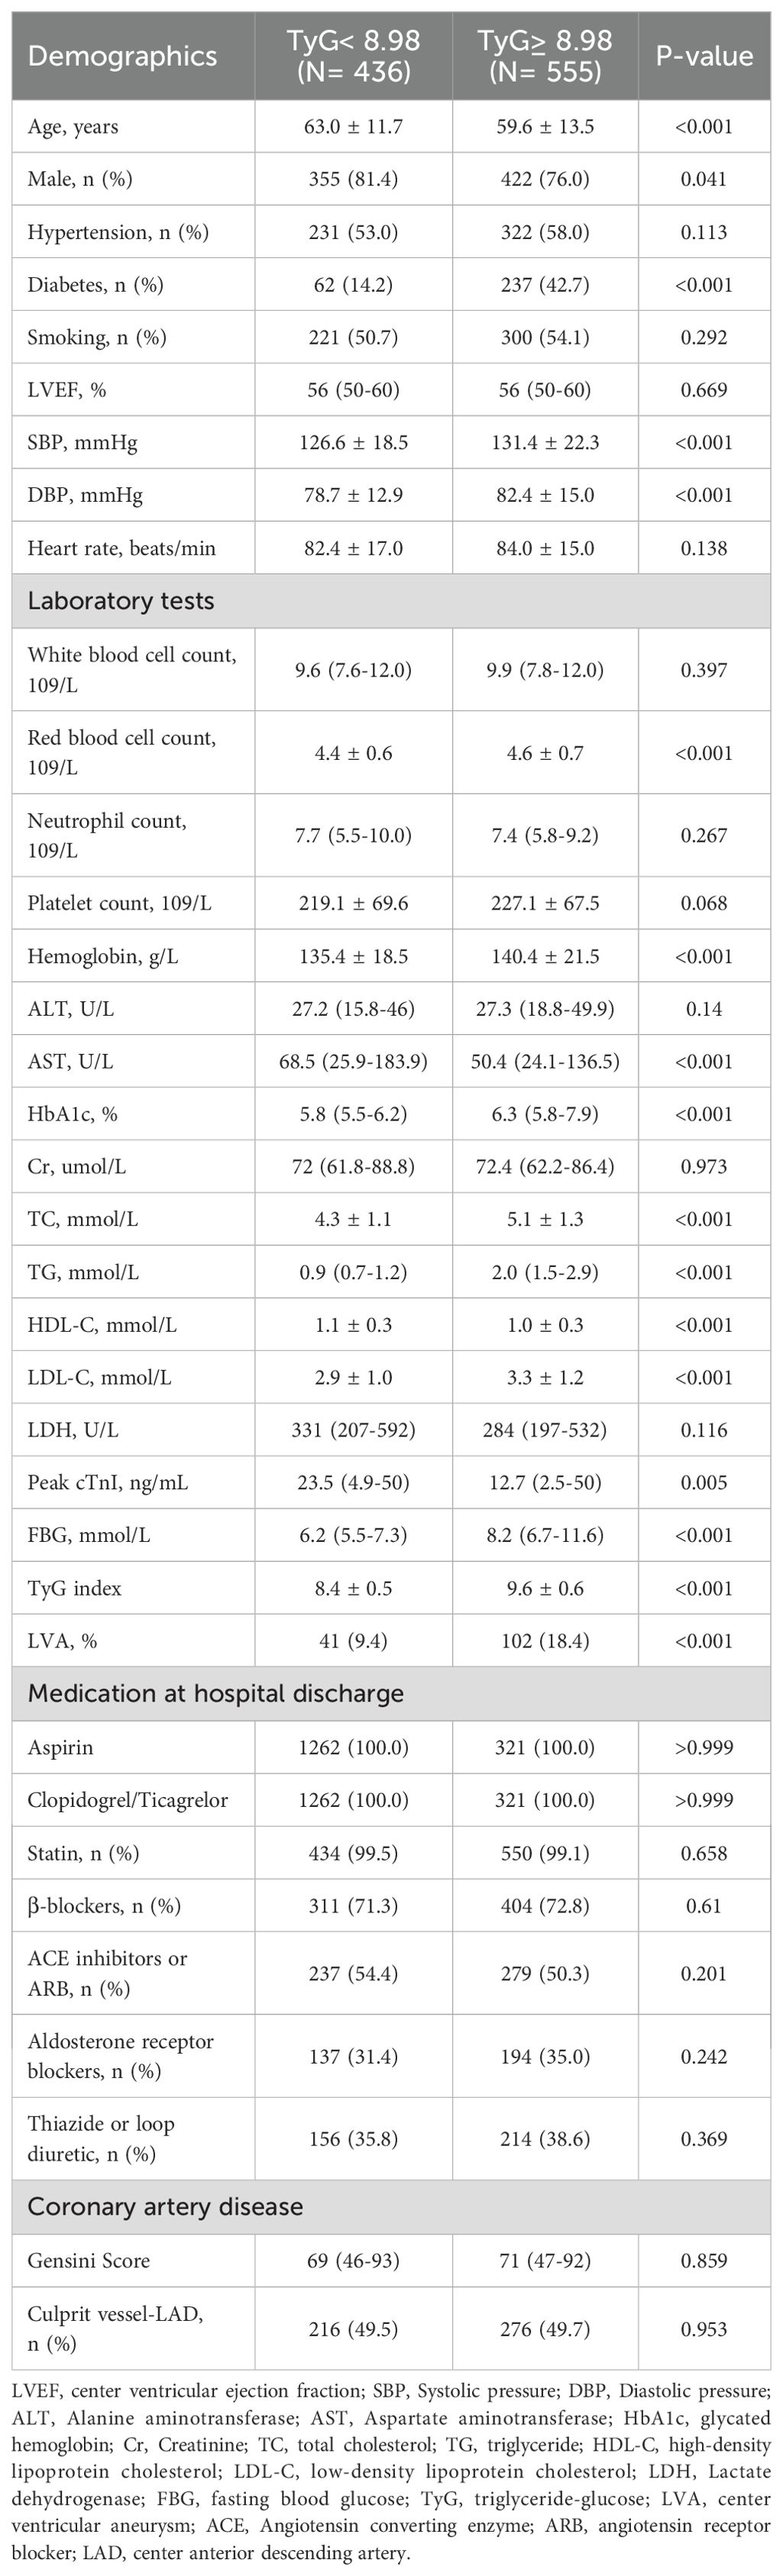
Table 2. Comparison of the baseline characteristics and laboratory findings grouped by TyG index.
TyG index and the incidence of LVA in patients who underwent primary PCI
As depicted in Figure 2A, the incidence of LVA formation increased with the rise in TyG index (9.4% vs. 18.4%, P< 0.001). Additionally, the LVA group exhibited a significantly higher TyG index than the non-LVA group (9.4 ± 0.8 vs. 9.1 ± 0.8, P < 0.001) (Figure 2B).
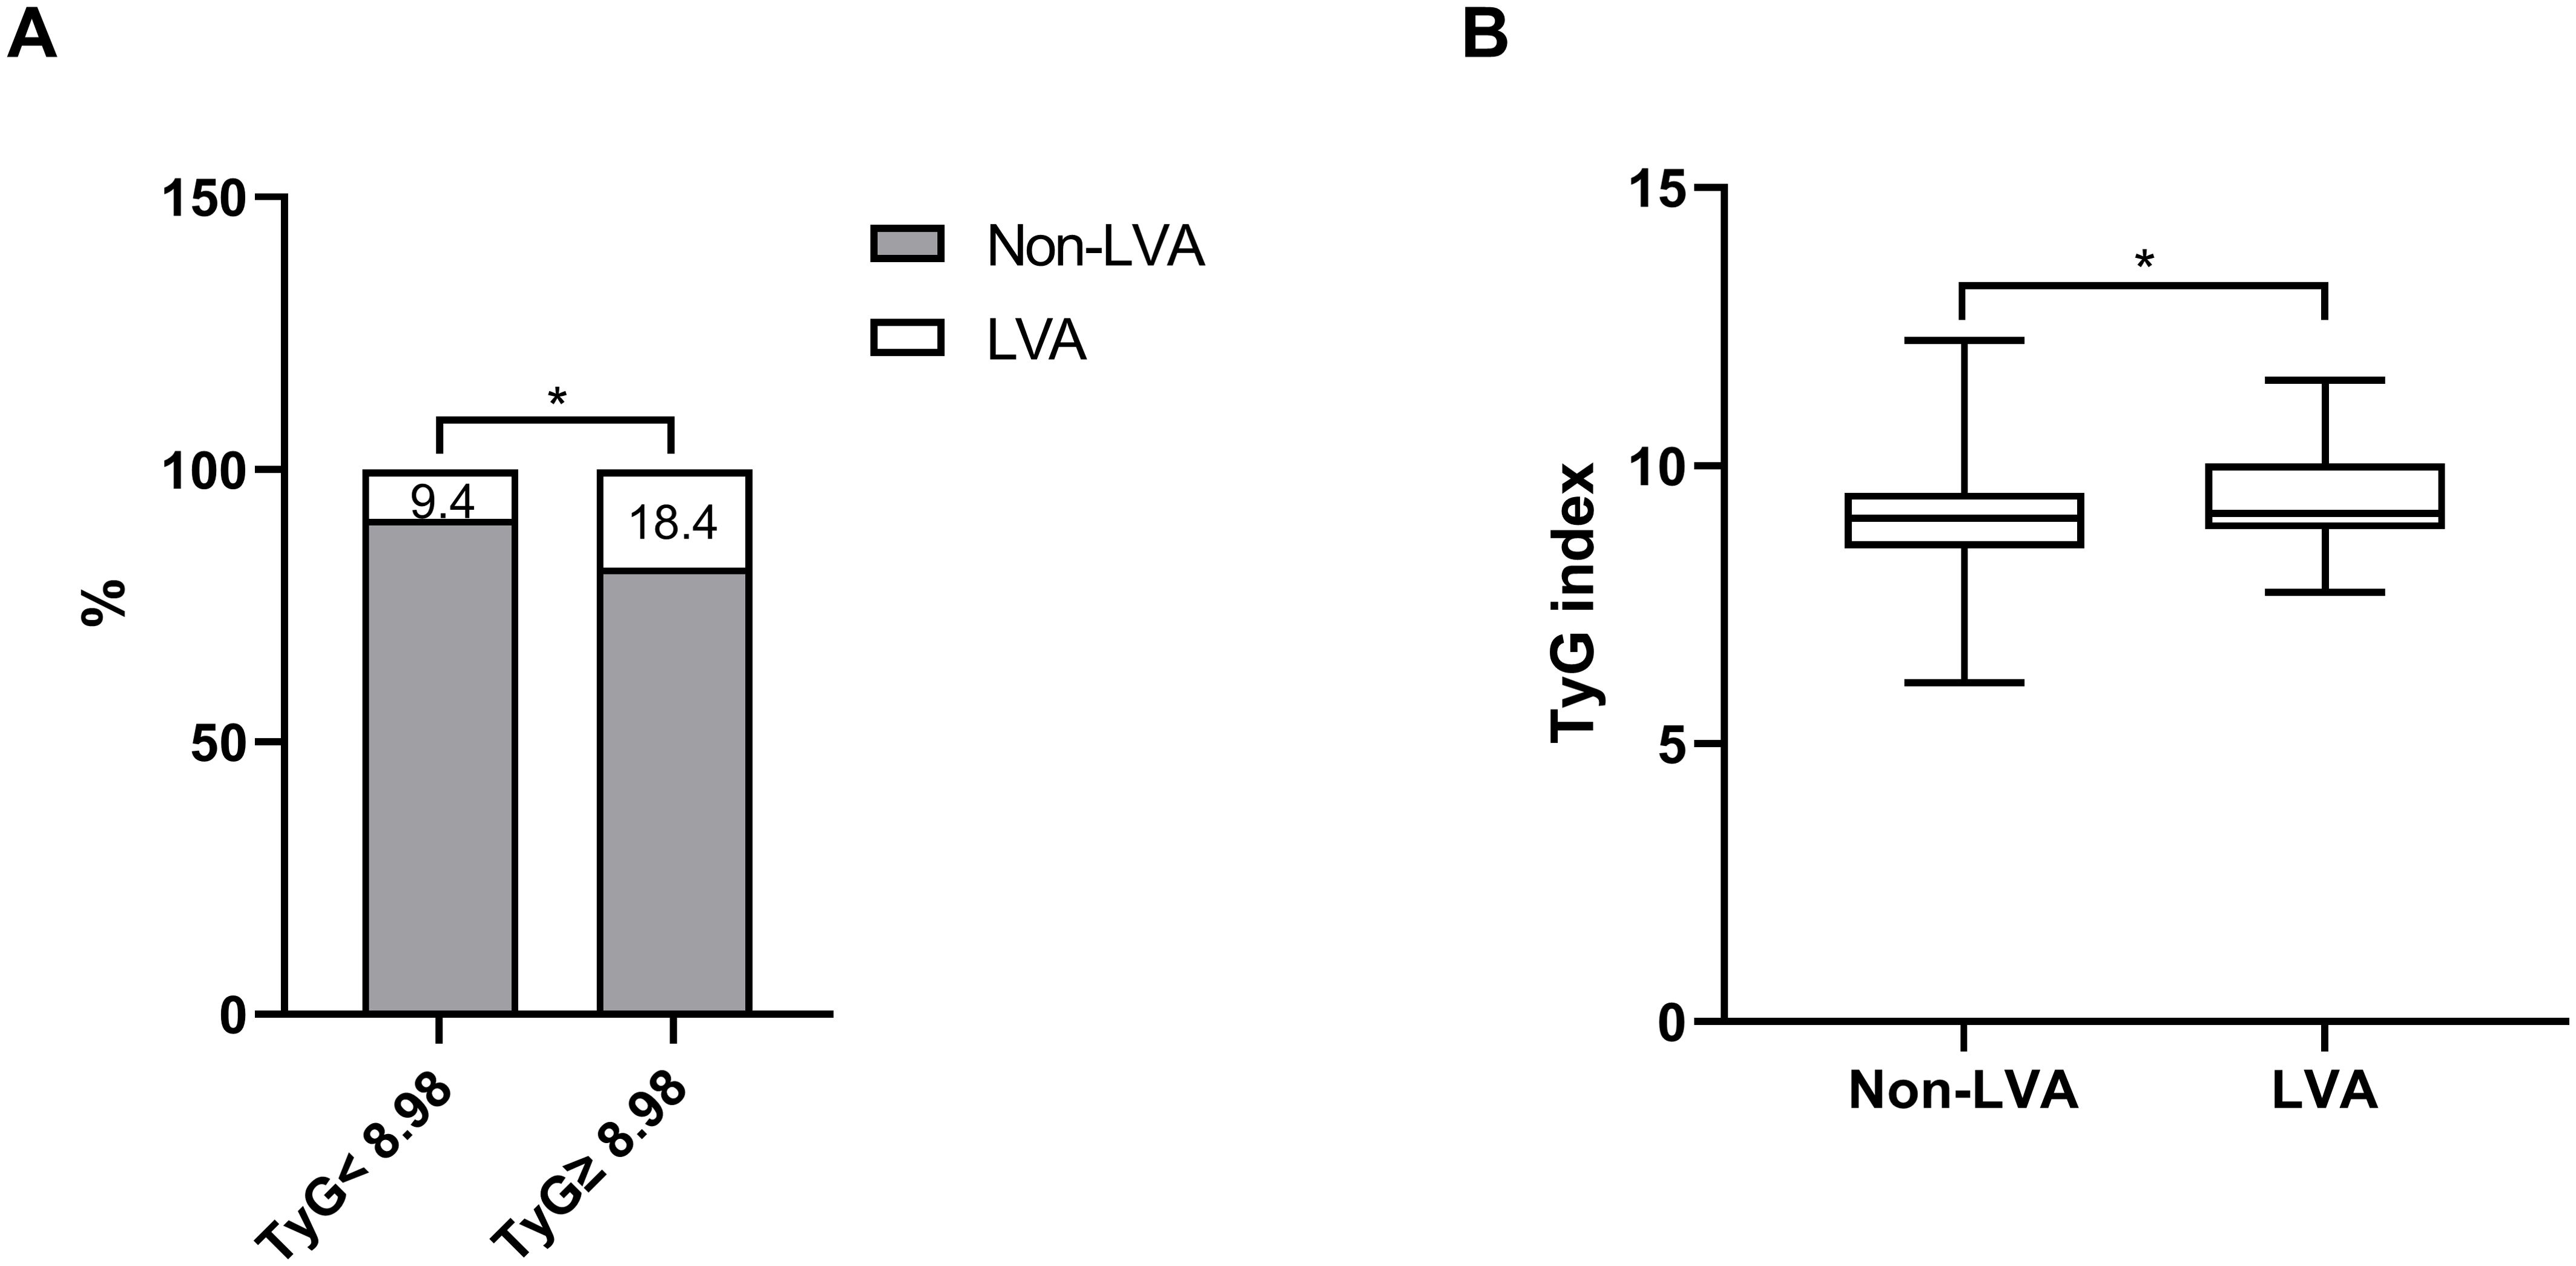
Figure 2. The association between the TyG index and the prevalence of LVA (A) and comparison of the TyG index level between the LVA and non-LVA groups (B). TyG, triglyceride-glucose; LVA, left ventricular aneurysm; * P<0.05.
Furthermore, subgroup analysis was performed to assess the association between the TyG index and the incidence of LVA. The prevalence of LVA increased with the rise in TyG index in both males (8.7% vs 16.4%, P= 0.027) and females (12.3% vs 24.8%, P= 0.002), age < 65 years (7.3% vs 15.9%, P= 0.002) and ≥ 65 years (11.9% vs 22.3%, P= 0.005), non-hypertension (6.8% vs 17.2%, P= 0.001) and hypertension (11.7% vs 19.3%, P= 0.017), non-diabetes (9.1% vs 15.4%, P= 0.011), non-smoking (12.6% vs 19.6%, P= 0.04) and smoking (6.3% vs 17.3%, P< 0.001), LVEF < 50% (30.5% vs 47.4%, P= 0.011) and LVEF ≥ 50% (3.5% vs 9.2%, P= 0.002) (Figures 3A–F). Simultaneously, the TyG index between the non-LVA and LVA groups in these subgroups was also compared. The results revealed that the TyG index was significantly higher in the LVA group compared to the non-LVA group in all subgroups except for female, patients with non-smoking and LVEF < 50% (Figures 4A–F).
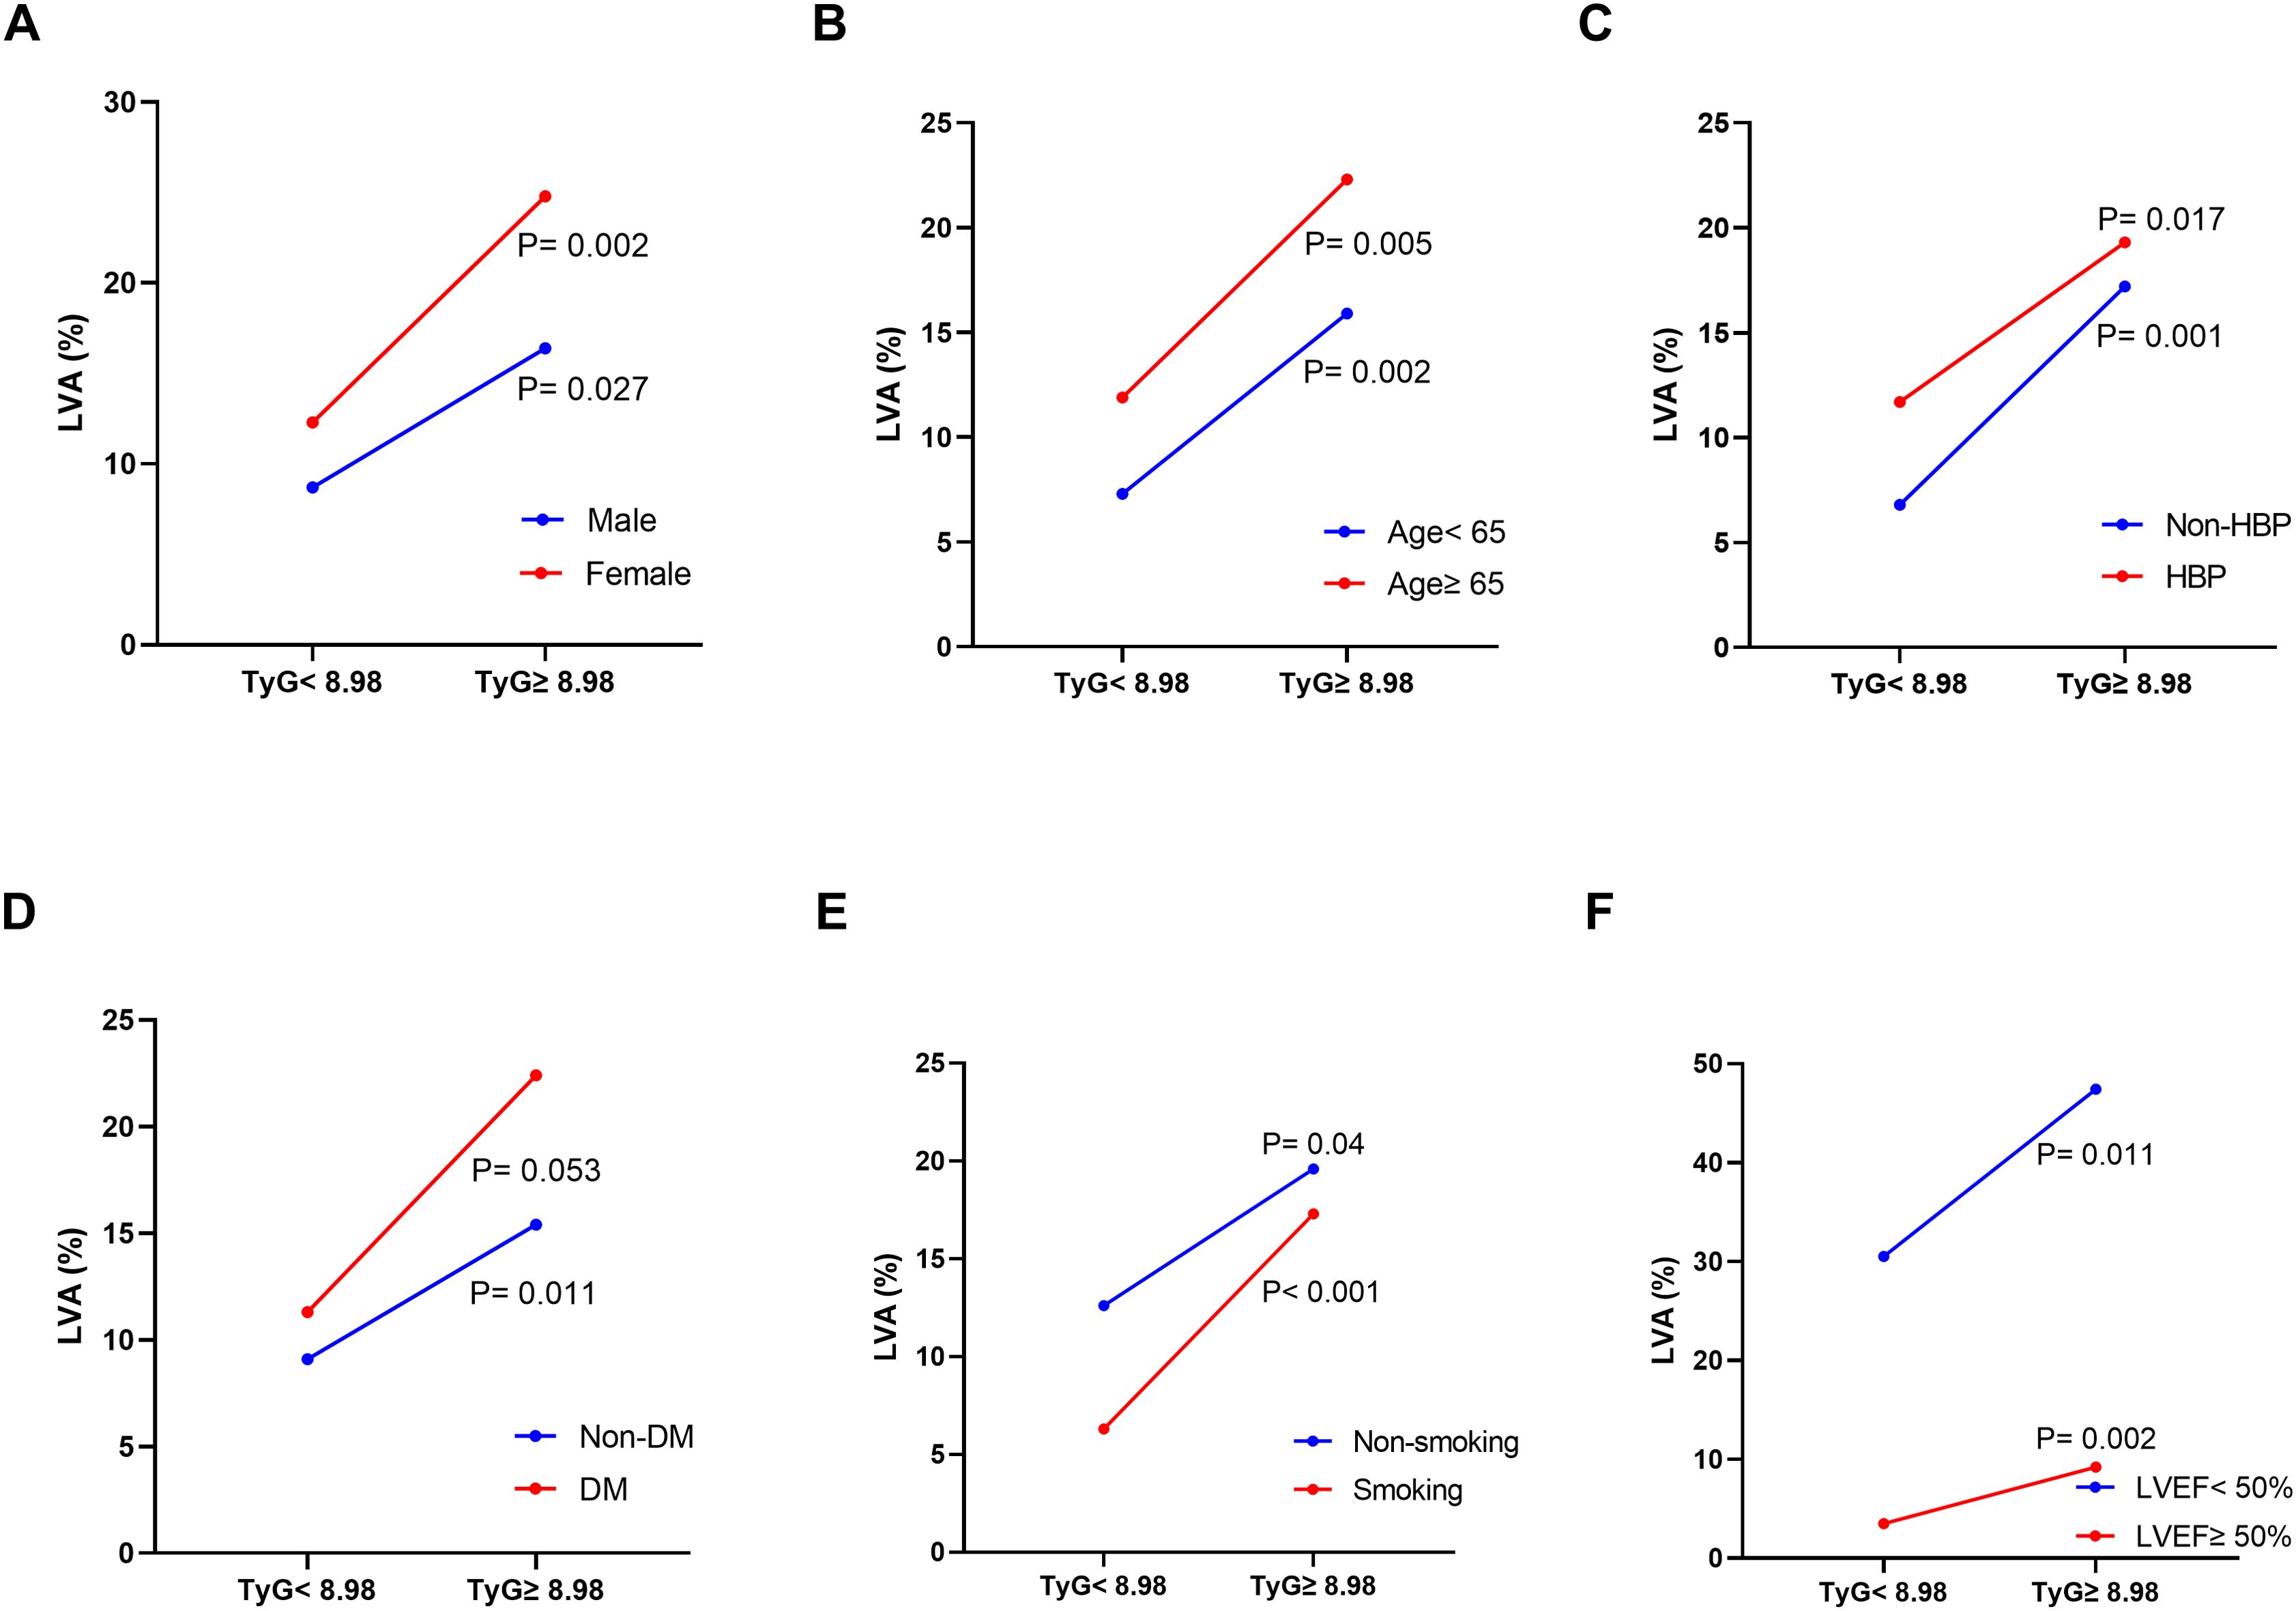
Figure 3. The impact of the TyG index on the prevalence of LVA across subgroups of gender (A), age (B), HBP status (C), DM status (D), current smoking status (E), and LVEF (F). TyG, triglyceride-glucose; LVA, left ventricular aneurysm; HBP, hypertension; DM, diabetes mellitus; LVEF, left ventricular ejection fraction.
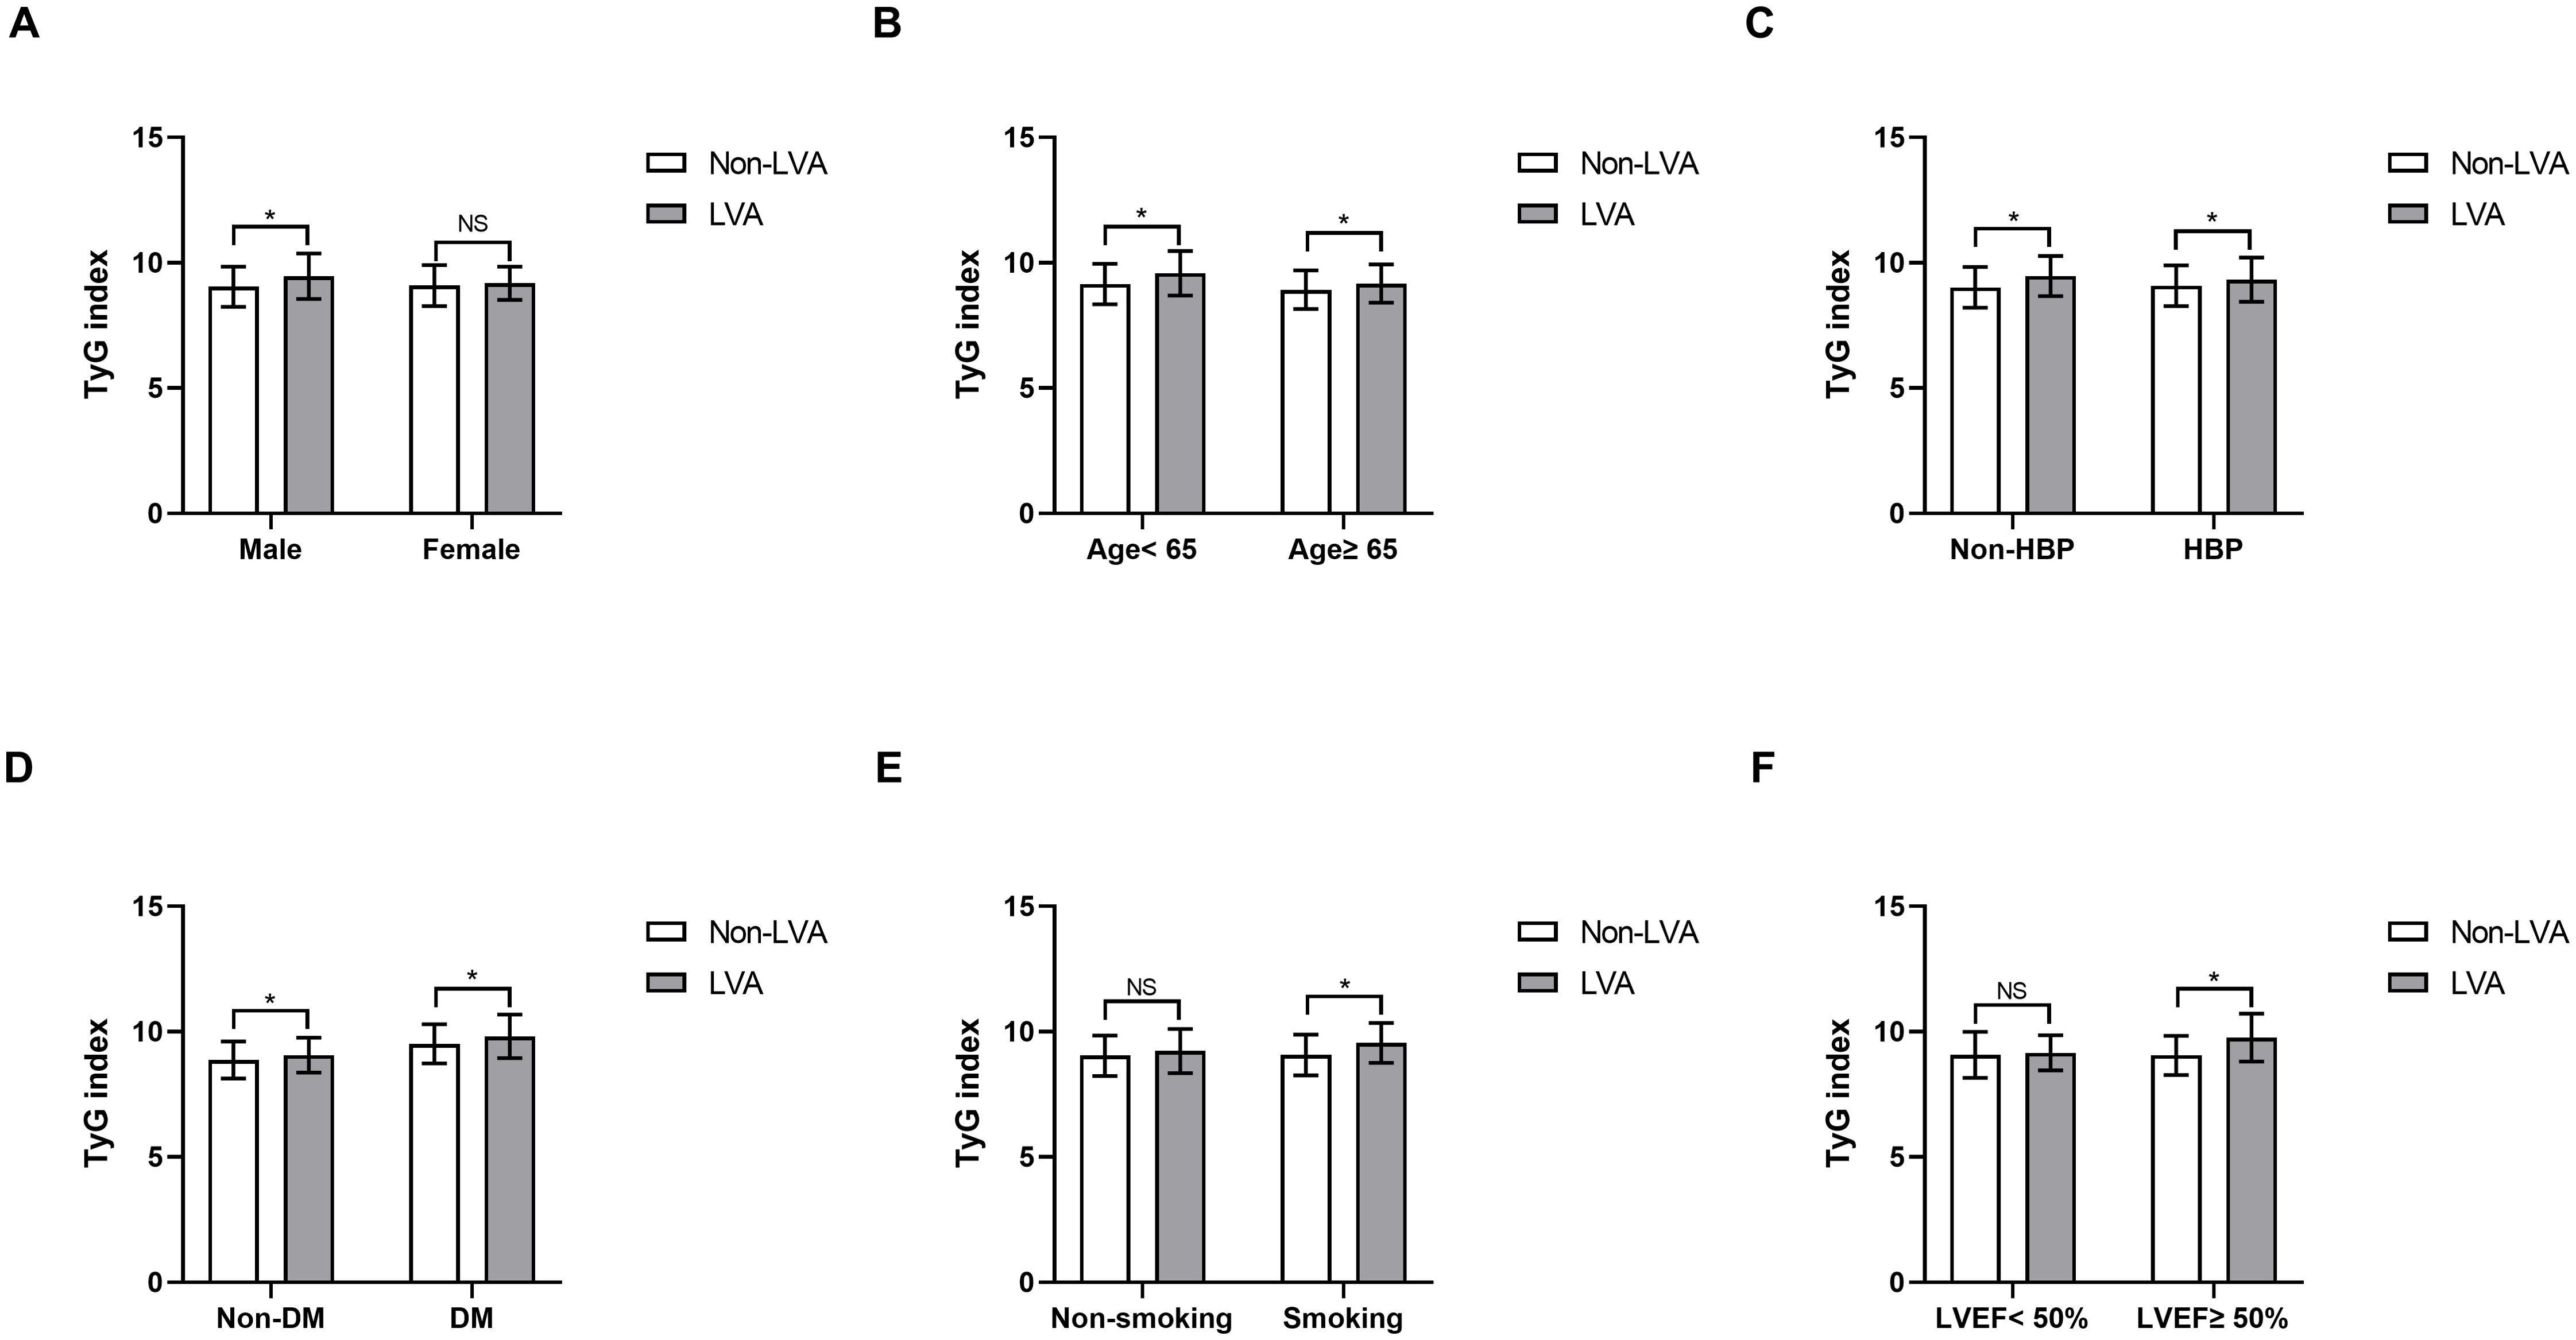
Figure 4. Comparison of the TyG index between non-LVA and LVA groups in the subgroups of gender (A), age (B), HBP status (C), DM status (D), current smoking status (E), and LVEF (F). TyG, triglyceride-glucose; LVA, left ventricular aneurysm; HBP, hypertension; DM, diabetes mellitus; LVEF, left ventricular ejection fraction.
Predictors of LVA formation
Logistic regression analysis was used to evaluate the predictive value of variables for the risk for LVA formation in patients with acute STEMI patients who underwent PCI. Twenty variables were found to be associated with LVA formation in univariate logistic regression analysis (Table 3). These variables included age, sex, smoking, LVEF, DBP, heart rate, hemoglobin, AST, HbA1c, TC, TG, LDL-C, LDH, Peak cTnI, FBG, β-blockers use, thiazide or loop diuretic use, gensini score, LAD as the culprit vessel, and TyG index. Subsequently, these 20 variables were included in a multivariate logistic regression analysis, which revealed that only age (OR= 1.04, 95% CI= 1.02-1.07, P= 0.002), LVEF (OR= 0.82, 95% CI= 0.79-0.85, P< 0.001), LDL-C (OR= 2.31, 95% CI= 1.24-4.31, P= 0.008), gensini score (OR= 1.01, 95% CI= 1.01-1.02, P= 0.038), LAD as the culprit vessel (OR= 4.41, 95% CI= 2.42-8.04, P< 0.001), and TyG index (OR= 2.46, 95% CI= 1.64-3.68, P< 0.001) remained significantly associated with the risk for LVA formation.
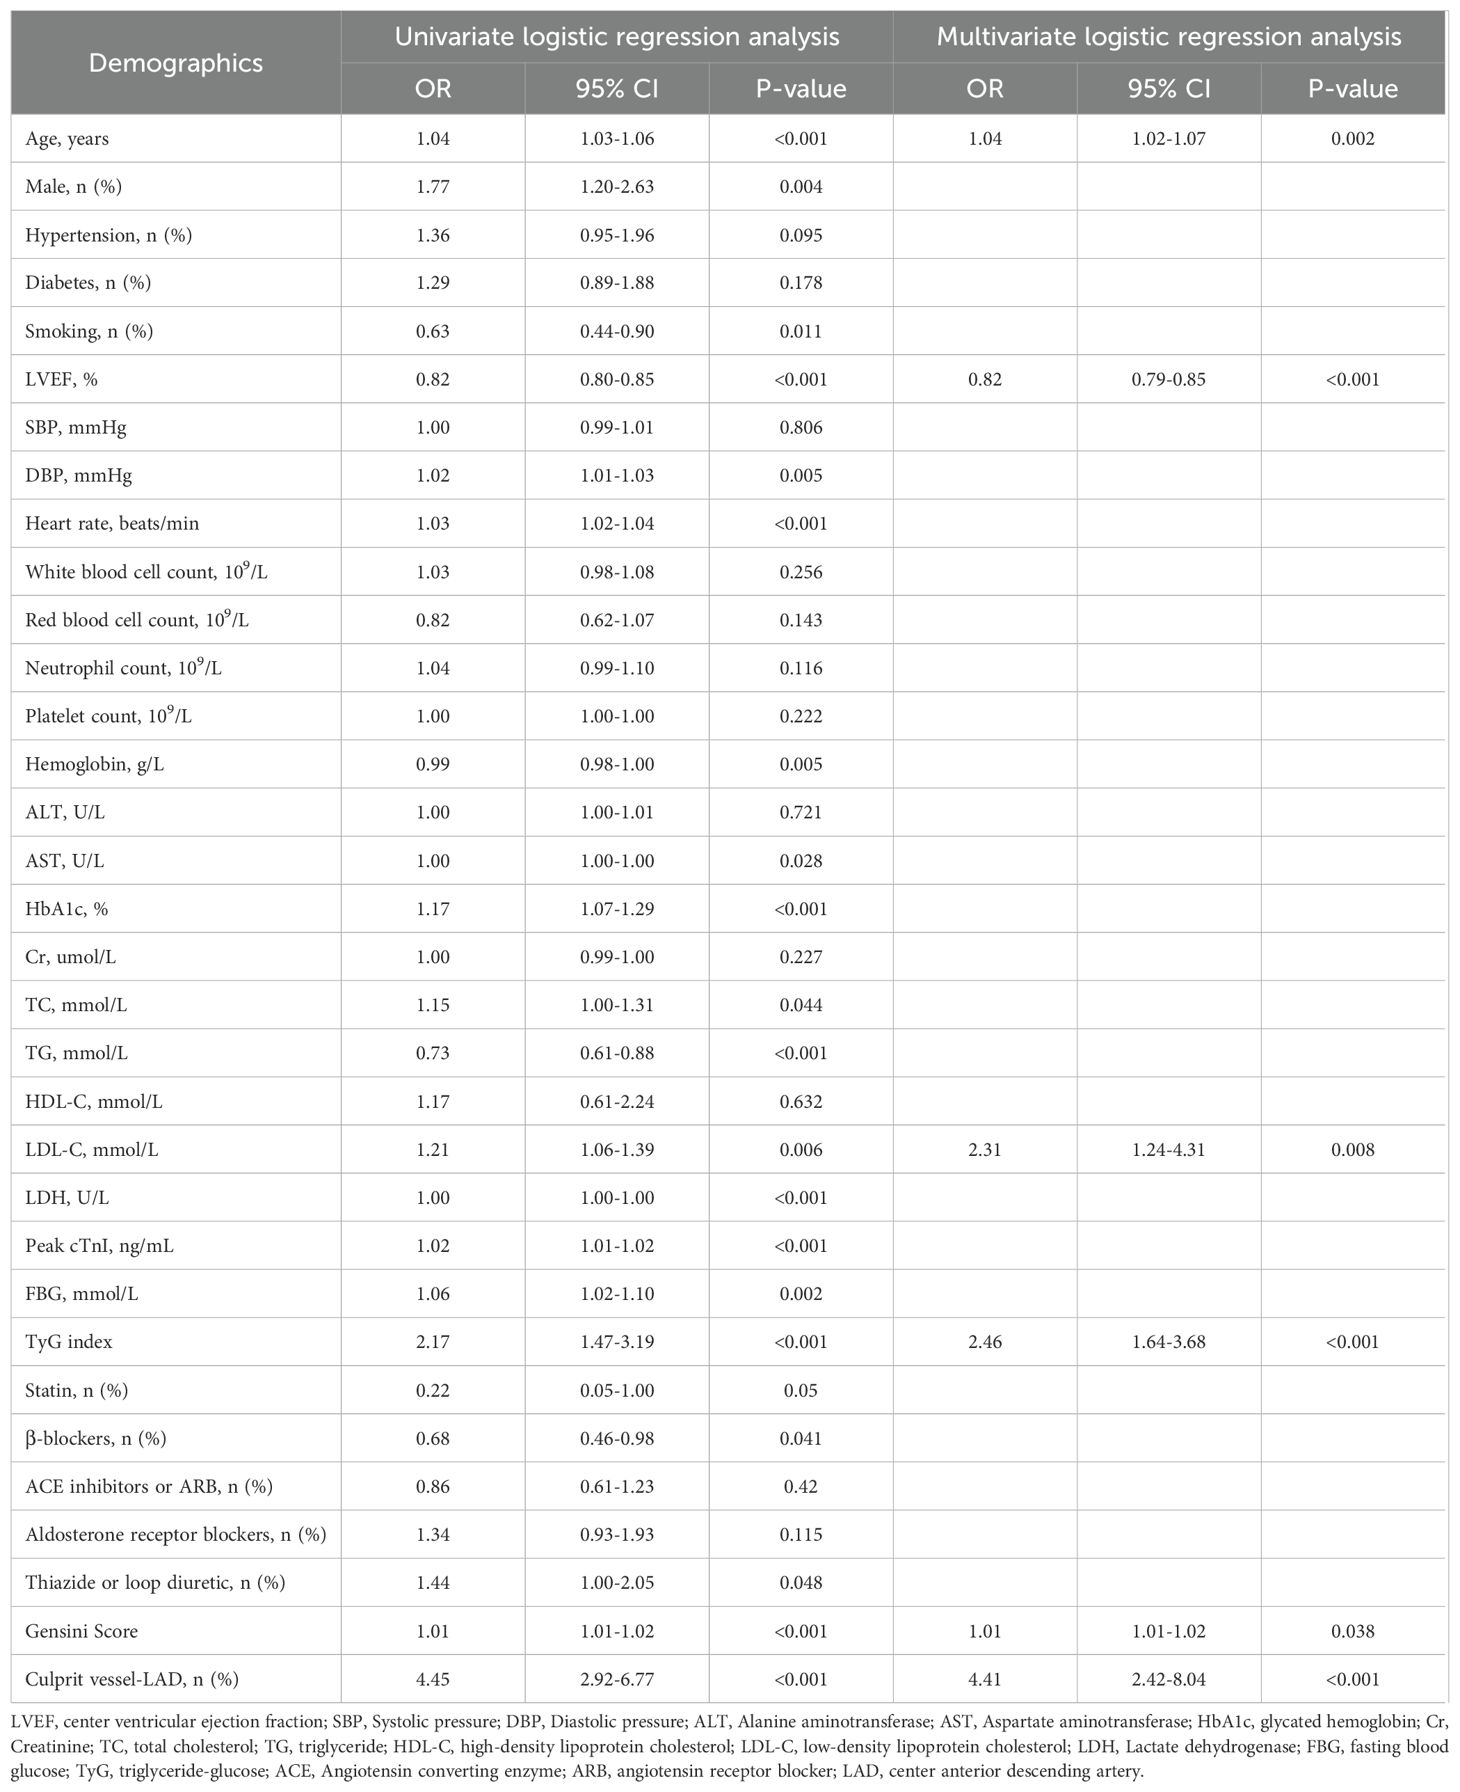
Table 3. Effects of variables on center ventricular aneurysm formation after ST-segment elevation myocardial infarction.
Additionally, the study population was randomly divided into a training set (495 patients) and a validation set (496 patients). Multivariate logistic regression analysis demonstrated that the TyG index was significantly and independently associated with the risk for LVA formation in both the training (OR= 2.33, 95% CI= 1.35-4.02, P= 0.002) and validation (OR= 2.68, 95% CI= 1.46-4.92, P= 0.002) set (Tables 4, 5).
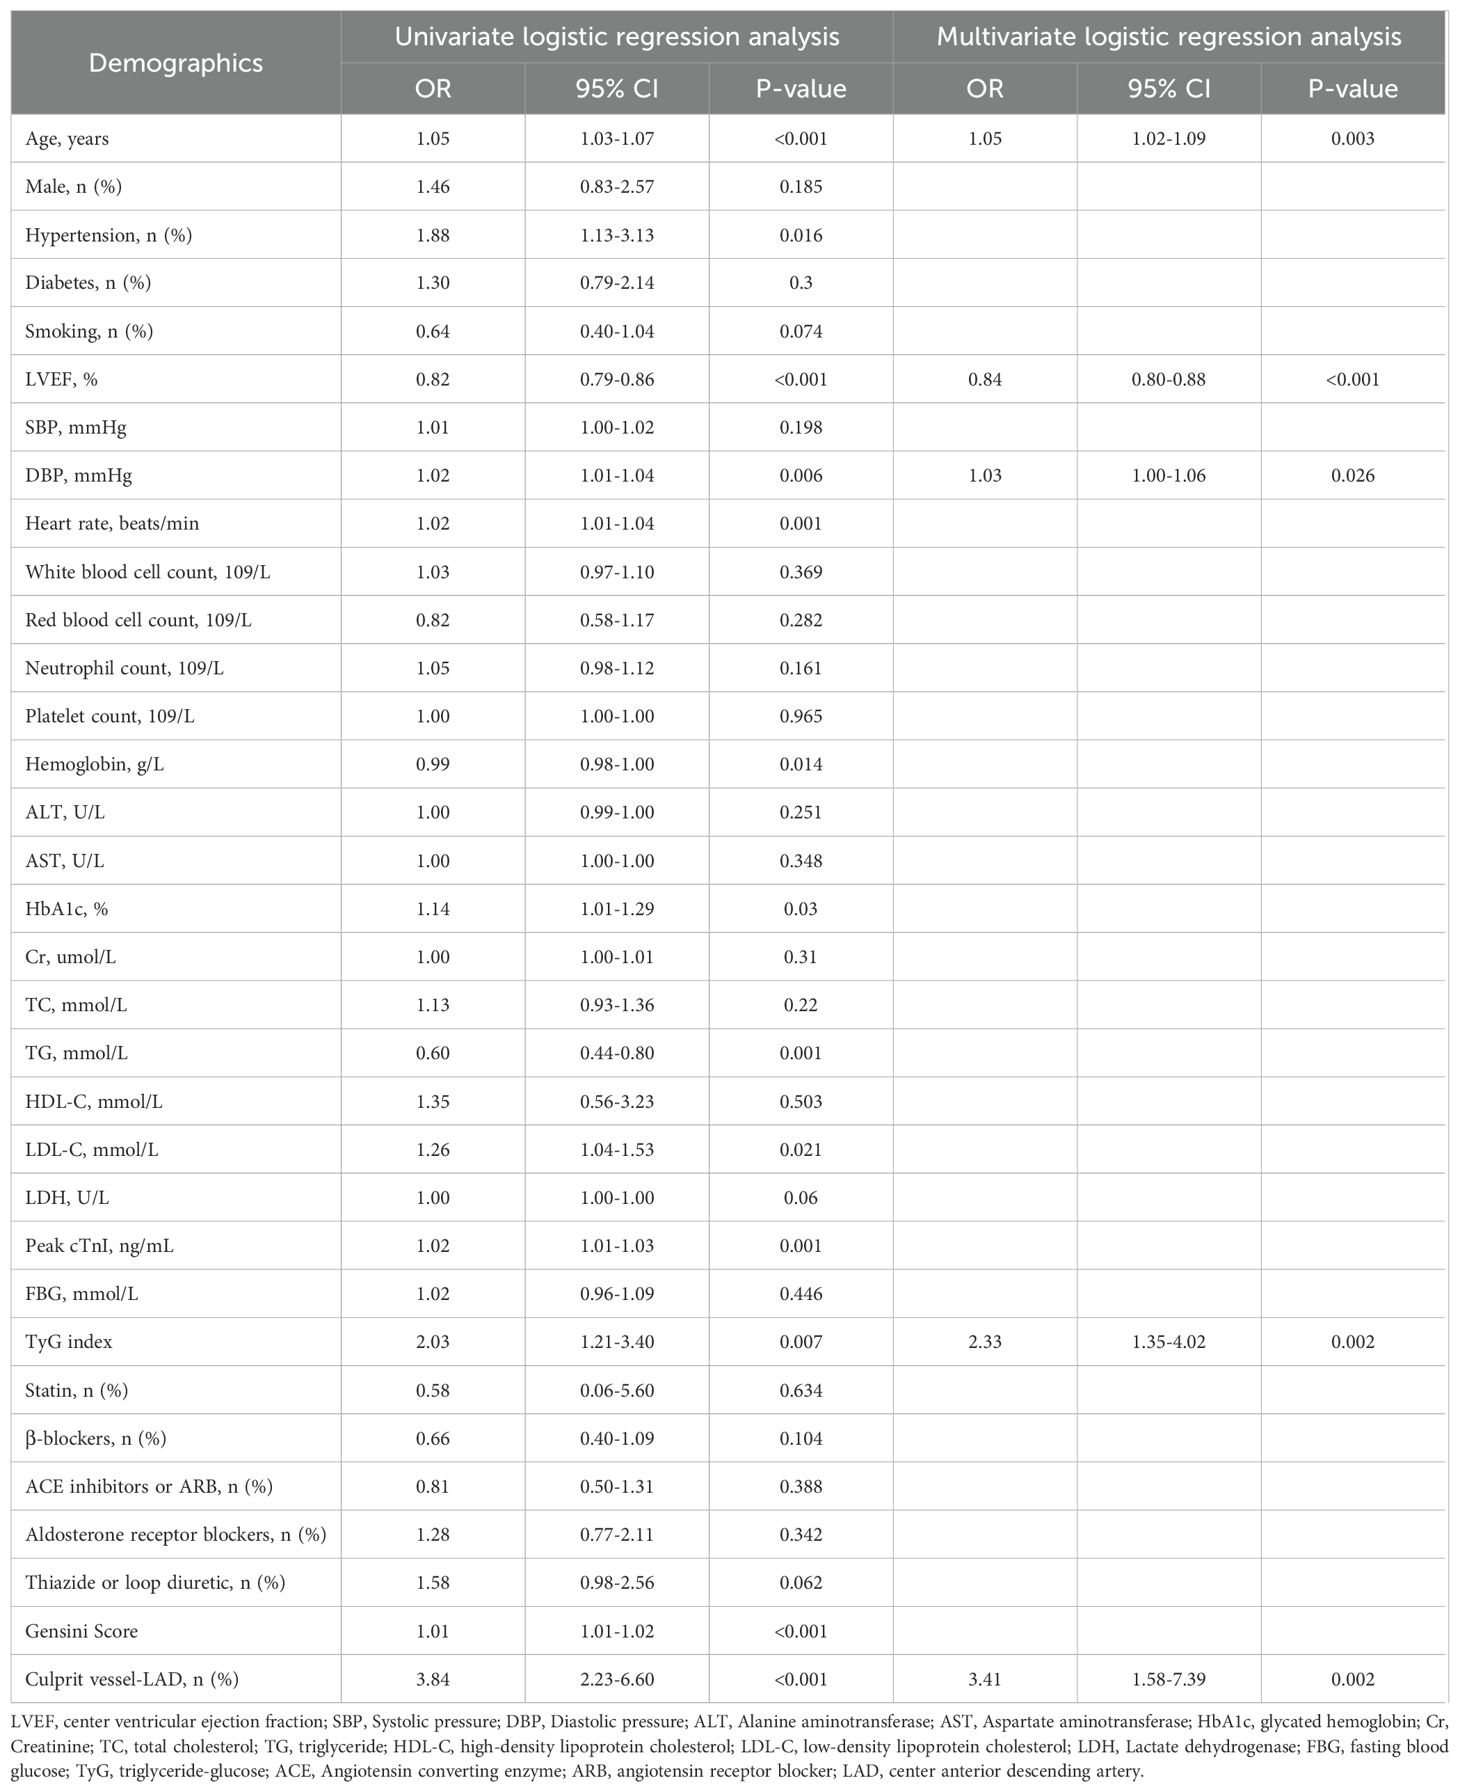
Table 4. Effects of variables on center ventricular aneurysm formation after ST-segment elevation myocardial infarction in the training set.
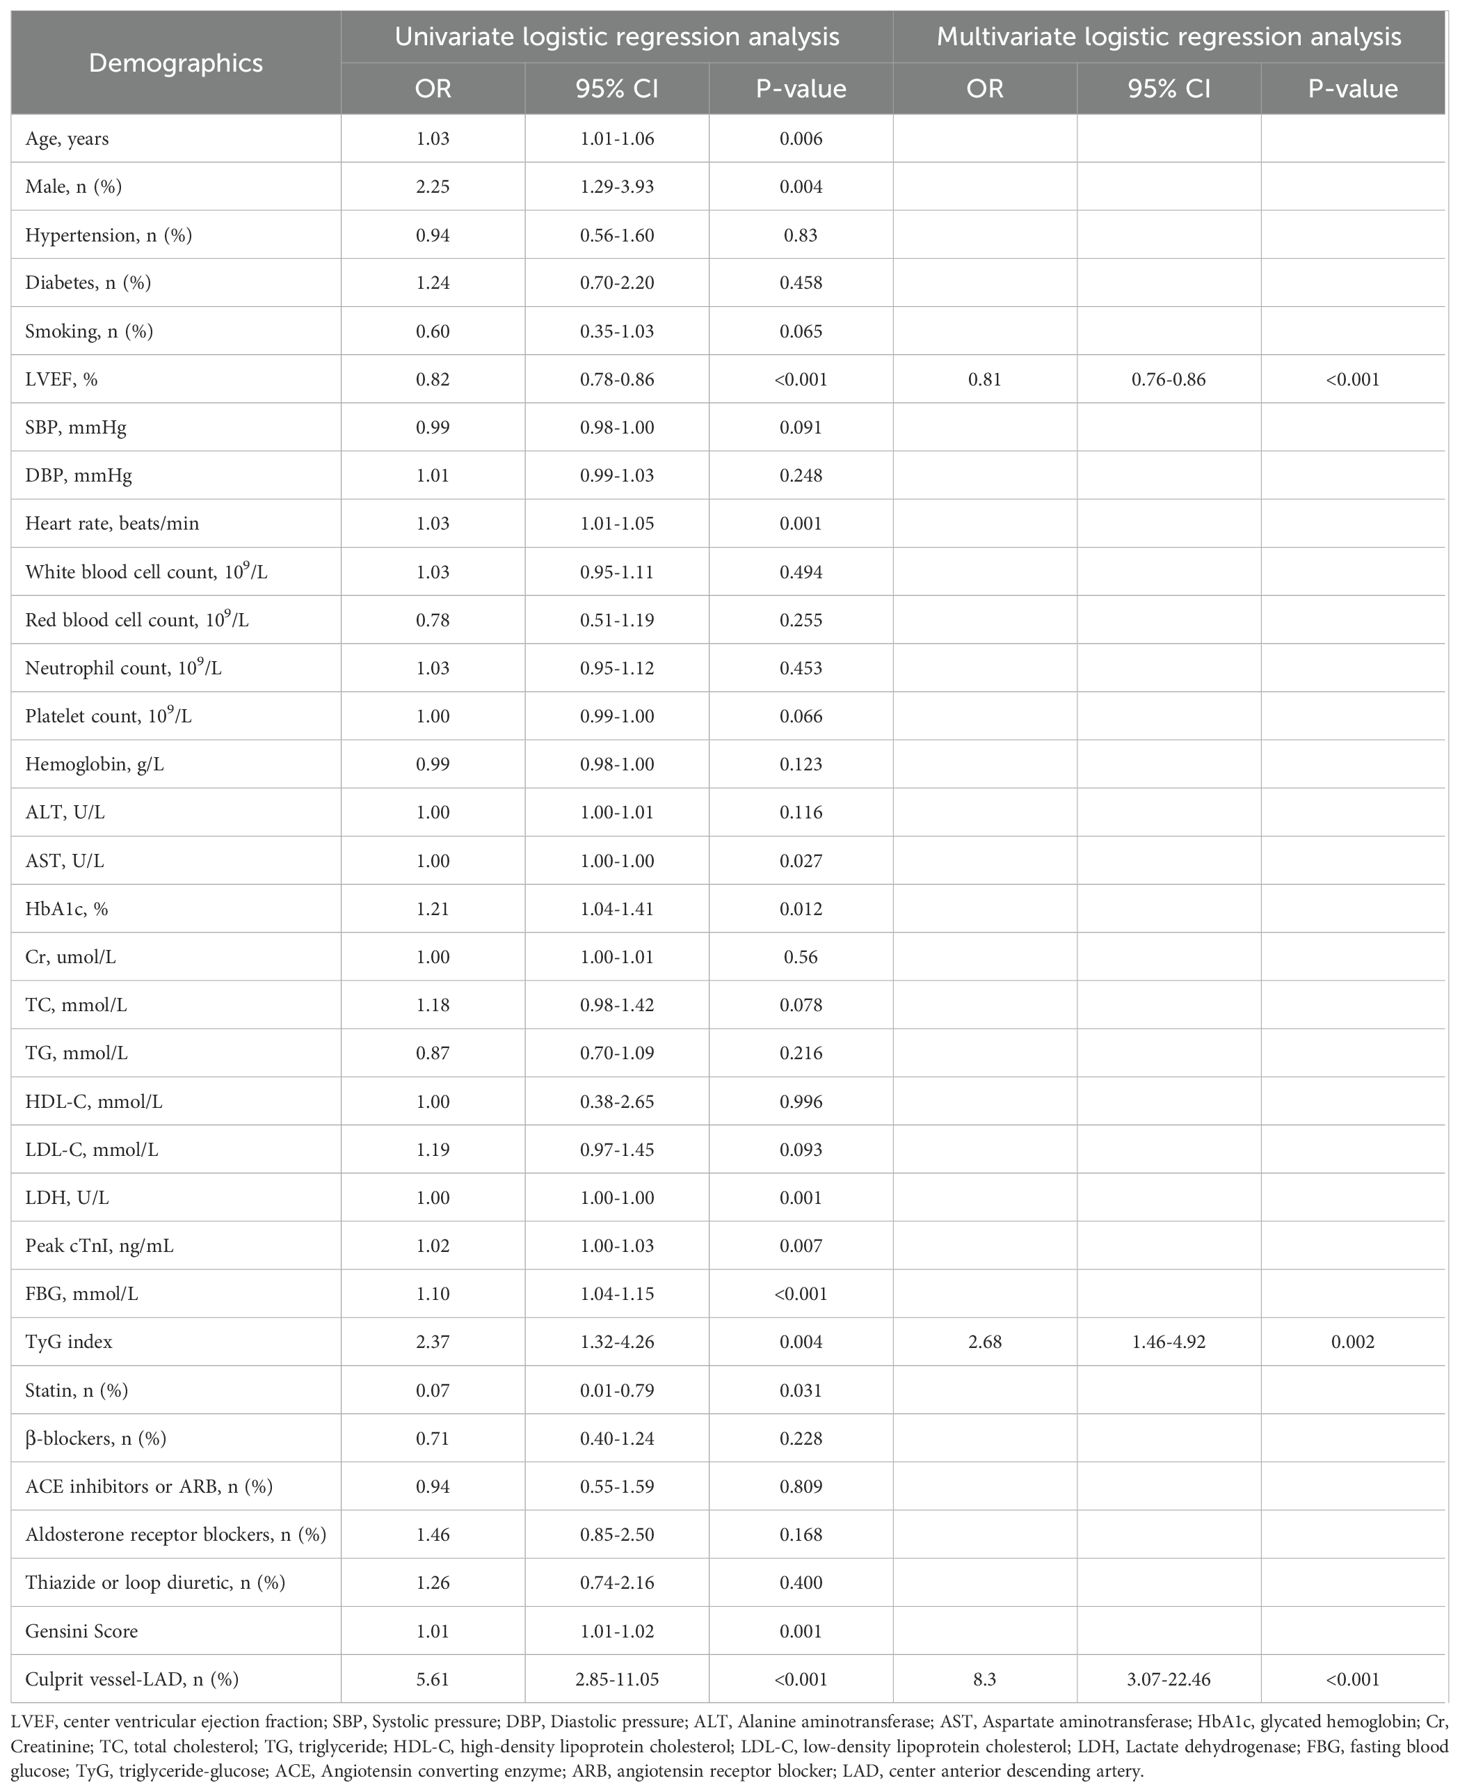
Table 5. Effects of variables on center ventricular aneurysm formation after ST-segment elevation myocardial infarction in the validation set.
Prognostic analysis
During the follow-up period, a total of 41 cardiac death occurred. The number of cardiac death in the non-LVA group, the LVA group, the TyG< 8.98 group, and TyG≥ 8.98 group were 25 (2.9%), 16 (11.2%), 11 (2.5%), and 30 (5.4%), respectively. Cox proportional hazard regression analysis indicated that patients with LVA had an increased cardiac death risk compared to those without LVA (HR= 3.94, 95% CI= 2.11-7.39; P < 0.001) (Table 6, Figure 5A). Furthermore, patients with TyG≥ 8.98 was associated with worse prognosis compared to those with TyG< 8.98 (HR= 2.17, 95% CI= 1.09-4.33; P= 0.04) (Table 6, Figure 5B). These statistical significances remained even after adjustments for sex, age, hypertension, diabetes, smoking state, and β‐blocker use (Table 6).
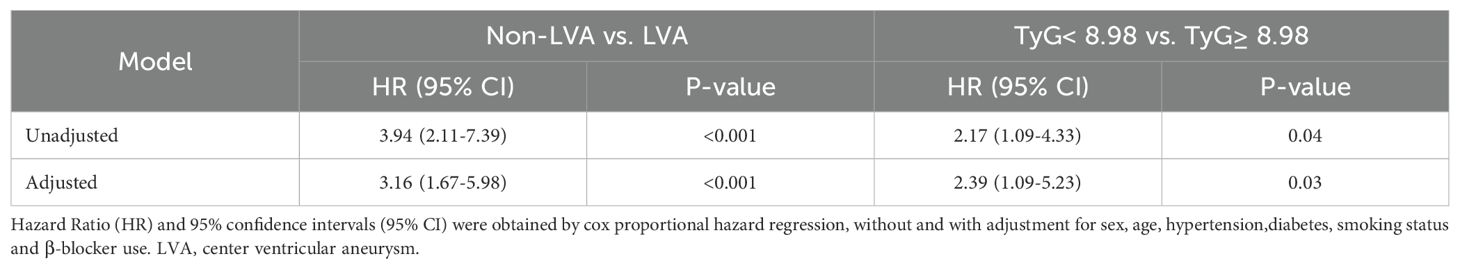
Table 6. Prognosis analysis using cox proportional hazard regression model.
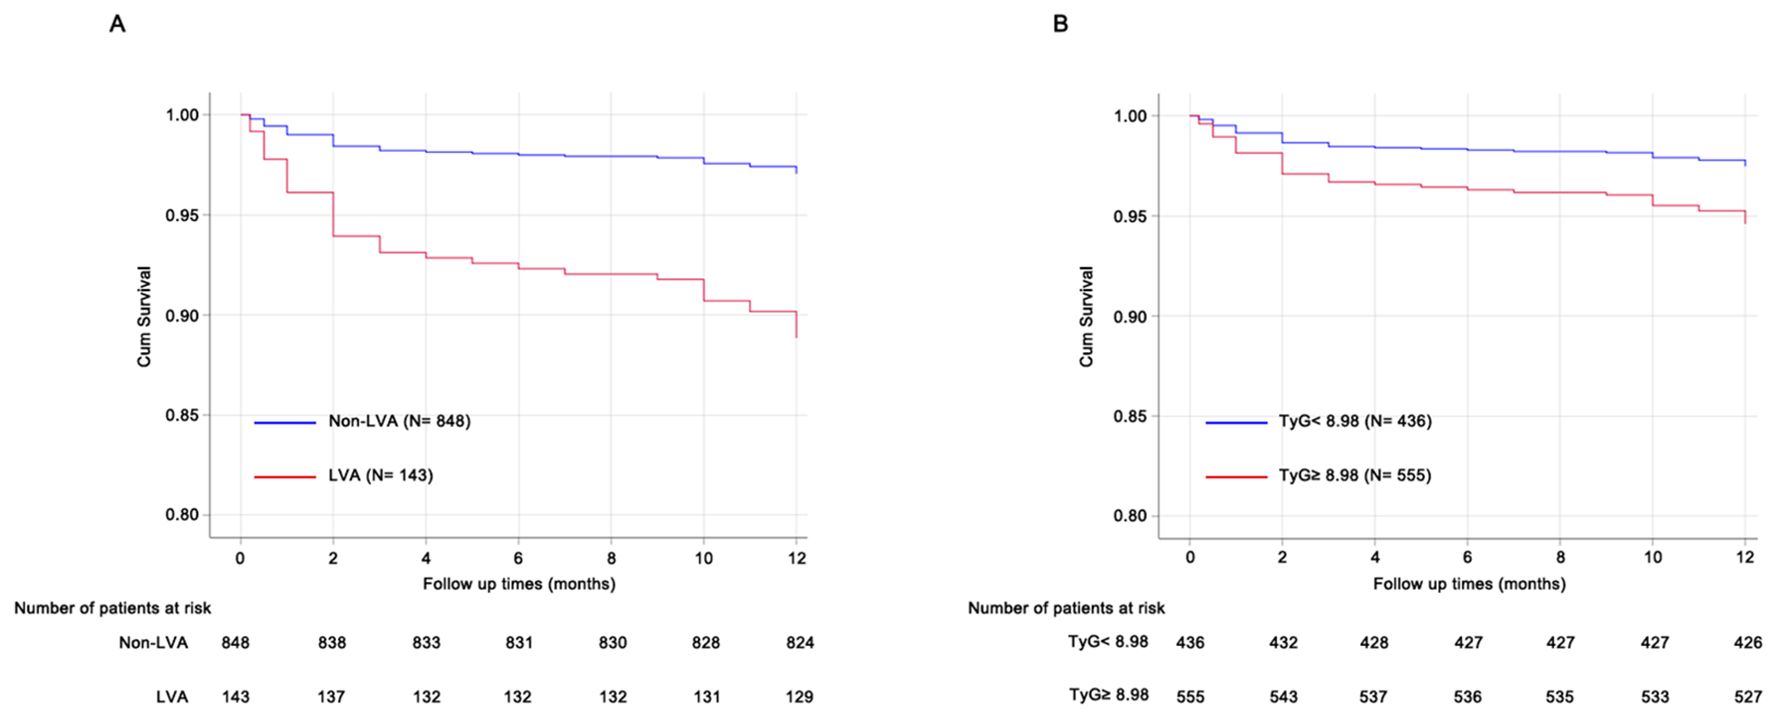
Figure 5. Prognosis analysis using Cox proportional hazard regression models. (A) patients with LVA was associated with poorer prognosis compared to those without LVA. (B), patients with TyG≥ 8.98 showed increased cardiac death risk compared to those with TyG< 8.98. TyG, triglyceride-glucose; LVA, left ventricular aneurysm.
Association between TyG index and clinical parameters of LVA
The study aimed to investigate the relationship between the TyG index and the size of LVA by comparing the maximal length and width of LVA in patients with TyG< 8.98 and TyG≥ 8.98. Both maximal length and width were significantly greater in patients with TyG ≥ 8.98 compared to those with TyG < 8.98 (maximal length, 3.04 ± 0.96 vs. 3.55 ± 1.15; maximal width, 1.89 ± 0.70 vs. 2.34 ± 0.86) (Figures 6A, B).
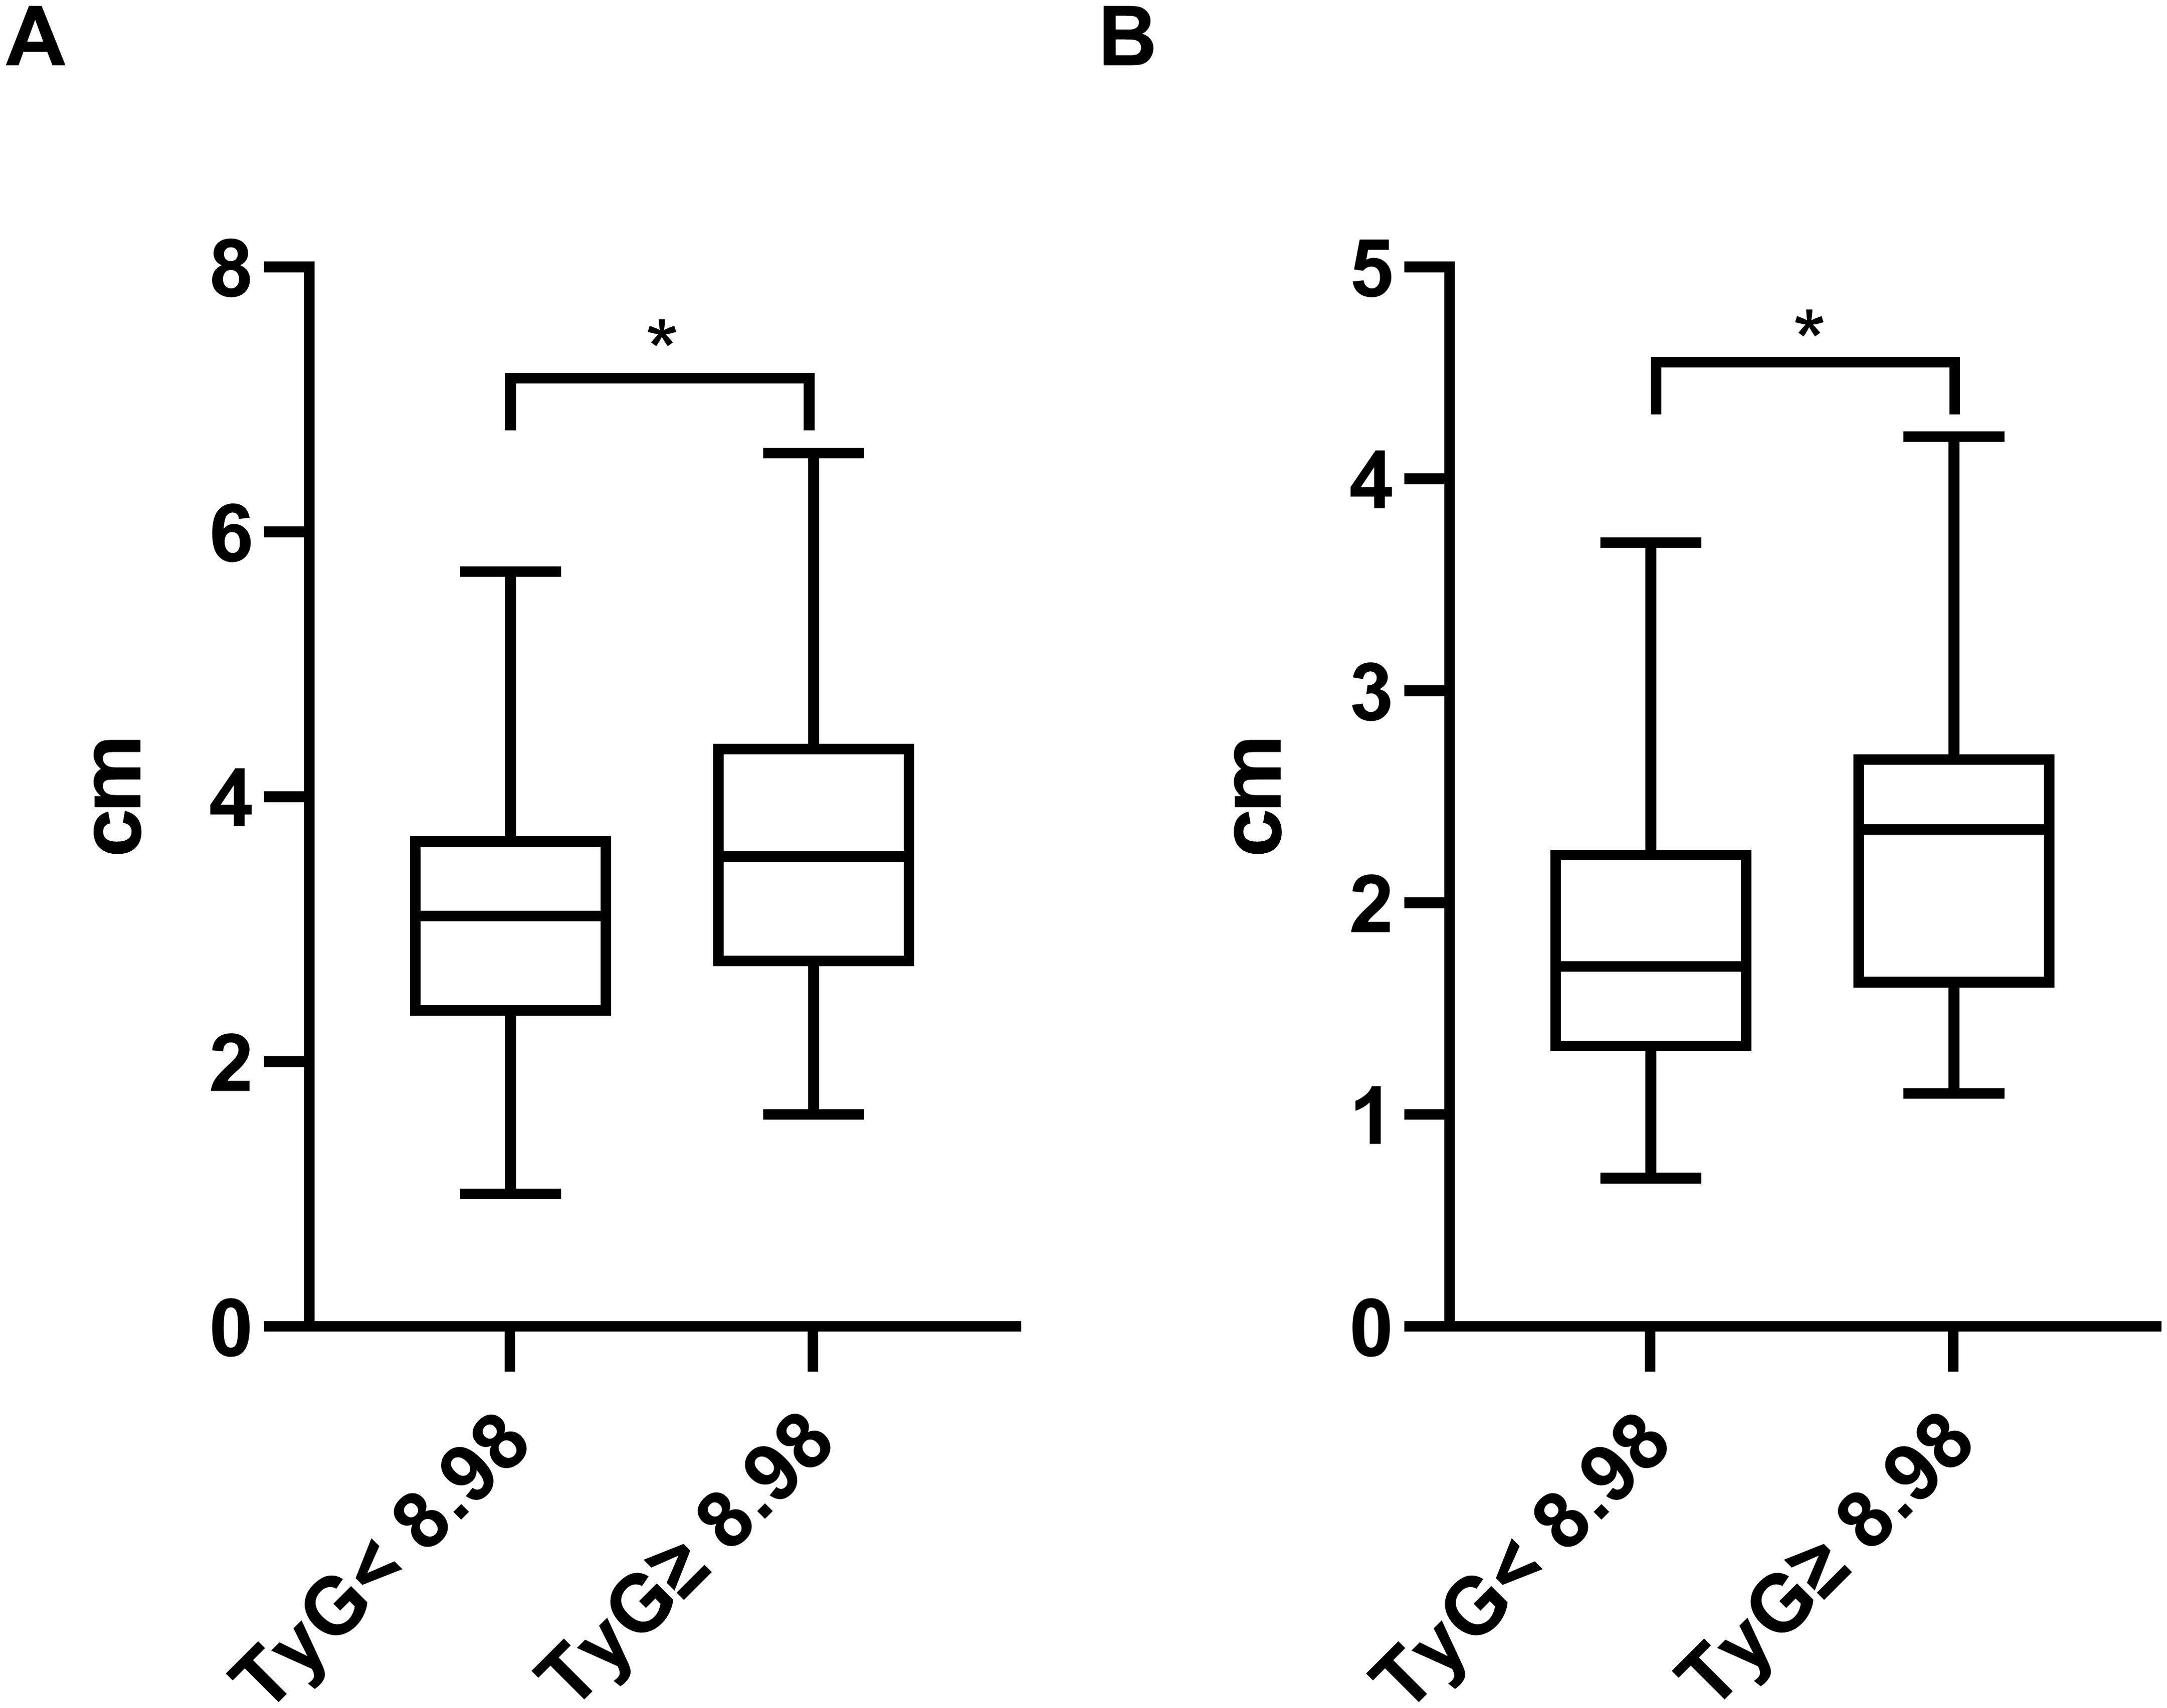
Figure 6. Comparison of the maximal length (A) and width (B) of LVA between patients grouped by TyG index. TyG, triglyceride-glucose; *P<0.05.
ROC curve analysis
ROC curve analysis was used to assess and compare the predictive abilities of TG, FBG, TyG index, and the composite variable (TyG index combined with LVEF and LAD as the culprit vessel). As shown in Figure 7A and Table 7, the average area under the ROC curve (AUC) for TG, FBG, TyG index, and the composite variable were 0.666 (95% CI = 0.641 - 0.690), 0.613 (95% CI = 0.587 - 0.638), 0.742 (95% CI= 0.719 - 0.764), and 0.908 (95% CI = 0.892 - 0.922), respectively. Furthermore, the TyG index demonstrated significantly higher AUCs for predicting the risk for LVA formation compared with TG (P < 0.001) and FBG (P < 0.001). Additionally, the composite variable exhibited the highest predictive value (P < 0.001). To avoid overfitting, cross-validation was conducted by randomly dividing the population into the training and the validation sets. As shown in Figure 6B, C and Table 6, the TyG index displayed superior discriminative power compared with both TG and FBG in both the training and validation sets (training set: P= 0.041 for TyG index vs. TG; P < 0.001 for TyG index vs. FBG; validation set: P= 0.002 for TyG index vs. TG; P < 0.001 for TyG index vs. FBG). Clearly, the composite variable demonstrated the highest predictive value in both the training and validation sets.
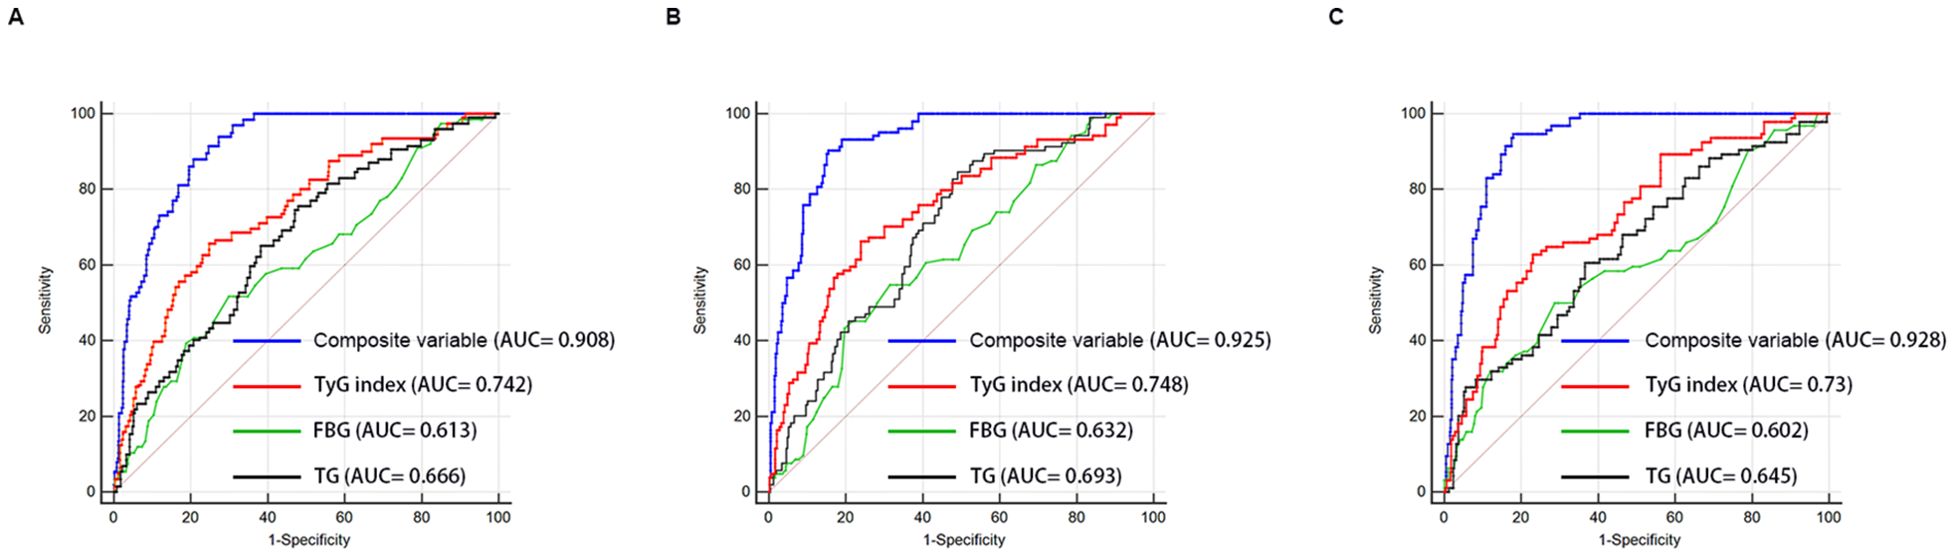
Figure 7. Receiver-operating characteristic curves for prediction of LVA formation in the whole cohort (A), the training set (B), and the validation set (C). AUC, area under the curve; TyG, triglyceride-glucose; FBG, fasting blood glucose; TG, triglyceride.
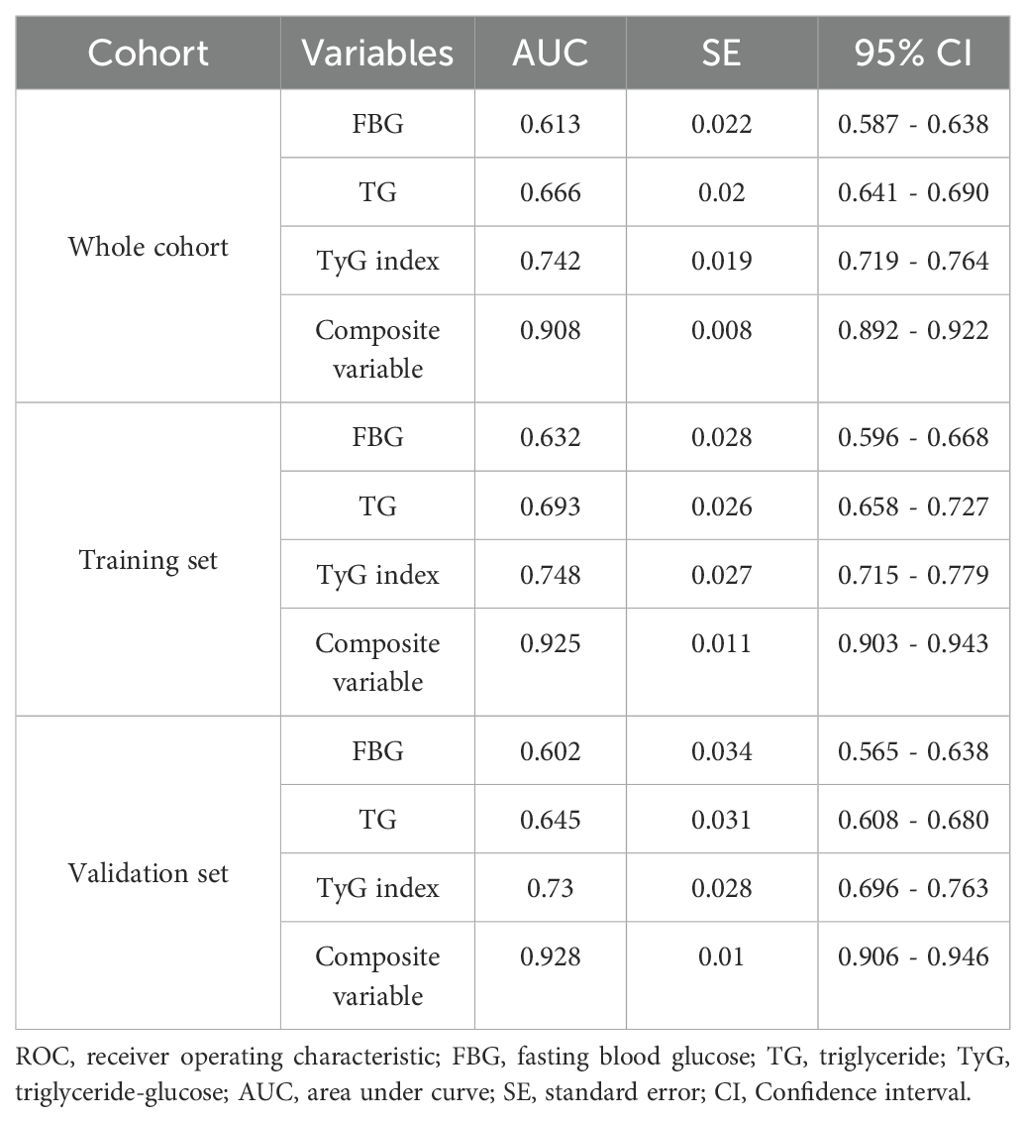
Table 7. Analysis of the ROC curve for predictive power of center ventricular aneurysm formation.
Additionally, we evaluated the predictive capabilities of LDH, LDL-C, and the TyG index concerning the risk of LVA formation. As illustrated in Supplementary Table 1, the TyG index exhibited superior predictive performance compared to both LDH (P < 0.001) and LDL-C (P < 0.001) in assessing the risk of LVA formation. Furthermore, the TyG index could improve the discriminatory capability of the composite of LVEF and LAD as a culprit vessel for identifying the development of LVA (Supplementary Table 2) (P< 0.001).
Subgroup analyses
Additional analyses were performed on several subgroups to evaluate the independent predictive value of the TyG index for LVA formation. The independent predictive effect of the TyG index on LVA formation was primarily represented in the subgroups of age< 65 and ≥65 years, male and female, with and without hypertension, without diabetes, with and without smoking, LVEF< 50% and LVEF≥ 50%, HbA1c≥ 6%, hemoglobin< 120g/L and ≥ 120g/L, LDL-C< 3.37mmol/L, TG <1.7mmol/L and ≥1.7 mmol/L, FBG <6.1 mmol/L and ≥6.1 mmol/L (Figure 8). The association between the TyG index and LVA formation showed no statistically significance in subgroup analysis of patients with diabetes, HbA1c< 6%, and LDL-C≥3.37mmol/L.
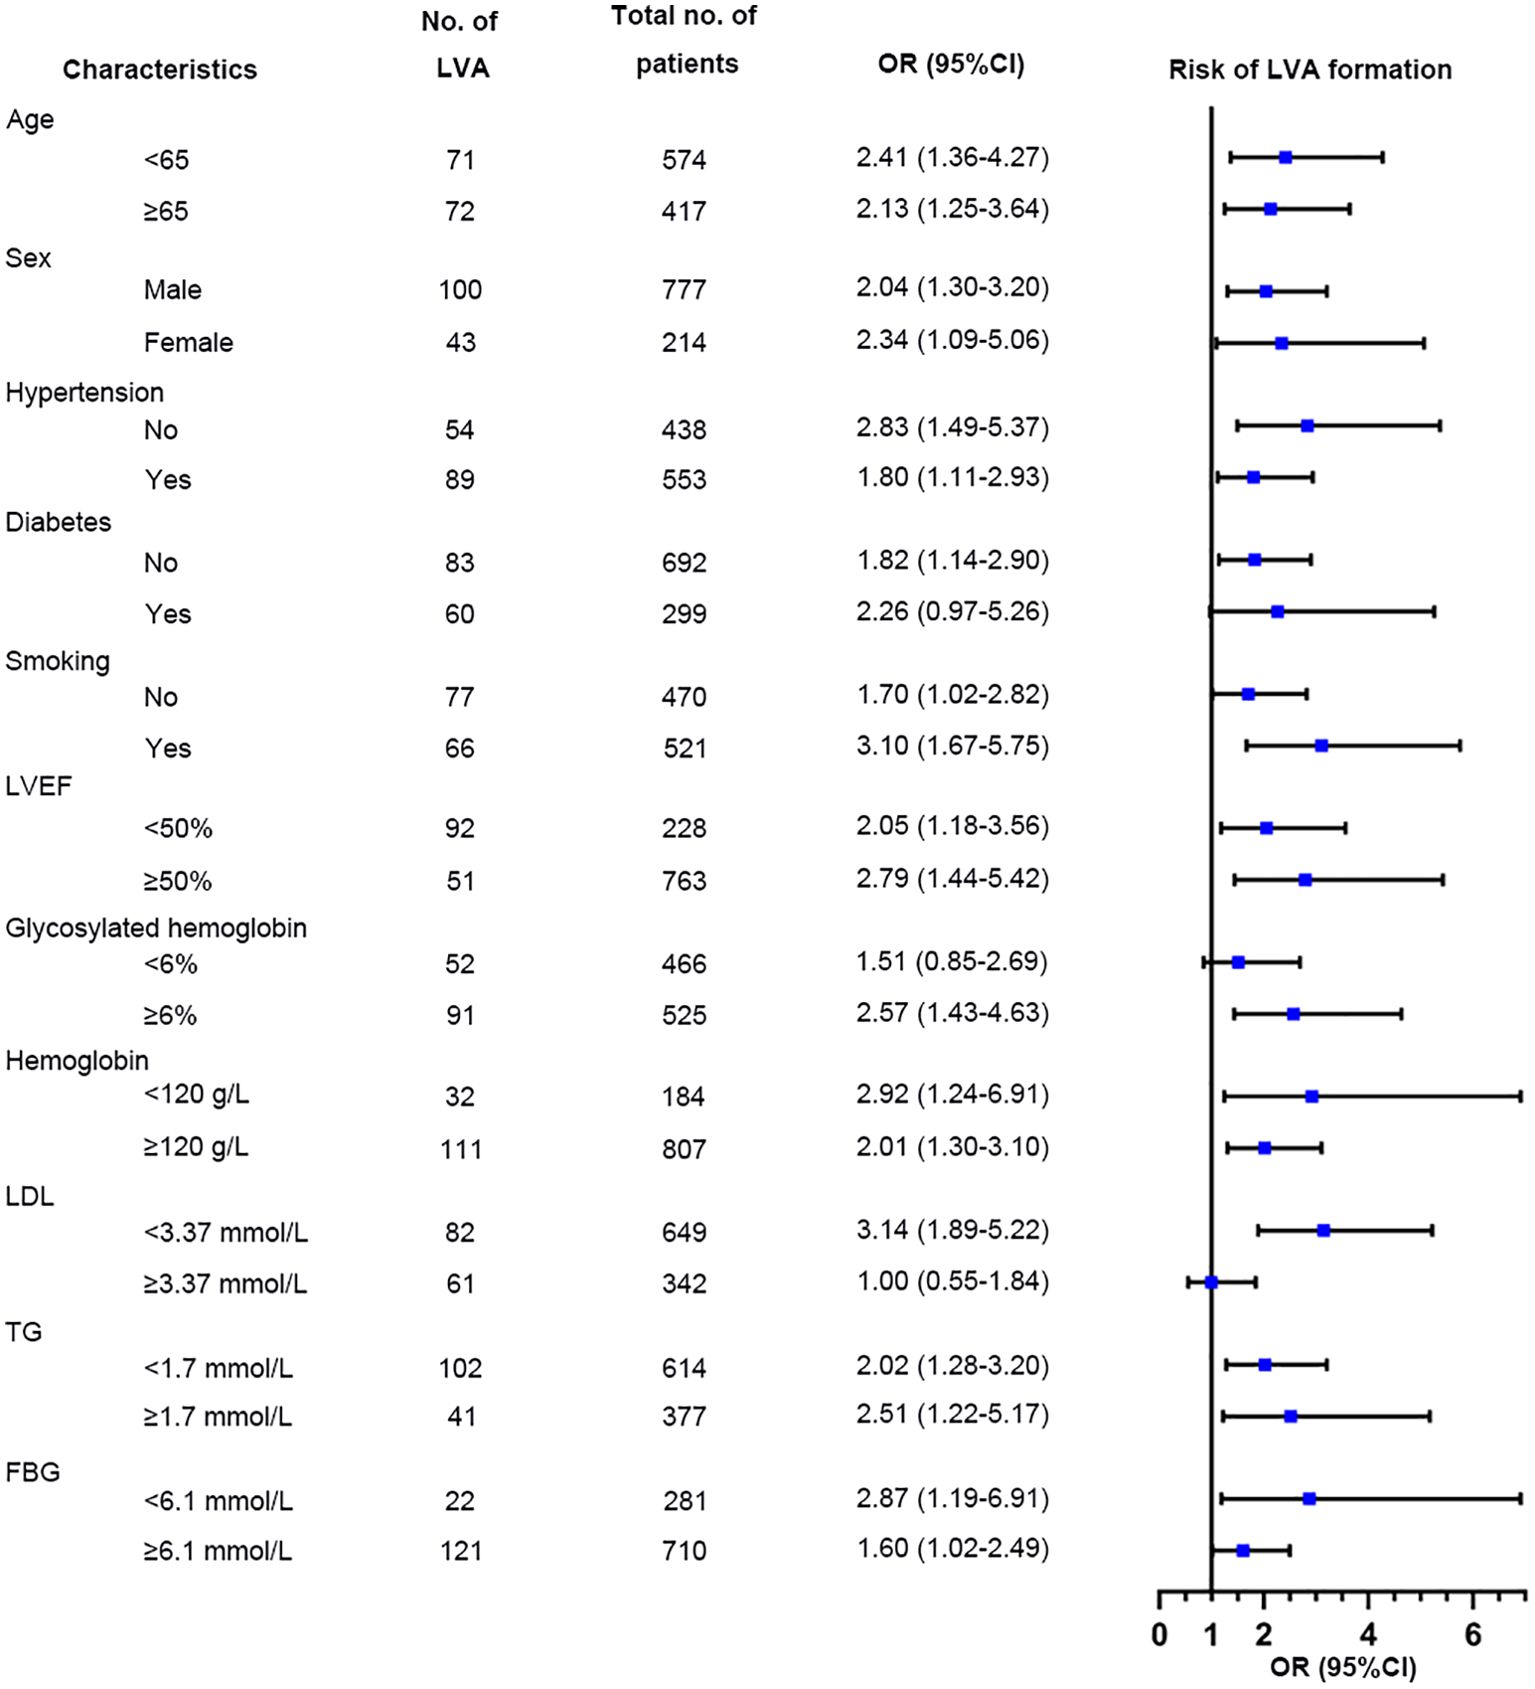
Figure 8. Forest plots for subgroup analysis of the relationship between TyG index and the risk for LVA formation. TyG, triglyceride-glucose; LVA, left ventricular aneurysm; LVEF, left ventricular ejection fraction; LDL-C, low-density lipoprotein cholesterol; TG, triglyceride; FBG, fasting blood glucose; OR, Odds Ratio.
Discussion
In the present study, we investigated the predictive value of TyG index for LVA formation and prognosis in patients with STEMI. The results indicated that a higher TyG index independently predicted LVA formation. The predictive value remained significant in both the training and validation sets. Besides, higher TyG index was correlated with increased cardiac death risk. Among patients with LVA, those with a TyG index≥ 8.98 exhibited significantly larger maximal length and width compared to those with a TyG index < 8.98. The relationship between the TyG index and LVA formation was generally consistent across subgroups, except for patients with diabetes, HbA1c< 6%, and LDL≥3.37mmol/L. Additionally, the TyG index exhibited greater predictive power for LVA formation than both TG and FBG. However, the composite variable exhibited the best predictive value.
As a hallmark of type 2 diabetes mellitus, insulin resistance (IR) refers to a state of reduced sensitivity and responsiveness to the action of insulin (17). Multiply studies have demonstrated that IR was associated with the progression of cardiovascular diseases and could predict cardiovascular outcomes (18–21). The euglycemic insulin clamp and intravenous glucose tolerance testing are the gold standards for IR (22). However, they are not suitable for clinical practice due to invasiveness and high cost. Currently, the homeostasis model assessment-estimated insulin resistance (HOMA-IR) index is widely used for assessing β-cell function and IR. Nevertheless, its complexity and time-consuming nature limit its application in practical clinical settings and large-scale studies (23).
The TyG index has emerged as a reliable marker of IR and has been shown to be superior to HOMA-IR in assessing metabolic syndrome (24, 25). TyG is a simple, convenient and low-cost clinical index that can easily be obtained for large-scale study. Numerous studies have demonstrated the association between TyG index and the cardiovascular diseases (8, 11, 26, 27). In a prospective study including 1574 patients with acute coronary syndrome (ACS), Zhu et al. found that an elevated TyG index was independently and positively associated with in-stent restenosis after drug-eluting stent (28). A study by Wang et al. investigated 2531 consecutive patients with diabetes who underwent coronary angiography for ACS and demonstrated TyG index to be an independent predictor for the major adverse cardiovascular events (10). Furthermore, a higher TyG index was found associated with the presence of a higher coronary anatomical complexity in ACS patients (29). However, no study has investigated the association among the TyG index, LVA formation, and the prognosis of patients with STEMI. In the present study, we demonstrated for the first time that TyG index≥ 8.98 was significantly associated with increased LVA formation and cardiac death risk compared to TyG index < 8.98. Importantly, the risk for LVA formation in patients with TyG index≥ 8.98 exceeded 2-fold compared to those with TyG index< 8.98.
As a common and severe complication of AMI, LVA is characterized by the outward expansion of the infarcted myocardium during systole and diastole (30). Recently, the incidence of LVA after acute STEMI has decreased from 10-30% to 8-15% due to advancements in the treatment for AMI (16). In our study, the incidence of LVA in acute STEMI patients who underwent primary PCI was approximately 14.4%, which aligns with previous reports (3, 5). In fact, numerous studies have aimed to identify predictors for LVA after AMI. Feng et al. found that single-vessel disease, decreased GFR and abnormal ferritin could independently predict the LVA formation (31). In a retrospective study involving 1823 STEMI patients, Zhang et al. found that female sex, peak NT-pro BNP, the time between the onset of pain and balloon time, presence of QS-waves on initial electrocardiogram were the independent predictors of early-onset LVA (32). In a prospective cohort study including 1519 patients with STEMI, Savas et al. found that plasma N- Terminal pro B type natriuretic peptide level at admission, among other variables, provided valuable predictive information regarding the development of LVA (16). Additionally, a cohort study by Zhang et al. identified the blood urea nitrogen-to-albumin ratio as an independent predictor for LVA formation in STEMI patients with primary PCI (33). However, disagreement persists concerning these risk factors among different cohort studies. Moreover, these studies primarily focused on single variables, most of which had only modest or small effects on LVA prediction. In the present study, we introduced the TyG index, for the first time, to predict LVA formation in patients with STEMI. The OR for LVA formation in patients with TyG index≥ 8.98 reached up to 2.46. Patients with a TyG index ≥ 8.98 exhibited a significant increase in maximal length and width compared to those with a TyG index < 8.98, which demonstrated the critical predictive role of TyG index in myocardial injury. In addition, LVEF was also identified as the independent predictor for LVA formation, which is consistent with the previous study (5). Furthermore, the TyG index proved to be a more potent predictor for LVA formation than both TG and FBG, with the composite variable yielding the highest predictive value.
The precise mechanisms underlying the relationship between the TyG index and LVA formation remain incompletely elucidated. Firstly, the TyG index exhibits positive correlations with TC, LDL-C, and C-reactive protein, while showing a negative correlation with HDL-C. This suggests that the presence of cardiometabolic risk factors may partially account for this association. Secondly, the TyG index serves as a reliable indicator of insulin resistance (IR). Prior research has indicated that IR can lead to inflammation, oxidative stress, and cardiomyocyte apoptosis (34, 35), potentially elevating the risk of LVA. Thirdly, an elevated TyG index has been associated with increased arterial stiffness and coronary artery calcification (13, 36), which may represent another significant mechanism.
The association between the TyG index and LVA formation was not observed in patients with diabetes, those with HbA1c HbA1c< 6%, or those with LDL-C≥ 3.37mmol/L. The limited sample size of diabetic patients (N=299) may account for the lack of significant association between the TyG index and LVA. Patients with HbA1c < 6% demonstrated a lower incidence of LVA compared to those with HbA1c ≥ 6% (11.2% vs. 17.3%, P<0.001), potentially diminishing the impact of the TyG index on LVA risk in this subgroup. Additionally, the number of patients with LDL-C≥ 3.37mmol/L was significantly smaller than those with LDL-C< 3.37mmol/L. Furthermore, patients with LDL-C≥ 3.37mmol/L were younger than those with lower LDL-C levels (59.7 ± 13.3 vs. 61.9 ± 12.5, P=0.01) in our study. These factors collectively attenuate the relationship between the TyG index and LVA.
The primary strength of the present study is its novelty as the first investigation addressing the relationship between TyG index and the risk for LVA formation in patients with acute STEMI who underwent primary PCI. However, several limitations should be noted. First, our study failed to compare the predictive values of HOMA-IR and the TyG index due to the lack of routine insulin level measurements in these patients. Second, despite the large sample size in this study, our focus was solely on baseline serum TG and FBG levels, neglecting the dynamic changes in the TyG index, which could have provided valuable insight into the underlying mechanism. Third, the nature of observational study prevented the establishment of a causal association between the TyG index and LVA formation. Additionally, unmeasured or residual confounding effects may have impacted our findings. Finally, while our results indicated a significant association between the TyG index and the risk for LVA formation, its practical clinical application value requires confirmation in future prospective studies.
Conclusions
In conclusion, our study demonstrated that the TyG index was significantly associated with increased risk of LVA formation and cardiac death in patients with acute STEMI who underwent primary PCI. Additionally, the TyG index alone demonstrated excellent discriminatory ability for LVA formation, and the composite variable including the TyG index, LVEF, and LAD as the culprit vessel significantly improved the discriminatory power. Our findings suggest the potential use of the TyG index in clinical practice as a preferable predictor for LVA formation in patients with acute STEMI who underwent primary PCI.
Data availability statement
The raw data supporting the conclusions of this article will be made available by the authors, without undue reservation.
Ethics statement
The studies involving humans were approved by the Review Board of Panzhihua central hospital (Number: 20200016). The studies were conducted in accordance with the local legislation and institutional requirements. The participants provided their written informed consent to participate in this study.
Author contributions
SL: Conceptualization, Investigation, Methodology, Writing – original draft, Writing – review & editing, Formal Analysis, Funding acquisition, Validation. XZ: Conceptualization, Data curation, Formal Analysis, Investigation, Software, Writing – original draft. YZ: Formal Analysis, Validation, Visualization, Writing – review & editing. XX: Formal Analysis, Resources, Software, Writing – original draft. JL: Formal Analysis, Investigation, Methodology, Project administration, Writing – review & editing.
Funding
The author(s) declare that financial support was received for the research and/or publication of this article. This work was supported by the project from Panzhihua Science and Technology Bureau (Nos.2020ZD-S-26), the Sichuan Medical Association Program (Nos.S20020), the Sichuan Province key clinical specialty construction Project, and Joint project of local universities in Yunnan Province (202101BA070001-104).
Conflict of interest
The authors declare that the research was conducted in the absence of any commercial or financial relationships that could be construed as a potential conflict of interest.
Publisher’s note
All claims expressed in this article are solely those of the authors and do not necessarily represent those of their affiliated organizations, or those of the publisher, the editors and the reviewers. Any product that may be evaluated in this article, or claim that may be made by its manufacturer, is not guaranteed or endorsed by the publisher.
Supplementary material
The Supplementary Material for this article can be found online at: https://www.frontiersin.org/articles/10.3389/fendo.2025.1423040/full#supplementary-material
References
1. Karamasis GV, Varlamos C, Benetou D-R, Kalogeropoulos AS, Keeble TR, Tsigkas G, et al. The usefulness of intracoronary imaging in patients with ST-segment elevation myocardial infarction. J Clin Med. (2023) 12(18):5892. doi: 10.1016/j.jcin.2020.03.053
2. Mori M, Sakakura K, Wada H, Ikeda N, Jinnouchi H, Sugawara Y, et al. Left ventricular apical aneurysm following primary percutaneous coronary intervention. Heart vessels. (2013) 28:677–83. doi: 10.1007/s00380-012-0301-2
3. You J, Gao L, Shen Y, Guo W, Wang X, Wan Q, et al. Predictors and long-term prognosis of left ventricular aneurysm in patients with acute anterior myocardial infarction treated with primary percutaneous coronary intervention in the contemporary era. J thoracic Dis. (2021) 13:1706–16. doi: 10.1002/ccd.28712
4. Bai W, Tang H. Left ventricular pseudoaneurysm following acute myocardial infarction. Anatolian J Cardiol. (2018) 20:E10–1. doi: 10.14744/AnatolJCardiol.2018.39001
5. Wang Z, Ren L, Liu N, Peng J. The relationship between post-procedural platelet count and left ventricular aneurysm in patients with acute anterior ST-segment elevation myocardial infarction following primary percutaneous coronary intervention. Kardiologia polska. (2018) 76:899–907. doi: 10.5603/KP.2018.0008
6. Song Y, Cui K, Yang M, Song C, Yin D, Dong Q, et al. High triglyceride-glucose index and stress hyperglycemia ratio as predictors of adverse cardiac events in patients with coronary chronic total occlusion: A large-scale prospective cohort study. Cardiovasc Diabetol. (2023) 22:180. doi: 10.3390/jcm10030440
7. Zhou Q, Yang J, Tang H, Guo Z, Dong W, Wang Y, et al. High triglyceride-glucose (TyG) index is associated with poor prognosis of heart failure with preserved ejection fraction. Cardiovasc Diabetol. (2023) 22:263. doi: 10.1113/JP276747
8. Chen Q, Xiong S, Zhang Z, Yu X, Chen Y, Ye T, et al. Triglyceride-glucose index is associated with recurrent revascularization in patients with type 2 diabetes mellitus after percutaneous coronary intervention. Cardiovasc Diabetol. (2023) 22:284. doi: 10.1001/jama.299.13.1561
9. Tao L-C, Xu J-N, Wang T-T, Hua F, Li J-J. Triglyceride-glucose index as a marker in cardiovascular diseases: Landscape and limitations. Cardiovasc Diabetol. (2022) 21:68. doi: 10.2337/dc18-1920
10. Wang L, Cong H-L, Zhang J-X, Hu Y-C, Wei A, Zhang Y-Y, et al. Triglyceride-glucose index predicts adverse cardiovascular events in patients with diabetes and acute coronary syndrome. Cardiovasc Diabetol. (2020) 19:80. doi: 10.1186/s12933-020-01054-z
11. Akbar MR, Pranata R, Wibowo A, Irvan, Sihite TA, Martha JW. The association between triglyceride-glucose index and major adverse cardiovascular events in patients with acute coronary syndrome - dose-response meta-analysis. Nutrition metabolism Cardiovasc Dis NMCD. (2021) 31:3024–30. doi: 10.1016/j.numecd.2021.08.026
12. Jiao Y, Su Y, Shen J, Hou X, Li Y, Wang J, et al. Evaluation of the long-term prognostic ability of triglyceride-glucose index for elderly acute coronary syndrome patients: A cohort study. Cardiovasc Diabetol. (2022) 21:3. doi: 10.1161/CIRCRESAHA.117.311586
13. Wang J, Huang X, Fu C, Sheng Q, Liu P. Association between triglyceride glucose index, coronary artery calcification and multivessel coronary disease in Chinese patients with acute coronary syndrome. Cardiovasc Diabetol. (2022) 21:187. doi: 10.1186/s12944-020-1187-0
14. Thygesen K, Alpert JS, Jaffe AS, Chaitman BR, Bax JJ, Morrow DA, et al. Fourth universal definition of myocardial infarction (2018). J Am Coll Cardiol. (2018) 72:2231–64. doi: 10.1016/j.jacc.2018.08.1038
15. Bourassa MG, Fisher LD, Campeau L, Gillespie MJ, McConney M, Lespérance J. Long-term fate of bypass grafts: The Coronary Artery Surgery Study (CASS) and Montreal Heart Institute experiences. Circulation. (1985) 72:V71–8.
16. Celebi S, Celebi OO, Cetin S, Cetin HO, Tek M, Gokaslan S, et al. The usefulness of admission plasma NT-pro BNP level to predict left ventricular aneurysm formation after acute ST-segment elevation myocardial infarction. Arquivos brasileiros cardiologia. (2019) 113:1129–37. doi: 10.5935/abc.20190226
17. Zhou Y, Wang C, Che H, Cheng L, Zhu D, Rao C, et al. Association between the triglyceride-glucose index and the risk of mortality among patients with chronic heart failure: Results from a retrospective cohort study in China. Cardiovasc Diabetol. (2023) 22:171. doi: 10.1016/j.jchf.2017.06.013
18. Hill MA, Yang Y, Zhang L, Sun Z, Jia G, Parrish AR, et al. Insulin resistance, cardiovascular stiffening and cardiovascular disease. Metabolism: Clin Exp. (2021) 119:154766. doi: 10.1016/j.metabol.2021.154766
19. Mancusi C, de Simone G, Best LG, Wang W, Zhang Y, Roman MJ, et al. Myocardial mechano-energetic efficiency and insulin resistance in non-diabetic members of the Strong Heart Study cohort. Cardiovasc Diabetol. (2019) 18:56. doi: 10.1186/s12944-018-0914-2
20. Xie E, Ye Z, Wu Y, Zhao X, Li Y, Shen N, et al. The triglyceride-glucose index predicts 1-year major adverse cardiovascular events in end-stage renal disease patients with coronary artery disease. Cardiovasc Diabetol. (2023) 22:292. doi: 10.1186/s12933-022-01582-w
21. Zhang Q, Xiao S, Jiao X, Shen Y. The triglyceride-glucose index is a predictor for cardiovascular and all-cause mortality in CVD patients with diabetes or pre-diabetes: Evidence from NHANES 2001-2018. Cardiovasc Diabetol. (2023) 22:279. doi: 10.1212/WNL.0000000000007454
22. van Minh H, Tien HA, Sinh CT, Thang DC, Chen C-H, Tay JC, et al. Assessment of preferred methods to measure insulin resistance in Asian patients with hypertension. J Clin hypertension (Greenwich Conn.). (2021) 23:529–37. doi: 10.1371/journal.pone.0149731
23. Muniyappa R, Lee S, Chen H, Quon MJ. Current approaches for assessing insulin sensitivity and resistance in vivo: Advantages, limitations, and appropriate usage. Am J Physiol Endocrinol Metab. (2008) 294:E15–26. doi: 10.1152/ajpendo.00645.2007
24. Son D-H, Lee HS, Lee Y-J, Lee J-H, Han J-H. Comparison of triglyceride-glucose index and HOMA-IR for predicting prevalence and incidence of metabolic syndrome. Nutrition metabolism Cardiovasc Dis NMCD. (2022) 32:596–604. doi: 10.1016/j.numecd.2021.11.017
25. Kim B, Kim G-M, Huh U, Lee J, Kim E. Association of HOMA-IR versus tyG index with diabetes in individuals without underweight or obesity. Healthcare (Basel Switzerland). (2024) 12. doi: 10.1016/j.amjmed.2008.06.037
26. Hao Q, Yuanyuan Z, Lijuan C. The prognostic value of the triglyceride glucose index in patients with acute myocardial infarction. J Cardiovasc Pharmacol Ther. (2023) 28:10742484231181846. doi: 10.1177/10742484231181846
27. Wang M, Zhou L, Su W, Dang W, Li H, Chen H. Independent and joint associations between the triglyceride-glucose index and NT-proBNP with the risk of adverse cardiovascular events in patients with diabetes and acute coronary syndrome: A prospective cohort study. Cardiovasc Diabetol. (2023) 22:149. doi: 10.1136/bmj.k1497
28. Zhu Y, Liu K, Chen M, Liu Y, Gao A, Hu C, et al. Triglyceride-glucose index is associated with in-stent restenosis in patients with acute coronary syndrome after percutaneous coronary intervention with drug-eluting stents. Cardiovasc Diabetol. (2021) 20:137. doi: 10.1016/j.cmet.2011.07.015
29. Xiong S, Chen Q, Long Y, Su H, Luo Y, Liu H, et al. Association of the triglyceride-glucose index with coronary artery disease complexity in patients with acute coronary syndrome. Cardiovasc Diabetol. (2023) 22:56. doi: 10.1016/j.jacc.2021.03.314
30. Engel J, Brady WJ, Mattu A, Perron AD. Electrocardiographic ST segment elevation: Left ventricular aneurysm. Am J Emergency Med. (2002) 20:238–42. doi: 10.1053/ajem.2002.32634
31. Feng Y, Wang Q, Chen G, Ye D, Xu W. Impaired renal function and abnormal level of ferritin are independent risk factors of left ventricular aneurysm after acute myocardial infarction: A hospital-based case-control study. Medicine. (2018) 97:e12109. doi: 10.1097/MD.0000000000012109
32. Zhang Z, Guo J. Predictive risk factors of early onset left ventricular aneurysm formation in patients with acute ST-elevation myocardial infarction. Heart Lung J Crit Care. (2020) 49:80–5. doi: 10.1016/j.hrtlng.2019.09.005
33. Zhang K, Yang L, Wu X, Zheng X, Zhao Y. Urea nitrogen-to-albumin ratio predicts ventricular aneurysm formation in ST-segment elevation myocardial infarction. ESC Heart failure. (2024) 11(2):974–85. doi: 10.1002/ehf2.14620
34. Yang T, Li G, Wang C, Xu G, Li Q, Yang Y, et al. Insulin resistance and coronary inflammation in patients with coronary artery disease: A cross-sectional study. Cardiovasc Diabetol. (2024) 23:79. doi: 10.1007/s00330-020-07069-0
35. Wu H, Ballantyne CM. Skeletal muscle inflammation and insulin resistance in obesity. J Clin Invest. (2017) 127:43–54. doi: 10.2337/db08-0943
Keywords: triglyceride-glucose index, acute ST-segment elevation myocardial infarction, primary percutaneous coronary intervention, left ventricular aneurysm, predictive
Citation: Zeng X, Zhang Y, Xie X, Lan J and Li S (2025) Triglyceride-glucose index predicts ventricular aneurysm formation in acute ST-segment elevation myocardial infarction. Front. Endocrinol. 16:1423040. doi: 10.3389/fendo.2025.1423040
Received: 25 April 2024; Accepted: 14 April 2025;
Published: 08 May 2025.
Edited by:
Prem Prakash Kushwaha, Case Western Reserve University, United StatesCopyright © 2025 Zeng, Zhang, Xie, Lan and Li. This is an open-access article distributed under the terms of the Creative Commons Attribution License (CC BY). The use, distribution or reproduction in other forums is permitted, provided the original author(s) and the copyright owner(s) are credited and that the original publication in this journal is cited, in accordance with accepted academic practice. No use, distribution or reproduction is permitted which does not comply with these terms.
*Correspondence: Jianjun Lan, cHpoenh5eXhua2xqakBzaW5hLmNvbQ==; Shiyang Li, bGlzaGl5YW5nenl5QDE2My5jb20=