 Xingxing Chen
 Lili Zhang1
 Jiajia Lu
- 1Department of Ultrasound, The First People’s Hospital of Xiaoshan District, Hangzhou, Zhejiang, China
- 2Clinical Research Center, Xiaoshan Affiliated Hospital of Wenzhou Medical University, Hangzhou, Zhejiang, China
Purpose: The aim of this study was to establish and validate a radiomics model combining the American College of Radiology Thyroid Imaging, Reporting and Data System (ACR TI-RADS) and clinical features and to build a nomogram that could be utilized to enhance the diagnostic performance of malignant thyroid nodules.
Method: From January 2019 to September 2022, 329 thyroid nodules from 323 patients who had been referred for surgery and had pathological evidence of them were gathered retrospectively and randomly allocated to training and test cohorts (8:2 ratio). A total of 107 radiomics features were extracted from the US images, and the radiomics score (Rad-score) was constructed using the Least Absolute Shrinkage and Selection Operator (LASSO) algorithm. Different models were created using logistic regression, including the clinic-ACR score (Clin+ACR), clinic-Rad score (Clin+Rad), ACR score-Rad score (ACR+Rad), and combined clinic-ACR score-Rad score (Clin+ACR+Rad). The diagnostic performance of different models was calculated and compared using the area under the receiver operating curve (AUC) and the corresponding sensitivity and specificity.
Results: Eight radiomics features were independent signatures for predicting malignant TNs, with malignant TNs having higher Rad-scores in both cohorts (P < 0.05). The Clin+ACR+Rad model showed excellent diagnostic prediction ability in both the training (AUC = 0.958) and test datasets (AUC = 0.937), significantly outperforming other models including Rad-score (AUC = 0.890, 0.856), Clin+Rad (AUC = 0.895, 0.859), ACR+Rad (AUC = 0.943, 0.934), and Clin+ACR (AUC = 0.784, 0.785) (all P < 0.05). The calibration curve demonstrated that the mean absolute error in the training group was just 0.020 and in the test cohort was 0.033. To evaluate the clinical utility of the nomogram in reducing unnecessary biopsies, we further analyzed the performance of our integrated model (Clin+ACR+Rad) compared to the traditional ACR TI-RADS system at different probability thresholds. At the statistically optimal threshold of 0.386, the unnecessary biopsy rate decreased from 46.97% to 22.05% in the training cohort and from 45.83% to 21.05% in the test cohort.
Conclusion: The current study offers preliminary support that the model of combined clinic-ACR score-radiomics score can be helpful for predicting malignancy in thyroid nodules by looking at a retrospective cohort of surgically treated thyroid nodules. The Clin-ACR-Rad nomogram may be a more practical instrument and more accurate prediction model for malignant thyroid nodules.
Introduction
Thyroid nodules (TNs) are a common disease of the endocrine system worldwide (1). The identification rate of TNs is increasing annually because of increased public health awareness and improved examination methods (2). But at the same time, the management of these nodules has significant clinical problems due to overdiagnosis and overtreatment (3). The pathological state of TNs is primarily related to patient prognosis and clinical management.
Currently, the pathological evaluation of TNs is primarily determined through fine-needle aspiration (FNA), an invasive procedure with inherent limitations, such as sampling errors and uncertain results (4). To minimize unnecessary invasive procedures, various non-invasive, ultrasound-based risk stratification systems have been developed. Among these, the American College of Radiology’s Thyroid Imaging Reporting and Data System (ACR TI-RADS) is the most widely used clinical tool. ACR TI-RADS assesses TNs based on five ultrasound features: composition, echogenicity, shape, margin, and echogenic foci (5, 6).
Despite proven efficacy in diagnosing TNs and reducing referral biopsies (7–9), ACR TI-RADS has notable limitations. The system may misclassify nodules with inconsistent ultrasound features (10), and relies on subjective visual interpretation, introducing inter-observer variability. To address these limitations, radiomics has emerged as a promising complementary approach. Radiomics enables high-throughput extraction of quantitative image features, capturing important aspects of the images, including histogram-based metrics and texture elements, which cannot be assessed by visual interpretation alone (11, 12). These extracted features may contain pathophysiological information related to the histological characteristics of tissues. Recent studies have shown that radiomic features from medical images are significantly associated with the histological staging of various diseases (11, 13, 14).
However, radiomics presents its own challenges. Radiological features are typically extracted from single 2D images of the target nodule, potentially overlooking important 3D characteristics (15). Moreover, focusing solely on imaging data disregards valuable clinical information that could enhance diagnostic accuracy. This suggests that combining radiomics with clinical data and standardized ultrasound evaluation systems may lead to better results. To address the limitations of individual methods and leverage their complementary strengths, we propose an integrated predictive model implemented through a nomogram.
A nomogram is a graphical tool that uses multivariate regression analysis to present predicted values for specific outcomes in a clear and interpretable manner. By integrating radiomic features (which capture subtle tissue patterns), ACR TI-RADS assessments (which provide a standardized evaluation of visible ultrasound features), and relevant clinical data (including patient-specific risk factors), we hypothesize that this combined approach will offer superior diagnostic performance compared to any single method.
Previous studies have attempted to combine radiomics with ACR TI-RADS to improve diagnostic accuracy, showing improved performance over single-modality approaches (16). Our study builds upon and extends this previous work by proposing a novel triple-modality approach (Clinical+ACR TI-RADS+Radiomics) that leverages the complementary strengths of all three feature sets. Therefore, the specific objectives of this study are: (1) to extract and select the optimal radiomic features from ultrasound images of thyroid nodules; (2) to develop and validate predictive models based on various combinations of radiomic features, ACR TI-RADS assessments, and clinical characteristics; (3) to evaluate and compare the diagnostic performance of different models for malignant thyroid nodules; and (4) to construct a comprehensive nomogram integrating these three dimensions.
Materials and methods
The ethics committee of the local hospital approved this retrospective study (Ethical Approval NO. 2022-112). Patient confidentiality is strictly protected and the informed consent requirement was exempted. The research followed the guidelines set forth in the 1964 Helsinki Declaration and its revisions. The reporting of our radiomics study adheres to the CheckList for EvaluAtion of Radiomics research (CLEAR) guidelines (17). The completed CLEAR checklist is provided as a Supplementary Material.
Patient enrollment
Consecutive patients who underwent thyroid ultrasonography and TNs found in our hospital between January 2019 and September 2022 were included. The nodules were subjected to the following inclusion and exclusion criteria.
The following were the inclusion criteria: (1) postoperative pathological findings were obtained following surgical excision of the target nodule; (2) The Philips iU22 system and an identical linear array transducer with a 5–12 MHz frequency bandwidth were used for the US assessment (Philips Ultrasound, Washington, USA); and (3) complete clinical data were obtained from medical records.
The exclusion criteria were categorized as follows: (1) TNs that produced controversial pathological outcomes; (2) unsatisfactory US image quality, which affected the feature extraction; and (3) patients who underwent other treatments such as chemotherapy, radiation, or radiofrequency ablation before surgery.
This study included 323 patients (91 males and 238 females; mean age 53.1 years, range 20–84 years), with a total of 329 thyroid nodules. Six patients had multiple nodules, which were randomly assigned during dataset splitting to ensure statistical independence. Of all nodules, 161 were malignant and 168 were benign. Among the 161 malignant nodules, 158 cases (98.1%) of papillary thyroid carcinoma, 2 cases (1.2%) of follicular thyroid carcinoma, and 1 case (0.6%) of medullary thyroid carcinoma. All 329 nodules were divided into two groups at random, with an 8:2 ratio: a training cohort (n = 263, 75 men and 188 women; median age, 53.6 years, range 20 to 83 years) and a test cohort (n = 66, 16 men and 50 women; median age, 51.2 years, range 22 to 84 years).
Clinical and US information
Clinical data, including age, sex, body mass index (BMI), medical history, smoking, and alcohol drinking, were obtained from the medical records. The gold standard was established when expert pathologists validated pathological findings. In our investigation, identical Philips iU22 equipment and a linear array transducer were used for the US examinations. All US images were evaluated by two experienced radiologists (10 and 7 years), who were unaware of any clinical details or final pathological diagnoses. B-mode ultrasonography (BMUS) features of the TNs were collected using the ACR TI-RADS standard (18). Two radiologists estimated each nodule’s score and characterized its B-mode ultrasound parameters, such as echogenicity, composition, shape, margins, and echogenic foci. If there were any disagreements, the final diagnosis was based on consensus.
TNs segmentation
From the image storage system, the TNs with the largest diameter in the B-mode ultrasound images were selected, and ITK-SNAP software was then used for analysis (version 3.6.0). A radiologist with 10 years of experience in thyroid ultrasound diagnosis manually delineated the region of interest (ROI) to define the boundaries of the TN. To enhance the visibility of the nodule’s borders, contrast and brightness settings in ITK-SNAP were adjusted, typically increasing the contrast by about 15% and reducing the brightness by approximately 10%. The largest cross-sectional image of each nodule was selected for ROI delineation. The ROI boundaries included not only the nodule itself but also the surrounding area with observable changes in echogenicity, which were assessed visually by the experienced radiologist.
To evaluate intra-observer reproducibility, the radiologist randomly selected 50 TNs and described them twice, with a two-week interval between assessments. Additionally, another radiologist, with 7 years of experience in thyroid ultrasound diagnosis, independently described the ROIs of the same 50 TNs to assess inter-observer reproducibility. Both radiologists were blinded to any clinical details or final pathological diagnoses. The reproducibility was quantitatively measured using intraclass correlation coefficient (ICC). The evaluation showed good reproducibility with an intra-observer ICC of 0.87 (95% CI: 0.82-0.92) and an inter-observer ICC of 0.82 (95% CI: 0.76-0.88).
Radiomics feature extraction
We extracted 107 radiomics features using the open-source Python library “Pyradiomics V1.3.0” (http://www.radiomics.io/pyradiomics.html). For image preprocessing and feature extraction, the following parameters were used: (1) Image resampling was performed using B-spline interpolation method while maintaining the original image resolution; (2) Discretization utilized a fixed bin width method with a bin width of 25; (3) 2D features were extracted (force2D: true) from the segmented ROIs. We chose 2D rather than 3D feature extraction because clinical thyroid nodule assessment typically uses 2D ultrasound of the largest cross-sectional plane, 2D processing requires less computational resources, and alignment with clinical practice enhances result interpretability and clinical applicability; (4) A total of 107 radiomic features were extracted from seven feature classes, including first-order statistics features (n=18), gray-level co-occurrence matrix features (GLCM, n=24), gray-level run-length matrix features (GLRLM, n=16), gray level size zone matrix features (GLSZM, n=16), shape-based features (n=14), gray level dependence matrix features (GLDM, n=14), and neighboring gray tone difference matrix features (NGTDM, n=5); (5) All other parameters remained as default configurations in Pyradiomics V1.3.0. The extracted features followed the Image Biomarker Standardization Initiative (IBSI) guidelines to ensure reproducibility. We limited our analysis to these 107 features to maintain a reasonable feature-to-sample ratio (approximately 1:3) given our sample size (329 nodules), thereby reducing the risk of overfitting. Moreover, these features cover the most commonly used features in radiomic analysis and are particularly suitable for ultrasound image analysis, which typically has lower resolution and contrast compared to CT or MRI.
Normalization based on Z-score features was applied, where the mean of radiomic features was standardized to 0 and the standard deviation to 1. Features with an ICC greater than 0.75 were considered to have strong consistency and were included in the subsequent feature selection process.
Feature selection and Rad-score establishment
First, to identify the picture attributes with statistically significant differences(P<0.05), a two-sample t-test was used with the goal of removing unnecessary feature parameters to reduce the overfitting data dimension. To exclude picture characteristics with correlations less than 0.8, Spearman’s correlation analysis was performed. Finally, to identify the top-ranked features, the Least Absolute Shrinkage and Selection Operator (LASSO) logistic regression approach is employed by adjusting the penalty parameter using 5-fold cross-validation. A radiomics signature, also known as a radiomics score (Rad-score), was generated by weighting the chosen attributes with nonzero coefficients using the results of a linear regression model. Figure 1 depicts the flowchart of the radiomics analysis procedure.
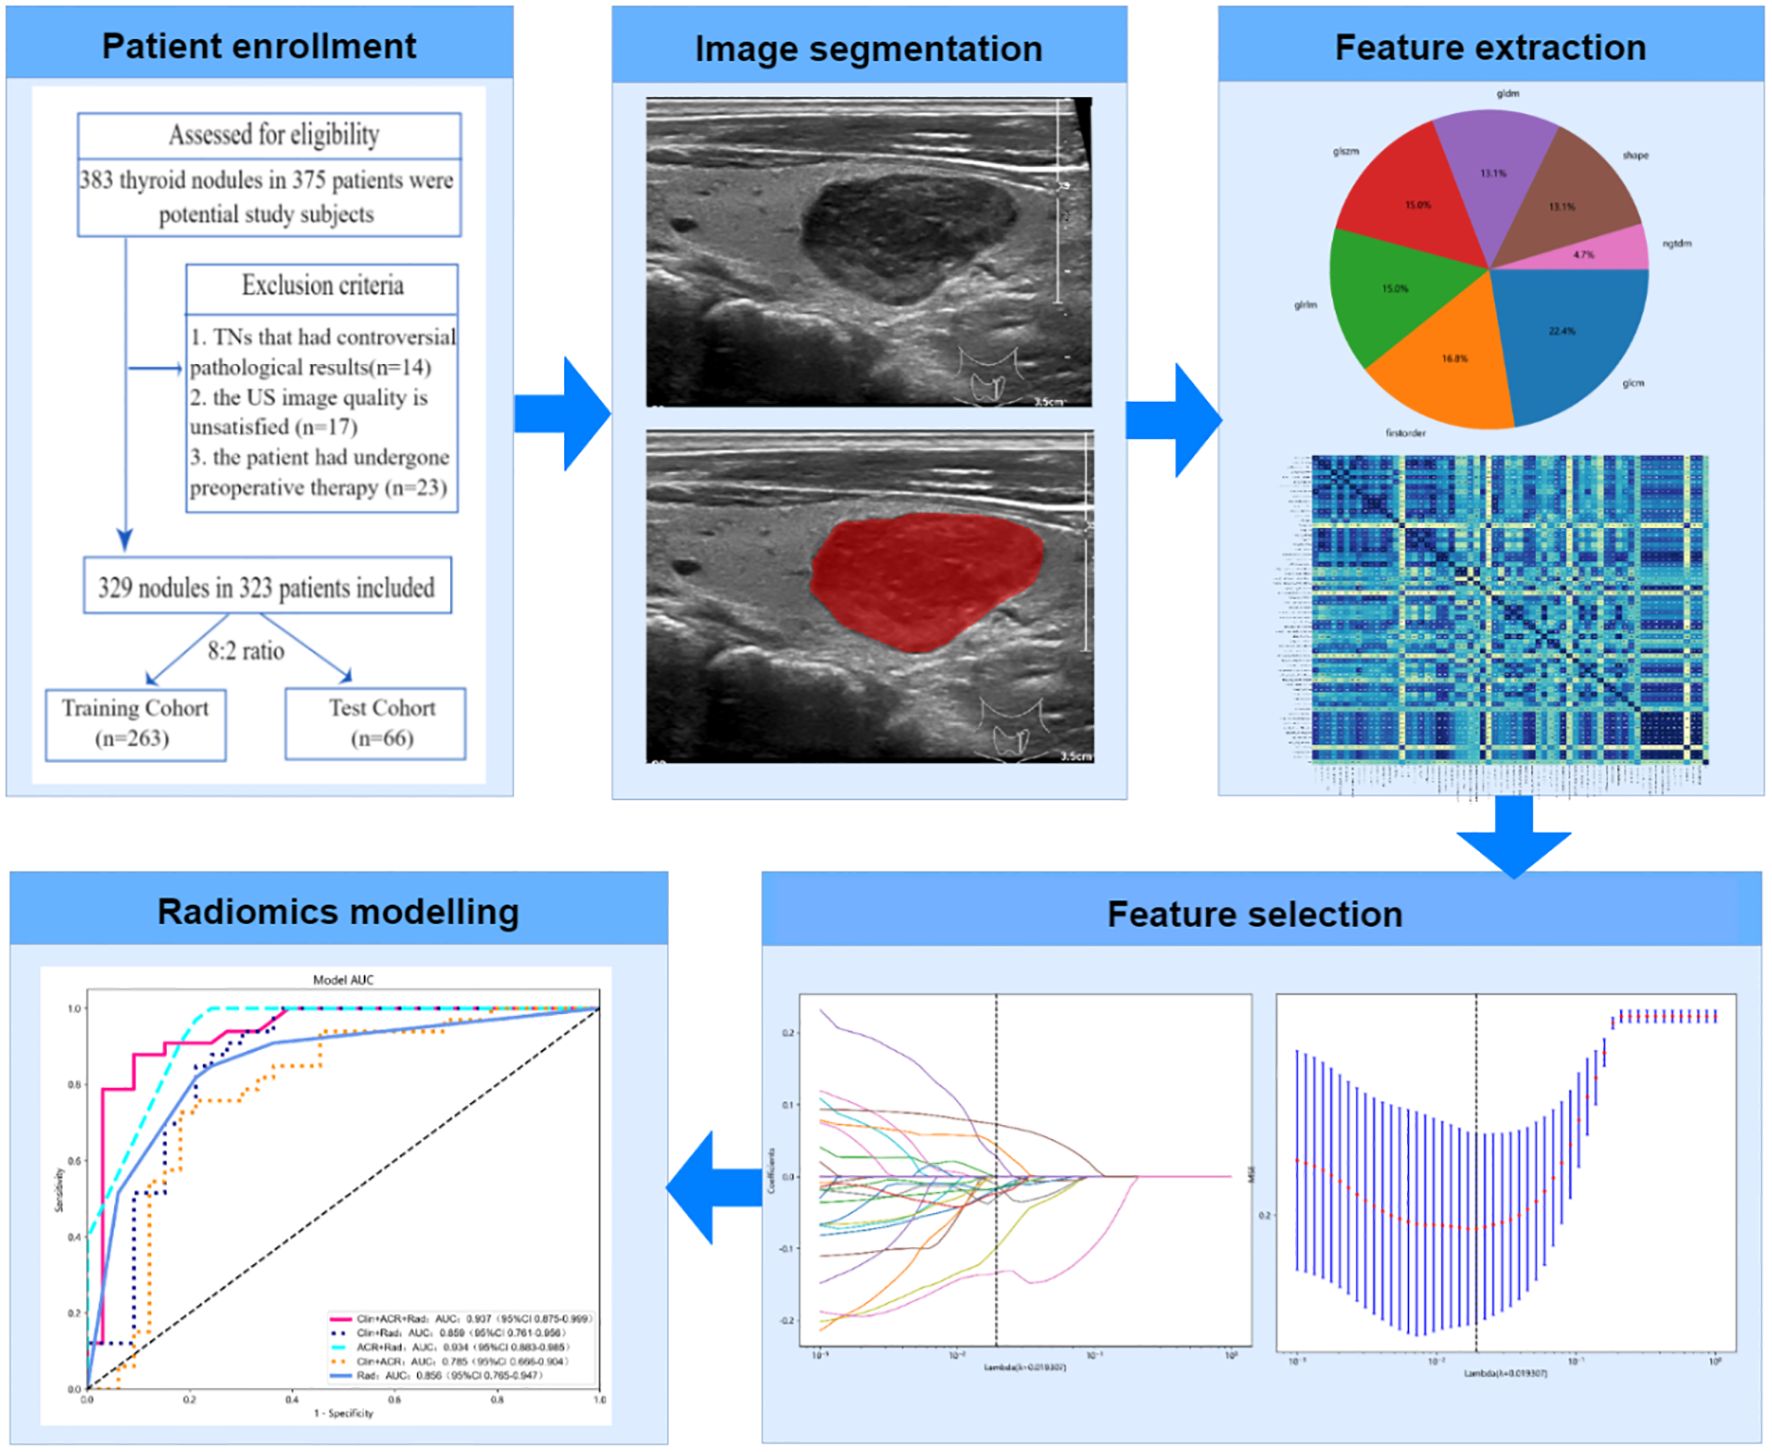
Figure 1. Flowchart of radiomics analysis process.
Statistical analysis
Data were analyzed using R software (version 3.7.0) and SPSS software (version 22.0). Categorical data are reported as numbers and percentages, whereas continuous data are expressed as mean ± standard deviation. The student’s t-test was used to compare continuous data, and the chi-square test or, if appropriate, Fisher’s test was used to compare categorical data. Univariate logistic regression was used in the training cohort to examine factors that predicted malignancy. To assess the applicability of all putative predictors of malignancy, regression coefficients (β) and odds ratios (ORs) with corresponding relative 95% confidence intervals (CIs) were calculated.
Different models were created using logistic regression, taking into consideration the possible impact of clinical factors for each patient, including the clinic-ACR score (Clin+ACR), clinic-Rad score (Clin+Rad), ACR score-Rad score (ACR+Rad), and combined clinic-ACR score-Rad score (Clin+ACR+Rad). We chose logistic regression over other machine learning methods (such as random forest) because logistic regression models have stronger interpretability, making them easier for clinicians to understand and apply. Additionally, considering our relatively limited sample size (329 nodules), logistic regression is less prone to overfitting compared to more complex models. It was feasible to discriminate between benign and malignant TNs using the area under the receiver operating curve (AUC) and associated specificity, sensitivity, negative predictive value (NPV), and positive predictive value (PPV). High (AUC>0.9), moderate (AUC = 0.7-0.9), or low (AUC = 0.5-0.7) diagnostic performance was considered (19). The optimal cut-off values for each model were determined based on the Youden index (sensitivity + specificity - 1) in the ROC curve analysis. In addition, we compared the performance of all models to a zero-rule classifier (that is, a classifier that predicts all nodules as the most common category in the dataset) to assess how much our model improves against a simple benchmark. The nomogram was built based on the results, and calibration was evaluated using the calibration curve.
Results
Demographics and thyroid nodules characteristics
Table 1 displays the baseline information of the recruited nodules in the training and test groups. The frequency of malignant lesions did not change significantly between the training and test groups [48.7% (128/263) vs. 50.0% (33/66), P = 0.847]. Additionally, there were no significant variations in age, sex, BMI, alcohol and tobacco use, medical history, or nodule diameter between the two cohorts.
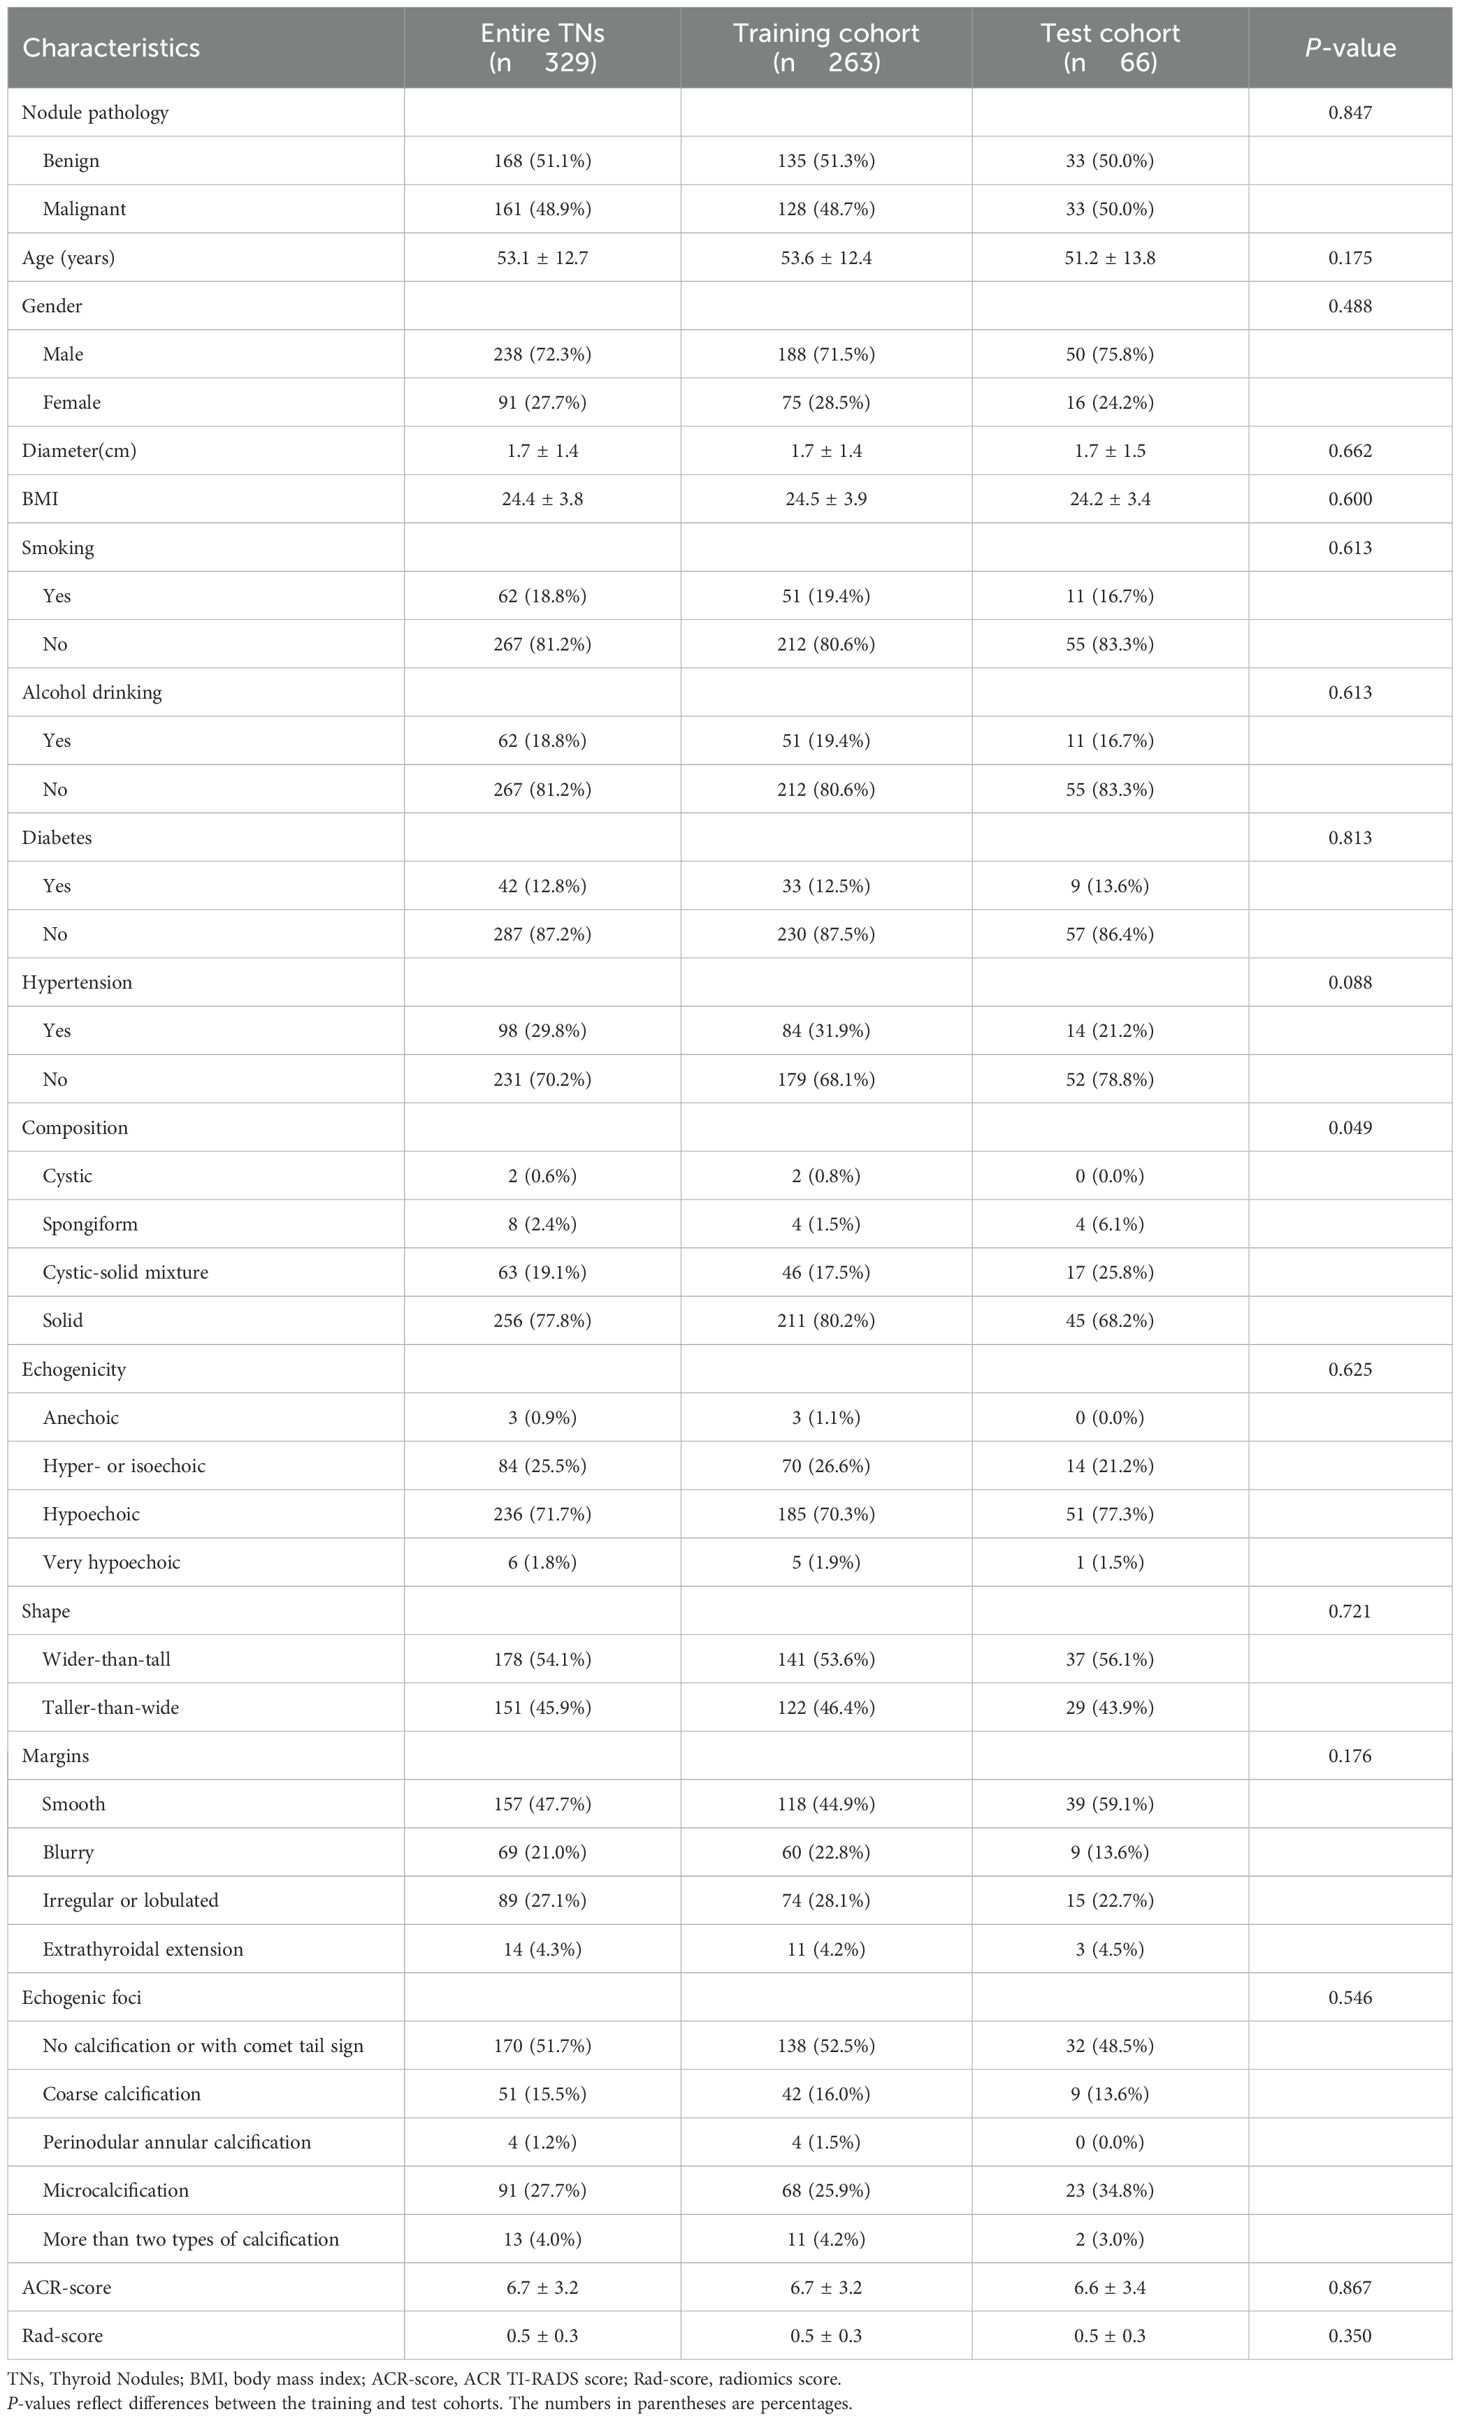
Table 1. Information for thyroid nodules in the training and test cohorts.
In the training and test cohorts, we also examined the fundamental information mentioned above in relation to malignant and benign nodules. Table 2 presents this information. Age and nodule diameter were significantly different (all P < 0.05). In addition, between benign and malignant nodules, there were noticeable changes in the five ACR TI-RADS parameters and ACR scores. In both the training and test groups, malignant nodules had a substantially higher ACR-Score than benign nodules (P < 0.05).
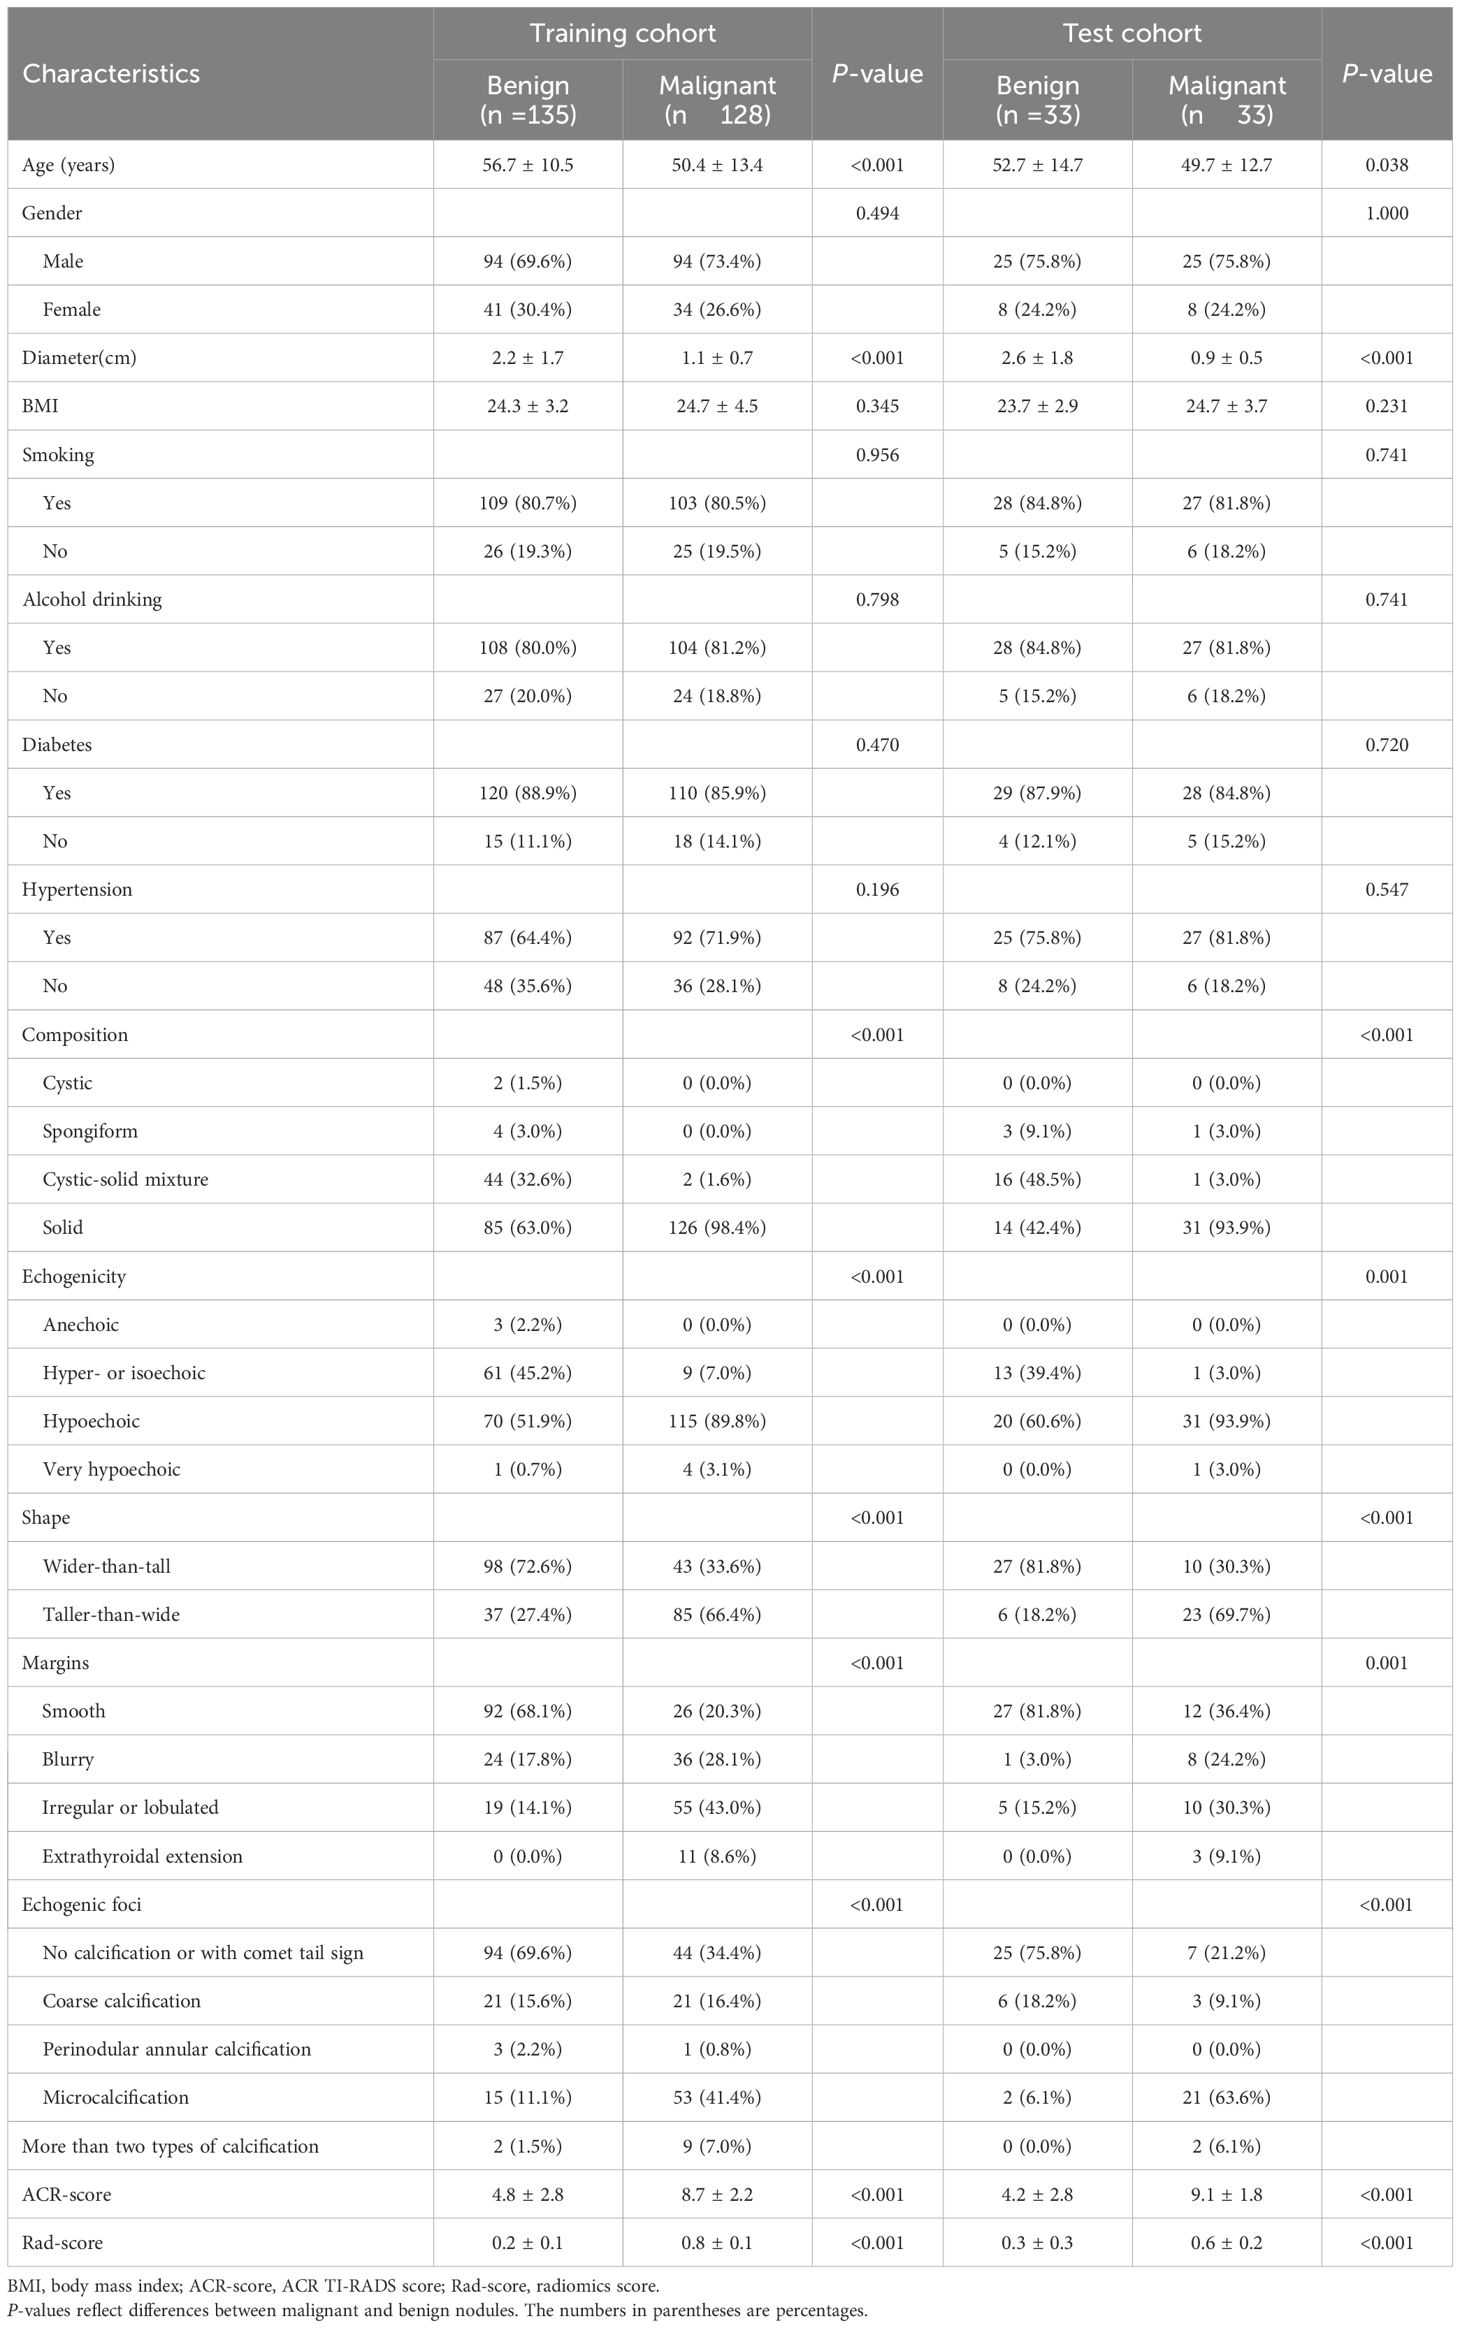
Table 2. Information for thyroid nodules in the training and validation cohorts (stratified by pathology).
Feature selection and Rad-score calculation
First, to avoid overfitting, 107 extracted features were reduced to 27 features using t-test and Spearman analysis. The LASSO approach was then used for final dimensionality reduction and feature selection to generate the eight traits that were most useful in distinguishing between benign and malignant TNs. Based on these eight selected traits, we developed the following Rad-score calculation (Lambda[λ] = 0.0193, five-fold cross-validation) (Figure 2):
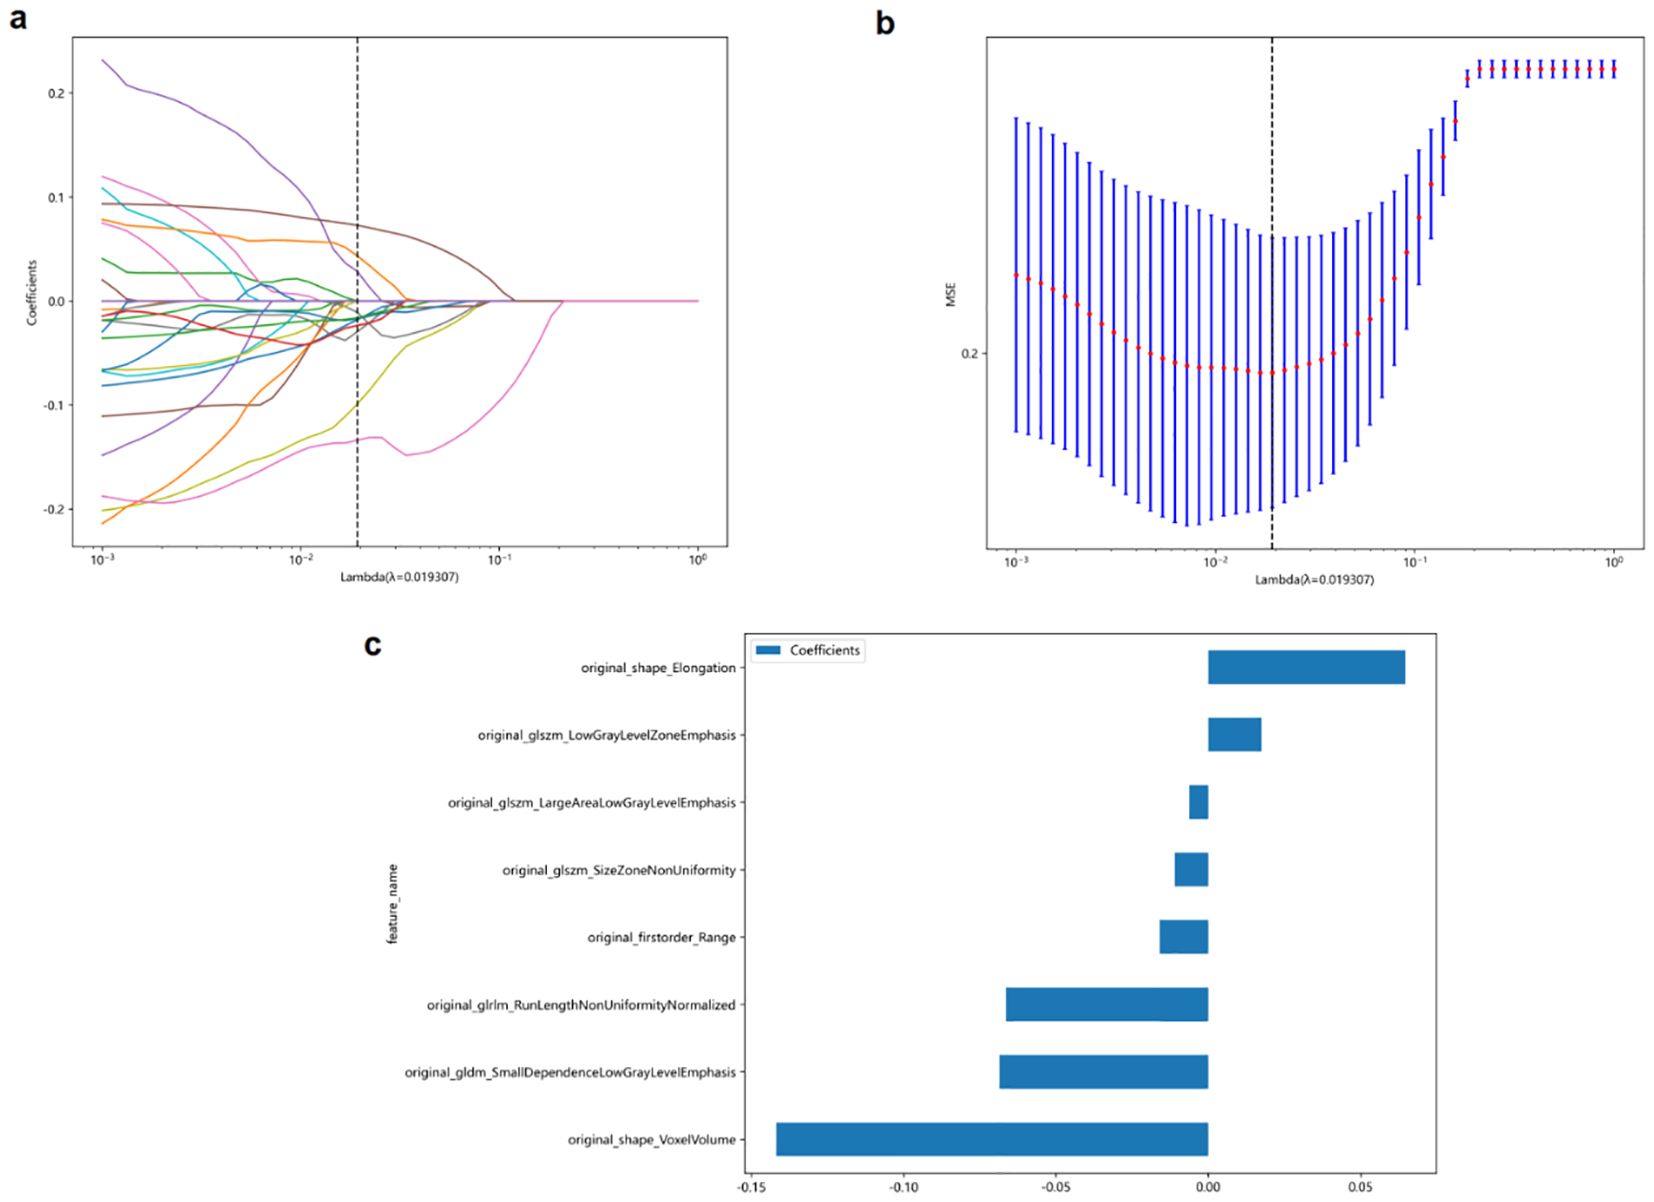
Figure 2. The least absolute shrinkage and selection operator (LASSO) logistic regression was used to identify the top-ranked features. (a, b) Five-fold cross-validation was used to select the tuning parameter (λ) in the LASSO regression model. An optimal λ value of 0.0193 was selected. (c) The eight selected features and coefficients of the Rad-score were indicated by the y-axis and x-axis, respectively.
The eight selected radiomics features in the Rad-score formula capture different aspects of thyroid nodules that are clinically relevant for malignancy prediction. Original_shape_Elongation quantifies the stretching or elongation of a nodule, with higher values indicating more irregular, elongated shapes. This aligns with the clinical ‘taller-than-wide’ sign, as malignant nodules tend to grow across normal tissue planes. Original_shape_VoxelVolume represents the three-dimensional size of the nodule, providing volumetric information beyond simple diameter measurements.
The textural features in our model characterize internal nodule heterogeneity that may not be visible to the naked eye. Original_firstorder_Range measures the variation in echogenicity within the nodule, reflecting internal structural complexity. Original_glszm_LowGrayLevelZoneEmphasis quantifies the presence of hypoechoic regions, commonly associated with malignancy, while original_glszm_LargeAreaLowGrayLevelEmphasis describes the distribution of larger hypoechoic areas that may represent cystic changes or necrosis. Original_glszm_SizeZoneNonUniformity evaluates the variability in the size of similarly echogenic regions, indicating structural heterogeneity. Original_gldm_SmallDependenceLowGrayLevelEmphasis identifies small, discrete hypoechoic areas that could represent microcalcifications or small areas of necrosis, and original_glrlm_RunLengthNonUniformityNormalized captures the complexity and discontinuity of echo texture patterns, reflecting the degree of tissue disorganization. Together, these quantitative features detect subtle malignancy-associated patterns beyond conventional visual assessment capabilities.
According to Table 2, whether in the training group (0.2 ± 0.1 vs. 0.8 ± 0.1, P<0.001) or test group (0.3 ± 0.3 vs. 0.6 ± 0.2, P<0.001), benign TNs had substantially lower Rad-scores than malignant TNs.
Performance and validation of different models
In the training dataset, the Clin+ACR+Rad model based on the optimal cut-off value of 0.386 showed excellent diagnostic prediction ability, with sensitivity of 98.43%, specificity of 89.24%, and AUC value of 0.958, which was significantly superior to other models. It includes the Rad-score model with a cut-off of 0.485 (AUC = 0.890), the Clin+Rad model with a cut-off of 0.572 (AUC = 0.895), and the ACR+Rad model with a cut-off of 0.396 (AUC = 0.943) and a Clin+ACR model with a cut-off value of 0.628 (AUC = 0.784) (all P values < 0.05) (Figure 3a, Table 3). This indicates that the Clin+ACR+Rad model can effectively distinguish benign and malignant thyroid nodules with an optimal cut-off value of 0.386, and maintains stable high performance in independent test sets. Similarly, when compared with the Rad-score (AUC = 0.856), Clin+Rad (AUC = 0.859), ACR+Rad (AUC = 0.934), and Clin+ACR (AUC = 0.785), the AUC value for Clin+ACR+Rad in the test group was substantially higher (AUC = 0.937) (all P < 0.05) (Figure 3b, Table 3). In our dataset, 168 nodules were benign (51.1%) and 161 were malignant (48.9%). Using a zero-rule classifier (which predicts all nodules as benign, the most common class in the dataset), the accuracy would be 51.1%. In contrast, our Clin+ACR+Rad model achieved accuracies of 93.6% in the training set and 86.4% in the test set, significantly outperforming the zero-rule classifier. This demonstrates that our model offers substantial clinical value compared to the simplest predictive strategy.
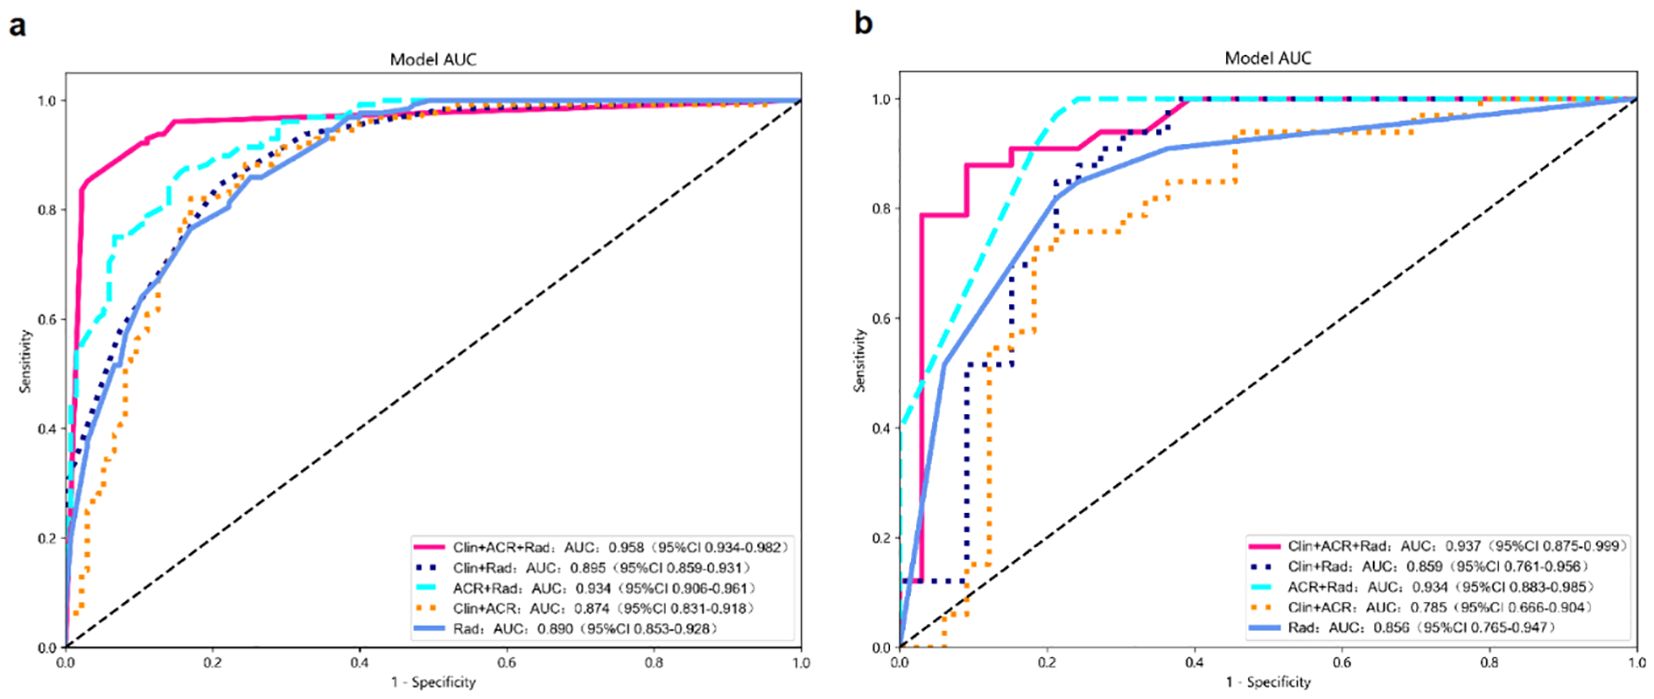
Figure 3. Diagnostic performance of different models for predicting malignant TNs. (a) AUC graphics of different models for predicting malignant TNs in the training cohort; (b) AUC graphics of different models for predicting malignant TNs in the test cohort.
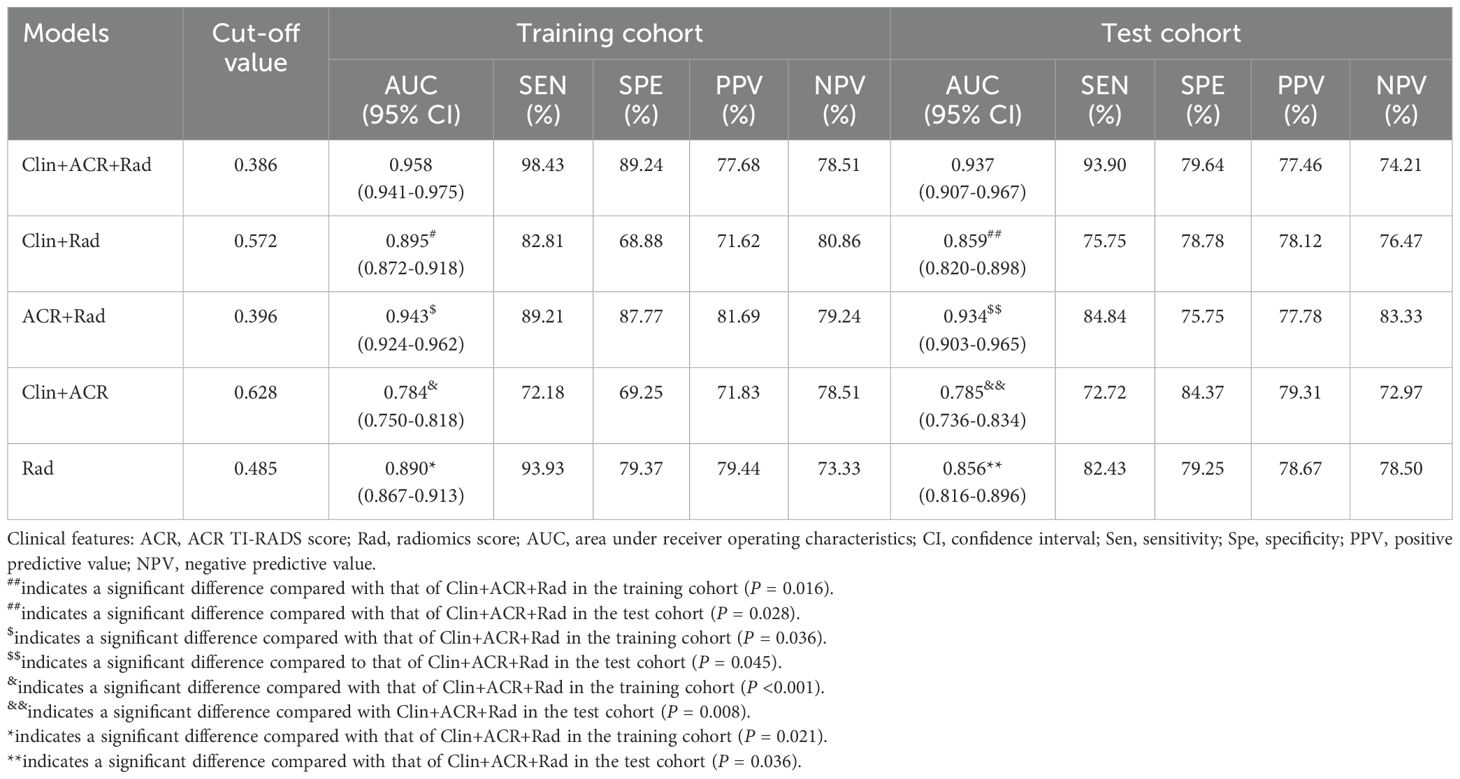
Table 3. Diagnostic performances of models.
Figure 4 displays the nomogram, which is based on the clinical characteristics, Rad-score, ACR-score, and calibration plot. To illustrate the clinical application of this nomogram, consider the following example (shown in Figure 4a): A 45-year-old patient presents with a thyroid nodule measuring 1.5 cm in diameter. Ultrasound examination gives an ACR TI-RADS score of 9, and the radiomics analysis yields a Rad-score of 0.6. Using the nomogram, the clinician first locates the patient’s age (45) on the Age axis and draws a line upward to the Points axis, obtaining approximately 14 points. Similarly, for nodule diameter (1.5 cm), ACR score (7), and Rad-score (0.6), the corresponding points are approximately 10, 41, and 60, respectively. The clinician then sums these values to get a total of 125 points. Locating this value on the Total Points axis and drawing a line downward to the Probability axis indicates approximately 85% probability of malignancy. Based on this high probability, the clinician would likely recommend fine-needle aspiration biopsy or surgical intervention rather than observation.
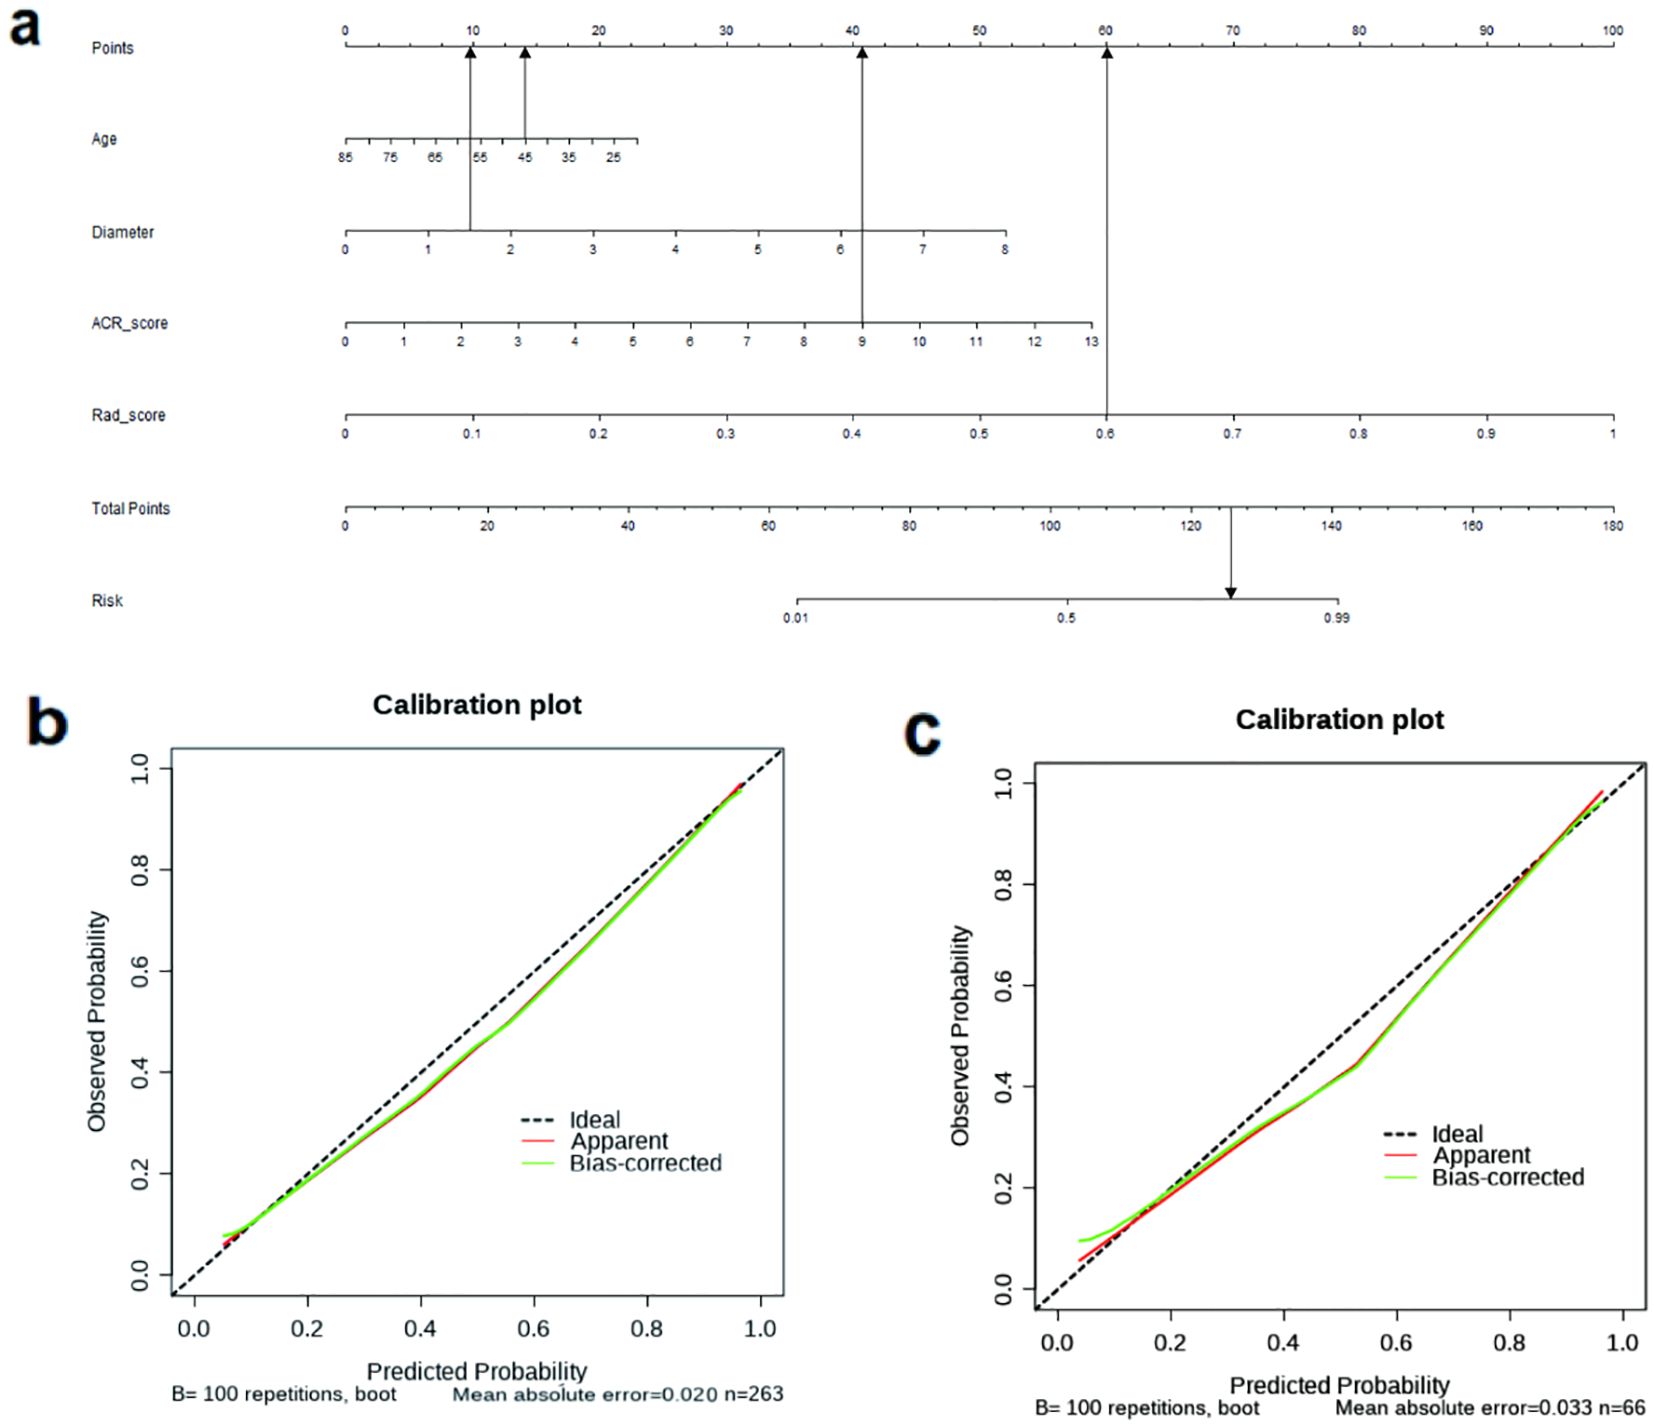
Figure 4. (a) The nomogram based on the model of combined clinical characteristics -ACR score-radiomics score. Usage instructions: (1) Locate patient values on each variable axis (Age, Diameter, ACR-Score, and Rad-score); (2) Draw vertical lines to the ‘Points’ axis to determine points for each variable; (3) Sum all points to obtain ‘Total Points’; (4) Draw a vertical line from the ‘Total Points’ axis down to the ‘Probability’ axis to determine the malignancy probability. (b) The calibration curve showed a mean absolute error of 0.020 in training cohort. result = 1: The pathological state of a nodule was malignant. (c) The calibration curve showed a mean absolute error of 0.033 in test cohort. result = 1: The pathological state of a nodule was malignant.
The calibration curve (Figures 4b, c) demonstrated that the mean absolute error in the training group was just 0.020 and in the test cohort was 0.033. To evaluate the clinical utility of the nomogram in reducing unnecessary biopsies, we further analyzed the performance of our integrated model (Clin+ACR+Rad) compared to the traditional ACR TI-RADS system at different probability thresholds. As shown in the Supplementary Table 1, at the statistically optimal threshold of 0.386, the unnecessary biopsy rate decreased from 46.97% to 22.05% in the training cohort and from 45.83% to 21.05% in the test cohort, while maintaining high sensitivity (98.43% and 93.90%, respectively).
The reduction in unnecessary biopsies may vary depending on clinical settings, patient populations, and the threshold selected by the physician, as well as local clinical practice guidelines. For example, in the training cohort, when avoiding missed diagnoses is critical, using a lower threshold such as 0.200 achieves a very high sensitivity of 99.34%, while still reducing unnecessary biopsies by 10.79%. In resource-limited settings or those requiring strict control over the number of biopsies, a threshold of 0.500 reduces unnecessary biopsies by 33.49%, although sensitivity decreases to 91.53%.
Discussion
In this study, we developed five models to discriminate between benign and malignant thyroid nodules based on ultrasonography radiomics, ACR TI-RADS, and clinical characteristics. The key finding of this study was that the model of the combined clinic-ACR score-Rad score had a better diagnostic efficiency.
According to earlier research, combining ultrasound features such as the ACR TI-RADS lexicon, blood flow, or hypoechoic halo with clinical characteristics such as sex, age, thyrotropin, or nodule diameter slightly improved the precision of the models in differentiating malignant from benign lesions compared to risk classification methods (20, 21). However, another study found no appreciable differences in the aforementioned clinical traits (22). Age, nodule diameter, and ACR TI-RADS score were found in our study to be independent predictors of thyroid cancer in the training group. However, the model combining clinical features with the ACR-score only provides a modest degree of diagnostic effectiveness (AUC=0.784).
The performance gap between the Clin+ACR model (AUC=0.784) and our integrated Clin+ACR+Rad model (AUC=0.958) highlights the limitations of conventional assessment methods and the complementary value of radiomics analysis. This significant improvement (ΔAUC=0.174) can be attributed to several factors. The ACR TI-RADS system, while standardized, relies on subjective visual assessment of a limited set of predefined categorical features, potentially missing subtle variations relevant to malignancy prediction and being subject to inter-observer variability (10). Similarly, clinical features such as age and nodule diameter, though statistically significant, have limited discriminatory power when used alone or combined with ACR-scores. In contrast, radiomics features provide quantitative, objective measurements of nodule characteristics at a level of detail beyond human visual perception, analyzing pixel-level data to quantify subtle aspects of texture, heterogeneity, and morphology that reflect underlying biological properties (11). The significant performance improvement demonstrates that quantitative image analysis captures complementary information not contained in clinical parameters or conventional ultrasound assessments, supporting the value of integrating radiomics into clinical thyroid nodule evaluation.
The ACR TI-RADS can satisfy the original goals of various guidelines, including a reduction in the frequency of unnecessary biopsies and prediction of malignant thyroid nodules. Nevertheless, the clinical application of The ACR guideline is arbitrary (22, 23); malignant lesions can be misclassified if the composition evaluation is inaccurate. Park et al. proved that radiomics dramatically enhances performance and reduces the rate of needless FNAs when paired with ACR recommendations (23). Similarly, Zhang et al. recently developed a radiomics nomogram combining ACR TI-RADS and strain elastography (SE), which demonstrated strong diagnostic performance for thyroid nodules and significantly reduced unnecessary FNA rates (16). Meanwhile, Ren et al. found that a dual-modality radiomics approach based on super-microvascular imaging (SMI) outperformed ACR TI-RADS in classifying thyroid nodules. This approach reduced the unnecessary biopsy rate from 43.4% to 13.9% in the training cohort, and from 45.6% to 18.0% in the validation cohort (24). In another study, Ren et al. developed a dual-modality radiomics nomogram based on B-mode ultrasound and contrast-enhanced ultrasound for ACR TI-RADS 4–5 thyroid nodules. This model showed high accuracy in differentiating benign and malignant TR4–5 nodules and reduced unnecessary FNAB rates (25). These findings are consistent with our results, all demonstrating that models integrating radiomics features with ACR TI-RADS outperforms traditional risk stratification methods. While the research methods differ—our study systematically evaluated five different predictive models to identify the best combination, whereas others focused mainly on specific dual-modality methods—all studies confirm the value and potential of radiomics in thyroid nodule assessment.
While Radiomics gathered internal data from TNs ultrasound pictures at a molecular scale unseen by the human eye to distinguish between malignant and benign TNs, ACR TI-RADS evaluated TNs under macroscopic conditions visible to the unaided eye. Since radiomics and ACR TI-RADS anticipated TNs from two distinct views, benign and malignant, when the two technologies were combined, their complementary impacts improved performance. On this basis, we set up a model of combined clinic-ACR score-Rad score and found better diagnostic efficiency (AUC=0.958); this advantage exists in the test suite as well. This may be because by combining additional data dimensions, we are able to better discriminate between benign and malignant tumors. According to our research, the nomogram of the Clin-ACR-Rad model may be a more practical tool for combining the clinical aspects, ACR-Score, and Rad-Score, and a superior thyroid cancer prognostic model.
Our study has several limitations. First, as a retrospective single-center analysis, selection bias could not be completely avoided, particularly since we only included surgically treated thyroid nodules, limiting the generalizability of our nomogram to patients who did not undergo surgery. To address this important limitation, we are planning a prospective multicenter validation study that will include a more diverse patient population, which will help evaluate the model’s generalizability across different clinical settings. Second, to maintain imaging parameter uniformity, only Philips ultrasound machines were used, suggesting future research should explore various ultrasonic instruments. Third, we did not consider additional dimensional data such as thyroid nodule blood test values, which could enhance prediction accuracy in future models. Furthermore, 98.1% of malignant nodules in our study were papillary thyroid carcinoma, with very few follicular or medullary carcinoma cases. This suggests our model’s performance may primarily apply to papillary thyroid carcinoma prediction, requiring further validation with more diverse samples for other subtypes. Additionally, as our study focused on correlations between ultrasound imaging and pathological results, cytological examination results were not systematically collected. Future research should integrate cytological findings to improve diagnostic accuracy. Lastly, our model lacks external validation from independent medical centers or diverse patient populations, potentially limiting its generalizability to different clinical environments. Future multicenter collaborative studies with prospective designs will further confirm the robustness of the model and enhance the clinical value of our predictive model.
Conclusions
Overall, the current research offers preliminary support that the model of combined clinic-ACR score-Rad score can be helpful for predicting malignancy in thyroid nodules by examining a retrospective cohort of surgically treated thyroid nodules. The Clin-ACR-Rad nomogram may be a more practical instrument and more accurate prediction model for malignant thyroid nodules.
Data availability statement
The original contributions presented in the study are included in the article/Supplementary Material. Further inquiries can be directed to the corresponding author.
Ethics statement
The studies involving humans were approved by Ethics Committee of the First People’s Hospital of Xiaoshan District. The studies were conducted in accordance with the local legislation and institutional requirements. The ethics committee/institutional review board waived the requirement of written informed consent for participation from the participants or the participants’ legal guardians/next of kin because This was a retrospective study.
Author contributions
XC: Methodology, Writing – original draft. LZ: Data curation, Writing – original draft. BC: Validation, Writing – review & editing. JL: Writing – original draft, Writing – review & editing.
Funding
The author(s) declare that no financial support was received for the research and/or publication of this article.
Conflict of interest
The authors declare that the research was conducted in the absence of any commercial or financial relationships that could be construed as a potential conflict of interest.
Publisher’s note
All claims expressed in this article are solely those of the authors and do not necessarily represent those of their affiliated organizations, or those of the publisher, the editors and the reviewers. Any product that may be evaluated in this article, or claim that may be made by its manufacturer, is not guaranteed or endorsed by the publisher.
Supplementary material
The Supplementary Material for this article can be found online at: https://www.frontiersin.org/articles/10.3389/fendo.2025.1486920/full#supplementary-material.
References
1. Hegedüs L. Clinical practice. The thyroid nodule. N Engl J Med. (2004) 351:1764–71. doi: 10.1056/NEJMcp031436, PMID: 15496625
2. Guth S, Theune U, Aberle J, Galach A, and Bamberger CM. Very high prevalence of thyroid nodules detected by high frequency (13 MHz) ultrasound examination. Eur J Clin Invest. (2009) 39:699–706. doi: 10.1111/j.1365-2362.2009.02162.x, PMID: 19601965
3. Singh Ospina N, Iñiguez-Ariza NM, and Castro MR. Thyroid nodules: diagnostic evaluation based on thyroid cancer risk assessment. BMJ. (2020) 368:l6670. doi: 10.1136/bmj.l6670, PMID: 31911452
4. Trimboli P and Giovanella L. Reliability of core needle biopsy as a second-line procedure in thyroid nodules with an indeterminate fine-needle aspiration report: a systematic review and meta-analysis. Ultrasonography. (2018) 37:121–8. doi: 10.14366/usg.17066, PMID: 29427991
5. Tessler FN, Middleton WD, and Grant EG. Thyroid imaging reporting and data system (TI-RADS): A user’s guide. Radiology. (2018) 287:29–36. doi: 10.1148/radiol.2017171240, PMID: 29558300
6. Tessler FN, Middleton WD, Grant EG, Hoang JK, Berland LL, Teefey SA, et al. ACR thyroid imaging, reporting and data system (TI-RADS): white paper of the ACR TI-RADS committee. J Am Coll Radiol. (2017) 14:587–95. doi: 10.1016/j.jacr.2017.01.046, PMID: 28372962
7. Hoang JK, Middleton WD, Farjat AE, Langer JE, Reading CC, Teefey SA, et al. Reduction in thyroid nodule biopsies and improved accuracy with american college of radiology thyroid imaging reporting and data system. Radiology. (2018) 287:185–93. doi: 10.1148/radiol.2018172572, PMID: 29498593
8. Ha EJ, Na DG, Baek JH, Sung JY, Kim JH, Kang SY, et al. US fine-needle aspiration biopsy for thyroid Malignancy: diagnostic performance of seven society guidelines applied to 2000 thyroid nodules. Radiology. (2018) 287:893–900. doi: 10.1148/radiol.2018171074, PMID: 29465333
9. Wildman-Tobriner B, Buda M, Hoang JK, Middleton WD, Thayer D, Short RG, et al. Using artificial intelligence to revise ACR TI-RADS risk stratification of thyroid nodules: diagnostic accuracy and utility. Radiology. (2019) 292:112–9. doi: 10.1148/radiol.2019182128, PMID: 31112088
10. Wettasinghe MC, Rosairo S, Ratnatunga N, and Wickramasinghe ND. Diagnostic accuracy of ultrasound characteristics in the identification of Malignant thyroid nodules. BMC Res Notes. (2019) 12:193. doi: 10.1186/s13104-019-4235-y, PMID: 30940214
11. Gillies RJ, Kinahan PE, and Hricak H. Radiomics: images are more than pictures, they are data. Radiology. (2016) 278:563–77. doi: 10.1148/radiol.2015151169, PMID: 26579733
12. Lambin P, Rios-Velazquez E, Leijenaar R, Carvalho S, van Stiphout RG, Granton P, et al. Radiomics: extracting more information from medical images using advanced feature analysis. Eur J Cancer. (2012) 48:441–6. doi: 10.1016/j.ejca.2011.11.036, PMID: 22257792
13. Erdim C, Yardimci AH, Bektas CT, Kocak B, Koca SB, Demir H, et al. Prediction of benign and Malignant solid renal masses: machine learning-based CT texture analysis. Acad Radiol. (2020) 27:1422–9. doi: 10.1016/j.acra.2019.12.015, PMID: 32014404
14. Uthoff J, Nagpal P, Sanchez R, Gross TJ, Lee C, Sieren JC, et al. Differentiation of non-small cell lung cancer and histoplasmosis pulmonary nodules: insights from radiomics model performance compared with clinician observers. Transl Lung Cancer Res. (2019) 8:979–88. doi: 10.21037/tlcr.2019.12.19, PMID: 32010576
15. Zhao CK, Ren TT, Yin YF, Yin YF, Shi H, Wang HX, et al. A comparative analysis of two machine learning-based diagnostic patterns with thyroid imaging reporting and data system for thyroid nodules: diagnostic performance and unnecessary biopsy rate. Thyroid. (2021) 31:470–81. doi: 10.1089/thy.2020.0305, PMID: 32781915
16. Zhang YJ, Xue T, Liu C, Hao YH, Yan XH, Liu LP, et al. Radiomics combined with ACR TI-RADS for thyroid nodules: diagnostic performance, unnecessary biopsy rate, and nomogram construction. Acad Radiol. (2024) 31:4856–65. doi: 10.1016/j.acra.2024.07.053, PMID: 39366806
17. Kocak B, Baessler B, Bakas S, Cuocolo R, Fedorov A, Maier-Hein L, et al. CheckList for EvaluAtion of Radiomics research (CLEAR): a step-by-step reporting guideline for authors and reviewers endorsed by ESR and EuSoMII. Insights into Imaging. (2023) 14:75. doi: 10.1186/s13244-023-01415-8, PMID: 37142815
18. Grant EG, Tessler FN, Hoang JK, Langer JE, Beland MD, Berland LL, et al. Thyroid ultrasound reporting lexicon: white paper of the ACR thyroid imaging, reporting and data system (TIRADS) committee. J Am Coll Radiol. (2015) 12:1272–9. doi: 10.1016/j.jacr.2015.07.011, PMID: 26419308
19. Götzberger M. Konventioneller Ultraschall, Sonoelastografie und Acoustic Radiation Force Impulse Imaging zur Prädiktion von Malignität in Schilddrüsenknoten [Conventional US, US elasticity imaging and acoustic radiation force impulse imaging for prediction of Malignancy in thyroid nodules. Z Gastroenterol. (2014) 52:1347–8. doi: 10.1055/s-0034-1366780, PMID: 25390217
20. Maia FF, Matos PS, Silva BP, Pallone AT, Pavin EJ, Vassallo J, et al. Role of ultrasound, clinical and scintigraphyc parameters to predict Malignancy in thyroid nodule. Head Neck Oncol. (2011) 3:17. doi: 10.1186/1758-3284-3-17, PMID: 21426548
21. Xia J, Chen H, Li Q, Zhou M, Chen L, Cai Z, et al. Ultrasound-based differentiation of Malignant and benign thyroid Nodules: An extreme learning machine approach. Comput Methods Programs Biomed. (2017) 147:37–49. doi: 10.1016/j.cmpb.2017.06.005, PMID: 28734529
22. Liang J, Huang X, Hu H, Liu Y, Zhou Q, Cao Q, et al. Predicting Malignancy in thyroid nodules: radiomics Score versus 2017 american college of radiology thyroid imaging, reporting and data system. Thyroid. (2018) 28:1024–33. doi: 10.1089/thy.2017.0525, PMID: 29897018
23. Park VY, Lee E, Lee HS, Kim HJ, Yoon J, Son J, et al. Combining radiomics with ultrasound-based risk stratification systems for thyroid nodules: an approach for improving performance. Eur Radiol. (2021) 31:2405–13. doi: 10.1007/s00330-020-07365-9, PMID: 33034748
24. Ren JY, Lin J, Lv WZ, Zhang XY, Li XQ, Xu T, et al. A comparative study of two radiomics-based blood flow modes with thyroid imaging reporting and data system in predicting Malignancy of thyroid nodules and reducing unnecessary fine-needle aspiration rate. Acad Radiol. (2024) 31:2739–52. doi: 10.1016/j.acra.2024.02.007, PMID: 38453602
25. Ren JY, Lv WZ, Wang L, Zhang W, Ma YY, Huang YZ, et al. Dual-modal radiomics nomogram based on contrast-enhanced ultrasound to improve differential diagnostic accuracy and reduce unnecessary biopsy rate in ACR TI-RADS 4–5 thyroid nodules. Cancer Imaging. (2024) 24:17. doi: 10.1186/s40644-024-00661-3, PMID: 38263209
Keywords: radiomics, ACR TI-RADS, thyroid nodules, nomogram, prediction
Citation: Chen X, Zhang L, Chen B and Lu J (2025) Building radiomics models based on ACR TI-RADS combining clinical features for discriminating benign and malignant thyroid nodules. Front. Endocrinol. 16:1486920. doi: 10.3389/fendo.2025.1486920
Received: 27 August 2024; Accepted: 03 July 2025;
Published: 21 July 2025.
Edited by:
Serena Monti, National Research Council (CNR), ItalyReviewed by:
Jiayu Ren, Seventh Medical Center of Chinese People’s Liberation Army General Hospital, ChinaShahram Taeb, Gilan University of Medical Sciences, Iran
Copyright © 2025 Chen, Zhang, Chen and Lu. This is an open-access article distributed under the terms of the Creative Commons Attribution License (CC BY). The use, distribution or reproduction in other forums is permitted, provided the original author(s) and the copyright owner(s) are credited and that the original publication in this journal is cited, in accordance with accepted academic practice. No use, distribution or reproduction is permitted which does not comply with these terms.
*Correspondence: Jiajia Lu, bHVqaWFqaWExMTg4QDE2My5jb20=