 Xia Wang
 Mei Zhang
 Zhi Liu1
 Chuan Li
 He He
He He- 1Department of Laboratory Medicine, West China Hospital, Sichuan University, Chengdu, China
- 2Department of Thoracic Surgery, West China Hospital, Sichuan University, Chengdu, China
- 3Department of Nuclear Medicine, Sichuan Provincial People’s Hospital, School of Medicine, University of Electronic Science and Technology of China, Chengdu, China
- 4Department of Endocrinology and Metabolism, Laboratory of Endocrinology and Metabolism, Rare Disease Center, West China Hospital, Sichuan University, Chengdu, China
Objectives: Variability in biomarkers is crucial for clinical decision-making in individuals with type 2 diabetes mellitus (T2DM). The biological variation (BV) of biomarkers associated with thyroid function, iron metabolism, and bone metabolism may show population-specific differences. This study aims to evaluate the biological variation of sixteen biomarkers in T2DM patients and compare these with variations observed in a healthy population.
Methods: Twenty-four T2DM patients, aged 43 to 67 and in stable condition, were enrolled. Blood samples were collected biweekly for three months. Analysis of variance models were used to assess the BV, including within-subject BV (CVI), between-subject BV (CVG), analytical variation, reference change value (RCV), index of individuality (II), the number of samples required for steady-state set points (NHSP), and analytical performance specifications for all biomarkers.
Results: Females exhibited lower CVI estimates for thyroid-stimulating hormone, parathyroid hormone, and phosphate compared to males. No significant differences in CVI estimates were observed between T2DM patients and healthy individuals across the study. However, the CVG estimates for cortisol and iron were significantly lower in T2DM patients compared to the healthy individuals.
Conclusions: BV data is critical for the precise interpretation of serial biomarker level changes in T2DM patients. It is deemed reasonable to use RCVs for four bone metabolism markers and five thyroid biomarkers, derived from a healthy population, as a reference for monitoring T2DM patients.
Introduction
Type 2 Diabetes mellitus (T2DM) is a prevalent health issue that has significantly grown over the past few decades, becoming a significant challenge to public health worldwide (1). There are strong associations between diabetes mellitus and numerous concurrent health issues, such as osteoporosis, thyroid dysfunction, and abnormalities in iron metabolism (2–4). Biomarkers can be used for diagnosis, risk stratification, and management of complications in patients with T2DM. Therefore, it is important to accurately interpret variations in these biomarker results, which are influenced by biological variation (BV) (5, 6).
Biomarker variation refers to the fluctuation of an analyte around a homeostatic set point (HSP) and encompasses both individual and analytical variations (7). While improvements in analytical techniques and testing processes can reduce analytical variation, individual variability is likely influenced by specific populations and may differ across various epidemiological studies (8). Most studies on BV focus on healthy populations, with few examining individuals with T2DM. Previous studies have explored BV in conditions such as kidney transplantation, chronic liver disease, and heart failure (6, 9, 10), revealing that BV data from healthy individuals often differs from those in unhealthy populations. Consequently, our study aims to investigate the BV of an expanded set of biomarkers in patients with T2DM.
Biomarkers for thyroid function are essential in diagnosing and managing thyroid-related disorders. T2DM can lead to a decrease in thyroid-stimulating hormone (TSH) levels and impair the transformation of thyroxine (T4) to triiodothyronine (T3) in the peripheral tissues (11). There are individual variations in thyroid hormones related to factors such as age, circadian rhythms, and hypothyroidism (12–14), but there are no data on BV in patients with T2DM. Similarly, patients with T2DM frequently experience disturbances in bone and mineral metabolism (15). Common measurands of bone metabolism include calcium (Ca), phosphate (PHOS) and parathyroid hormone (PTH), and 25-hydroxyvitamin D [25(OH)D]. Moreover, high iron is a risk factor for T2DM (16), and biomarkers are used to assess iron homeostasis. We included four common metrics, serum iron, transferrin saturation (TSAT), unsaturated iron-binding capacity (UIBC), and total iron-binding capacity (TIBC), and the variability of these metrics in patients with T2DM was not known previously.
We analysed BV data for sixteen serum/plasma biomarkers, including four related to bone metabolism, four to iron metabolism, five thyroid biomarkers, and three additional hormones in patients with T2DM. These data were used to determine the reference change value (RCV), the number of samples needed for steady-state set point (NHSP), and the analytical performance specifications (APS). Ultimately, we compared these results with previously published data from healthy populations.
Materials and methods
Participants and samples
Patients with T2DM were enrolled in the study following an eligibility assessment based on specific inclusion and exclusion criteria. The inclusion criteria were as follows: First, male and female participants aged 18 to 70 were eligible; secondly, participants diagnosed with T2DM without complications for at least three months, according to the American Diabetes Association guidelines published in 2015; thirdly, participants needed to have been on a stable diabetes medication regimen for at least 3 months prior to enrolment; fourthly, participants had to be capable of understanding the study requirements and providing written informed consent. The exclusion criteria included: firstly, individuals treated with insulin, vitamin D supplements, or medications that affect thyroid function; secondly, participants with severe, uncontrolled comorbid conditions within the last three months; thirdly, participants with severe psychological disorders that may interfere with their ability to comply with study procedures; and fourthly, women who were pregnant, breastfeeding, or planning to become pregnant during the study period. This study received approval from the Institutional Ethical Review Board of the West China Hospital of Sichuan University (No. 20201079). Each participant voluntarily signed an informed consent form after being informed about the content and purpose of the study.
Fasting venous blood samples were collected (BD Vacutainer®, New Jersey, USA) biweekly between 8:30 a.m. and 9:30 a.m., a total of six times. Plasma tubes were centrifuged within 45 min at 3000 g for 10 min at 4°C, while serum tubes were centrifuged at 22°C. Serum and plasma were then stored at −80°C until analysis.
Analytical methods
Quantitative determination of serum TSH, T3, free triiodothyronine (FT3), T4, free thyroxine (FT4), cortisol (CORT), insulin (INS), C-peptide (C-P), plasma intact PTH, and 25(OH)D was performed using the Roche Cobas e601 (Roche, Basle, Switzerland) with immunoassay electrochemiluminescence reagents and calibrators. The assays for TSH, T3, T4, and CORT were conducted utilising first-generation reagents, whereas FT3 and FT4 assays used third-generation reagents. INS, C-P, and intact PTH tests employed second-generation reagents. Serum PHOS, iron, Ca, and UIBC were analysed using Roche Cobas 8000 (Roche, Basle, Switzerland). Total iron-binding capacity (TIBC) is calculated as the sum of Serum Iron and UIBC, and TSAT is determined by the ratio of serum iron to TIBC. All samples were measured in duplicate in a single run.
Data analysis
To obtain analytical variation (CVA) and within-subject biological variation (CVI) estimates, data were analysed using standard ANOVA or CV-ANOVA. The CV-ANOVA method is based on the CV transformation, which normalises the data for each individual by dividing by the mean value of each individual (17). The CVG estimates were calculated by a standard nested ANOVA after identifying outliers between subjects with Reed’s criterion and the Dixon-q test2 (18). Outliers from replicates and within-subject were excluded using the Bartlett test and the Cochran test. The Shapiro-Wilk test was used to analyse data normality, and log-transformation was applied to non-normally distributed data. The steady state of subjects was assessed by linear regression of six pooled mean group sample concentrations for each biomarker (19). Subjects were considered to be in a steady state when the 95% confidence interval (CI) of the regression line’s slope included zero. Mean values and BV estimates were calculated for the entire study population and separately for women and men. The 95% CI for BV estimates was calculated using Miller’s formula (20). Differences in mean values and BV estimates between subgroups were considered significant if the 95% CI did not overlap. The CVI and CVG values for the entire study population were applied to APS using the criteria: CV = 0.5CVI; B = 0.25 (CVI2 + CVG2)0.5; total allowable error (TE) = 1.65CV + B. The RCV, index of individuality (II), and the NHSP were calculated for each measurand according to the following formula:
The Z factor was set at 1.96, indicating a two-sided change and a 95% probability. The D values represented deviations of 10%, 15%, and 20% from the true HSP (21).
For normally distributed data with equal variances, use mean ± SD and T-tests. Otherwise, use median and Kruskal-Wallis tests.
Results
Twenty-four patients diagnosed with T2DM (11 men and 13 women), aged 43–69 years, were included in this study. We collected the medical and medication histories of each participant, including metformin, glimepiride, miglitol, gliclazide, and acarbose. All participants were non-smokers and non-alcohol drinkers. Of the 24 participants, 20 completed all six collections, and four completed four collections; the mean number of blood samples per participant was 5.7. Baseline characteristics and the concentrations of sixteen biomarkers for all participants, as well as for the men and women subgroups, are summarised in Table 1. All subjects showed no systematic changes in the concentrations of these biomarkers during the follow-up, as confirmed by linear regression (Supplementary Table S1). Reference intervals for each measurand are summarised in Supplementary Table S1, and all measurements fell within these defined ranges. Details about the outliers are provided in Supplementary Table S2. The median and 95% CI of eight hormones for each individual, grouped by sex, are shown in Supplementary Figure S1. The remaining eight measurements (including four for bone metabolism and four for iron metabolism biomarkers) are shown in Supplementary Figure S2.
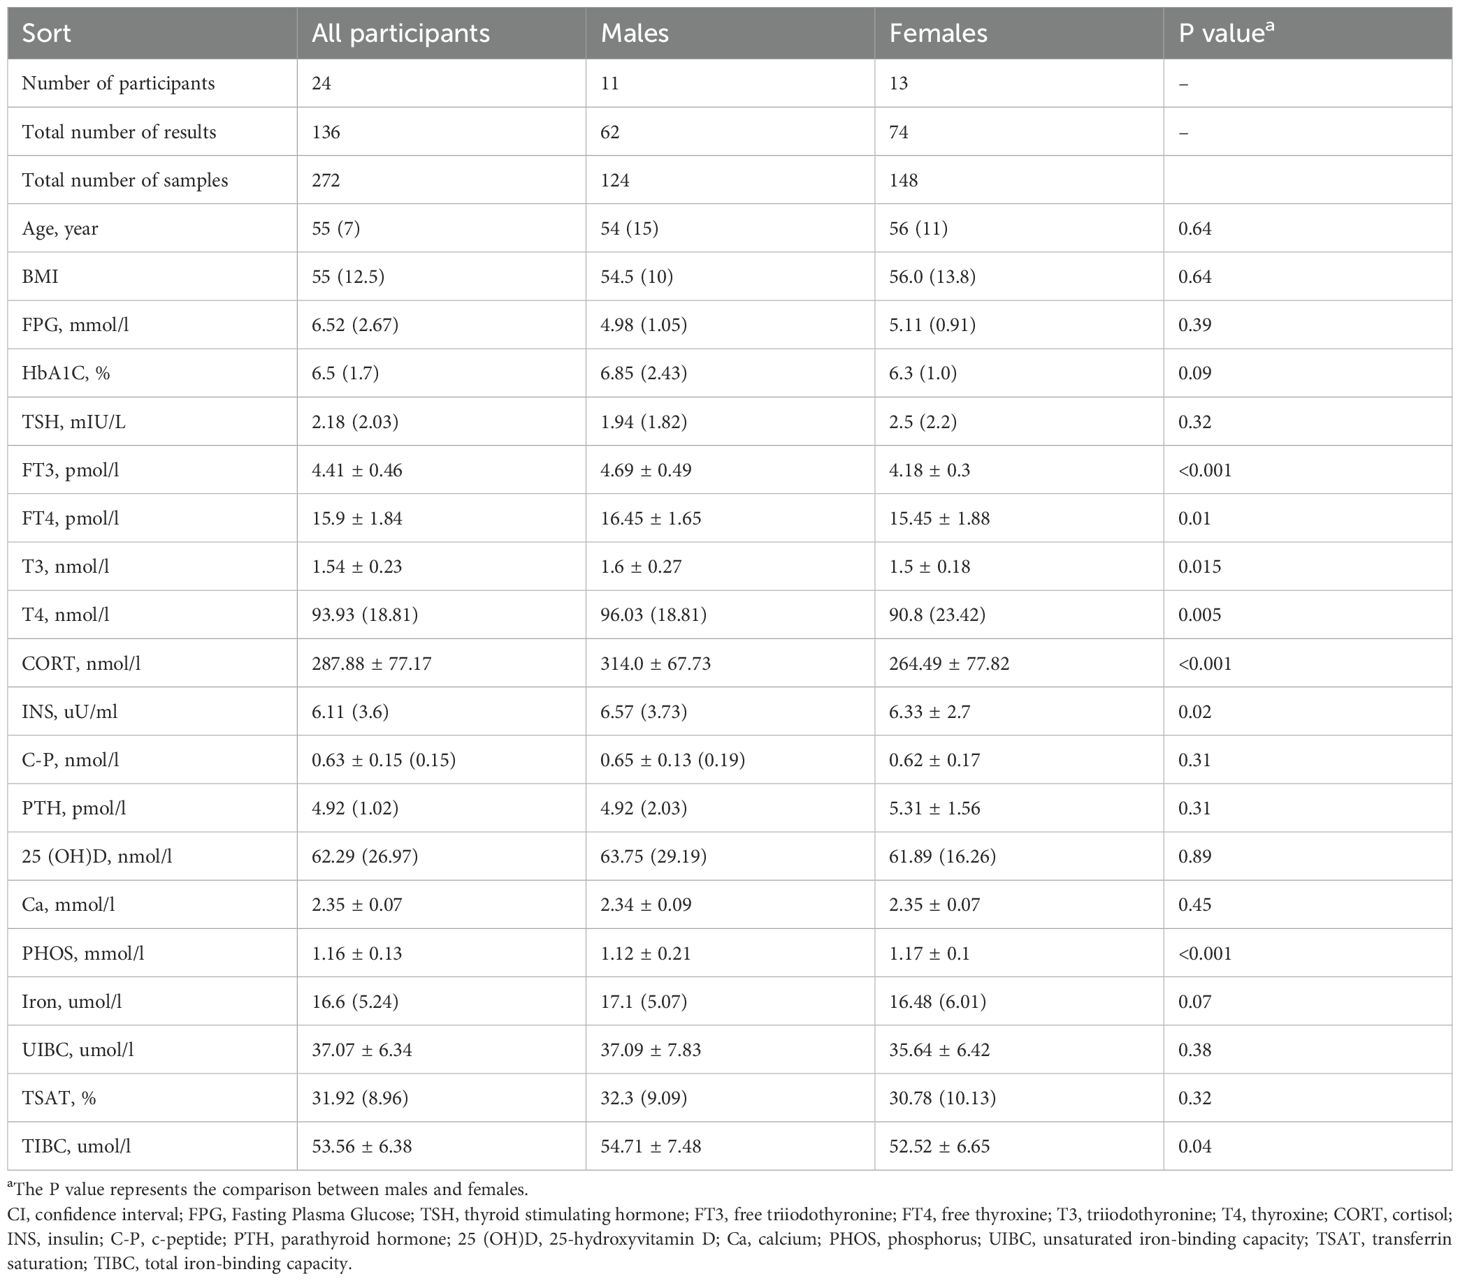
Table 1. Baseline characteristics and concentrations of sixteen biomarkers for patients with T2DM, grouped by sex.
No statistically significant differences were observed in the concentrations of TSH, C-P, PTH, 25(OH)D, Ca, iron, UIBC, and TSAT between genders. However, significant intersexual disparities were identified in the levels of FT3, FT4, T3, T4, CORT, INS, and TIBC, with males exhibiting markedly higher levels than those exhibited by females (P < 0.05). The only exception was the mean serum concentration of PHOS, which was significantly elevated in women compared to men (P < 0.05).
The results for CVA, CVI, and CVG, along with their 95% CIs, for sixteen biomarkers are displayed in Table 2. The BV components of CVI and CVG based on healthy populations from the European Federation of Clinical Chemistry and Laboratory Medicine Biological Variation Database (EFLM BVD) are also presented (22). The reliability of the CVI estimates was confirmed by SDA/SDI ratios, according to the recommendations of Røraas et al. (23), with all biomarkers demonstrating ratios below the threshold of 1.0. According to the 95% CI, CVI estimates for TSH, PTH, and PHOS calculated for females were lower than those derived for males. For the entire study population, CORT and iron CVG estimates were significantly lower than those reported by the EFLM BVD, whereas the overall CVI estimates were similar between patients with T2DM and healthy individuals.
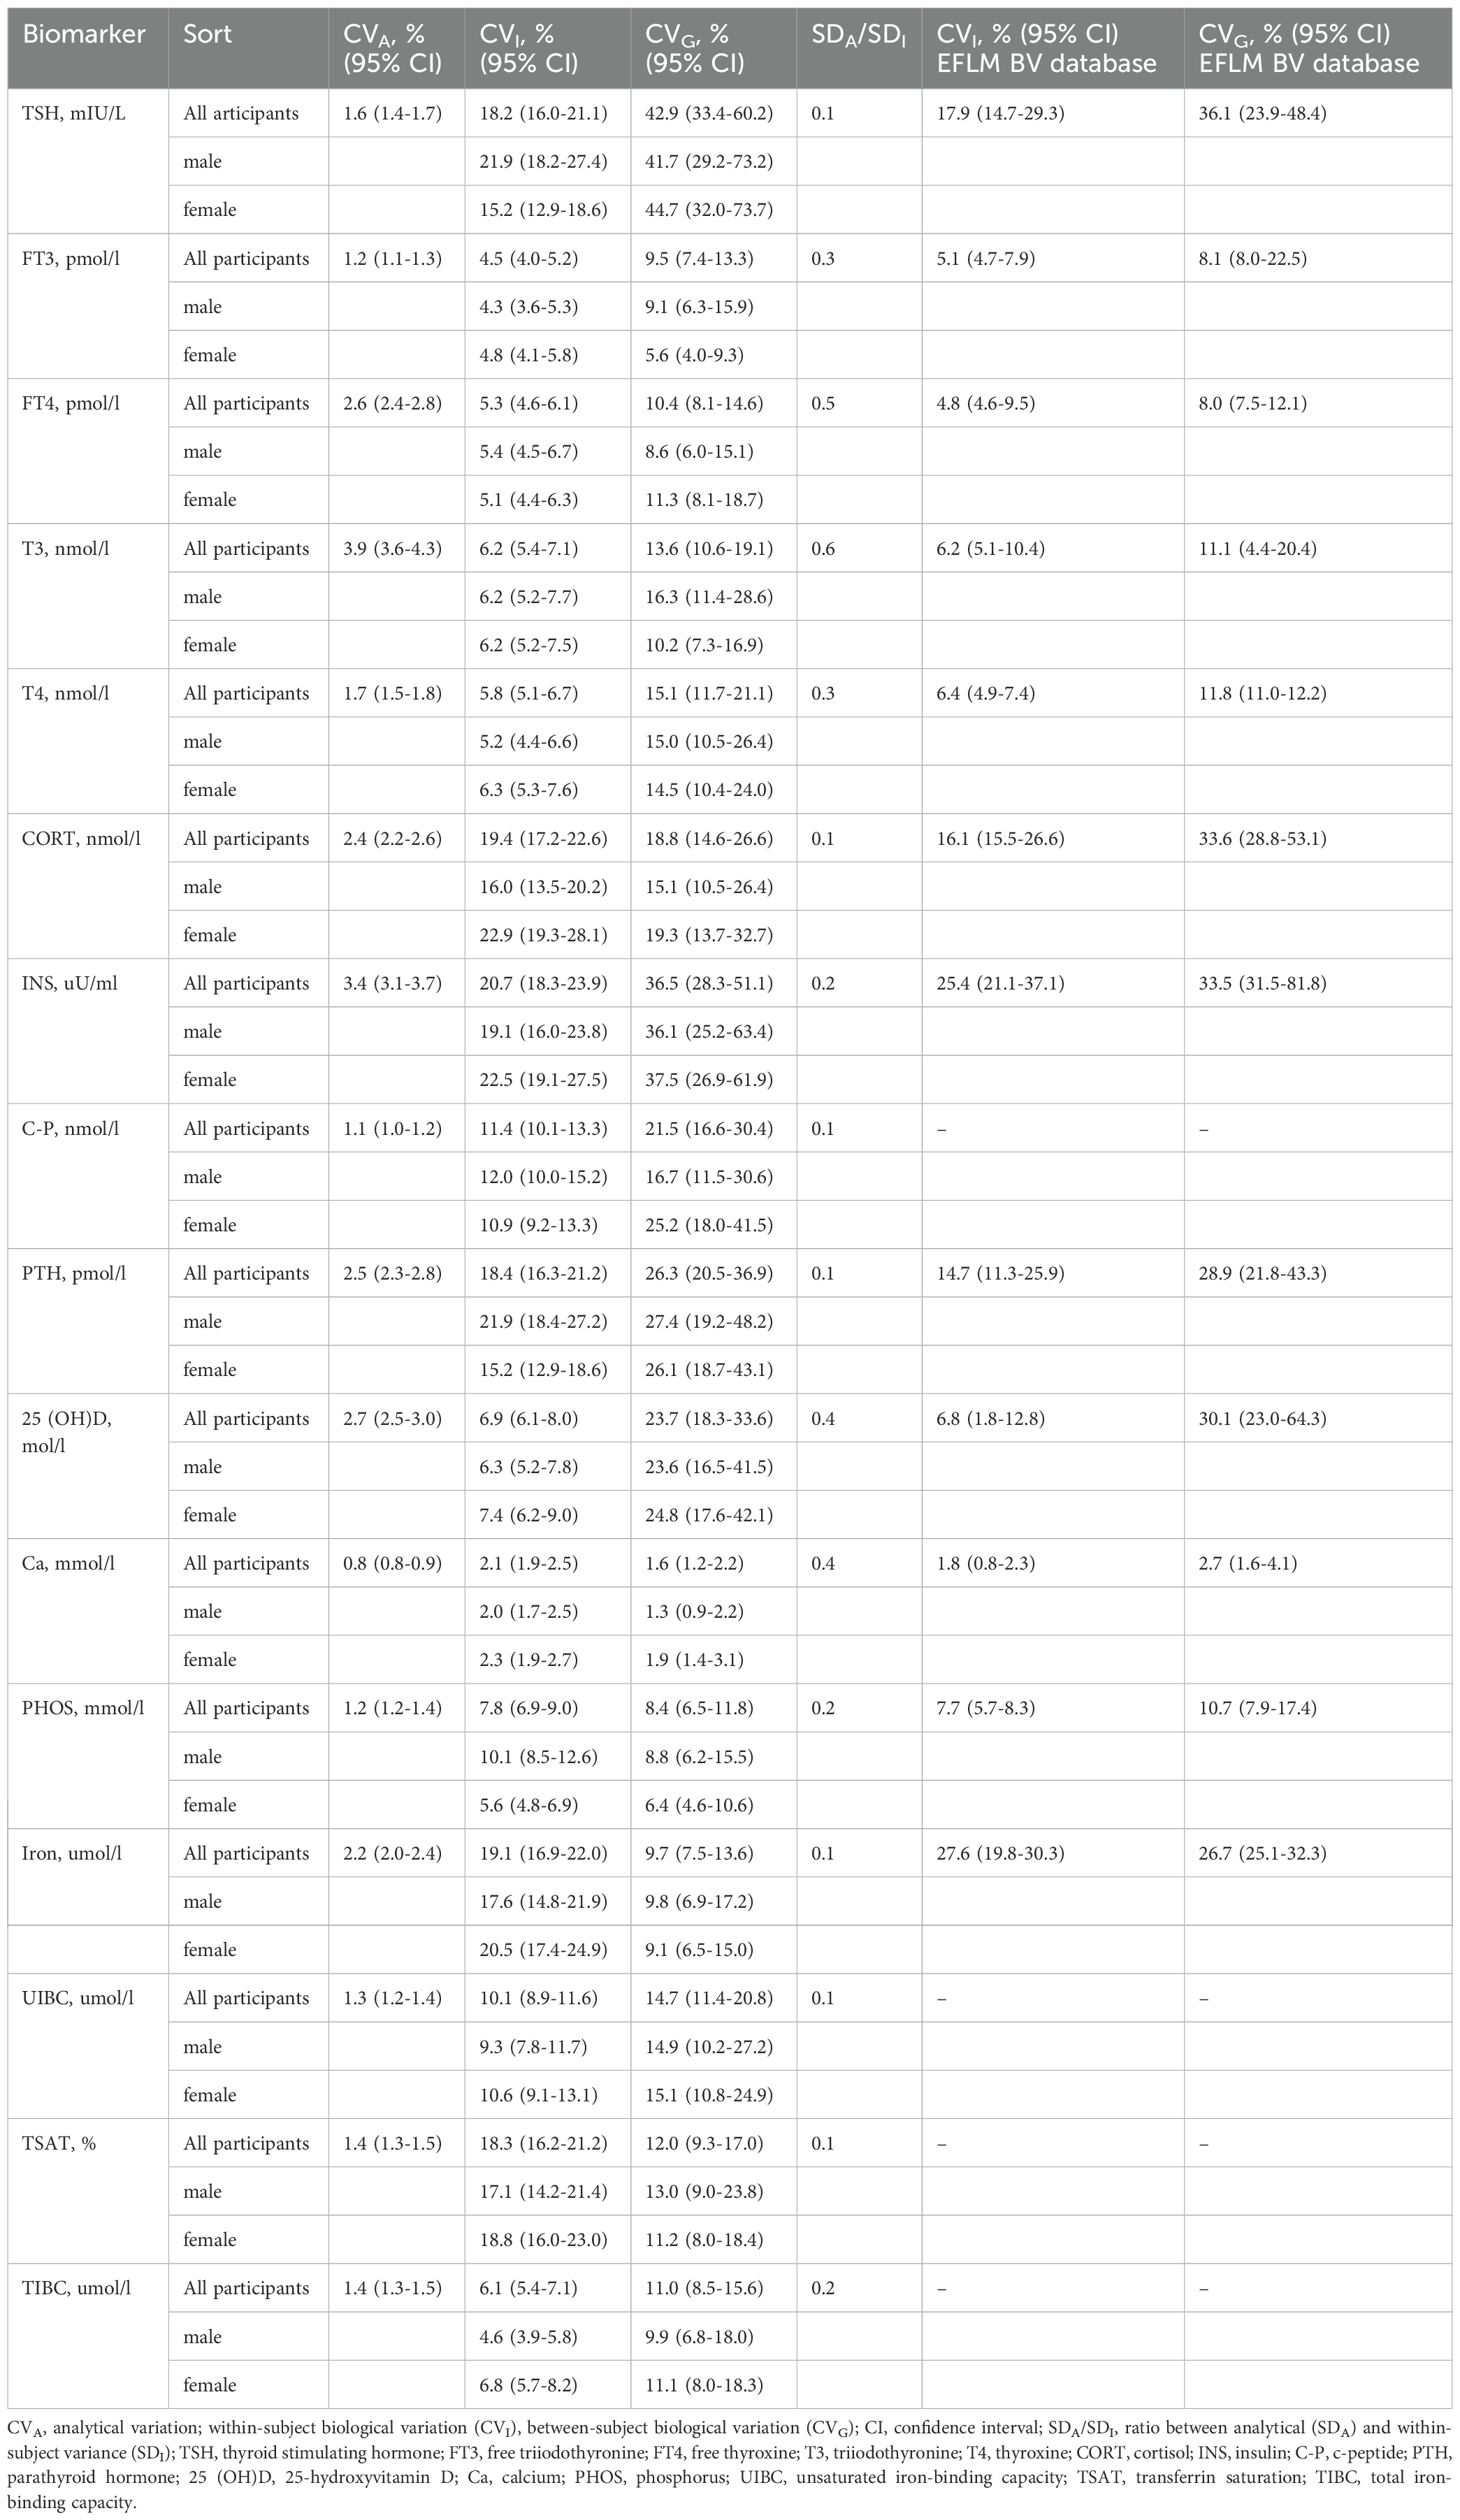
Table 2. Biological variation estimates of CVA, CVI, and CVG, with 95% CIs, for sixteen biomarkers and compared against the EFLM BV database.
Table 3 presents the RCV, II, and NHSP values for each biomarker. The APS were derived from the CVI and CVG of sixteen measurands for all participants. For INS, the NHSP could be estimated with 95% probability using eight samples if the D values were set at 15%. The II values for five thyroid hormones, INS, C-P, 25(OH)D, and TIBC, were <0.6, whereas the II estimates for iron, TSAT, and Ca were >1.4.
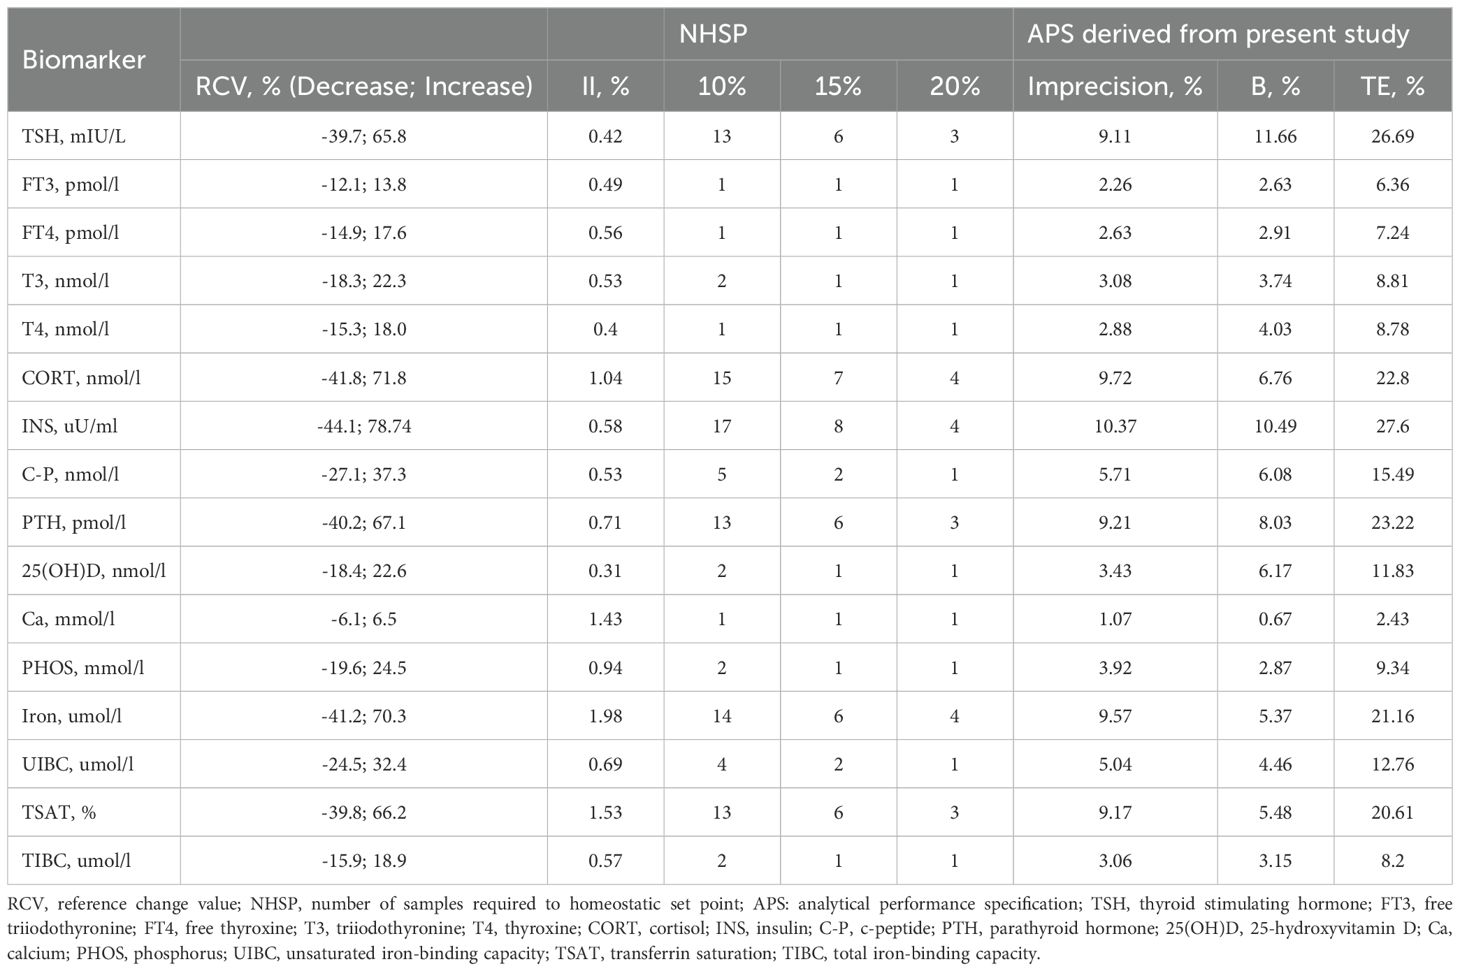
Table 3. Analytical performance specification and NHSP for sixteen biomarkers based on biological variation estimates.
Discussion
Currently, BV data from healthy individuals are widely used in clinical settings for many common measurands. To ensure the reliability of these data, the EFLM Biovariation Working Group published the BV Critical Appraisal Checklist (BIVAC) (24). According to the study criteria for BV data, this study provides the first-ever BV estimates and RCV for sixteen biomarkers in patients with T2DM, assessing whether differences between measurements and HSP are clinically relevant.
Thyroid hormones are crucial endocrine regulators influenced by multiple factors, including genetics, environment, disease status, and circadian rhythm (25). To date, BV studies on thyroid hormones have predominantly focused on healthy populations, with only a few examining patients with hypothyroidism or pregnant women (26, 27). Moreover, the sampling interval must be considered when studying BV in thyroid hormone (28). There are long-term BV studies of thyroid hormones and short-term BV studies that lasted one year and 24 h, respectively (14, 29). In this study, the CVI and CVG estimates for TSH, FT3, and FT4 in patients with T2DM are similar to those reported in the European Biological Variation Study, which is also a mid-term study (30). Meanwhile, patients with T2DM exhibited comparable CVI, CVG, and RCV estimates to those from another study focusing on the elderly population (31). In clinical practice, using the TSH RCV estimates (65.8%) from this study, an individual’s serum TSH concentration, initially measured at 2.0 mIU/L, could naturally rise to 3.3 mIU/L without any pathological cause, ascribed to the combined effects of biological and analytical variability. All five analytes used to assess thyroid function showed low II values (<0.6), indicating high individuality; similar findings were reported in a meta-analysis of BV in thyroid-related measures (32).
As another important endocrine hormone, CORT exhibits a more pronounced circadian rhythm than that of thyroid hormones and is affected by multiple factors, including season, disease, and sex (33). Compared to the EuBIVAS BV estimates for morning serum CORT in healthy populations, patients with T2DM showed higher CVI. However, similar CVG values were observed in subgroups of men and women older than 50 years (34). Unlike other measurands, INS and C-P are integral to the pathology of T2DM patients, where insufficient INS secretion or INS resistance can lead to the development of the disease. Unfortunately, no BV meta-analysis results for C-peptide were available in the EFLM BVD. Dittadi R et al. (35) provided estimates of CVG and CVI for serum C-peptide in healthy individuals, which were higher than those found in this study; however, their data lacked corresponding confidence intervals for both CVG and CVI. The EuBIVAS reported a higher CVI estimate than what was observed in our study (36), a discrepancy that may be attributed to differences in health status among the study populations.
Parathyroid hormone and vitamin D are crucial regulators of Ca and PHOS and are widely used in diagnosing and treating bone metabolism disorders (37). This study analysed total 25(OH)D and intact PTH levels in plasma. Total 25(OH)D primarily comprises 25-hydroxyvitamin D3 [25(OH)D3], with its active form being 1,25-hydroxyvitamin D [1,25(OH)2D]. The plasma concentration of 25(OH)D varied up to 6–7 times among participants and was affected by factors such as diet, season, and genetics, and it does not remain constant over time (38). Consequently, Cavalier E et al. suggested that any APS derived from BV estimates may not be suitable for this parameter (39). However, in this study, the patients were in a stable state, and the CVI and CVG did not exhibit any significant differences compared to those in healthy individuals. The fluctuation in 25(OH)D concentration also affects PTH secretion, thereby influencing calcium and phosphorus homeostasis (38). Similar to 25(OH)D, PTH exists in multiple forms. Second-generation PTH assays measure not only the full-length, biologically active PTH 1–84 but also large C-terminal PTH fragments, which tend to accumulate in patients with chronic kidney disease. Corte Z and Venta R (40) assessed the BV estimates of PTH in haemodialysis patients and healthy individuals using the same analytical method employed in our study. Our CVI estimates for PTH were higher than those reported for healthy subjects in their study, as indicated by the mostly non-overlapping 95% CI of CVI. However, BV estimates for PTH, Ca, and PHOS in this study were consistent with the meta-analysis results reported by EFLM BVD. A high II for Ca, exceeding 1.4, suggests a low degree of individual variation, implying that population-based reference intervals are expected to have good diagnostic sensitivity.
Here, we present the BV estimates for four markers used in the diagnosis of anaemia and iron metabolism. To date, the EFLM BV database includes fifteen studies on BV data for iron assays, with CVI values ranging from 1.3 to 38.4%. This variation is largely attributed to differences in study duration. Iron overload or deficiency can lead to metabolic disorders (41), making it crucial to evaluate BV values for iron metabolic markers in such conditions. Unfortunately, only two studies have reported BV data for TSAT and TIBC. The CVI estimates for TSAT were 25.9% and 38.2% (8, 42), which were higher than the 18.3% observed in patients with T2DM. This indicates a need for more studies to meet clinical requirements for interpreting iron metabolism biomarkers.
Overall, the BV data obtained from patients with T2DM in this study contribute to enriching the BV database, which is still under development. The BV data are essential for accurately interpreting changes in serially detected biomarker levels in patients with T2DM. The index of individuality (> 1.4) for Ca, iron, and TSAT indicates that the reference intervals are likely to exhibit good diagnostic sensitivity. The RCV, derived from BV data, is considered an optimal approach for monitoring patients with chronic conditions (43). Our findings show that BV data for these four bone metabolism analytes and five thyroid biomarkers in T2DM patients are similar to those in healthy individuals. This finding supports the rationale for applying RCVs developed using BV data from healthy individuals to patients with T2DM who are in a stable condition. It is worth noting that CVA in this study was derived from repeated samples. Laboratories should estimate RCVs based on their specific conditions. Furthermore, a more precise analysis of BV is needed, as hormonal analytes are influenced by rhythms and seasons. This study mainly focused on patients over 50 years old, with only three patients between 40 and 50 years of age, highlighting a gap in BV assessment for younger patients. Future research should address these aspects.
Data availability statement
The original contributions presented in the study are included in the article/Supplementary Material. Further inquiries can be directed to the corresponding author/s.
Ethics statement
The studies involving humans were approved by Institutional Ethical Review Board of the West China Hospital of Sichuan University. The studies were conducted in accordance with the local legislation and institutional requirements. The participants provided their written informed consent to participate in this study.
Author contributions
XW: Data curation, Writing – original draft. MZ: Visualization, Writing – review & editing. ZL: Visualization, Writing – review & editing. CL: Writing – review & editing, Funding acquisition. YL: Funding acquisition, Writing – review & editing. HJH: Writing – review & editing, Project administration, Supervision. HH: Project administration, Supervision, Writing – review & editing. XY: Project administration, Supervision, Writing – review & editing.
Funding
The author(s) declare that financial support was received for the research and/or publication of this article. This study was supported by the Department of Science and Technology, Sichuan Province, grant number: 2025ZNSFSC1619, and the National Natural Science Foundation of China, grant number: 82300987.
Acknowledgments
We express our gratitude to the department of Clinical Biochemistry and Laboratory Medicine of West China Hospital of Sichuan University and the blood collection staff for their support and willingness to spend valuable time with us to complete the study.
Conflict of interest
The authors declare that the research was conducted in the absence of any commercial or financial relationships that could be construed as a potential conflict of interest.
Generative AI statement
The author(s) declare that no Generative AI was used in the creation of this manuscript.
Publisher’s note
All claims expressed in this article are solely those of the authors and do not necessarily represent those of their affiliated organizations, or those of the publisher, the editors and the reviewers. Any product that may be evaluated in this article, or claim that may be made by its manufacturer, is not guaranteed or endorsed by the publisher.
Supplementary material
The Supplementary Material for this article can be found online at: https://www.frontiersin.org/articles/10.3389/fendo.2025.1506664/full#supplementary-material
Supplementary Figure 1 | The median values and 95% CIs of thyroid biomarkers, CORT, INS, and C-P for each participant according to sex. CI, confidence interval; TSH, thyroid stimulating hormone; FT3, free triiodothyronine; FT4, free thyroxine; T3, triiodothyronine; T4, thyroxine; CORT, cortisol; INS, insulin; C-P, c-peptide.
Supplementary Figure 2 | The median values and 95% CIs of bone metabolism and iron metabolism biomarkers for each participant according to sex. CI, confidence interval; PTH, parathyroid hormone; 25(OH)D, 25-hydroxyvitamin D; Ca, calcium; PHOS, phosphorus; UIBC, unsaturated iron-binding capacity; TSAT, transferrin saturation; TIBC, total iron-binding capacity.
References
1. Tomic D, Shaw JE, and Magliano DJ. The burden and risks of emerging complications of diabetes mellitus. Nat Rev Endocrinol. (2022) 18:525–39. doi: 10.1038/s41574-022-00690-7
2. Biondi B, Kahaly GJ, and Robertson RP. Thyroid dysfunction and diabetes mellitus: two closely associated disorders. Endocr Rev. (2019) 40:789–824. doi: 10.1210/er.2018-00163
3. Khosla S, Samakkarnthai P, Monroe DG, and Farr JN. Update on the pathogenesis and treatment of skeletal fragility in type 2 diabetes mellitus. Nat Rev Endocrinol. (2021) 17:685–97. doi: 10.1038/s41574-021-00555-5
4. Miao R, Fang X, Zhang Y, Wei J, Zhang Y, and Tian J. Iron metabolism and ferroptosis in type 2 diabetes mellitus and complications: mechanisms and therapeutic opportunities. Cell Death Dis. (2023) 14:186. doi: 10.1038/s41419-023-05708-0
5. Fraser CG and Harris EK. Generation and application of data on biological variation in clinical chemistry. Crit Rev Clin Lab Sci. (1989) 27:409–37. doi: 10.3109/10408368909106595
6. Meijers WC, van der Velde AR, Muller Kobold AC, Dijck-Brouwer J, Wu AH, Jaffe A, et al. Variability of biomarkers in patients with chronic heart failure and healthy controls. Eur J Heart Fail. (2017) 19:357–65. doi: 10.1002/ejhf.669
7. Flatland B, Baral RM, and Freeman KP. Current and emerging concepts in biological and analytical variation applied in clinical practice. J Vet Intern Med. (2020) 34:2691–700. doi: 10.1111/jvim.15929
8. Thyagarajan B, Howard AG, Durazo-Arvizu R, Eckfeldt JH, Gellman MD, Kim RS, et al. Analytical and biological variability in biomarker measurement in the hispanic community health study/study of latinos. Clin Chim Acta. (2016) 463:129–37. doi: 10.1016/j.cca.2016.10.019
9. Trapé J, Botargues JM, Porta F, Ricós C, Badal JM, Salinas R, et al. Reference change value for alpha-fetoprotein and its application in early detection of hepatocellular carcinoma in patients with hepatic disease. Clin Chem. (2003) 49:1209–11. doi: 10.1373/49.7.1209
10. Biosca C, Ricós C, Lauzurica R, and Petersen PH. Biological variation at long-term renal post-transplantation. Clin Chim Acta. (2006) 368:188–91. doi: 10.1016/j.cca.2005.12.018
11. Kalra S, Aggarwal S, and Khandelwal D. Thyroid dysfunction and type 2 diabetes mellitus: screening strategies and implications for management. Diabetes Ther. (2019) 10:2035–44. doi: 10.1007/s13300-019-00700-4
12. Karmisholt J, Andersen S, and Laurberg P. Analytical goals for thyroid function tests when monitoring patients with untreated subclinical hypothyroidism. Scand J Clin Lab Invest. (2010) 70:264–8. doi: 10.3109/00365511003782778
13. Oladipo O, Nenninger DA, Parvin CA, and Dietzen DJ. Intraindividual variability of thyroid function tests in a pediatric population. Clin Chim Acta. (2010) 411:1143–5. doi: 10.1016/j.cca.2010.03.030
14. Zhang Y, He DH, Jiang SN, Wang HL, Xu XH, and Kong LR. Biological Variation of Thyroid Function Biomarkers over 24 hours. Clin Chim Acta. (2021) 523:519–24. doi: 10.1016/j.cca.2021.11.007
15. Sanches CP, Vianna AGD, and Barreto FC. The impact of type 2 diabetes on bone metabolism. Diabetol Metab Syndr. (2017) 9:85. doi: 10.1186/s13098-017-0278-1
16. Harrison AV, Lorenzo FR, and McClain DA. Iron and the pathophysiology of diabetes. Annu Rev Physiol. (2023) 85:339–62. doi: 10.1146/annurev-physiol-022522-102832
17. Røraas T, Støve B, Petersen PH, and Sandberg S. Biological variation: the effect of different distributions on estimated within-person variation and reference change values. Clin Chem. (2016) 62:725–36. doi: 10.1373/clinchem.2015.252296
19. Ceriotti F, Díaz-Garzón Marco J, Fernández-Calle P, Maregnani A, Aarsand AK, Coskun A, et al. The european biological variation study (Eubivas): weekly biological variation of cardiac troponin I estimated by the use of two different high-sensitivity cardiac troponin I assays. Clin Chem Lab Med. (2020) 58:1741–7. doi: 10.1515/cclm-2019-1182
20. Edward Miller G. Asymptotic test statistics for coefficients of variation. Commun Stat - Theory Methods. (1991) 20:3351–63. doi: 10.1080/03610929108830707
21. Young DS. Biological variation: from principles to practice. Callum G. Fraser. Washington, dc: aacc press, 2001, 151 pp., $38.00 ($30.00 aacc members). Isbn 1-890883-49-2. Clin Chem. (2002) 48:395–. doi: 10.1093/clinchem/48.2.395a
22. Aarsand AK, Fernandez-Calle P, Webster C, Coskun A, Gonzales-Lao E, Diaz-Garzon J, et al. The EFLM biological variation database . Available online at: https://biologicalvariation.eu/ (Accessed August 4, 2024).
23. Røraas T, Petersen PH, and Sandberg S. Confidence intervals and power calculations for within-person biological variation: effect of analytical imprecision, number of replicates, number of samples, and number of individuals. Clin Chem. (2012) 58:1306–13. doi: 10.1373/clinchem.2012.187781
24. Aarsand AK, Røraas T, Fernandez-Calle P, Ricos C, Díaz-Garzón J, Jonker N, et al. The biological variation data critical appraisal checklist: A standard for evaluating studies on biological variation. Clin Chem. (2018) 64:501–14. doi: 10.1373/clinchem.2017.281808
25. Gauthier BR, Sola-García A, Cáliz-Molina M, Lorenzo PI, Cobo-Vuilleumier N, Capilla-González V, et al. Thyroid hormones in diabetes, cancer, and aging. Aging Cell. (2020) 19:e13260. doi: 10.1111/acel.13260
26. Browning MC, Bennet WM, Kirkaldy AJ, and Jung RT. Intra-individual variation of thyroxin, triiodothyronine, and thyrotropin in treated hypothyroid patients: implications for monitoring replacement therapy. Clin Chem. (1988) 34:696–9. doi: 10.1093/clinchem/34.4.696
27. Hölzel WG and Deschner W. Intra-individual variation of serum thyroxin and triiodothyronine in pregnancy. Clin Chem. (1988) 34:2063–5. doi: 10.1093/clinchem/34.10.2063
28. Andersen S, Riis J, Karmisholt JS, and Andersen SL. On the importance of sampling interval in studies of biological variation in thyroid function. Clin Chem Lab Med. (2023) 61:e112–e4. doi: 10.1515/cclm-2022-1130
29. Karmisholt J, Andersen S, and Laurberg P. Variation in thyroid function tests in patients with stable untreated subclinical hypothyroidism. Thyroid. (2008) 18:303–8. doi: 10.1089/thy.2007.0241
30. Bottani M, Aarsand AK, Banfi G, Locatelli M, Coşkun A, Díaz-Garzón J, et al. European biological variation study (Eubivas): within- and between-subject biological variation estimates for serum thyroid biomarkers based on weekly samplings from 91 healthy participants. Clin Chem Lab Med. (2022) 60:523–32. doi: 10.1515/cclm-2020-1885
31. Riis J, Westergaard L, Karmisholt J, Andersen SL, and Andersen S. Biological variation in thyroid function tests in older adults and clinical implications. Clin Endocrinol (Oxf). (2023) 99:598–605. doi: 10.1111/cen.14973
32. Fernández-Calle P, Díaz-Garzón J, Bartlett W, Sandberg S, Braga F, Beatriz B, et al. Biological variation estimates of thyroid related measurands - meta-analysis of bivac compliant studies. Clin Chem Lab Med. (2022) 60:483–93. doi: 10.1515/cclm-2021-0904
33. Gamble KL, Berry R, Frank SJ, and Young ME. Circadian clock control of endocrine factors. Nat Rev Endocrinol. (2014) 10:466–75. doi: 10.1038/nrendo.2014.78
34. Carobene A, Guerra E, Marqués-García F, Boned B, Locatelli M, Coşkun A, et al. Biological variation of morning serum cortisol: updated estimates from the european biological variation study (Eubivas) and meta-analysis. Clin Chim Acta. (2020) 509:268–72. doi: 10.1016/j.cca.2020.06.038
35. Dittadi R, Gelisio P, Rossi L, Frigato F, and Gion M. Biological variability evaluation and comparison of three different methods for C-peptide measurement. Clin Chem Lab Med. (2008) 46:1480–2. doi: 10.1515/cclm.2008.285
36. Carobene A, Lao EG, Simon M, Locatelli M, Coşkun A, Díaz-Garzón J, et al. Biological variation of serum insulin: updated estimates from the european biological variation study (Eubivas) and meta-analysis. Clin Chem Lab Med. (2022) 60:518–22. doi: 10.1515/cclm-2020-1490
37. Tebben PJ, Singh RJ, and Kumar R. Vitamin D-mediated hypercalcemia: mechanisms, diagnosis, and treatment. Endocr Rev. (2016) 37:521–47. doi: 10.1210/er.2016-1070
38. Krall EA, Sahyoun N, Tannenbaum S, Dallal GE, and Dawson-Hughes B. Effect of vitamin D intake on seasonal variations in parathyroid hormone secretion in postmenopausal women. N Engl J Med. (1989) 321:1777–83. doi: 10.1056/nejm198912283212602
39. Cavalier E, Fraser CG, Bhattoa HP, Heijboer AC, Makris K, Ulmer CZ, et al. Analytical performance specifications for 25-hydroxyvitamin D examinations. Nutrients. (2021) 13(2):431. doi: 10.3390/nu13020431
40. Corte Z and Venta R. Biological variation of metabolic cardiovascular risk factors in haemodialysis patients and healthy individuals. Ann Transl Med. (2020) 8:281. doi: 10.21037/atm.2020.03.26
41. Galy B, Conrad M, and Muckenthaler M. Mechanisms controlling cellular and systemic iron homeostasis. Nat Rev Mol Cell Biol. (2024) 25:133–55. doi: 10.1038/s41580-023-00648-1
42. Van Wyck DB, Alcorn H Jr., and Gupta R. Analytical and biological variation in measures of anemia and iron status in patients treated with maintenance hemodialysis. Am J Kidney Dis. (2010) 56:540–6. doi: 10.1053/j.ajkd.2010.05.009
Keywords: biological variation, type 2 diabetes mellitus, thyroid, iron, biomarker
Citation: Wang X, Zhang M, Liu Z, Li C, Li Y, Huang H, He H and Yu X (2025) Biological variation in serum thyroid, iron metabolism, and plasma bone metabolism biomarkers in patients with type 2 diabetes mellitus. Front. Endocrinol. 16:1506664. doi: 10.3389/fendo.2025.1506664
Received: 08 October 2024; Accepted: 29 April 2025;
Published: 20 May 2025.
Edited by:
Åke Sjöholm, Gävle Hospital, SwedenReviewed by:
Grzegorz K. Jakubiak, Medical University of Silesia, PolandDeniz Gezer, Mersin City Hospital, Türkiye
Copyright © 2025 Wang, Zhang, Liu, Li, Li, Huang, He and Yu. This is an open-access article distributed under the terms of the Creative Commons Attribution License (CC BY). The use, distribution or reproduction in other forums is permitted, provided the original author(s) and the copyright owner(s) are credited and that the original publication in this journal is cited, in accordance with accepted academic practice. No use, distribution or reproduction is permitted which does not comply with these terms.
*Correspondence: Xijie Yu, eGlqaWV5dUBzY3UuZWR1LmNu; He He, aGVoZUB3Y2hzY3UuY24=