 Yanjuan Chen1†Weiqiang Wu2†Zefeng Cai2†Kuangyi Wu2Huancong Zheng2Peng Fu2
 Yuxian Wang2
 Xianxuan Wang3
 Yulong Lan2
 Shuohua Chen4
 Shouling Wu4*
 Youren Chen2*
- 1Department of Endocrinology, Second Affiliated Hospital of Shantou University Medical College, Shantou, China
- 2Department of Cardiology, Second Affiliated Hospital of Shantou University Medical College, Shantou, China
- 3Department of Physiology, Temerty Faculty of Medicine, University of Toronto, Toronto, ON, Canada
- 4Department of Cardiology, Kailuan General Hospital, Tangshan, China
Background: Metabolically healthy obese (MHO) individuals meet the criteria for obesity with normal blood glucose and lipid metabolism parameters, absence of hypertension, and no concurrent cardiovascular diseases. However, the association between the triglyceride-glucose (TyG) index and the risk of cardiometabolic disease (CMD) in MHO individuals remains unclear.
Methods and results: This study included obese individuals who underwent health examinations at Kailuan Group from 2006 to 2010, whom without a history of hypertension, diabetes, hyperlipidemia, cardiovascular disease, as the study participants. A total of 4750 participants were included in this study. The TyG index was calculated as ln[TG (mg/dL) × FPG (mg/dL)/2] and divided into four groups based on quartiles: Q1 group (<8.18); Q2 group (8.18-8.41); Q3 group (8.42-8.62); Q4 group (≥8.63). The Cox proportional hazards model was used to assess the relationship between the TyG index and risk of CMD incidence. During a median follow-up period of 11 (IQR 10.3, 11.2) years, 826 participants experienced CMD, among whom 131 participants developed coronary heart disease, 215 participants developed stroke, and 542 participants developed diabetes. After adjusting for multiple confounding factors, compared with the Q1 group, the adjusted HRs (95% CI) for CMD in the Q2-Q4 groups were 1.33 (1.03, 1.65), 1.37 (1.04, 1.82), and 2.04 (1.56, 2.68) (P<0.0001). A similar trend was found in the subtypes of CMD in coronary heart disease, stroke, and diabetes. Restrictive cubic spline analysis revealed a linear dose-response relationship between the TyG index and the risk of CMD.
Conclusions: A high TyG index increases the risk of CMD in MHO individuals. Monitoring and maintaining an appropriate TyG index may contribute to the prevention of CMD risk in MHO individuals.
1 Introduction
Over the past four decades, the global prevalence of obesity has nearly doubled, reaching pandemic proportions, with over 878 million adults being affected by obesity as of 2022 (1). The widespread issue of obesity imposes a significant burden on both individual health and socioeconomic systems (2). Cardiometabolic diseases (CMD), including type 2 diabetes, coronary heart disease, and stroke (3, 4) have been on the rise. Studies indicate that individuals aged 60 years and above with CMD experience a reduced life expectancy of 6–10 years compared to those without CMD, and those with two or more CMDs experience a life expectancy reduction of over 15 years (5). Obesity exacerbates metabolic risk factors (hypertension, hyperglycemia, dyslipidemia) and directly contributes to cardiac and cerebral dysfunction (3, 6–8). Notably, obesity-driven metabolic dysfunction-associated steatotic liver disease (MASLD) promotes systemic insulin resistance (IR) and inflammation via hepatic lipid accumulation (9), further amplifying CMD risk (10, 11). These intertwined mechanisms underscore the urgency of addressing obesity-related CMD (3, 8, 10–12).
However, not all obese individuals experience metabolic disruptions or develop cardiovascular diseases (13, 14). A subset of obese individuals is referred to as metabolically healthy obese (MHO) (14–16). MHO is a concept based on clinical observations, and although it lacks a precise definition, normal blood glucose and lipid metabolism parameters, absence of hypertension, and no concurrent cardiovascular diseases are often considered criteria for diagnosing MHO (17–19). However, because individuals in the MHO group do not manifest metabolic abnormalities, identifying high-risk individuals prone to CMD within the MHO population has become a noteworthy issue. Some studies suggest that, compared to metabolically healthy non-obese (MHNO) individuals, MHO individuals primarily exhibit ectopic fat deposition (visceral and hepatic) and biological mechanisms such as IR (15). The triglyceride-glucose (TyG) index, a validated surrogate marker of insulin resistance (20, 21), integrates lipid and glucose metabolism dysregulation. Elevated TyG correlates with mitochondrial dysfunction, oxidative stress, and systemic inflammation, driving endothelial injury and atherosclerosis (20, 22–24). In obesity, ectopic hepatic fat exacerbates IR via dysregulated gluconeogenesis and VLDL overproduction, establishing a self-reinforcing cycle of TyG elevation and metabolic deterioration (15, 16, 25). Thus, identifying TyG-driven metabolic vulnerability in MHO populations may mitigate CMD progression.
Despite the absence of traditional risk factors, MHO individuals exhibit ectopic fat deposition and subtle insulin resistance (15, 25), creating a latent vulnerability to cardiometabolic disease. The TyG index, a proxy for adipose-liver crosstalk (20, 22), may detect this vulnerability earlier than conventional biomarkers. No prior study has evaluated TyG’s prognostic value in rigorously defined MHO populations, representing a critical gap our work addresses (26, 27). Leveraging the longitudinal Kailuan study, this investigation aims to clarify the association between the TyG index and CMD risk in MHO individuals, offering insights for early risk stratification.
2 Methods
2.1 Study design and participants
The Kailuan Study (Registration Number: ChiCTR-TNRC-11001489) is a prospective cohort study based on a community population that investigates cardiovascular diseases and related risk factors through surveys and interventions. The study details can be found in previous publications by our research group (28, 29). In 2006, Kailuan General Hospital and its ten affiliated hospitals conducted initial health examinations for both active and retired employees of the Kailuan Group, with a total of 101,510 participants. Subsequent follow-ups were conducted every two years, maintaining consistency in follow-up content, anthropometric measurements, and biochemical indicators with the initial health examination. This study focused on the metabolically healthy obese (MHO) population, which consisted of obese individuals who participated in the health examinations of the Kailuan Group from 2006 to 2010 and did not have a history of hypertension, diabetes, hyperlipidemia, or cardiovascular disease. The obesity cutoff (BMI ≥28 kg/m²) was defined based on ethnic-specific thresholds accounting for higher visceral adiposity in Asian populations (WHO-recommended BMI ≥27.5 kg/m² for Asians) (30, 31), in alignment with the Chinese Adult Obesity Guidelines (32), while ensuring consistency with previous epidemiological research (33, 34). The specific criteria for inclusion were meeting the obesity criteria (BMI≥28 kg/m2) along with the following: serum total cholesterol (TC) <5.72 mmol/L; serum triglycerides (TG) ≤1.7 mmol/L; serum high-density lipoprotein cholesterol (HDL-C) >1.0 mmol/L (males) or >1.3 mmol/L (females); systolic blood pressure (SBP) <140 mmHg and diastolic blood pressure (DBP) <90 mmHg; fasting plasma glucose (FPG) <7 mmol/L; no history of taking antihypertensive, antidiabetic, or lipid-lowering medications; and no history of CVD (including coronary heart disease, ischemic and hemorrhagic stroke, heart failure, atrial fibrillation) (12, 17). Individuals who did not meet these criteria were excluded. A total of 4,750 participants were ultimately included, and follow-up commenced in 2010 and concluded on December 31, 2021. The inclusion and exclusion processes are illustrated in Figure 1. The study was performed in accordance with the Declaration of Helsinki and approved by the Ethics Committee of Kailuan General Hospital (Approval Number: 2006-05). All participants provided written informed consent after receiving detailed explanations about the study objectives, data collection procedures, and their right to withdraw at any time without consequences to medical care. This consent process followed the standardized protocol established in the Kailuan cohort, as described in our previous publications (35, 36).
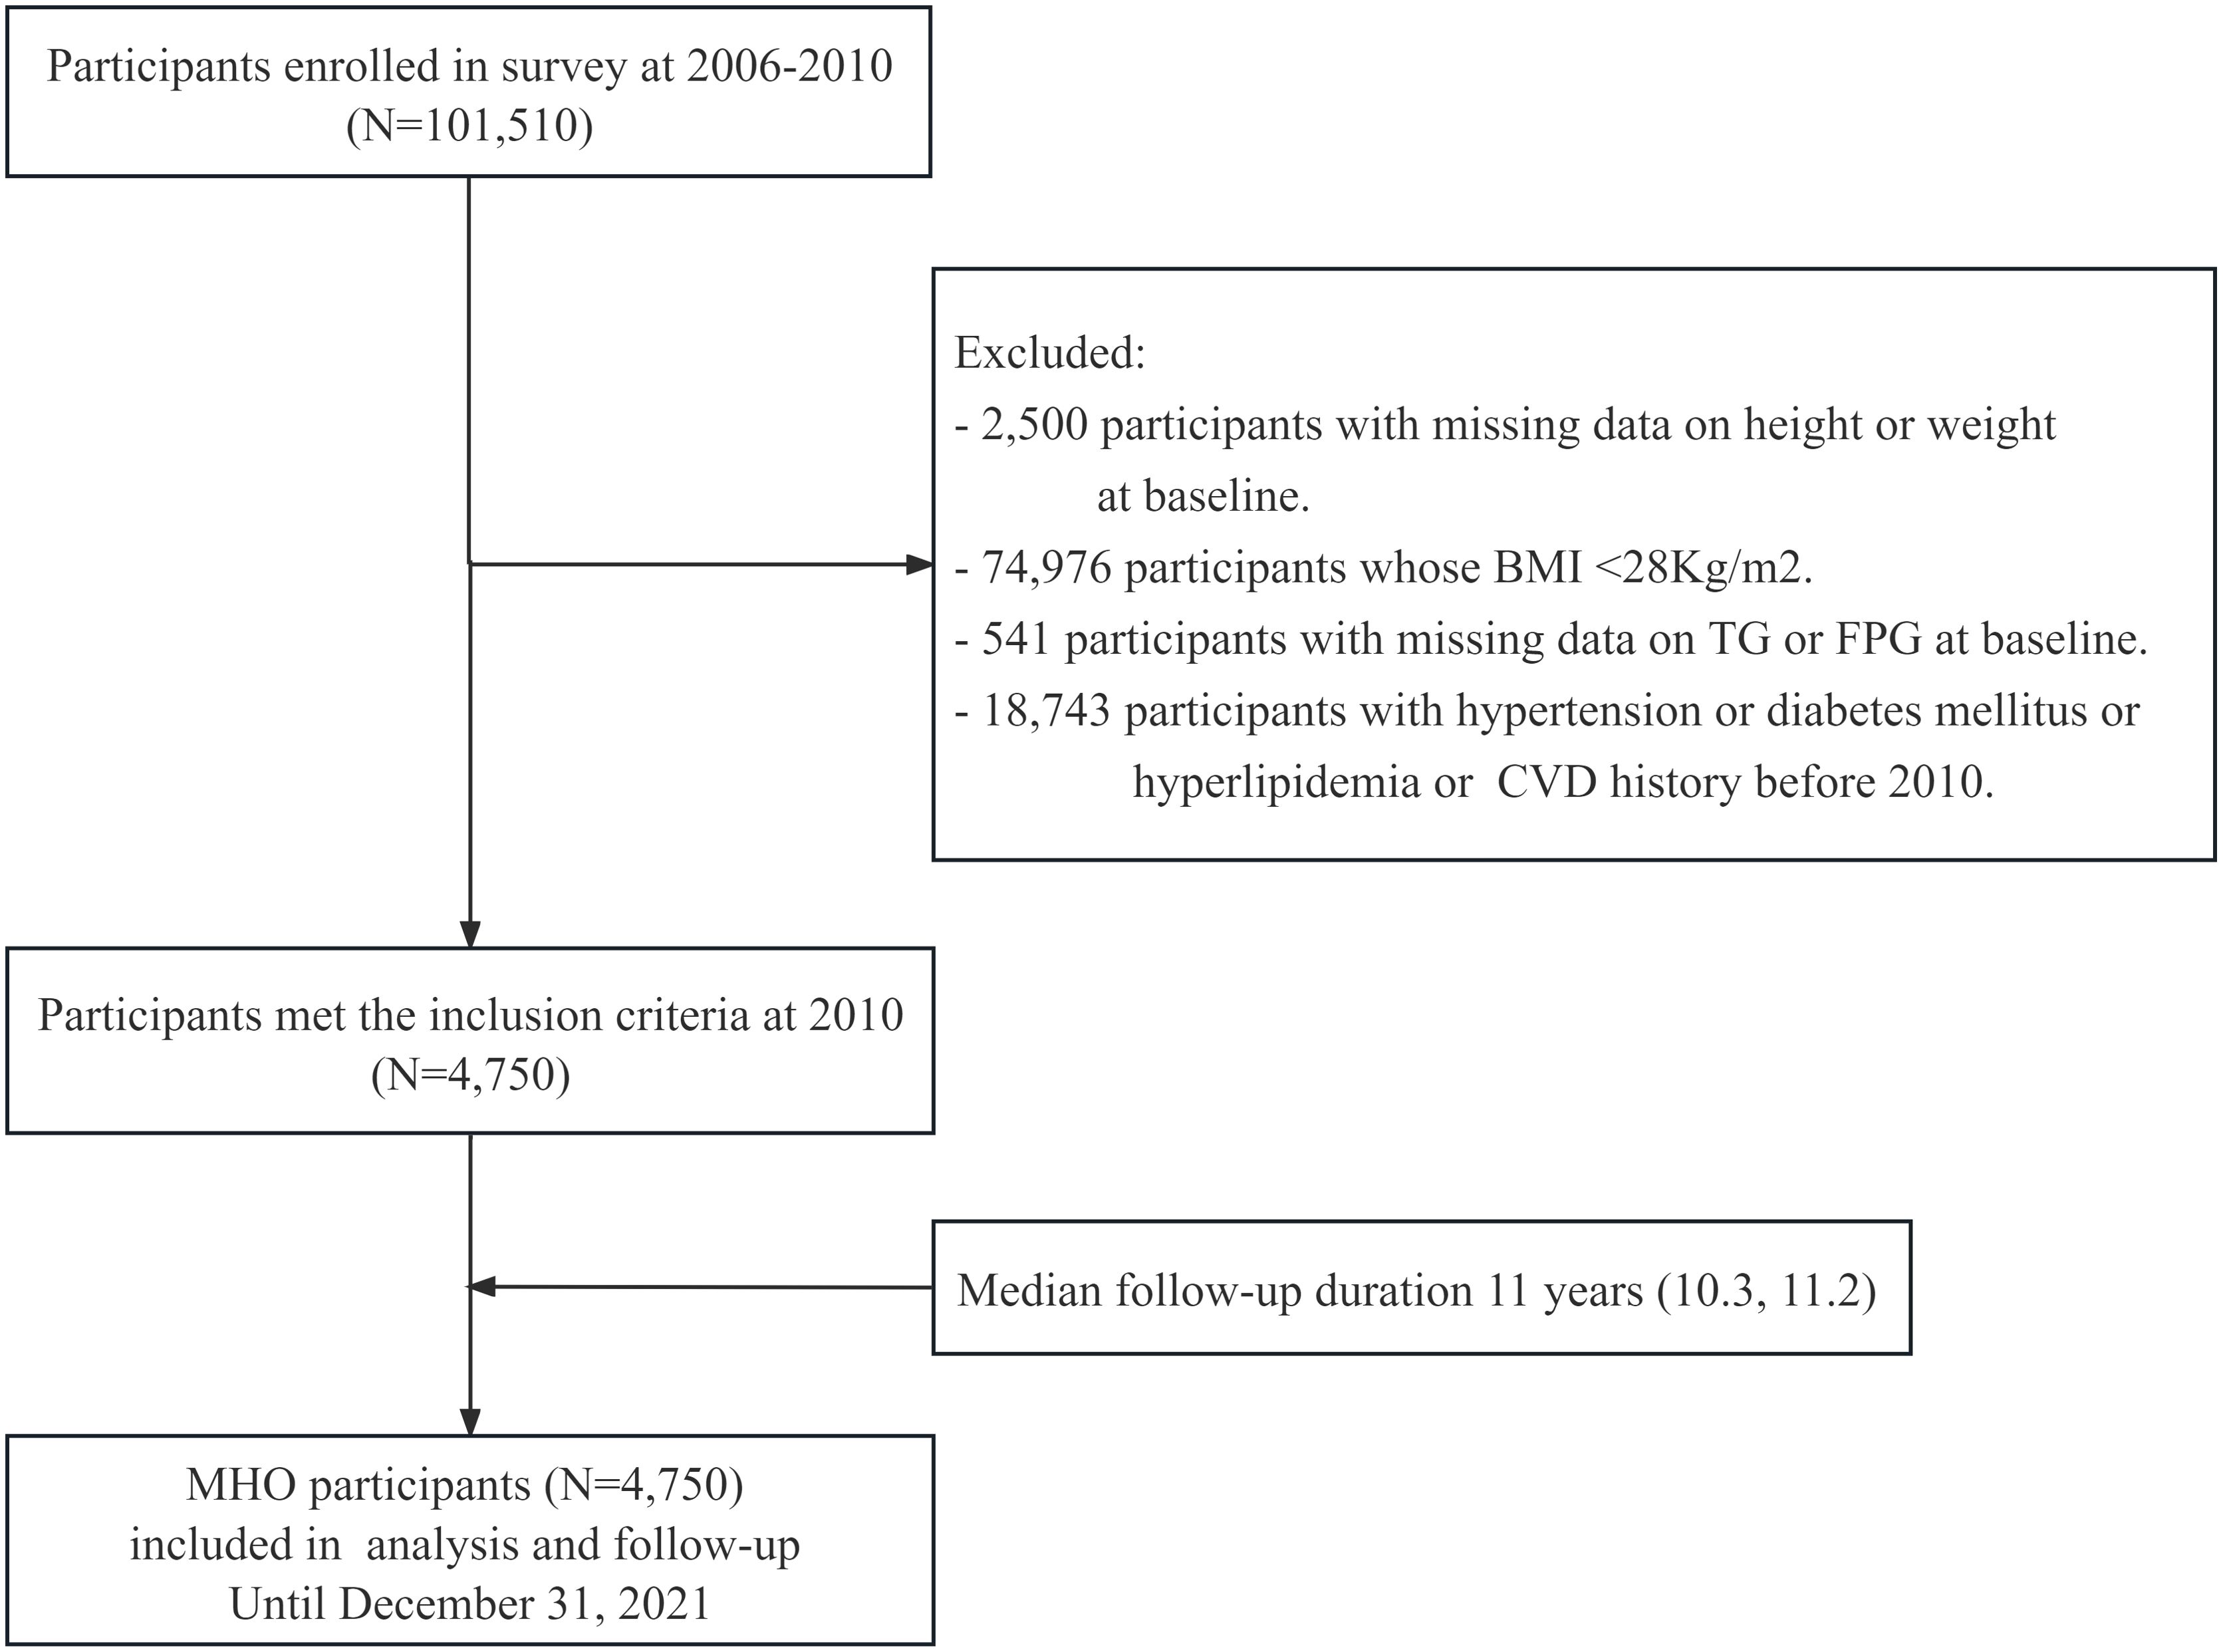
Figure 1. Flow chart for the inclusion of participants in the study.
2.2 Data collection
This study used the epidemiological survey content and anthropometric indicators mentioned in previously published articles (28, 37). All measurements were conducted in a quiet room with the temperature controlled between 22°C and 25°C. Each participant completed a face-to-face questionnaire during each health examination, collecting information on demographic characteristics (sex, age, education level, BMI), personal health history (hypertension, diabetes, cardiovascular disease, and the use of antihypertensive, glucose-lowering drugs, and lipid-lowering medications), and lifestyle factors (smoking status, alcohol consumption habits, Physical Activity habits), among others. For anthropometric measurements, the participants were instructed to wear lightweight clothing and remain barefoot. Trained doctors measured weight and height under standardized conditions according to a standardized protocol, with units standardized to 0.1 kilograms and 0.1 centimeters. Body mass index (BMI) was calculated as weight (kg) divided by height in meters squared (m2). During blood pressure measurements, following a 5-minute rest for participants, calibrated mercury sphygmomanometers were used to measure the blood pressure of each participant’s right upper arm. Measurements were repeated at intervals of 1–2 minutes a total of three blood pressure readings. The average of three readings was recorded (38).
2.3 Measurement of biochemical parameters
All participants were required to fast for 8–12 h, and fasting venous blood samples were obtained after centrifugation to collect the upper serum layer for measurement of total cholesterol (TC), low-density lipoprotein cholesterol (LDL-C), high-density lipoprotein cholesterol (HDL-C), triglycerides (TG), fasting plasma glucose (FPG), high-sensitivity C-reactive protein (hs-CRP), and serum uric acid (UA) (37). Biochemical indicators were measured using a Hitachi 7600 automatic biochemical analyzer. The procedures strictly followed the instructions provided with the reagent kits, and the analyses were performed by professional laboratory technicians.
2.4 Definitions and grouping of TyG index
The TyG index was calculated using the established formula: ln[TG(mg/dL) × FPG(mg/dL)/2] (37), and it was divided into four groups based on quartiles: Q1 group (<8.18); Q2 group (8.18-8.41); Q3 group (8.42-8.62); Q4 group (≥8.63).
2.5 Other defnitions
CVD includes coronary heart disease, ischemic stroke, hemorrhagic stroke, heart failure, and atrial fibrillation (39). Hypertension is defined as systolic blood pressure (SBP) ≥ 140mmHg and/or diastolic blood pressure (DBP) ≥ 90mmHg, or the use of antihypertensive medications, or a history of hypertension (40). Diabetes was defined as fasting plasma glucose (FPG) ≥ 7.0 mmol/L, prolonged use of antidiabetic medications, or a history of a confirmed diabetes diagnosis (41). Hyperlipidemia is defined as total cholesterol (TC) > 5.72 mmol/L or triglycerides (TG) > 1.7 mmol/L, or the prolonged use of statins, niacin, or fibric acid derivatives (42). Participants who smoked an average of ≥1 cigarette per day in the past year were classified as smokers; otherwise, they were considered non-smokers. Participants who had consumed an average of ≥100 mL of alcohol per day (alcohol content >50%) in the past year were classified as drinkers; otherwise, they were considered nondrinkers. Participants engaging in physical exercise ≥3 times per week, with each session lasting ≥30 min, were classified as active exercisers; otherwise, they were classified as non-active exercisers. Educational level was categorized as below high school and high school or above based on the level of education attained (43).
2.6 Outcomes
CMD is defined as the occurrence of one or more of the following: diabetes, coronary heart disease, or stroke (3, 4). Using the health examination data from 2010 as the starting point for follow-up and CMD occurrence as the endpoint event, in the case of multiple subtypes of CMD occurring, the subtype of the first event was recorded; for those who did not experience an endpoint event, the follow-up was concluded on December 31, 2021. CMD occurrence was assessed annually by trained medical personnel who reviewed the hospital diagnoses of the study participants in the hospitals affiliated with the Kailuan Group and the designated medical insurance hospitals in Tangshan. All diagnoses were confirmed by professional physicians based on the hospital records.
2.7 Statistical analysis
This study utilized SAS 9.4 statistical software (SAS Institute, Inc., Cary, NC, USA) was used for data analysis. In this study, the missingness of baseline covariates was less than 5%. We used Multiple Imputation by Chained Equations (MICE) to handle missing values for subsequent analyses (44). Metric data with a normal distribution were expressed as mean ± standard deviation, and intergroup data were analyzed using one-way analysis of variance. Skewed distribution metric data were represented as medians and quartiles, and intergroup data were analyzed using non-parametric tests (Kruskal-Wallis). Count data were presented as relative numbers or percentages (%), and intergroup comparisons were made using the chi-square test, which was divided into four groups based on quartiles. Prior to conducting Cox analysis, we performed a test for the proportional hazards (PH) assumption (45). The results indicated that the p-value for the PH assumption test was 0.275 (>0.05), suggesting that the proportional hazards assumption was met. The Kaplan–Meier method was used to calculate the incidence rates of CMD and its subtypes (coronary heart disease, stroke, and diabetes) for each group, with comparisons made using the log-rank test. After meeting the proportional hazards assumption, Cox proportional hazards regression models were used. The risk ratio (HR) and 95% confidence interval (95% CI) were calculated to assess the relationship between the TyG index and risk of CMD and its subtypes. Model 1 was unadjusted for other variables, Model 2 adjusted for age (continuous variable, years) and sex (categorical variable, male or female); Model 3, based on Model 2, further adjusted for smoking status (categorical variable, yes or no), drinking habits (categorical variable, yes or no), physical activity habits (categorical variable, active or inactive), education level (categorical variable, senior high school or above), and family history of CMD (categorical variable, present or absent); Model 4, based on Model 3, further adjusted for SBP (continuous variable, mmHg), FPG (continuous variable, mmol/L), HDL-C (continuous variable, mmol/L), LDL-C (continuous variable, mmol/L), hs-CRP (continuous variable, mg/L), BMI (continuous variable, kg/m2), UA (continuous variable, μmol/L), and estimated glomerular filtration rate (eGFR, continuous variable, ml/min/1.73m2). After adjusting for potential confounding factors, restrictive cubic splines were used to describe the dose-response relationship between TyG index (continuous variables) and the risk of CMD.Subsequently, stratified analyses were conducted based on age (<45 years, ≥45 years), sex (male, female), physical activity habits (active, inactive) and sex-specific median height (above-median, below-median). To ensure the robustness of the results, individuals who developed CMD within 2 years and those with BMI < 30 kg/m2 were excluded from the sensitivity analysis of the relationship between the TyG index and risk of CMD. We additionally included waist circumference (≥90 cm for men/≥85 cm for women) as an alternative indicator of central obesity (data from the 2010 follow-up) for sensitivity analysis. Statistical significance was set at P < 0.05 (two-tailed) was considered statistically significant.
3 Results
3.1 Baseline characteristics of participants stratified by quartiles of TyG index
This study included a total of 4,750 MHO participants as the observational population, with an average age of 53.70 ± 12.93 years, and a male proportion of 75.0%. The baseline clinical and biochemical characteristics of the MHO participants, based on the quartiles of the TyG index, are shown in Table 1. Stratified by quartiles of the TyG index, compared to the Q1-Q3 groups, the Q4 group had the highest proportion of male participants, highest values for BMI, SBP, DBP, and heart rate indicators, and the poorest metabolic profile (TC, HDL-C, LDL-C, TG, FPG, UA, and hs-CRP). Additionally, the Q4 group exhibited the highest proportion of unhealthy lifestyle habits (smoking, drinking, and lack of exercise) (P < 0.01) (Table 1).
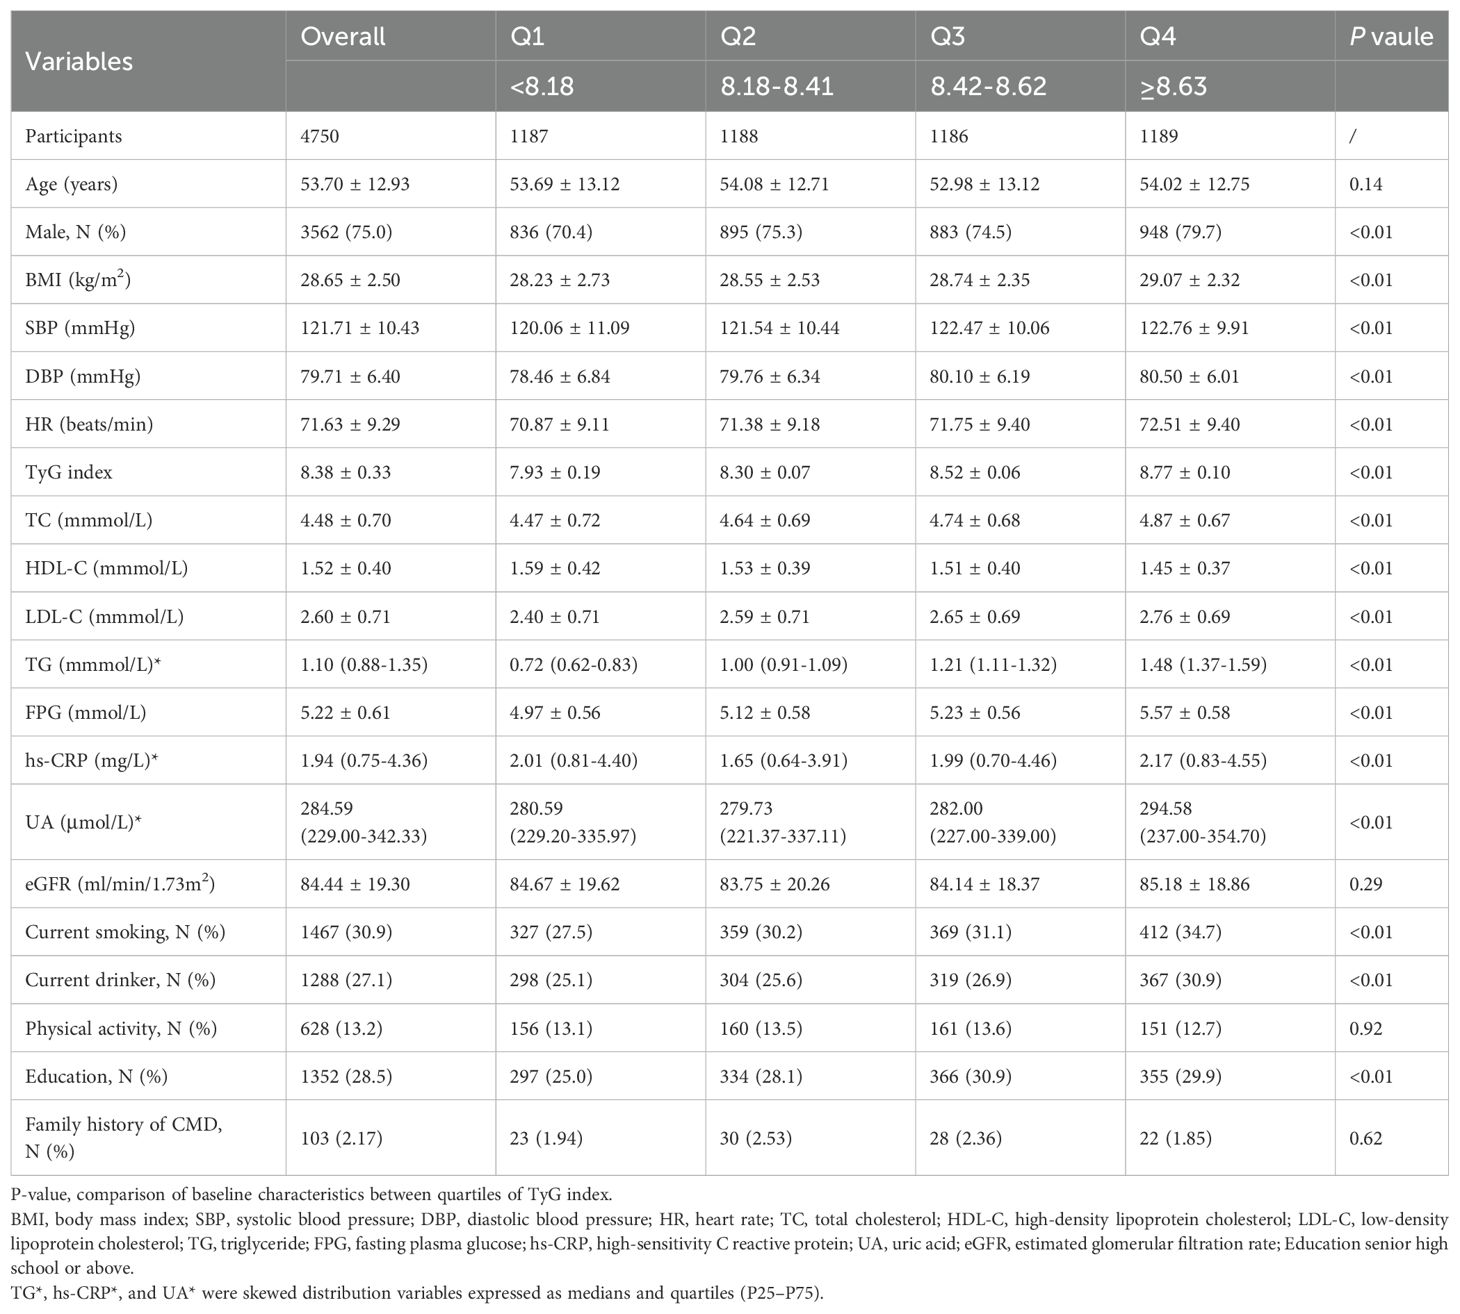
Table 1. Baseline characteristics of Participants by quartiles of TyG index.
3.2 Association between TyG index and CMD and its subtypes
During a median follow-up period of 11.4 years (IQR, 10.3, 11.2), 826 (17.39%) MHO participants developed CMD. Among them, 131 MHO participants experienced coronary heart disease, 215 participants had a stroke, and 542 participants developed diabetes. The cumulative incidence rates of CMD subtypes in different TyG quartiles were compared using the log-rank test, which showed statistically significant differences (P < 0.01; Figure 2). The incidence density of CMD and its subtypes (coronary heart disease, stroke, and diabetes) exhibited an increasing trend across TyG quartiles. The incidence densities (per 1000 person-years) of CMD in the Q1-Q4 groups were 19.02, 26.13, 27.70, and 45.86, respectively. For coronary heart disease, the densities were 3.36, 3.48, 4.64, and 7.22; for stroke, 4.89, 6.89, 6.99, and 9.78; for diabetes, 11.11, 16.82, 18.43, and 31.27. After adjusting for confounding factors in Model 4, compared to the Q1 group of TyG quartiles, the adjusted HR values (95% CI) for CMD in the Q2-Q4 groups were 1.33 (1.03, 1.65), 1.37 (1.04, 1.82), and 2.04 (1.56, 2.68) (P < 0.0001). The adjusted HR values (95% CI) for coronary heart disease were 1.16 (0.88, 1.53), 1.23 (0.92, 1.63), and 1.78 (1.36, 2.33), respectively (P < 0.0001). The adjusted HR values (95% CI) for stroke were 1.17 (0.89, 1.55), 1.23 (0.93, 1.64), and 1.75 (1.34, 2.29) (P < 0.0001). The adjusted HR values (95% CI) for diabetes were 1.66 (1.18, 2.34), 1.74 (1.23, 2.46), and 2.59 (1.85, 3.63) (P < 0.0001). In model 4, for each SD increased, the HR (95% CI) for CMD, coronary heart disease, stroke, and diabetes mellitus was 1.41 (1.27,1.57), 1.35 (1.22,1.50), 1.36 (1.22,1.51) and 1.51 (1.34,1.70), respectively (Table 2). Additionally, restrictive cubic spline analysis revealed a linear dose-response relationship between the TyG index and risk of CMD (Figure 3).
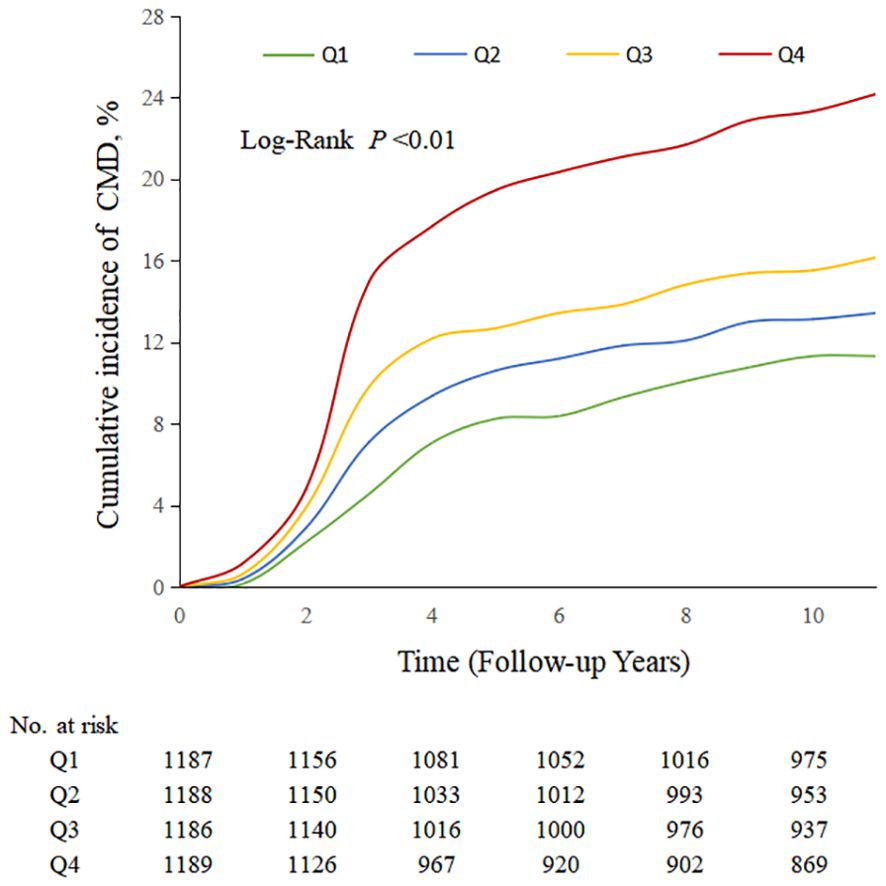
Figure 2. Kaplan–Meier analysis of TyG index and incidence rate of CMD in MHO participants.
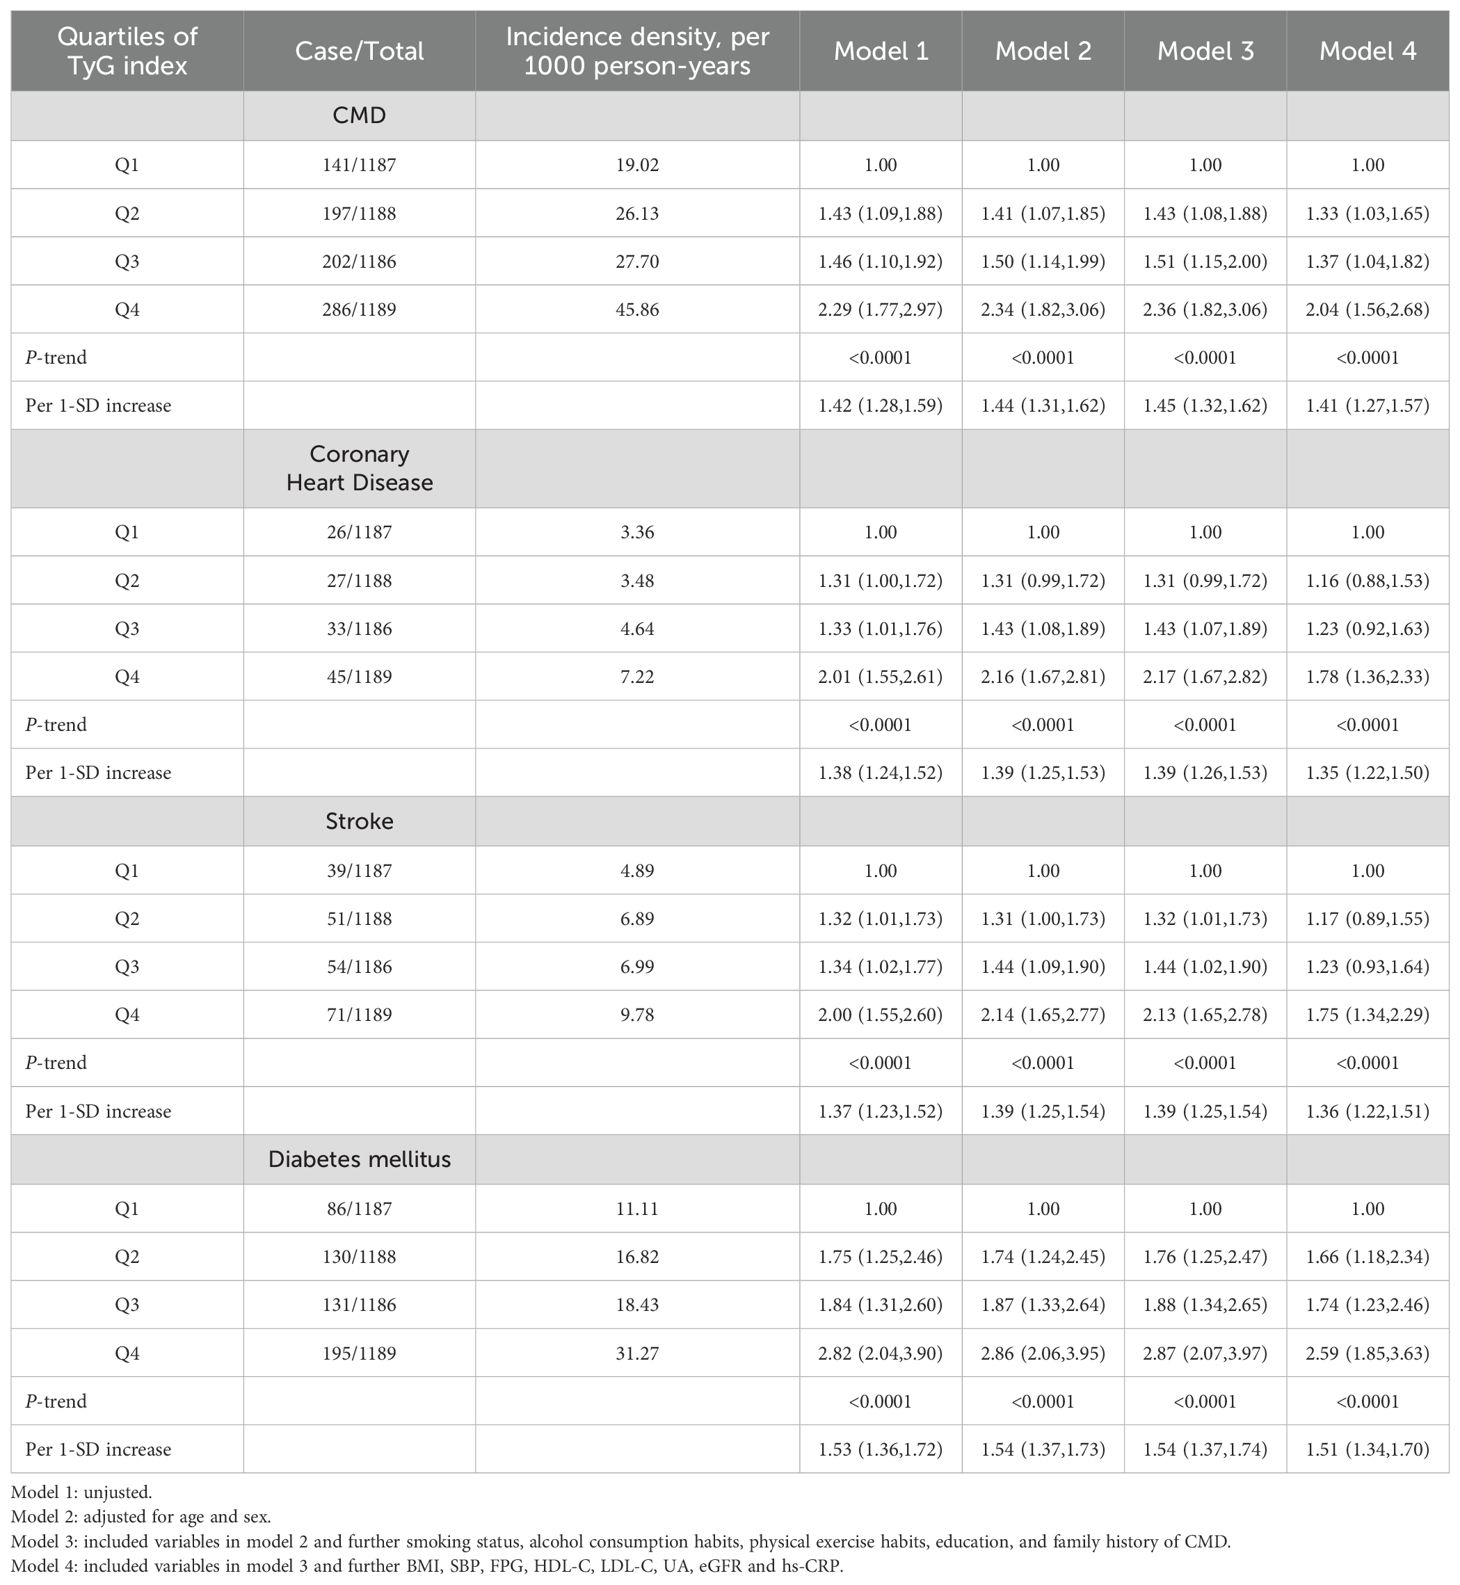
Table 2. Association of TyG index with CMD and subtypes in MHO participants.
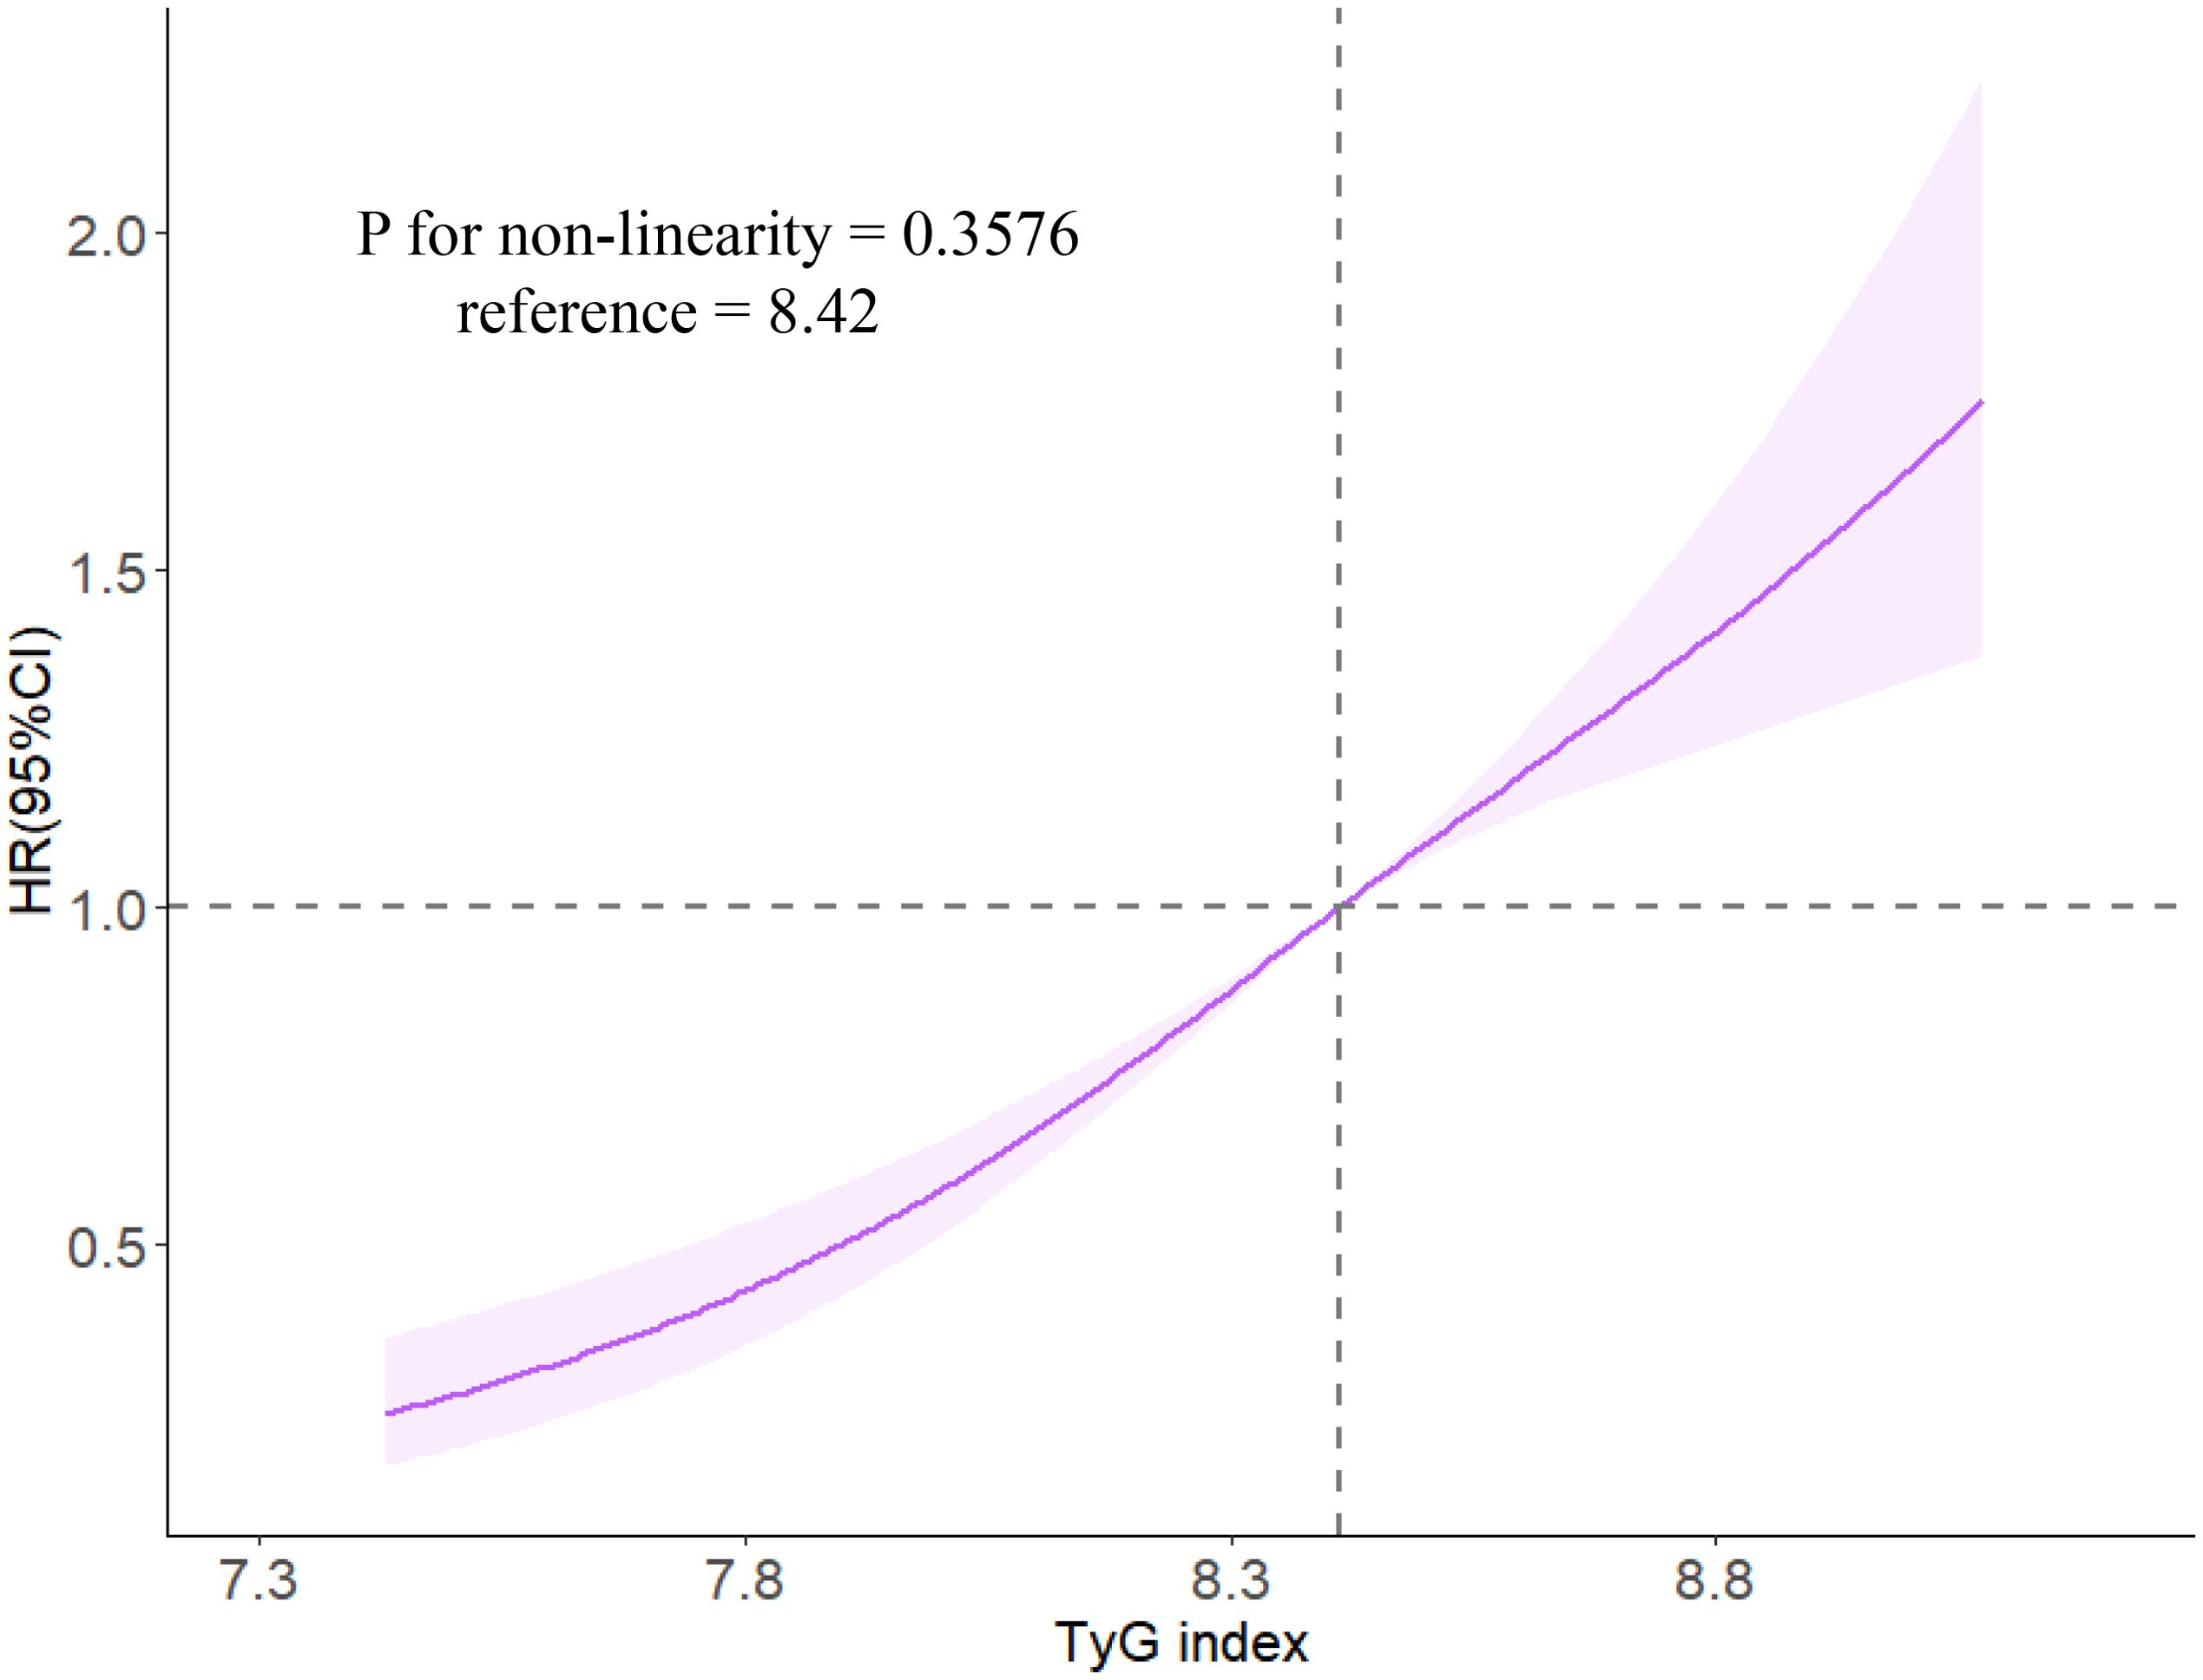
Figure 3. The associations of TyG index with risk of CMD in restrictive cubic spline analysis. Caption: Cox regression models with restricted cubic splines were fitted to the data with three knots at the 10th, 50th, and 90th percentiles of the TyG index. The solid line represents the point estimate of the TyG index with the risk of CMD and the shaded part represents the 95% CI estimate. Covariates in the model included age, sex, smoking status, drinking habits, physical activity habits, education level, family history of CMD, SBP, FPG, HDL-C, LDL-C, hs-CRP, BMI, UA, and eGFR.
3.3 Results of the stratified analysis and sensitivity analysis
Stratified analysis revealed an interaction between the TyG index and sex, whereas no interactions were found with age, physical activity, and height. Across different age, sex, physical activity, and sex-specific median height subgroups, higher TyG index levels were consistently associated with an increased risk of CMD. Moreover, the risk of CMD in females was higher than that in males. However, in the physically active group, the association between the TyG index and CMD did not show statistically significant differences among the subgroups (Table 3).
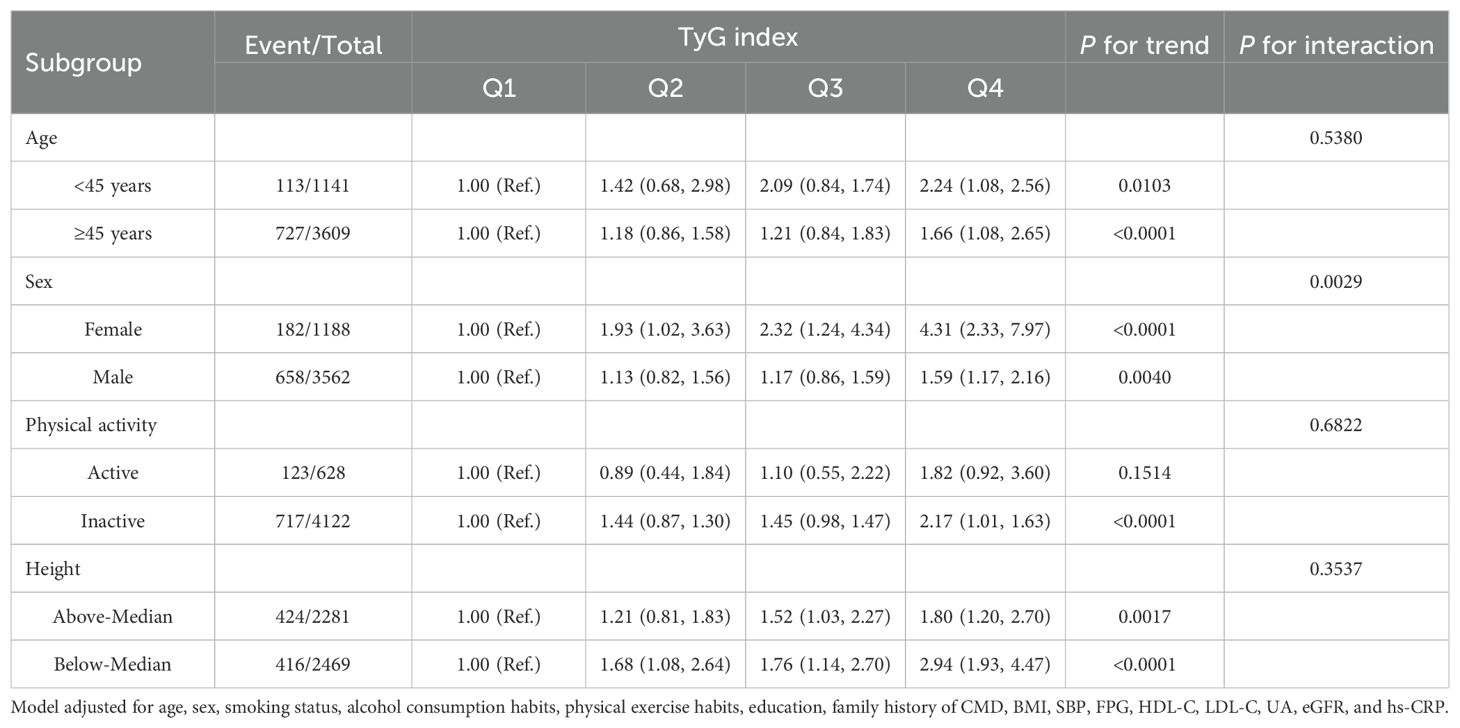
Table 3. Stratified analysis for association of TyG index with CMD in MHO participants.
To eliminate potential confounding effects on the study results, 132 individuals who experienced CMD events within the first 2 years of follow-up (132 individuals) were excluded, and the results were consistent with the main findings (Supplementary Table S1). Additionally, sensitivity analysis was performed by repeating the main Cox regression analysis with a focus on individuals with BMI ≥ 30 kg/m2, and the results were consistent with the main findings (Supplementary Table S2). Waist circumference, as an alternative indicator of MHO to BMI, showed a consistent association pattern with TyG-CMD compared to BMI (Supplementary Table S4).
4 Discussion
This study found a significant association between TyG index and the risk of CMD in the MHO population. As the TyG index increased, the risk of CMD in MHO individuals also increased. This association remains significant, independent of other risk factors, and the results are consistent across various subtypes of CMD, including coronary heart disease, stroke, and diabetes, consistent with the main findings.
The MHO population is a unique group, and although previous research suggests that MHO is merely a precursor state to metabolically unhealthy obesity (MUO), the risk of CVD remains higher than that in MHNO individuals (16, 46). However, because the MHO population shows no signs of metabolic abnormalities, identifying individuals at a high risk for CMD within this group has become a significant concern. The TyG index serves as an effective indicator reflecting insulin resistance (20, 21). Its effect on the risk of developing hypertension, diabetes, stroke, and CVD in the general population has been confirmed (37, 43, 47, 48). Previous studies from the Kailuan cohort demonstrated that a long-term increase and variation in the TyG index are risk factors for inducing CMD, with a 2.15-fold increase in CMD risk observed in Q4 compared to Q1 of the TyG index (49). Chen et al. found that in a population of young and middle-aged individuals in the United States, obese individuals with a high TyG index had a 1.42-fold increased long-term CVD event risk compared with those with a low TyG index, with no significant difference observed in non-obese individuals (50). The impact of TyG index on CMD and CVD has been studied in obese individuals with metabolic abnormalities (50, 51). Our study discovered that over a median follow-up period of 11 years, 17.39% of MHO participants experienced CMD. Comparing the fourth quartile of the TyG index to the first quartile, the risk of CMD increased by 1.04 times, coronary heart disease risk increased by 78%, stroke risk increased by 75%, and diabetes risk increased by 1.59 times. Our study extends prior evidence by demonstrating that the TyG index retains prognostic value even in the absence of traditional metabolic risk factors. This challenges the notion of MHO as a benign phenotype and underscores the utility of TyG for unmasking latent cardiometabolic risk. Our findings diverge from the Korean NHIS-HealS cohort, which reported no association between the TyG index and cardiovascular events in MHO individuals after full adjustment (51). This discrepancy may arise from methodological differences in the outcome definitions and follow-up duration. Specifically, our composite CMD outcomes included coronary heart disease, stroke, and diabetes, whereas the referenced study by Cho et al. defined cardiovascular events as myocardial infarction and stroke alone. Furthermore, the extended median follow-up period in our cohort (11 years versus 5 years) likely improved the detection of delayed CMD onset, enhancing the statistical power to identify TyG-related risks. Our longitudinal findings challenge the “benign obesity” paradigm, revealing that 17.4% of ostensibly metabolically healthy obese individuals developed cardiometabolic sequelae within a decade. This aligns with the emerging concept of adaptive metabolically healthy obesity proposed by Blüher (15), wherein preserved metabolic parameters mask subclinical endothelial dysfunction. It is crucial to pay close attention to this specific obesity subtype, identify potential risk factors for CMD early, and manage and control them accordingly. However, owing to the lack of apparent metabolic abnormalities in the MHO population, it is challenging to identify individuals at high risk for CMD within this group. The TyG index, as a key indicator of insulin resistance, may help identify individuals at a high risk for CMD in the MHO population by regularly monitoring the TyG index. The dose-response relationship shows each SD of TyG increase confers 41% excess risk, comparable to the impact of 10 mmHg systolic blood pressure elevation on CVD risk (52). As continuous TyG increase associated with 41% higher CMD risk per SD, this supports using TyG as a gradient risk marker rather than binary cut-offs, akin to blood pressure management (53). From a preventive medicine perspective, our findings suggest that lowering TyG index by just 0.5 units (achievable through 15% TG reduction or 0.5 mmol/L FPG decrease) could theoretically reduce CMD risk by 30%.
The clinical implementation of TyG index monitoring in MHO individuals presents notable advantages. As a calculated index derived from routine lipid and glucose measurements, it requires no additional costs beyond standard blood tests—a critical advantage in resource-limited settings. Future studies should validate these estimates in dedicated health economic frameworks.
In the stratified analysis, we found an interaction between the TyG index and sex, with females showing a significantly higher risk of CMD than males. Notably, the sex-specific gradient in TyG-associated risk (4.3-fold higher in females vs. 1.59-fold in males) suggests hormonal or body composition mediators that warrant further investigation. Sex-specific associations may arise from hormonal and genetic factors (54, 55). Estrogen’s insulin-sensitizing effects via AMPK activation could attenuate TyG-related metabolic stress in females (56), though diminished estrogen levels in the predominantly postmenopausal cohort likely reduced this protection, elevating CMD risk. Concurrently, sex differences in the expression levels of metabolism-related genes may be associated with sex differences in gene expression regulation (55). These hypotheses warrant validation using integrated omics approaches. Furthermore, we found that, in the MHO population with inactive physical activity, a higher TyG index was associated with an increased risk of CMD. However, in the MHO population with active physical activity, we observed no statistically significant differences in the risk of CMD among the TyG index groups. Previous research has also demonstrated that maintaining a healthy lifestyle, including higher levels of physical activity, contributes to sustaining MHO in both children and adults (57). A healthy lifestyle is thought to reduce the risk of CMD (4). In addition, sensitivity analyses using the WHO criteria (BMI≥30 kg/m²) showed consistent directionality of the TyG-CMD association.
The mechanism by which TyG index induces CMD in the MHO population is currently unclear. Previous studies have shown that, despite the absence of metabolic disorders in the MHO population, insulin resistance is still significantly higher than that in normal individuals (58). The TyG index, recognized as an effective indicator reflecting insulin resistance (20, 21), is associated with elevated insulin resistance levels as the TyG index increases. Compared with the MHNO population, the MHO group may experience increased visceral fat accumulation, adipose tissue dysfunction, and insulin resistance, potentially placing the body in a process of immune cell infiltration and chronic inflammation. Elevated MASLD prevalence in MHO (25) may further amplify TyG-related risks through hepatokine dysregulation. Specifically, MASLD-driven overproduction of fetuin-A and selenoprotein P impairs adipose tissue insulin signaling (59), creating a feedforward loop between hepatic steatosis and systemic IR. Consequently, pathological conditions, such as hypertension, dyslipidemia, and disrupted blood glucose metabolism, may manifest (60, 61). Furthermore, signals from ectopic fat tissue, including peptide hormones (adipokines) and proinflammatory factors released by immune cells, may accelerate the development of disrupted glucose metabolism, endothelial dysfunction, and atherosclerosis. Under the combined influence of these risk factors, CMD may develop (8, 62–64).
This study is the first prospective cohort study to investigate the TyG index and risk of CMD in the MHO population. However, this study has certain limitations. First, as the study participants were predominantly male employees and retirees of the Kailuan Group, there may be a potential selection bias. Second, although we adjusted for potential confounding factors of CMD, other unmeasured or residual confounding factors such as genetic susceptibility could still influence the results. Third, the MHO participants were from the Kailuan Study, which is a community-based cohort study; therefore, the results of this study cannot be directly extrapolated to other ethnic groups. Fourth, our findings using the Chinese BMI criteria may require validation in populations with different adiposity distributions. Fifth, while TyG index monitoring appears economically viable given its low-cost laboratory basis, we lacked data to perform formal cost-effectiveness analysis. Large-scale implementation would require validation in diverse healthcare systems. Additionally, we made efforts to adjust for confounding factors in the Cox regression model, and the long follow-up period and relatively stable study population enhanced the reliability of our results.
5 Conclusions
This study found that in individuals with MHO, the higher the TyG index, the higher the risk of CMD, and this association is independent of other risk factors. Therefore, regular monitoring of the TyG index may help identify MHO individuals at high risk of CMD. Maintaining a lower TyG index may reduce the risk of CMD.
Data availability statement
The datasets used and analyzed during the current study are available from the corresponding author on reasonable request. Requests to access these datasets should be directed to eXJjaGVuM0BzdHUuZWR1LmNu.
Ethics statement
The study was performed according to the guidelines of the Helsinki Declaration and was approved by the Ethics Committee of Kailuan General Hospital (Approval Number: 2006-05). All participants agreed to take part in the study and provided informed written consent. The studies were conducted in accordance with the local legislation and institutional requirements. Written informed consent for participation was not required from the participants or the participants’ legal guardians/next of kin in accordance with the national legislation and institutional requirements.
Author contributions
YJC: Formal analysis, Methodology, Software, Writing – original draft. WW: Formal analysis, Methodology, Software, Writing – original draft. ZC: Formal analysis, Software, Writing – original draft. KW: Data curation, Writing – review & editing. HZ: Data curation, Writing – review & editing. PF: Data curation, Writing – review & editing. YW: Data curation, Writing – review & editing. XW: Data curation, Writing – review & editing. YL: Data curation, Writing – review & editing. SC: Data curation, Writing – review & editing. SW: Conceptualization, Methodology, Project administration, Writing – review & editing. YRC: Conceptualization, Funding acquisition, Project administration, Supervision, Writing – review & editing.
Funding
The author(s) declare that financial support was received for the research and/or publication of this article. This study was supported by 2023 Special Fund Project for Science and Technology Innovation Strategy of Guangdong Province (No. STKJ2023003), and Shantou Medical Health Science and Technology Plan (No. 230509206496513).
Acknowledgments
We sincerely express our gratitude to all parties in the Kailuan Study as well as members of the Kailuan General Hospital and its affiliated hospitals. We thank Mark Cleasby, PhD from Liwen Bianji (Edanz) for editing the language of a draft of this manuscript.
Conflict of interest
The authors declare that the research was conducted in the absence of any commercial or financial relationships that could be construed as potential conflicts of interest.
Generative AI statement
The author(s) declare that no Generative AI was used in the creation of this manuscript.
Publisher’s note
All claims expressed in this article are solely those of the authors and do not necessarily represent those of their affiliated organizations, or those of the publisher, the editors and the reviewers. Any product that may be evaluated in this article, or claim that may be made by its manufacturer, is not guaranteed or endorsed by the publisher.
Supplementary material
The Supplementary Material for this article can be found online at: https://www.frontiersin.org/articles/10.3389/fendo.2025.1524786/full#supplementary-material
Abbreviations
TyG index, triglyceride - glucose Index; CMD, cardiometabolic disease; CVD, cardiovascular disease; LDL-C, low-density lipoprotein-cholesterol; HDL-C, high-density lipoprotein-cholesterol; TG, triglyceride; hs-CRP, high-sensitivity C-reactive protein; FPG, fasting plasma glucose; BMI, body mass index; SBP,systolic blood pressure; eGFR, estimating glomerular filtration rate; HR, hazard ratio; CI, confidence interval.
References
1. Collaboration NCDRF. Worldwide trends in underweight and obesity from 1990 to 2022: a pooled analysis of 3663 population-representative studies with 222 million children, adolescents, and adults. Lancet. (2024) 403:1027–50. doi: 10.1016/S0140-6736(23)02750-2
2. Collaborators GBDRF. Global burden of 87 risk factors in 204 countries and territories, 1990-2019: a systematic analysis for the Global Burden of Disease Study 2019. Lancet. (2020) 396:1223–49. doi: 10.1016/S0140-6736(20)30752-2
3. Kivimaki M, Kuosma E, Ferrie JE, Luukkonen R, Nyberg ST, Alfredsson L, et al. Overweight, obesity, and risk of cardiometabolic multimorbidity: pooled analysis of individual-level data for 120–813 adults from 16 cohort studies from the USA and Europe. Lancet Public Health. (2017) 2:e277–e85. doi: 10.1016/S2468-2667(17)30074-9
4. Han Y, Hu Y, Yu C, Guo Y, Pei P, Yang L, et al. Lifestyle, cardiometabolic disease, and multimorbidity in a prospective Chinese study. Eur Heart J. (2021) 42:3374–84. doi: 10.1093/eurheartj/ehab413
5. Emerging Risk Factors C, Di Angelantonio E, Kaptoge S, Wormser D, Willeit P, Butterworth AS, et al. Association of cardiometabolic multimorbidity with mortality. JAMA. (2015) 314:52–60. doi: 10.1001/jama.2015.7008
6. Sharma AM. M, M, M & M: a mnemonic for assessing obesity. Obes Rev. (2010) 11:808–9. doi: 10.1111/j.1467-789X.2010.00766.x
7. Arnlöv J, Ingelsson E, Sundström J, and Lind L. Impact of body mass index and the metabolic syndrome on the risk of cardiovascular disease and death in middle-aged men. Circulation. (2010) 121:230–6. doi: 10.1161/CIRCULATIONAHA.109.887521
8. Liu Y, Douglas PS, Lip GYH, Thabane L, Li L, Ye Z, et al. Relationship between obesity severity, metabolic status and cardiovascular disease in obese adults. Eur J Clin Invest. (2023) 53:e13912. doi: 10.1111/eci.13912
9. Stefan N, Yki-Järvinen H, and Neuschwander-Tetri BA. Metabolic dysfunction-associated steatotic liver disease: heterogeneous pathomechanisms and effectiveness of metabolism-based treatment. Lancet Diabetes Endocrinol. (2025) 13:134–48. doi: 10.1016/S2213-8587(24)00318-8
10. Meigs JB, Wilson PW, Fox CS, Vasan RS, Nathan DM, Sullivan LM, et al. Body mass index, metabolic syndrome, and risk of type 2 diabetes or cardiovascular disease. J Clin Endocrinol Metab. (2006) 91:2906–12. doi: 10.1210/jc.2006-0594
11. Piche ME, Tchernof A, and Despres JP. Obesity phenotypes, diabetes, and cardiovascular diseases. Circ Res. (2020) 126:1477–500. doi: 10.1161/CIRCRESAHA.120.316101
12. Wang L, Zhou B, Zhao Z, Yang L, Zhang M, Jiang Y, et al. Body-mass index and obesity in urban and rural China: findings from consecutive nationally representative surveys during 2004-18. Lancet. (2021) 398:53–63. doi: 10.1016/S0140-6736(21)00798-4
13. Kramer CK, Zinman B, and Retnakaran R. Are metabolically healthy overweight and obesity benign conditions?: A systematic review and meta-analysis. Ann Intern Med. (2013) 159:758–69. doi: 10.7326/0003-4819-159-11-201312030-00008
14. Greenhill C. Redefining metabolically healthy obesity. Nat Rev Endocrinol. (2018) 14:440. doi: 10.1038/s41574-018-0046-9
15. Bluher M. Metabolically healthy obesity. Endocr Rev. (2020) 41:bnaa004. doi: 10.1210/endrev/bnaa004
16. Despres JP. Taking a closer look at metabolically healthy obesity. Nat Rev Endocrinol. (2022) 18:131–2. doi: 10.1038/s41574-021-00619-6
17. van Vliet-Ostaptchouk JV, Nuotio ML, Slagter SN, Doiron D, Fischer K, Foco L, et al. The prevalence of metabolic syndrome and metabolically healthy obesity in Europe: a collaborative analysis of ten large cohort studies. BMC Endocr Disord. (2014) 14:9. doi: 10.1186/1472-6823-14-9
18. Magkos F. Metabolically healthy obesity: what’s in a name? Am J Clin Nutr. (2019) 110:533–9. doi: 10.1093/ajcn/nqz133
19. Lavie CJ, Laddu D, Arena R, Ortega FB, Alpert MA, and Kushner RF. Healthy weight and obesity prevention: JACC health promotion series. J Am Coll Cardiol. (2018) 72:1506–31. doi: 10.1016/j.jacc.2018.08.1037
20. Simental-Mendia LE, Rodriguez-Moran M, and Guerrero-Romero F. The product of fasting glucose and triglycerides as surrogate for identifying insulin resistance in apparently healthy subjects. Metab Syndr Relat Disord. (2008) 6:299–304. doi: 10.1089/met.2008.0034
21. Khan SH, Sobia F, Niazi NK, Manzoor SM, Fazal N, and Ahmad F. Metabolic clustering of risk factors: evaluation of Triglyceride-glucose index (TyG index) for evaluation of insulin resistance. Diabetol Metab Syndr. (2018) 10:74. doi: 10.1186/s13098-018-0376-8
22. Dong S, Zhao Z, Huang X, Ma M, Yang Z, Fan C, et al. Triglyceride-glucose index is associated with poor prognosis in acute coronary syndrome patients with prior coronary artery bypass grafting undergoing percutaneous coronary intervention. Cardiovasc Diabetol. (2023) 22:286. doi: 10.1186/s12933-023-02029-6
23. da Silva A, Caldas APS, Hermsdorff HHM, Bersch-Ferreira ÂC, Torreglosa CR, Weber B, et al. Triglyceride-glucose index is associated with symptomatic coronary artery disease in patients in secondary care. Cardiovasc Diabetol. (2019) 18:89. doi: 10.1186/s12933-019-0893-2
24. Luo E, Wang D, Yan G, Qiao Y, Liu B, Hou J, et al. High triglyceride-glucose index is associated with poor prognosis in patients with acute ST-elevation myocardial infarction after percutaneous coronary intervention. Cardiovasc Diabetol. (2019) 18:150. doi: 10.1186/s12933-019-0957-3
25. Stefan N and Schulze MB. Metabolic health and cardiometabolic risk clusters: implications for prediction, prevention, and treatment. Lancet Diabetes Endocrinol. (2023) 11:426–40. doi: 10.1016/S2213-8587(23)00086-4
26. Park K, Ahn CW, Lee SB, Kang S, Nam JS, Lee BK, et al. Elevated TyG index predicts progression of coronary artery calcification. Diabetes Care. (2019) 42:1569–73. doi: 10.2337/dc18-1920
27. Wang L, Cong HL, Zhang JX, Hu YC, Wei A, Zhang YY, et al. Triglyceride-glucose index predicts adverse cardiovascular events in patients with diabetes and acute coronary syndrome. Cardiovasc Diabetol. (2020) 19:80. doi: 10.1186/s12933-020-01054-z
28. Huang Z, Chen Z, Wang X, Ding X, Cai Z, Li W, et al. Association of cardiovascular health score trajectory with incident myocardial infarction in hypertensive patients. Hypertension. (2022) 79:2622–30. doi: 10.1161/HYPERTENSIONAHA.122.19633
29. Li W, Huang Z, Fang W, Wang X, Cai Z, Chen G, et al. Remnant cholesterol variability and incident ischemic stroke in the general population. Stroke. (2022) 53:1934–41. doi: 10.1161/STROKEAHA.121.037756
30. Shiwaku K, Anuurad E, Enkhmaa B, Kitajima K, and Yamane Y. Appropriate BMI for Asian populations. Lancet. (2004) 363:1077. doi: 10.1016/S0140-6736(04)15856-X
31. Consultation WE. Appropriate body-mass index for Asian populations and its implications for policy and intervention strategies. Lancet. (2004) 363:157–63. doi: 10.1016/S0140-6736(03)15268-3
32. Department of Medical Administration, National Health Commission of the People's Republic of China. Chinese guidelines for the clinical management of obesity (2024 edition). Med J Peking Union Med Coll Hosp. (2025) 16(1):90–108. doi: 10.12290/xhyxzz.2024-0918
33. Huo RR, Liao Q, Zhai L, You XM, and Zuo YL. Interacting and joint effects of triglyceride-glucose index (TyG) and body mass index on stroke risk and the mediating role of TyG in middle-aged and older Chinese adults: a nationwide prospective cohort study. Cardiovasc Diabetol. (2024) 23:30. doi: 10.1186/s12933-024-02122-4
34. Sun Q, Ren Q, Du L, Chen S, Wu S, Zhang B, et al. Cardiometabolic Index (CMI), Lipid Accumulation Products (LAP), Waist Triglyceride Index (WTI) and the risk of acute pancreatitis: a prospective study in adults of North China. Lipids Health Dis. (2023) 22. doi: 10.1186/s12944-023-01948-3
35. Zheng M, Zhang X, Chen S, Song Y, Zhao Q, Gao X, et al. Arterial stiffness preceding diabetes: A longitudinal study. Circ Res. (2020) 127:1491–8. doi: 10.1161/CIRCRESAHA.120.317950
36. Geng T, Xu W, Gao H, Zhang J, Zou J, Wang K, et al. Relationship between control of cardiovascular risk factors and chronic kidney disease progression, cardiovascular disease events, and mortality in Chinese adults. J Am Coll Cardiol. (2024) 84:1313–24. doi: 10.1016/j.jacc.2024.06.041
37. Wang X, Feng B, Huang Z, Cai Z, Yu X, Chen Z, et al. Relationship of cumulative exposure to the triglyceride-glucose index with ischemic stroke: a 9-year prospective study in the Kailuan cohort. Cardiovasc Diabetol. (2022) 21:66. doi: 10.1186/s12933-022-01510-y
38. Wu W, Chen Y, Wu K, Zheng H, Chen G, Wang X, et al. Accumulated exposure to high non-high-density lipoprotein cholesterol increases the risk of cardiovascular diseases in hypertensive individuals: An 11-year prospective cohort study. Clin Exp Hypertens. (2023) 45:2264540. doi: 10.1080/10641963.2023.2264540
39. Roth GA, Mensah GA, Johnson CO, Addolorato G, Ammirati E, Baddour LM, et al. Global burden of cardiovascular diseases and risk factors, 1990-2019: update from the GBD 2019 study. J Am Coll Cardiol. (2020) 76:2982–3021. doi: 10.1016/j.jacc.2020.11.010
40. Wang Z, Chen Z, Zhang L, Wang X, Hao G, Zhang Z, et al. Status of hypertension in China: results from the China hypertension survey, 2012-2015. Circulation. (2018) 137:2344–56. doi: 10.1161/CIRCULATIONAHA.117.032380
41. Genuth S. Follow-up report on the diagnosis of diabetes mellitus. Diabetes Care Diabetes Care 2003. (2003) 26:3160–7. doi: 10.2337/diacare.26.11.3160
42. Grundy SM, Stone NJ, Bailey AL, Beam C, Birtcher KK, Blumenthal RS, et al. 2018 AHA/ACC/AACVPR/AAPA/ABC/ACPM/ADA/AGS/APhA/ASPC/NLA/PCNA guideline on the management of blood cholesterol: executive summary: A report of the American college of cardiology/American heart association task force on clinical practice guidelines. J Am Coll Cardiol. (2019) 73:3168–209. doi: 10.1016/j.jacc.2018.11.002
43. Wang X, Chen Y, Huang Z, Cai Z, Yu X, Chen Z, et al. Visit-to-visit variability in triglyceride-glucose index and diabetes: A 9-year prospective study in the Kailuan Study. Front Endocrinol (Lausanne). (2022) 13:1054741. doi: 10.3389/fendo.2022.1054741
44. Sterne JA, White IR, Carlin JB, Spratt M, Royston P, Kenward MG, et al. Multiple imputation for missing data in epidemiological and clinical research: potential and pitfalls. BMJ. (2009) 338:b2393. doi: 10.1136/bmj.b2393
45. Lee ML and Whitmore GA. Proportional hazards and threshold regression: their theoretical and practical connections. Lifetime Data Anal. (2010) 16:196–214. doi: 10.1007/s10985-009-9138-0
46. Tsatsoulis A and Paschou SA. Metabolically healthy obesity: criteria, epidemiology, controversies, and consequences. Curr Obes Rep. (2020) 9:109–20. doi: 10.1007/s13679-020-00375-0
47. Wang A, Tian X, Zuo Y, Chen S, Meng X, Wu S, et al. Change in triglyceride-glucose index predicts the risk of cardiovascular disease in the general population: a prospective cohort study. Cardiovasc Diabetol. (2021) 20:113. doi: 10.1186/s12933-021-01305-7
48. Tian Y, Sun J, Qiu M, Lu Y, Qian X, Sun W, et al. Association between the triglyceride-glucose index and albuminuria in hypertensive individuals. Clin Exp Hypertens. (2023) 45:2150204. doi: 10.1080/10641963.2022.2150204
49. Xu W, Zhao H, Gao L, Guo L, Liu J, Li H, et al. Association of long-term triglyceride-glucose index level and change with the risk of cardiometabolic diseases. Front Endocrinol (Lausanne). (2023) 14:1148203. doi: 10.3389/fendo.2023.1148203
50. Chen W, Ding S, Tu J, Xiao G, Chen K, Zhang Y, et al. Association between the insulin resistance marker TyG index and subsequent adverse long-term cardiovascular events in young and middle-aged US adults based on obesity status. Lipids Health Dis. (2023) 22:65. doi: 10.1186/s12944-023-01834-y
51. Cho YK, Kim HS, Park JY, Lee WJ, Kim YJ, and Jung CH. Triglyceride-glucose index predicts cardiovascular outcome in metabolically unhealthy obese population: A nationwide population-based cohort study. J Obes Metab Syndr. (2022) 31:178–86. doi: 10.7570/jomes21086
52. Wu Z, Hilowle AM, Zhou Y, Zhao C, and Yang S. Delving into biomarkers and predictive modeling for CVD mortality: a 20-year cohort study. Sci Rep. (2025) 15:4134. doi: 10.1038/s41598-025-88790-y
53. Schutte AE, Kollias A, and Stergiou GS. Blood pressure and its variability: classic and novel measurement techniques. Nat Rev Cardiol. (2022) 19:643–54. doi: 10.1038/s41569-022-00690-0
54. Mauvais-Jarvis F, Bairey Merz N, Barnes PJ, Brinton RD, Carrero JJ, DeMeo DL, et al. Sex and gender: modifiers of health, disease, and medicine. Lancet. (2020) 396:565–82. doi: 10.1016/S0140-6736(20)31561-0
55. Anderson WD, Soh JY, Innis SE, Dimanche A, Ma L, Langefeld CD, et al. Sex differences in human adipose tissue gene expression and genetic regulation involve adipogenesis. Genome Res. (2020) 30:1379–92. doi: 10.1101/gr.264614.120
56. Day EA, Ford RJ, and Steinberg GR. AMPK as a therapeutic target for treating metabolic diseases. Trends Endocrinol Metab. (2017) 28:545–60. doi: 10.1016/j.tem.2017.05.004
57. Ortega FB, Cadenas-Sanchez C, Migueles JH, Labayen I, Ruiz JR, Sui X, et al. Role of physical activity and fitness in the characterization and prognosis of the metabolically healthy obesity phenotype: A systematic review and meta-analysis. Prog Cardiovasc Dis. (2018) 61:190–205. doi: 10.1016/j.pcad.2018.07.008
58. Smith GI, Mittendorfer B, and Klein S. Metabolically healthy obesity: facts and fantasies. J Clin Invest. (2019) 129:3978–89. doi: 10.1172/JCI129186
59. Stefan N, Schick F, Birkenfeld AL, Häring HU, and White MF. The role of hepatokines in NAFLD. Cell Metab. (2023) 35:236–52. doi: 10.1016/j.cmet.2023.01.006
60. Klöting N, Fasshauer M, Dietrich A, Kovacs P, Schön MR, Kern M, et al. Insulin-sensitive obesity. Am J Physiol Endocrinol Metab. (2010) 299:E506–15. doi: 10.1152/ajpendo.00586.2009
61. Ghaben AL and Scherer PE. Adipogenesis and metabolic health. Nat Rev Mol Cell Biol. (2019) 20:242–58. doi: 10.1038/s41580-018-0093-z
62. Blüher M. Adipose tissue dysfunction contributes to obesity related metabolic diseases. Best Pract Res Clin Endocrinol Metab. (2013) 27:163–77. doi: 10.1016/j.beem.2013.02.005
63. Blüher M. Adipose tissue dysfunction in obesity. Exp Clin Endocrinol Diabetes. (2009) 117:241–50. doi: 10.1055/s-0029-1192044
Keywords: triglyceride-glucose index, metabolically healthy obese, cardiometabolic disease, diabetes, stroke, coronary heart disease
Citation: Chen Y, Wu W, Cai Z, Wu K, Zheng H, Fu P, Wang Y, Wang X, Lan Y, Chen S, Wu S and Chen Y (2025) Association between triglyceride-glucose index and the risk of cardiometabolic diseases in metabolically healthy obese individuals: a prospective cohort study. Front. Endocrinol. 16:1524786. doi: 10.3389/fendo.2025.1524786
Received: 08 November 2024; Accepted: 27 April 2025;
Published: 19 May 2025.
Edited by:
Yashendra Sethi, PearResearch, IndiaReviewed by:
Emmanouil Korakas, University General Hospital Attikon, GreeceNorbert Stefan, University of Tübingen, Germany
Copyright © 2025 Chen, Wu, Cai, Wu, Zheng, Fu, Wang, Wang, Lan, Chen, Wu and Chen. This is an open-access article distributed under the terms of the Creative Commons Attribution License (CC BY). The use, distribution or reproduction in other forums is permitted, provided the original author(s) and the copyright owner(s) are credited and that the original publication in this journal is cited, in accordance with accepted academic practice. No use, distribution or reproduction is permitted which does not comply with these terms.
*Correspondence: Shouling Wu, ZHJ3dXNsQDE2My5jb20=; Youren Chen, eXJjaGVuM0BzdHUuZWR1LmNu
†These authors have contributed equally to this work