 Yani Ke1,2,3†
 Yuyan Pan2,3,4†Xueru Huang1,2,3†Xing Bai1,2,3Xiaojuan Liu1,2,3Mingsi Zhang5Tao Jiang1,2,3*
 Guangji Zhang1,2,3*
- 1School of Basic Medical Sciences, Zhejiang Chinese Medical University, Hangzhou, Zhejiang, China
- 2Key Laboratory of Blood-stasis-toxin Syndrome of Zhejiang Province, Hangzhou, Zhejiang, China
- 3Traditional Chinese Medicine “Preventing Disease” Wisdom Health Project Research Center of Zhejiang, Hangzhou, Zhejiang, China
- 4The First Affiliated Hospital of Zhejiang Chinese Medical University (Zhejiang Provincial Hospital of Traditional Chinese Medicine), Hangzhou, Zhejiang, China
- 5School of Sport, Exercise and Health Sciences, Epinal Way, Loughborough University, Loughborough, Leicestershire, United Kingdom
Background: Hepatocellular carcinoma (HCC) is among the most common malignant tumors, characterized by high incidence and mortality rates. The role of adipokines in liver diseases is increasingly recognized and involves multiple contributing factors. Therefore, we summarized the relationship between circulating adipokines and HCC to guide directions for future research.
Methods: Six databases were searched, and all data were presented as standardized mean difference (SMD) or weighted mean difference (WMD). Sensitivity analysis and meta-regression were also performed. Diagnostic meta-analysis results were primarily presented using receiver operating characteristic (ROC) curves.
Results: A total of 41 articles were included in this meta-analysis. HCC patients had significantly higher levels of circulating adiponectin, leptin, visfatin, and resistin compared to the controls (SMD = 1.6, 95% CI: 0.65-2.56; SMD = 2.45, 95% CI: 1.59-3.31; SMD = 2.49, 95% CI: 1.32-3.65; SMD = 4.17, 95% CI: 3.17-5.17, respectively). Conversely, circulating irisin levels in HCC patients were significantly lower than those in the control group (WMD = -1.16, 95% CI: -1.55, -0.77). Subgroup analysis identified possible sources of heterogeneity, whereas meta-regression confirmed that only the presence or absence of viral hepatitis was the source of high heterogeneity among leptin-related studies. Additionally, the meta-analysis results of diagnostic studies show that circulating visfatin demonstrates good diagnostic value for HCC, which may be helpful for clinical practice.
Conclusion: There is a significant association between circulating adipokines and HCC, and the presence of viral hepatitis is an influencing factor. Most adipokines are differentially expressed in HCC patients, and some may serve as biomarkers for early diagnosis or prognostic assessment.
Systematic review registration: https://www.crd.york.ac.uk/PROSPERO/, identifier CRD42023492972.
Introduction
Hepatocellular carcinoma (HCC) is one of the most common cancers worldwide, accounting for about 90% of all primary liver cancer cases (1, 2). It ranks sixth in incidence worldwide and is the second leading cause of cancer-related deaths (3, 4). The development of HCC is considered a multi-step pathological process that progresses from chronic hepatitis to cirrhosis (5), with various etiologies and triggers, including aflatoxin-contaminated food, excessive alcohol consumption, and obesity (6). In clinical management, the prognosis and treatment of HCC depend on tumor staging: early-stage HCC can be treated with local ablation, surgical resection, and liver transplantation, intermediate-stage HCC is typically treated with chemoembolization, while advanced-stage HCC is managed with systemic chemotherapy, tyrosine kinase inhibitors (TKIs), and immunotherapy (7). Due to the lack of specific early screening and diagnostic biomarkers, HCC is often diagnosed at an advanced stage, resulting in missed opportunities for optimal treatment or a high risk of recurrence after resection (8). Therefore, a deeper understanding of the mechanisms underlying HCC and the identification of effective biomarkers for early diagnosis and prognosis are crucial for clinical practice.
Adipokines are peptides produced by adipose tissue. They have autocrine, paracrine, and endocrine functions (9, 10), and regulate various physiological systems. Because the liver plays a central role in systemic lipid and glucose metabolism, hepatocytes are highly susceptible to ectopic lipid accumulation (11). Many studies have shown that adipokines can regulate liver function: changes in adipokines occur during adipose tissue expansion and contribute to the development of nonalcoholic steatohepatitis (NASH) and may lead to cirrhosis, ultimately evolving into HCC (12, 13). However, many current studies on the expression of circulating adipokines in patients with HCC report inconsistent or conflicting results. Moreover, fatty infiltration has been identified in HCC with high differentiation (14) and a steatohepatitic subtype of HCC has also been defined (15), but whether adipokines affect it and to what extent adipokines affect it are still unclear. A deeper understanding of the relationship between adipokines and HCC may support their use as non-invasive biomarkers for early screening and diagnosis, and provide real-time detection tools for HCC treatment and prognosis. Therefore, we conducted a systematic review and meta-analysis of common circulating adipokines in HCC to explore their clinical and scientific value from multiple perspectives.
Method
Literature search
This study adheres to the PRISMA guidelines, as detailed in Additional File 1. The registered protocol is available on the PROSPERO website (registration number: CRD42023492972) and detailed in Additional File 2. Two members of the team searched a total of six databases, including PubMed, Embase, Cochrane Library, CNKI, Wanfang, and CBM. The search was conducted up to December 18, 2024, in both English and Chinese. The search strategy combined MeSH terms with free words, and the main keywords included “HCC”, “hepatocellular carcinoma”, “hepatic cancer”, “adipokine”, “adiponectin”, “leptin”, “visfatin”, “resistin”, “irisin”, “chemerin” and “apelin”. The selection of adipokines was based on articles on liver diseases (9, 10, 16). The specific retrieval strategies for different databases are presented in Additional File 3. Additionally, the references of the included articles were also screened manually. For articles with incomplete information or inaccessible full text, we attempted to contact the corresponding authors via email.
Study selection
The search results from each database were independently browsed and filtered by two members. Any disagreements were resolved by a third reviewer in accordance with the protocol. The specific rules are as follows:
Studies were included if they met all of the following criteria: (1) The research subjects are patients with HCC; (2) The control group includes healthy individuals without HCC and other serious diseases (such as other cancers, severe diseases of the heart, brain, and other organs, etc.), aged ≥ 18; (3) The result must contain one or more circulating adipokines (including adiponectin, apelin, chemerin, leptin, visfatin, resistance and irisin); (4) cohort study or case-control study.
The study was excluded if any of the following conditions were met: (1) The control group includes patients with other liver diseases (such as cirrhosis, after liver transplantation, etc.); (2) Non-circulating adipokine results, or adipokine indicators outside our research protocol; (3) Studies performed in the same cohort; (4) Articles with missing key data and inability to contact the original author; (5) Case reports, review articles, or duplicate publications.
Data extraction and quality assessment
Data extraction and quality evaluation were also independently completed by two members, and any uncertainties or disputes were handed over to a third person for judgment. The extracted data included publication year, country or region of the study population, the Newcastle-Ottawa Scale (NOS) score, diagnostic method or basis for HCC, basic information of the case group and control group (number of people, age, gender, etc.), measured values and detection methods of circulating adipokines, comorbidities in the case group, diagnostic analysis results (including sensitivity, specificity, cutoff, and area under receiver operating characteristic (ROC) curve), etc. Among them, NOS score (17, 18) was used to evaluate the methodological quality of the included studies, which includes the assessments of selection, comparability, and exposure.
Statistical analysis
We used various software to analyze data, including Stata12 (StataCorp, in Texas, USA) for basic meta-analysis, and Meta DiSc 1.4 (Clinical Biostatistics Unit, in Madrid, Spain) for diagnostic meta-analysis. The data included in the study were ultimately presented in the form of mean ± standard deviation (SD) and summarized into an Excel 2016 (Microsoft, in Washington, USA). Among them, normally distributed data can be directly used, while non-normally distributed data needed to be evaluated and converted into standard form (18–20) (specific website is https://www.math.hkbu.edu.hk/~tongt/papers/median2mean.html). Considering the inconsistency among units in various studies, most data were presented in the form of standardized mean difference (SMD) and Confidence Intervals (CI). For meta-analysis using the same unit (like μg/ml, ng/l, etc.), weighted mean difference (WMD) and CI were adopted. Heterogeneity was assessed using the I2 test and Cochrane’s Q test, presented in a Galbraith test. The fixed-effect model was suitable when heterogeneity was not significant (I2<50%) (21, 22). When heterogeneity is significant (I2>50%), a random-effect model was used. To further clarify the possible sources of heterogeneity, subgroup analysis and meta-regression would also be applied. The specific application was determined by the number of studies included. Sensitivity analysis was conducted by sequentially excluding individual studies to assess the robustness of the results, which can be used to judge the stability of the summarized research results. Publication bias is also an important aspect that cannot be ignored, so this study used Egger’s test (23) to measure it. If there was a significant publication bias, we would further evaluate the reliability of the results through trim-and-filling method (24). The trim-and-filling method can test the impact of publication bias by iteratively estimating and adding potentially missing studies, ensuring that meta-analysis results are not severely distorted by potential bias, thereby enhancing the reliability and robustness of the research. In addition, the meta-analysis results of diagnostic analysis mainly include the summary results of sensitivity, specificity, positive likelihood ratio (PLR), negative likelihood ratio (NLR), diagnostic odds ratio (DOR), and summary Receiver Operating Characteristic (sROC). Different studies have different threshold effects, which has a significant impact on the results of diagnostic meta-analysis. If the threshold effect is not significant (p>0.05), the heterogeneity differences among studies are not significant, and the results are somewhat convincing. If the threshold effect is significant (p<0.05), the sources of heterogeneity among studies need to be explored. In addition, the diagnostic value of expected indicators is determined by Area Under the Curve (AUC): AUC ≤ 0.5: poor accuracy; 0.5 < AUC ≤ 0.7: moderate accuracy; 0.7 < AUC ≤ 0.9: good accuracy; AUC = 1: perfect accuracy (25).
Results
Study selection
After searching six databases, a total of 5039 articles was found. Duplicate literature was removed, and 4181 articles still needed to be screened. According to the inclusion and exclusion criteria set earlier, 41 studies remained in qualitative synthesis. Among them, 5 studies (26–30) were suitable for data conversion and relevant data were obtained through the methods described earlier (18–20). Furthermore, since one study mentions circulating apelin and one mentions chemerin, only 39 studies were ultimately included in the quantitative analysis. These studies covered various regions in Asia, Africa, and Europe, with a total of 2778 HCC patients and 2637 controls in this meta-analysis. Our study mainly covered five indicators: circulating adiponectin, leptin, visfatin, resistin and irisin. The publication period of the included studies is from 2003 to 2024, with a long time span. The specific information of the included studies can be seen in Table 1 (26–66), and the overall screening process is shown in Figure 1.

Table 1. Baseline characteristics of studies included.
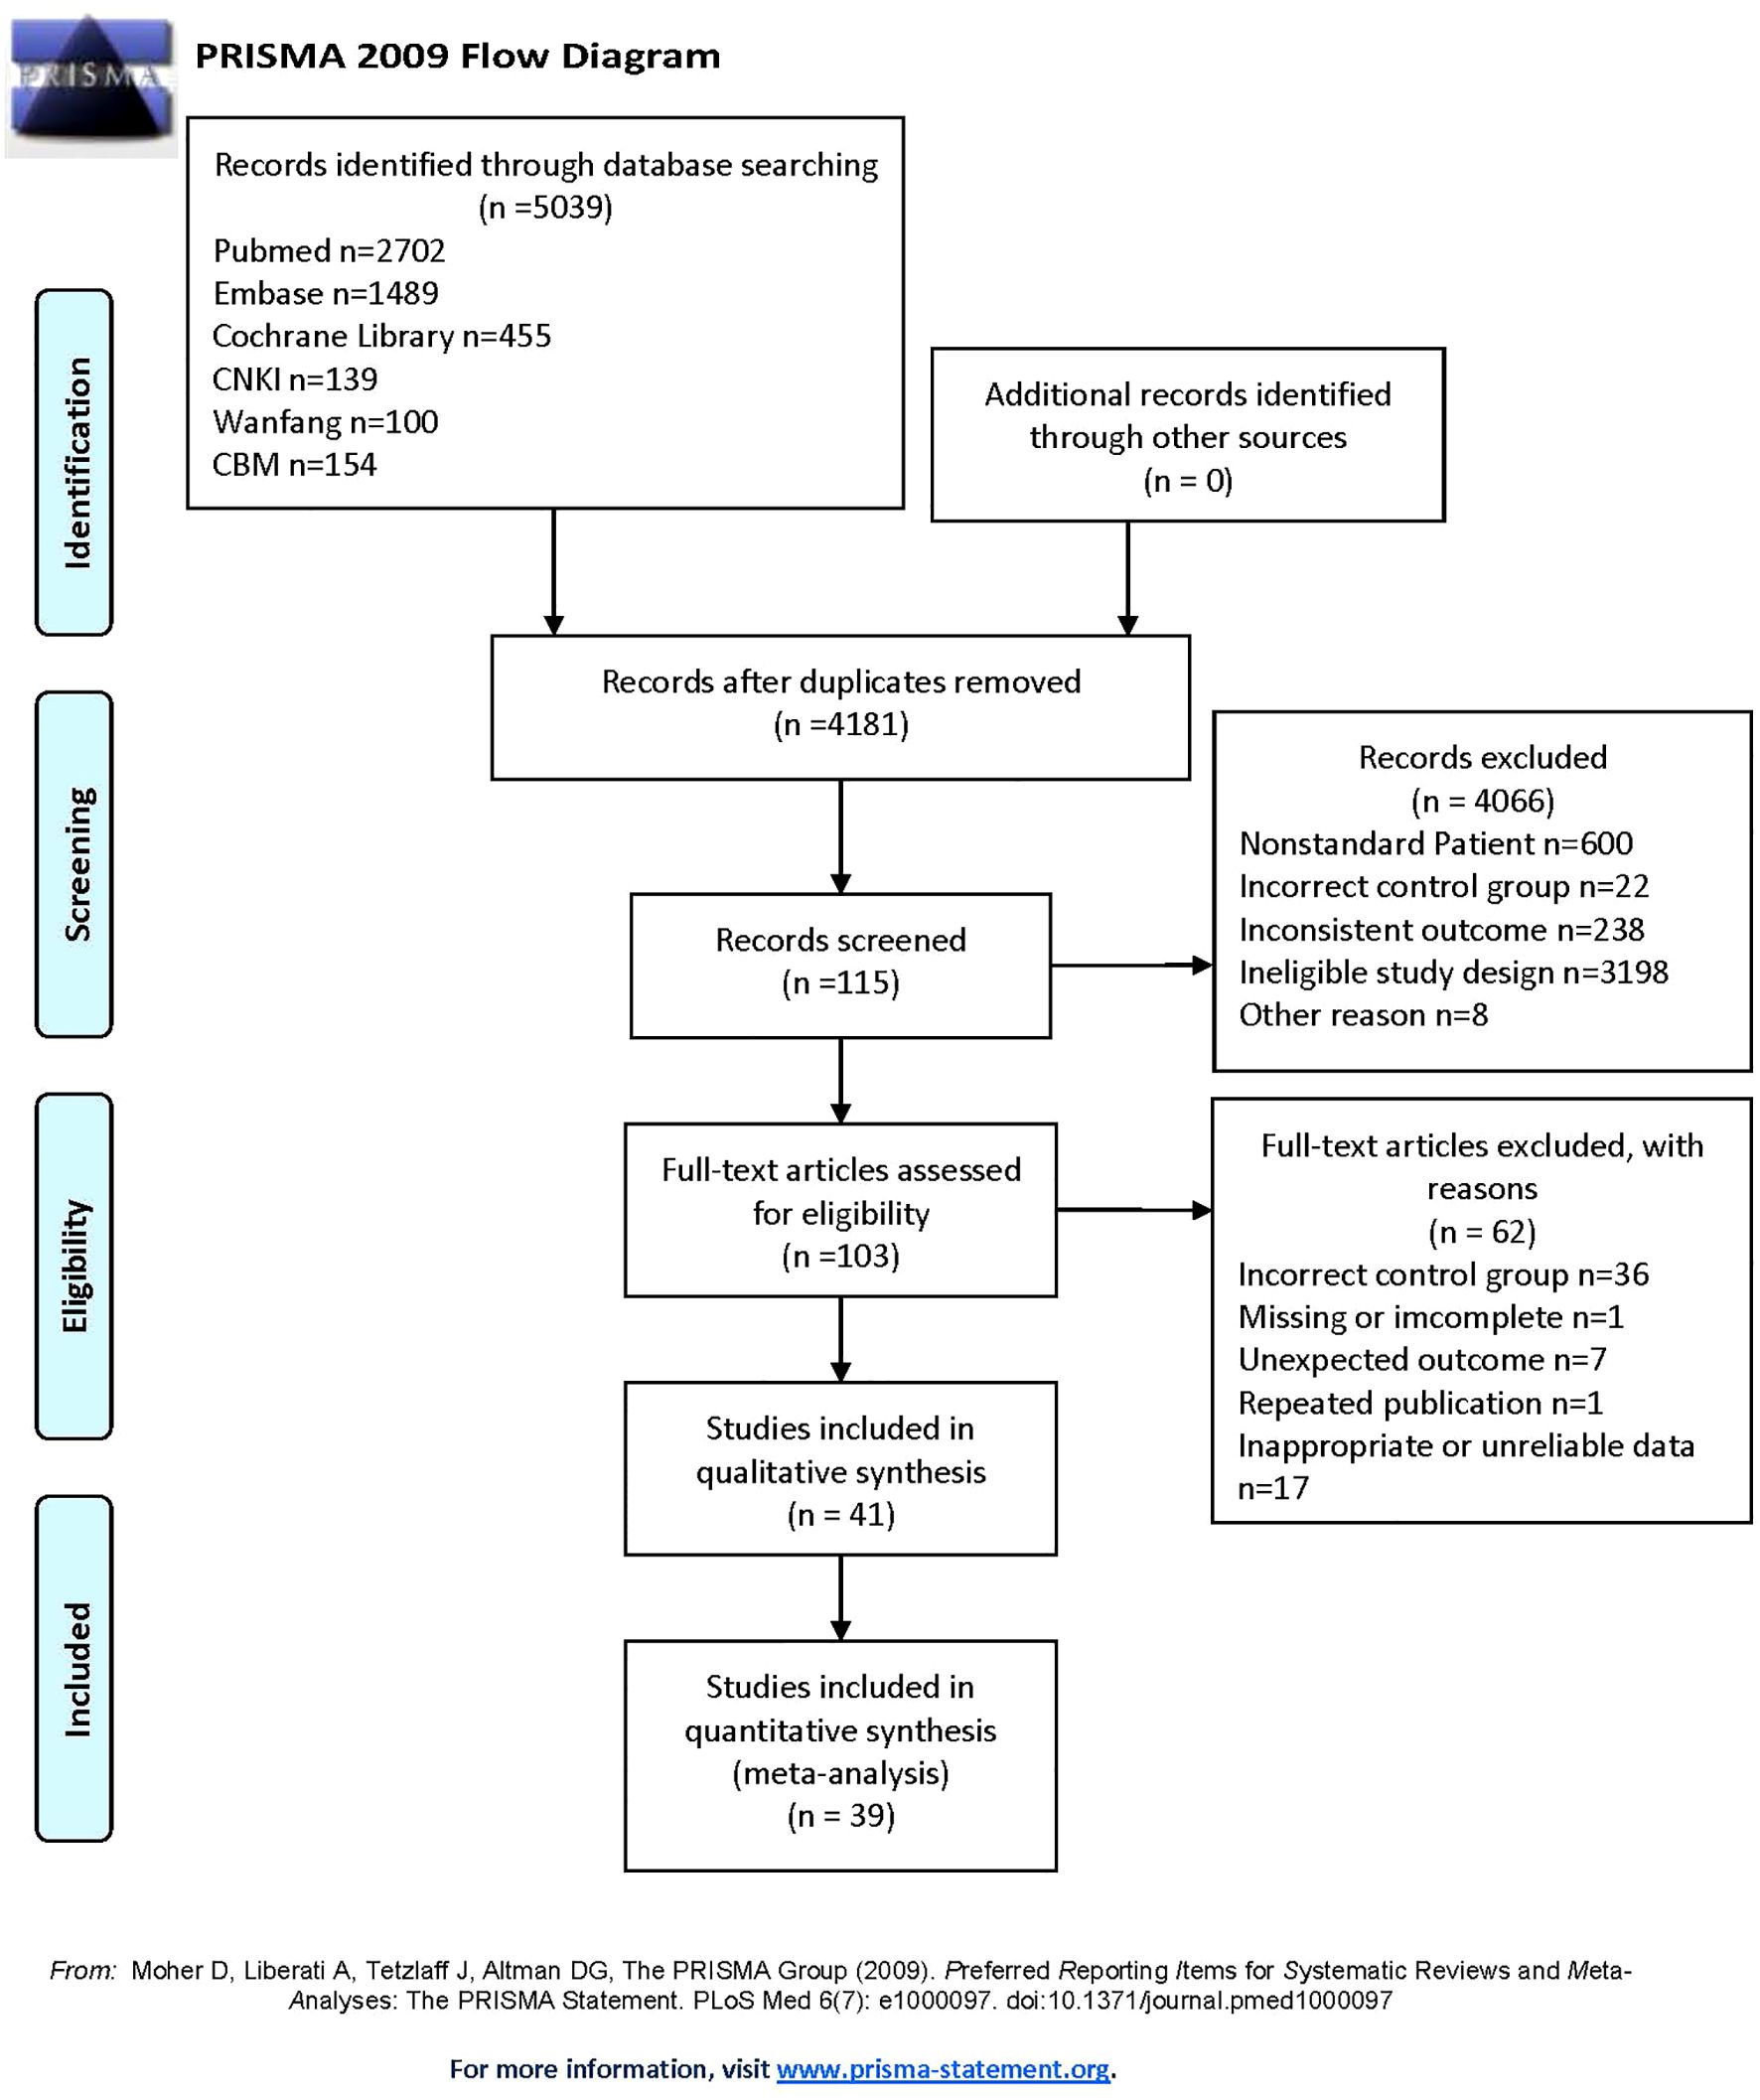
Figure 1. Flowchart of study inclusions and exclusions: PRISMA 2009 flow diagram.
Quality assessment
Two members (XJ L and MS Z) conducted quality evaluation separately, and any disputes were decided by a third person (GJ Z). The NOS scores of the 41 studies (26–66) included vary, with the highest score being 7 and the lowest 5. The average NOS score is 5.71 (shown in Table 2), indicating that most articles adopted a reasonable experimental design and a clear experimental process.
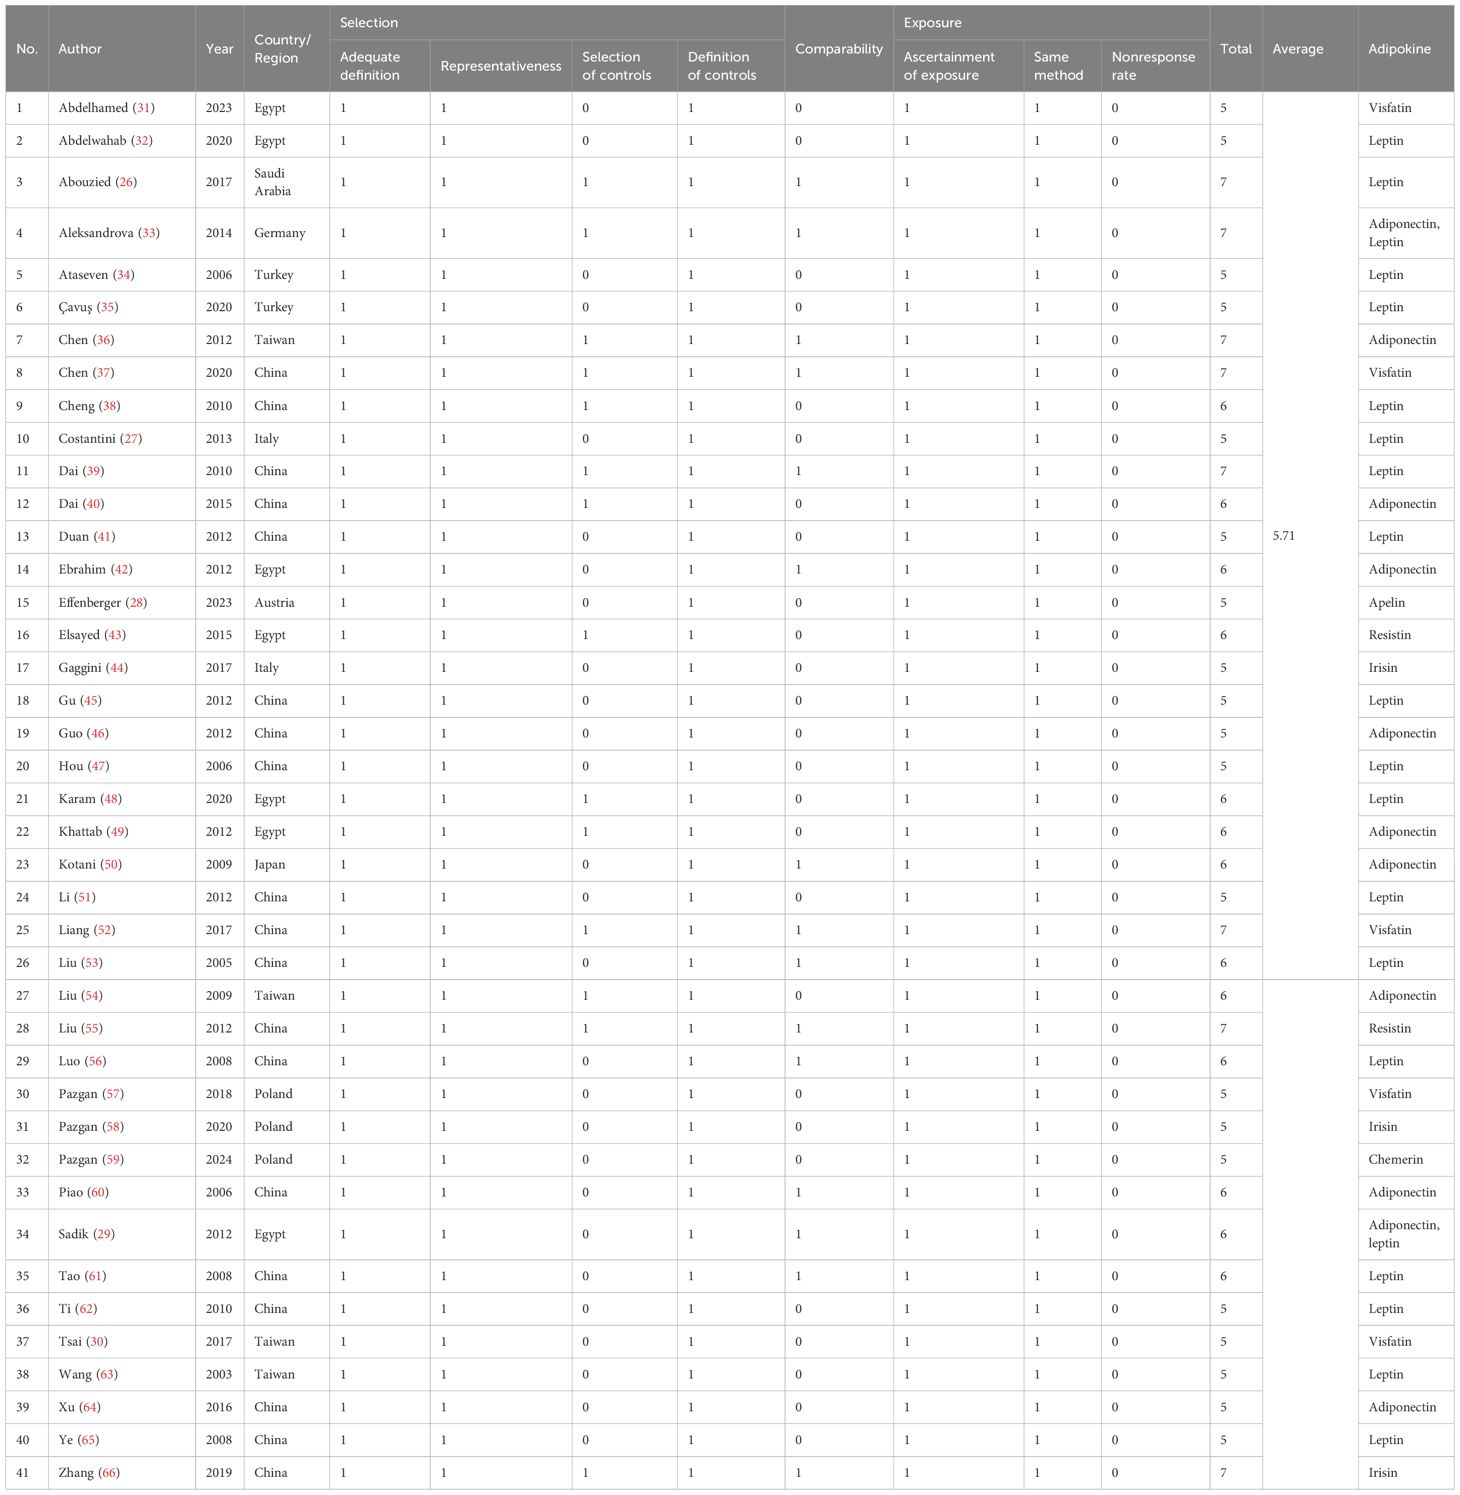
Table 2. NOS score of included studies.
Association between adiponectin and HCC
The meta-analysis of adiponectin and HCC is shown in Figure 2, using the random-effect model. Although there was significant heterogeneity (I2 = 98.7%, p<0.01) among the 11 studies included (12 sets of data), the results clearly showed that circulating adiponectin levels in HCC patients were significantly higher than those in the control group, with SMD 1.6 (0.65-2.56). Meanwhile, the Galbr result also demonstrates high heterogeneity among these studies, as most of them are not within a reasonable range. Therefore, subgroup analysis and meta-regression were performed to identify potential sources of heterogeneity.
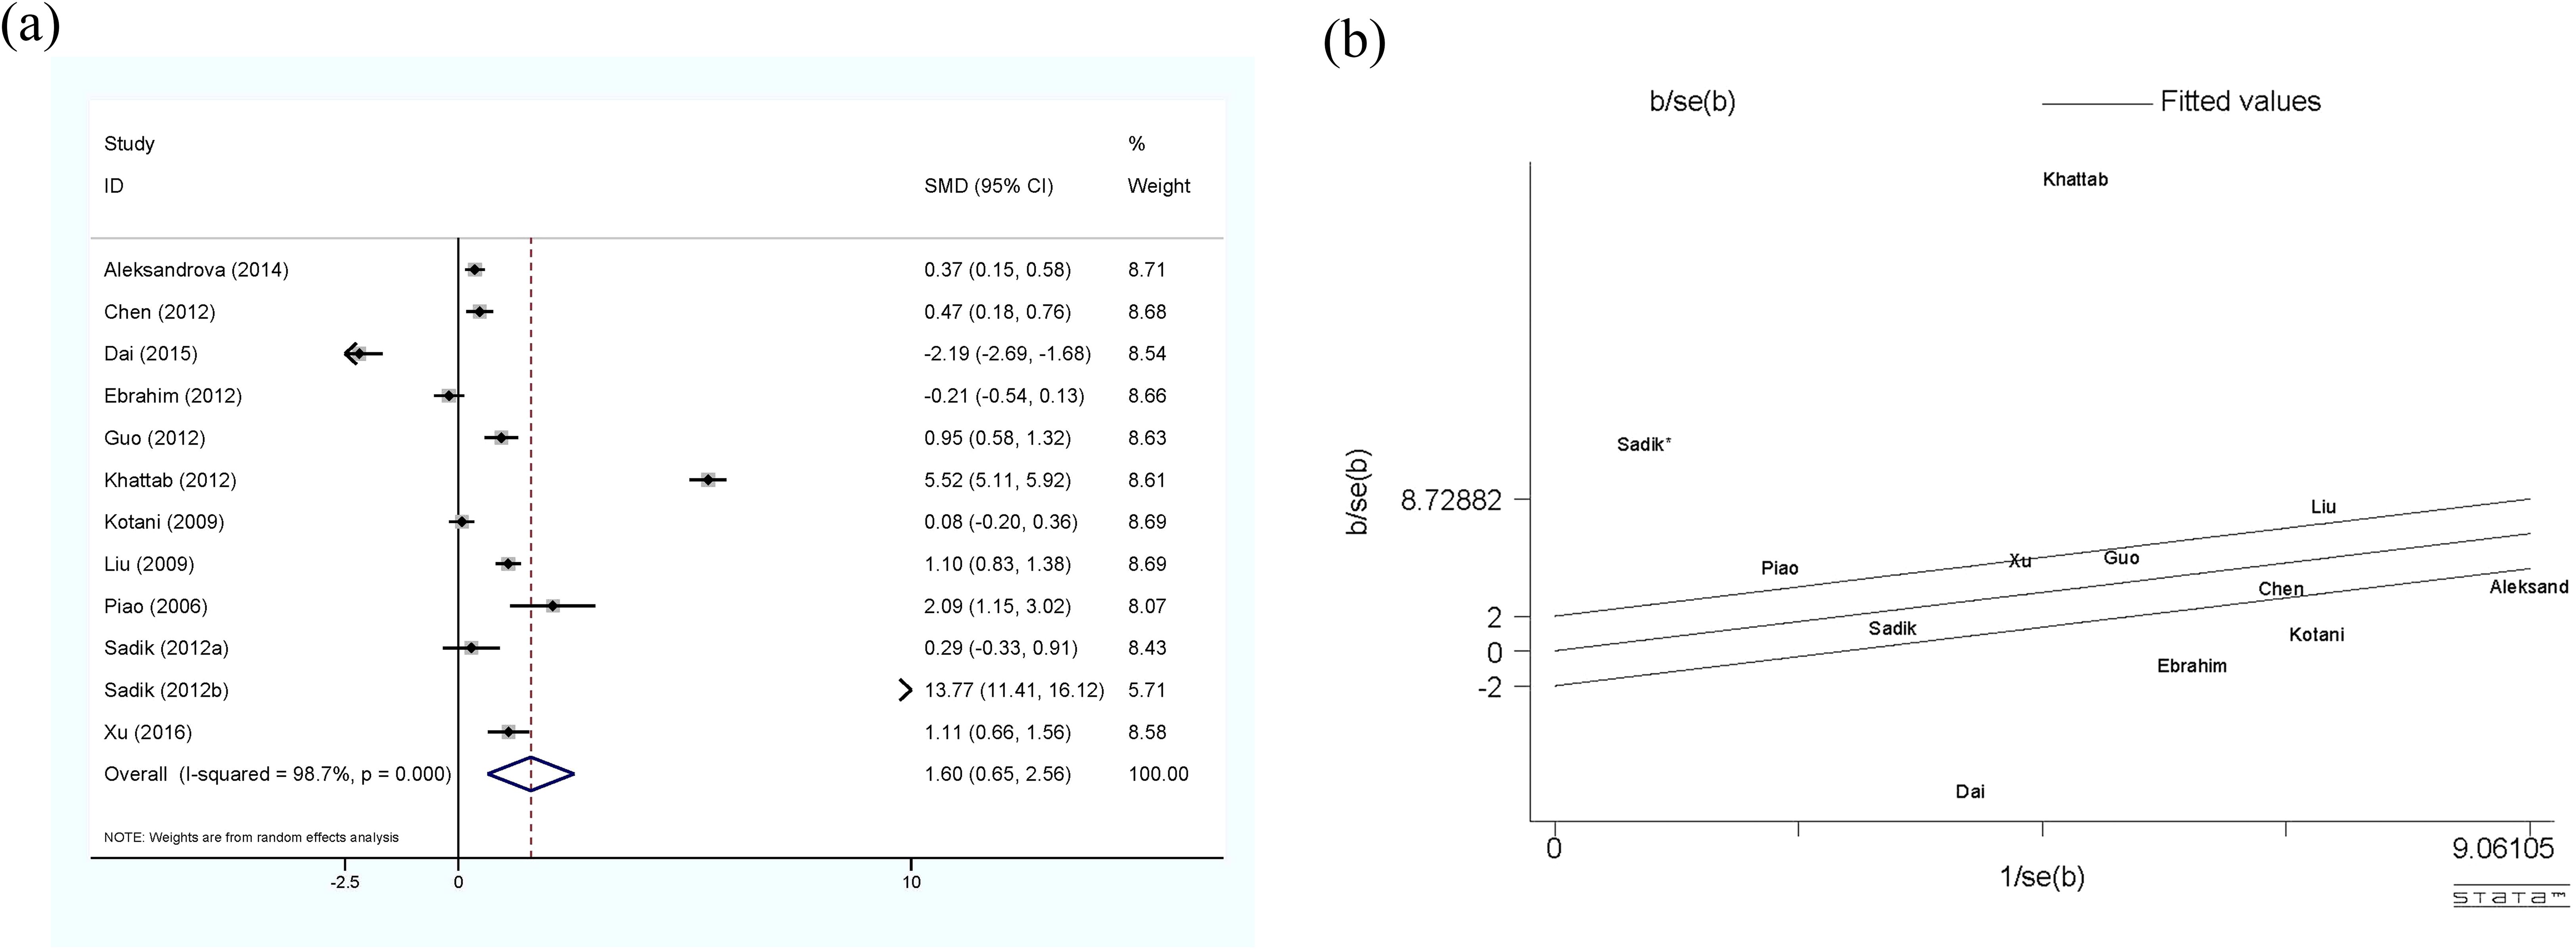
Figure 2. (a) Forest plot of circulating adiponectin levels between HCC and the control group: SMD = 1.65 (0.65, 2.56); (b) Galbraith Test result of circulating adiponectin levels between HCC and the control group: half of the studies included are out of the fitted values. SMD, standardized mean difference; CI, Confidence Intervals.
All subgroup analysis results are presented in Table 3, by stratifying the combined data according to area (East Asia and others), detection method (ELISA and others), age-match (p>0.05 and p<0.05), viral hepatitis (all and not all) and sex. Only one study (49) provides circulating adiponectin levels in HCC patients of different Tumor Node Metastasis (TNM), so this could not be taken as the basis of subgroup analysis. No obvious sources of heterogeneity were found as a result. However, the influence of the area where the HCC group came from and whether HCC was accompanied by viral hepatitis cannot be ignored. There was no significant difference in circulating adiponectin levels between HCC patients from East Asia and the control group (SMD=0.49, 95% CI: -0.23, 1.21), while HCC patients from other regions had significantly higher circulating adiponectin levels than the control group (SMD=3.62, 95% CI: 1.23, 6.01). The result of HCC patients all combined with viral hepatitis (29, 54, 60, 64) showed higher circulating adiponectin levels than the control group (SMD=2.91, 95% CI: 1.46, 4.35), but HCC patients some combined with viral hepatitis (33, 36, 40, 42, 50) had no significant difference in circulating adiponectin levels compared with the control group (SMD=-0.26, 95% CI: -0.91, 0.39). With regard to the studies including HCC patients some combined with viral hepatitis (33, 36, 40, 42, 50), the viral hepatitis rate (HBsAg (+)/anti-HCV Ab (+)/anti-HDV Ab (+)) of each study was as follows: 32%, 90.8%, 85.4%, 76.7% and no specific data available. Thus, to clarify the specific sources of heterogeneity, meta-regression was further performed, with results presented in Table 4. Unfortunately, none of the selected factors were potential sources of heterogeneity (p>0.05), which deserves further attention in the future.

Table 3. Subgroup analysis of circulating adiponectin level in patients with HCC and the control group.
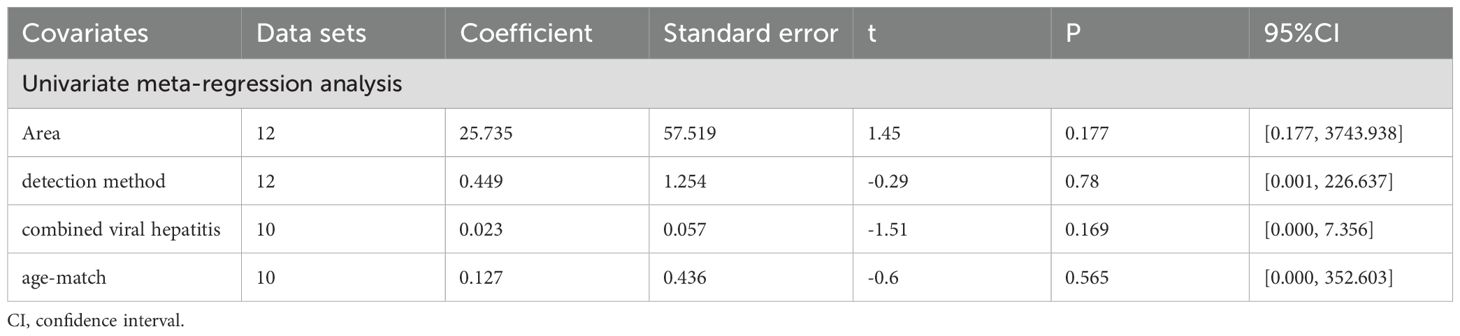
Table 4. Meta-regression of circulating adiponectin levels and HCC.
Association between leptin and HCC
Figure 3 shows a comprehensive meta-analysis of circulating leptin and HCC, which includes 20 studies and 23 sets of data. Due to the presence of high heterogeneity (I2 = 98.4%, p<0.01), the random-effect model was selected. The results confirm that the expression of circulating leptin levels in HCC group is significantly higher than that in the control group, with SMD 2.45 (1.59-3.31). The Galbr plot shows that most studies are not within a reasonable range, indicating the presence of high heterogeneity. Therefore, subgroup analysis and meta-regression became methods for exploring the sources of heterogeneity.
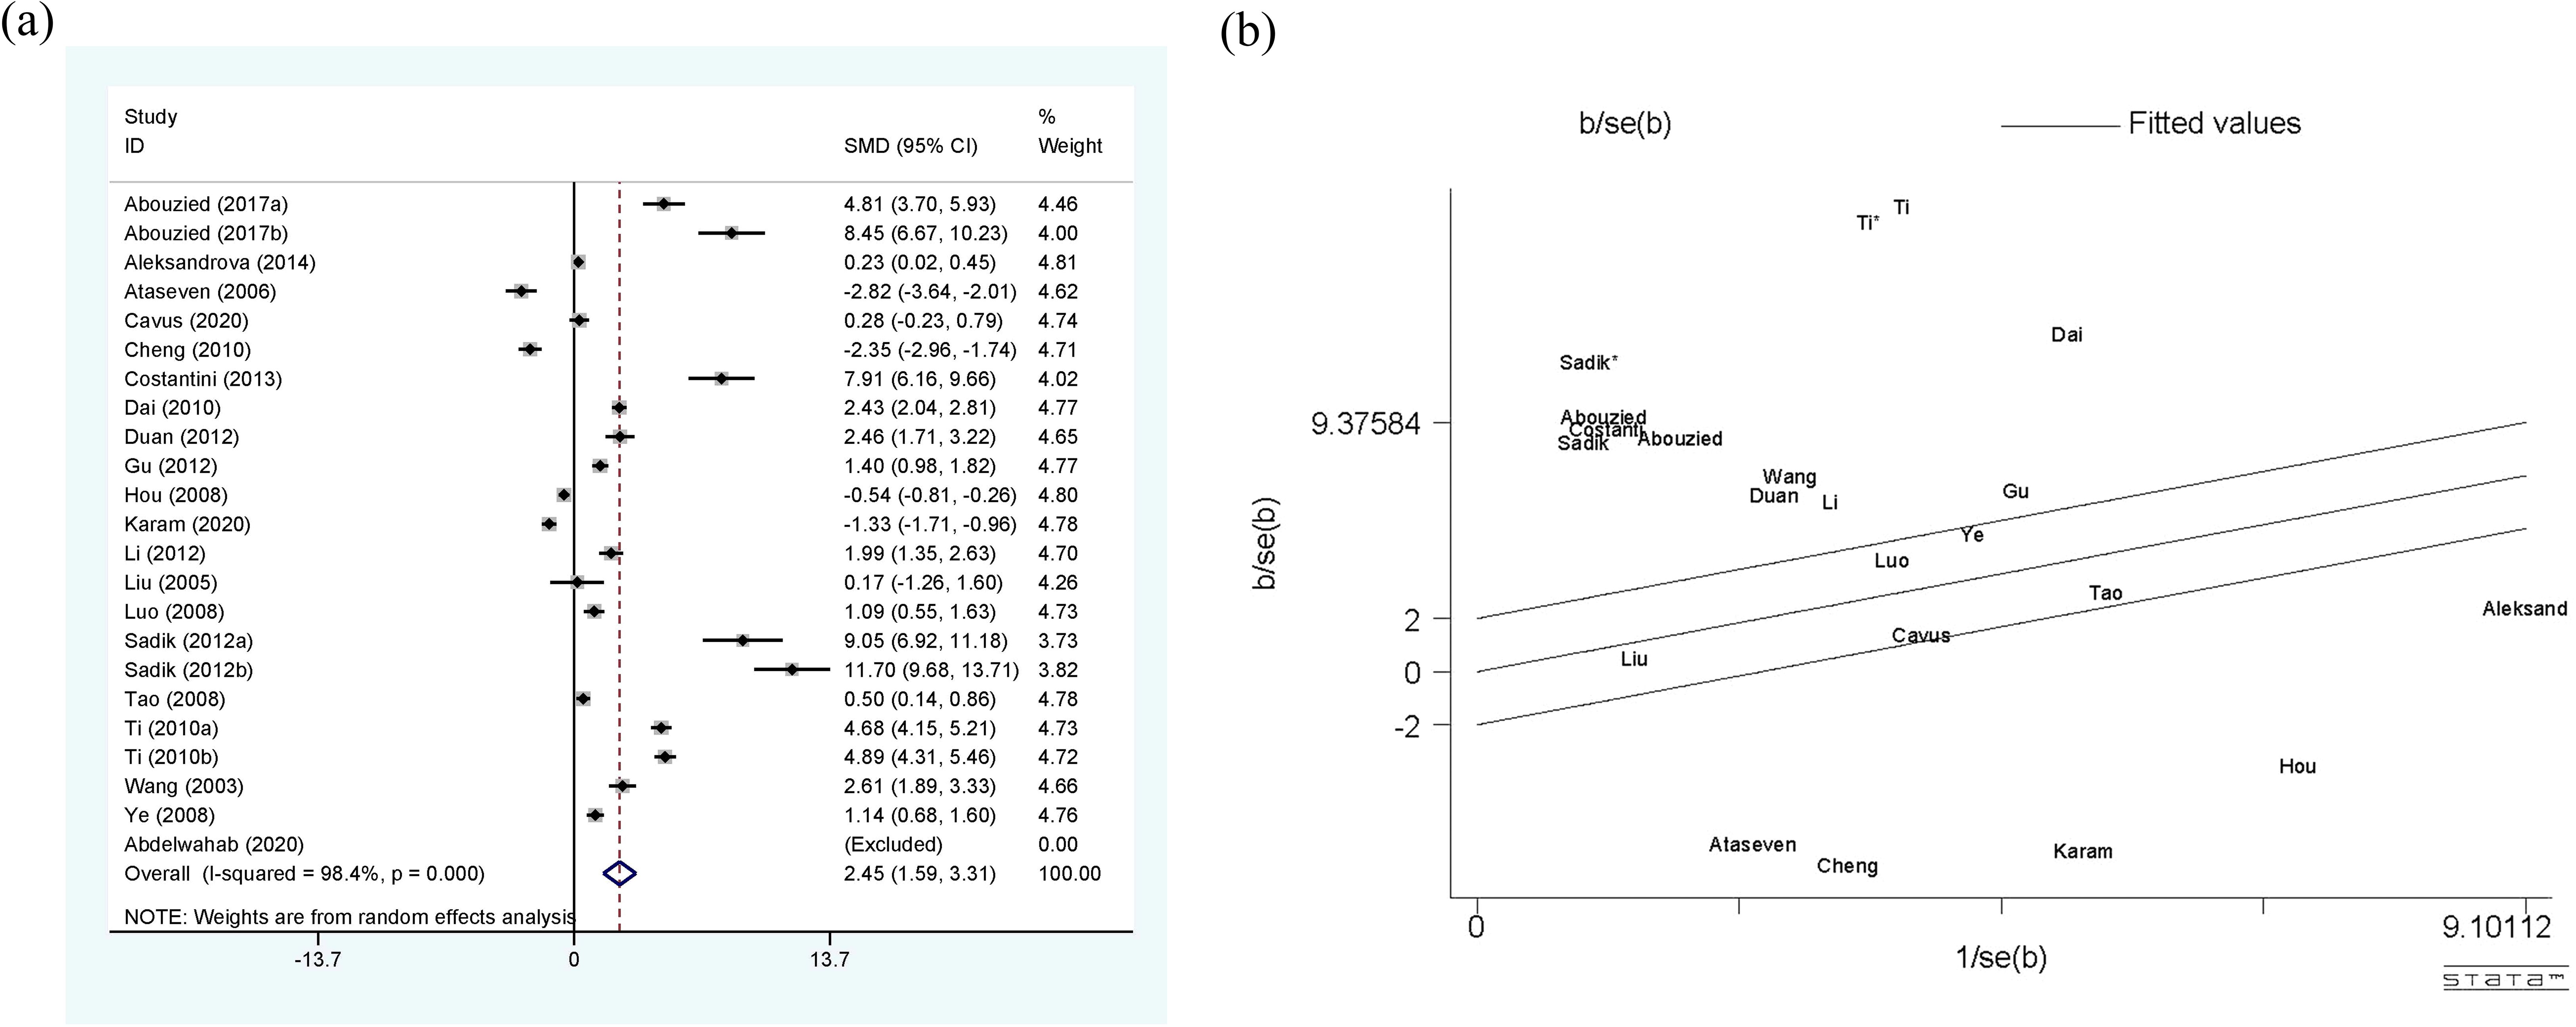
Figure 3. (a) Forest plot of circulating leptin levels between HCC and the control group: SMD = 2.45 (1.59, 3.31); (b) Galbraith Test result of circulating leptin levels between HCC and the control group: more than half of the studies included are out of the fitted values. SMD, standardized mean difference; CI, Confidence Intervals.
As shown in Table 5, the perspectives of subgroup analysis include area (East Asia, Middle East and others), detection method (ELISA and others), age-match (p>0.05 and p<0.05), viral hepatitis (all and not all), TNM (stage I, II and stage III, IV), and sex. Among them, age-match and whether viral hepatitis is present may be sources of heterogeneity, but the results are not very significant. For age-matched studies, the circulating leptin levels in HCC patients were significantly higher than those in the control group (SMD=2.96, 95% CI: 1.72, 4.19). On the contrary, for studies performed without age matching, there was no significant difference in circulating leptin levels between the two groups (SMD=1.24, 95% CI: -0.30, 2.78). In terms of the studies where all case participants had viral hepatitis (27, 29, 39, 53) compared to those partially accompanied with viral hepatitis (33–35, 48, 63), HCC patients all with viral hepatitis showed significantly higher levels of circulating leptin than the control group (SMD=6.17, 95% CI: 2.46, 9.88), while the difference between the two groups with only some cases of concomitant viral hepatitis was not significant (SMD=-0.20, 95% CI: -1.40, 1.00). With regard to the studies including HCC patients some combined with viral hepatitis (33–35, 48, 63), the viral hepatitis rate (HBsAg (+)/anti-HCV Ab (+)/anti-HDV Ab (+)) of each study was as follows: 32% (HBsAg (+)/anti-HCV Ab (+)), 59.1% (HBsAg (+)), 66.7% (HBsAg (+)/anti-HCV Ab (+)), 85% (anti-HCV Ab (+)) and 61.3% (HBsAg (+)/anti-HCV Ab (+)). In addition, we also compared the levels of circulating leptin between male and female patients and patients with different TNM stages (47, 48, 65). It is obvious that the circulating leptin levels in female patients are significantly higher than those in male patients, with SMD -2.71 (-4.20, -1.21). In order to clarify whether the above factors were possible sources of heterogeneity, we also conducted a univariate meta-regression (see Table 6) and verified that presence of viral hepatitis is indeed one of the sources of heterogeneity (p=0.025), which may have important implications for clinical practice.
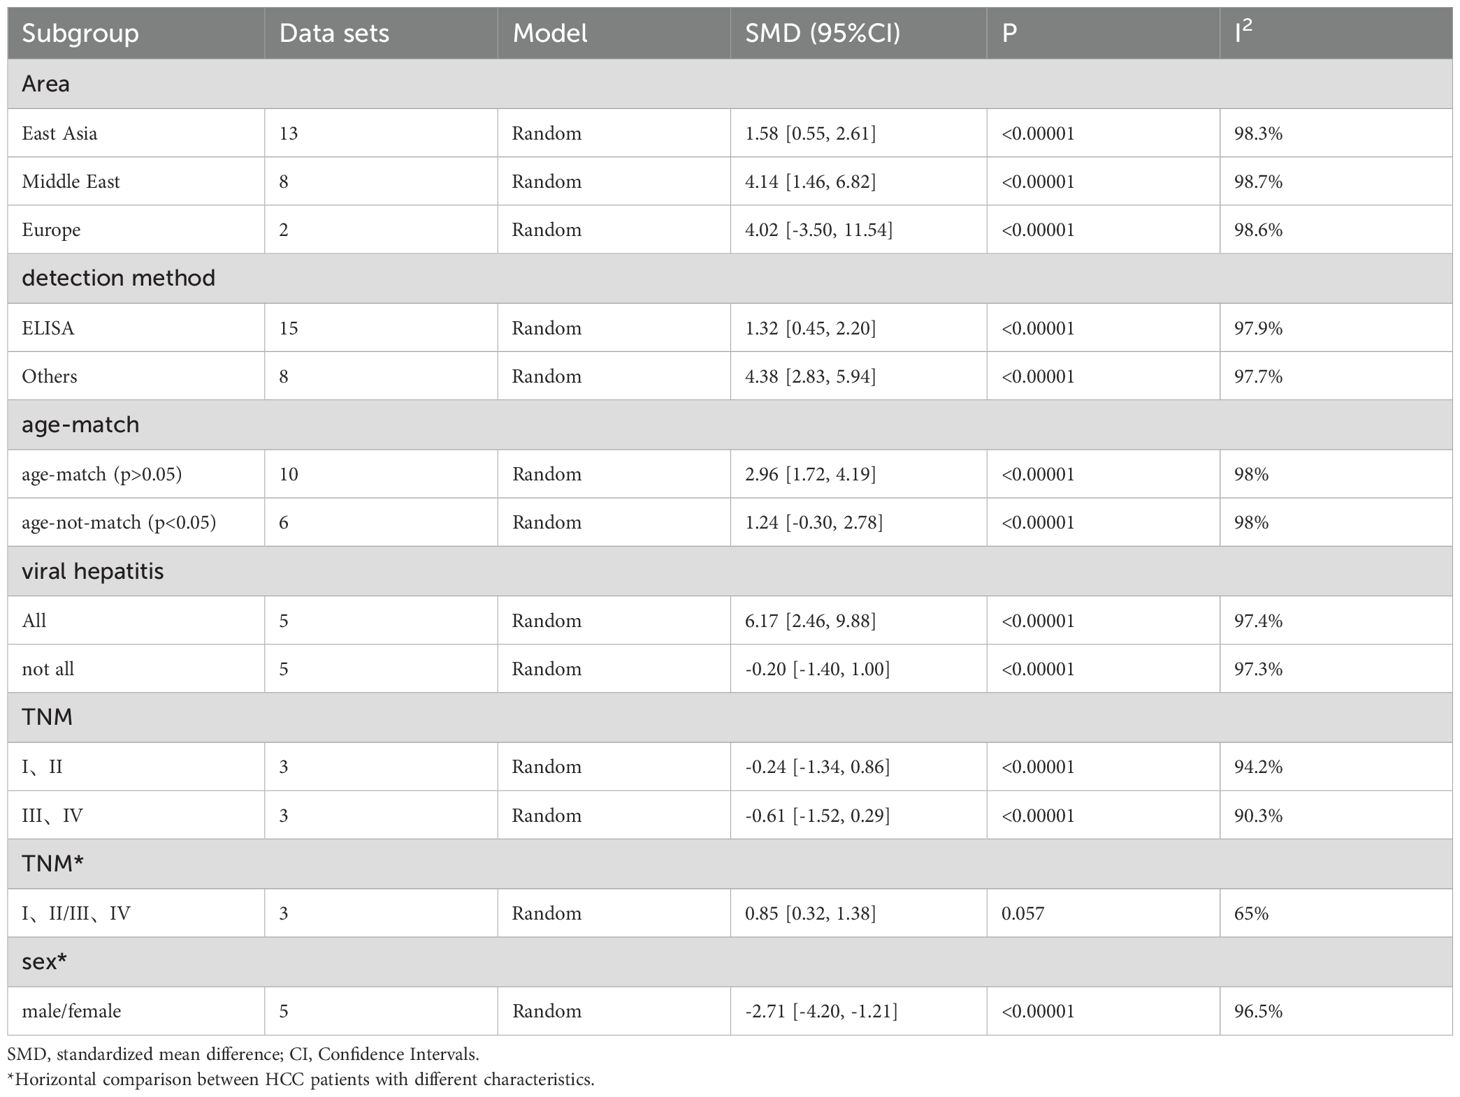
Table 5. Subgroup analysis of circulating leptin level in patients with HCC and the control group.
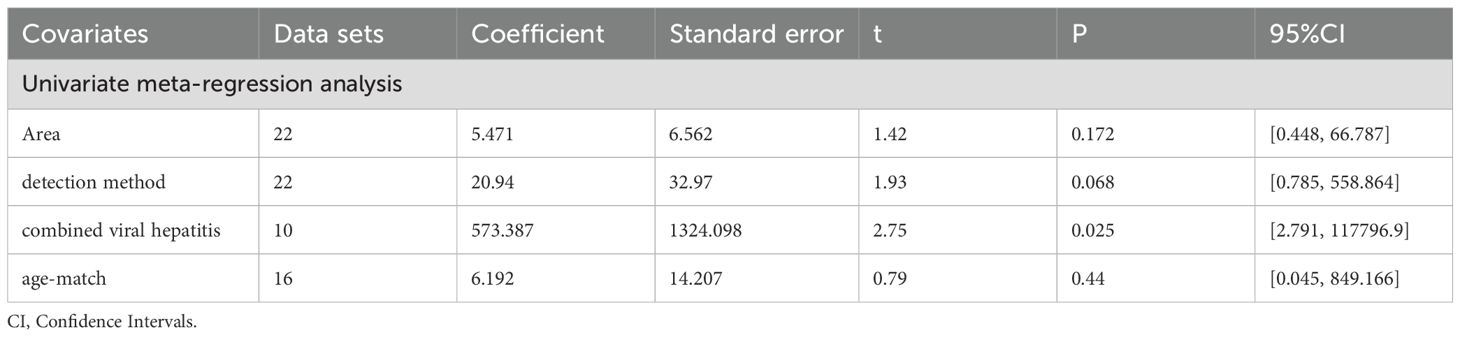
Table 6. Meta-regression of circulating leptin levels and HCC.
Association between visfatin and HCC
Five studies (six sets of data) explored the relationship between circulating visfatin levels and HCC, and their meta-analysis results are shown in Figure 4. According to the results, HCC patients showed significantly higher circulating visfatin levels than the control group (SMD=2.49, 95% CI: 1.32, 3.65), using a random-effect model. High heterogeneity is reflected in the I2 = 96.6%, p<0.01, and Galbr plot. Most studies are not within a reasonable range, indicating significant heterogeneity. Due to the limited number of studies included, only subgroup analysis was applied (see Table 7). Unfortunately, sources of heterogeneity were not found.

Figure 4. (a) Forest plot of circulating visfatin levels between HCC and the control group: SMD=2.49 (1.32, 3.65); (b) Galbraith Test result of circulating visfatin levels between HCC and the control group: more than half of the studies included are out of the fitted values. SMD, standardized mean difference; CI, Confidence Intervals.
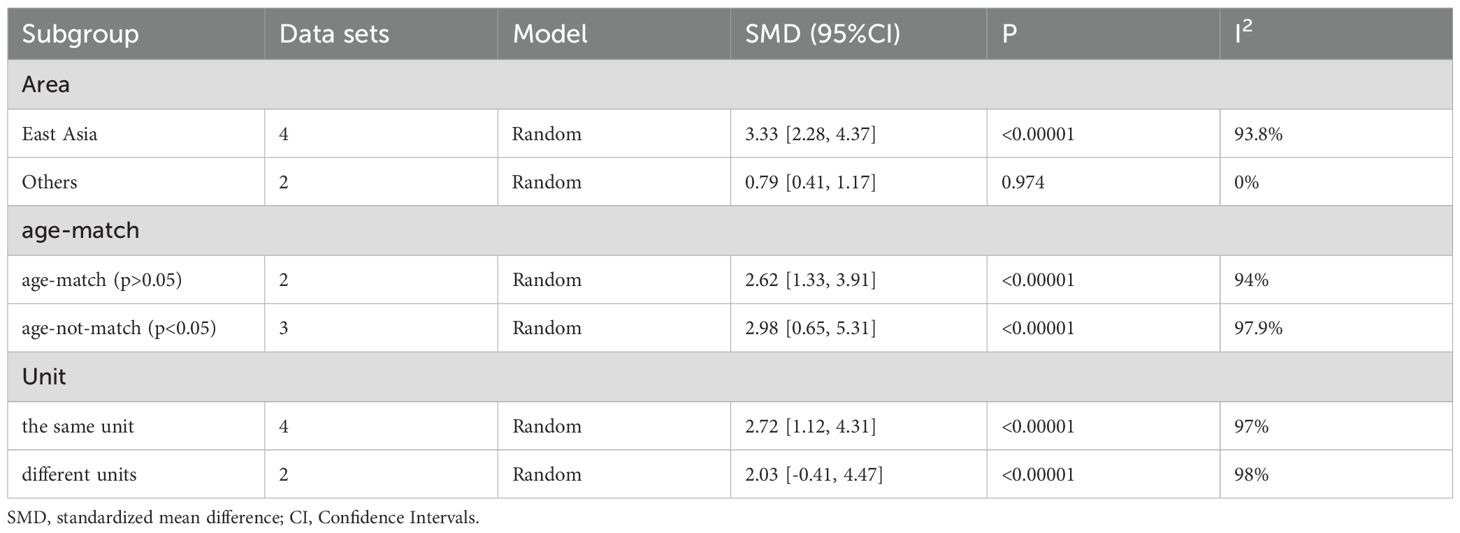
Table 7. Subgroup analysis of circulating leptin level in patients with HCC and the control group.
Moreover, there are three studies on the use of circulating visfatin as a diagnostic tool for HCC, so the relevant meta-analysis was also performed (see Figure 5). The comprehensive analysis shows that the sensitivity and specificity values are 0.74 (0.67, 0.80) and 0.76 (0.69, 0.82), and the I2 values for sensitivity and specificity are 43.8% and 47.8%, respectively, indicating low heterogeneity among the three studies. The pooled results of PLR, NLR, and DOR are 2.93 (2.15, 4.0), 0.36 (0.28, 0.45), 8.83 (5.48, 14.23), respectively, and their heterogeneity is not significant. Moreover, the comprehensive AUC curve was plotted and the result showed an AUC of 0.8127, indicating the good diagnostic value of using circulating visfatin to diagnose HCC. There was no significant threshold effect among the three diagnostic studies included, further demonstrating the reliability of all the results.
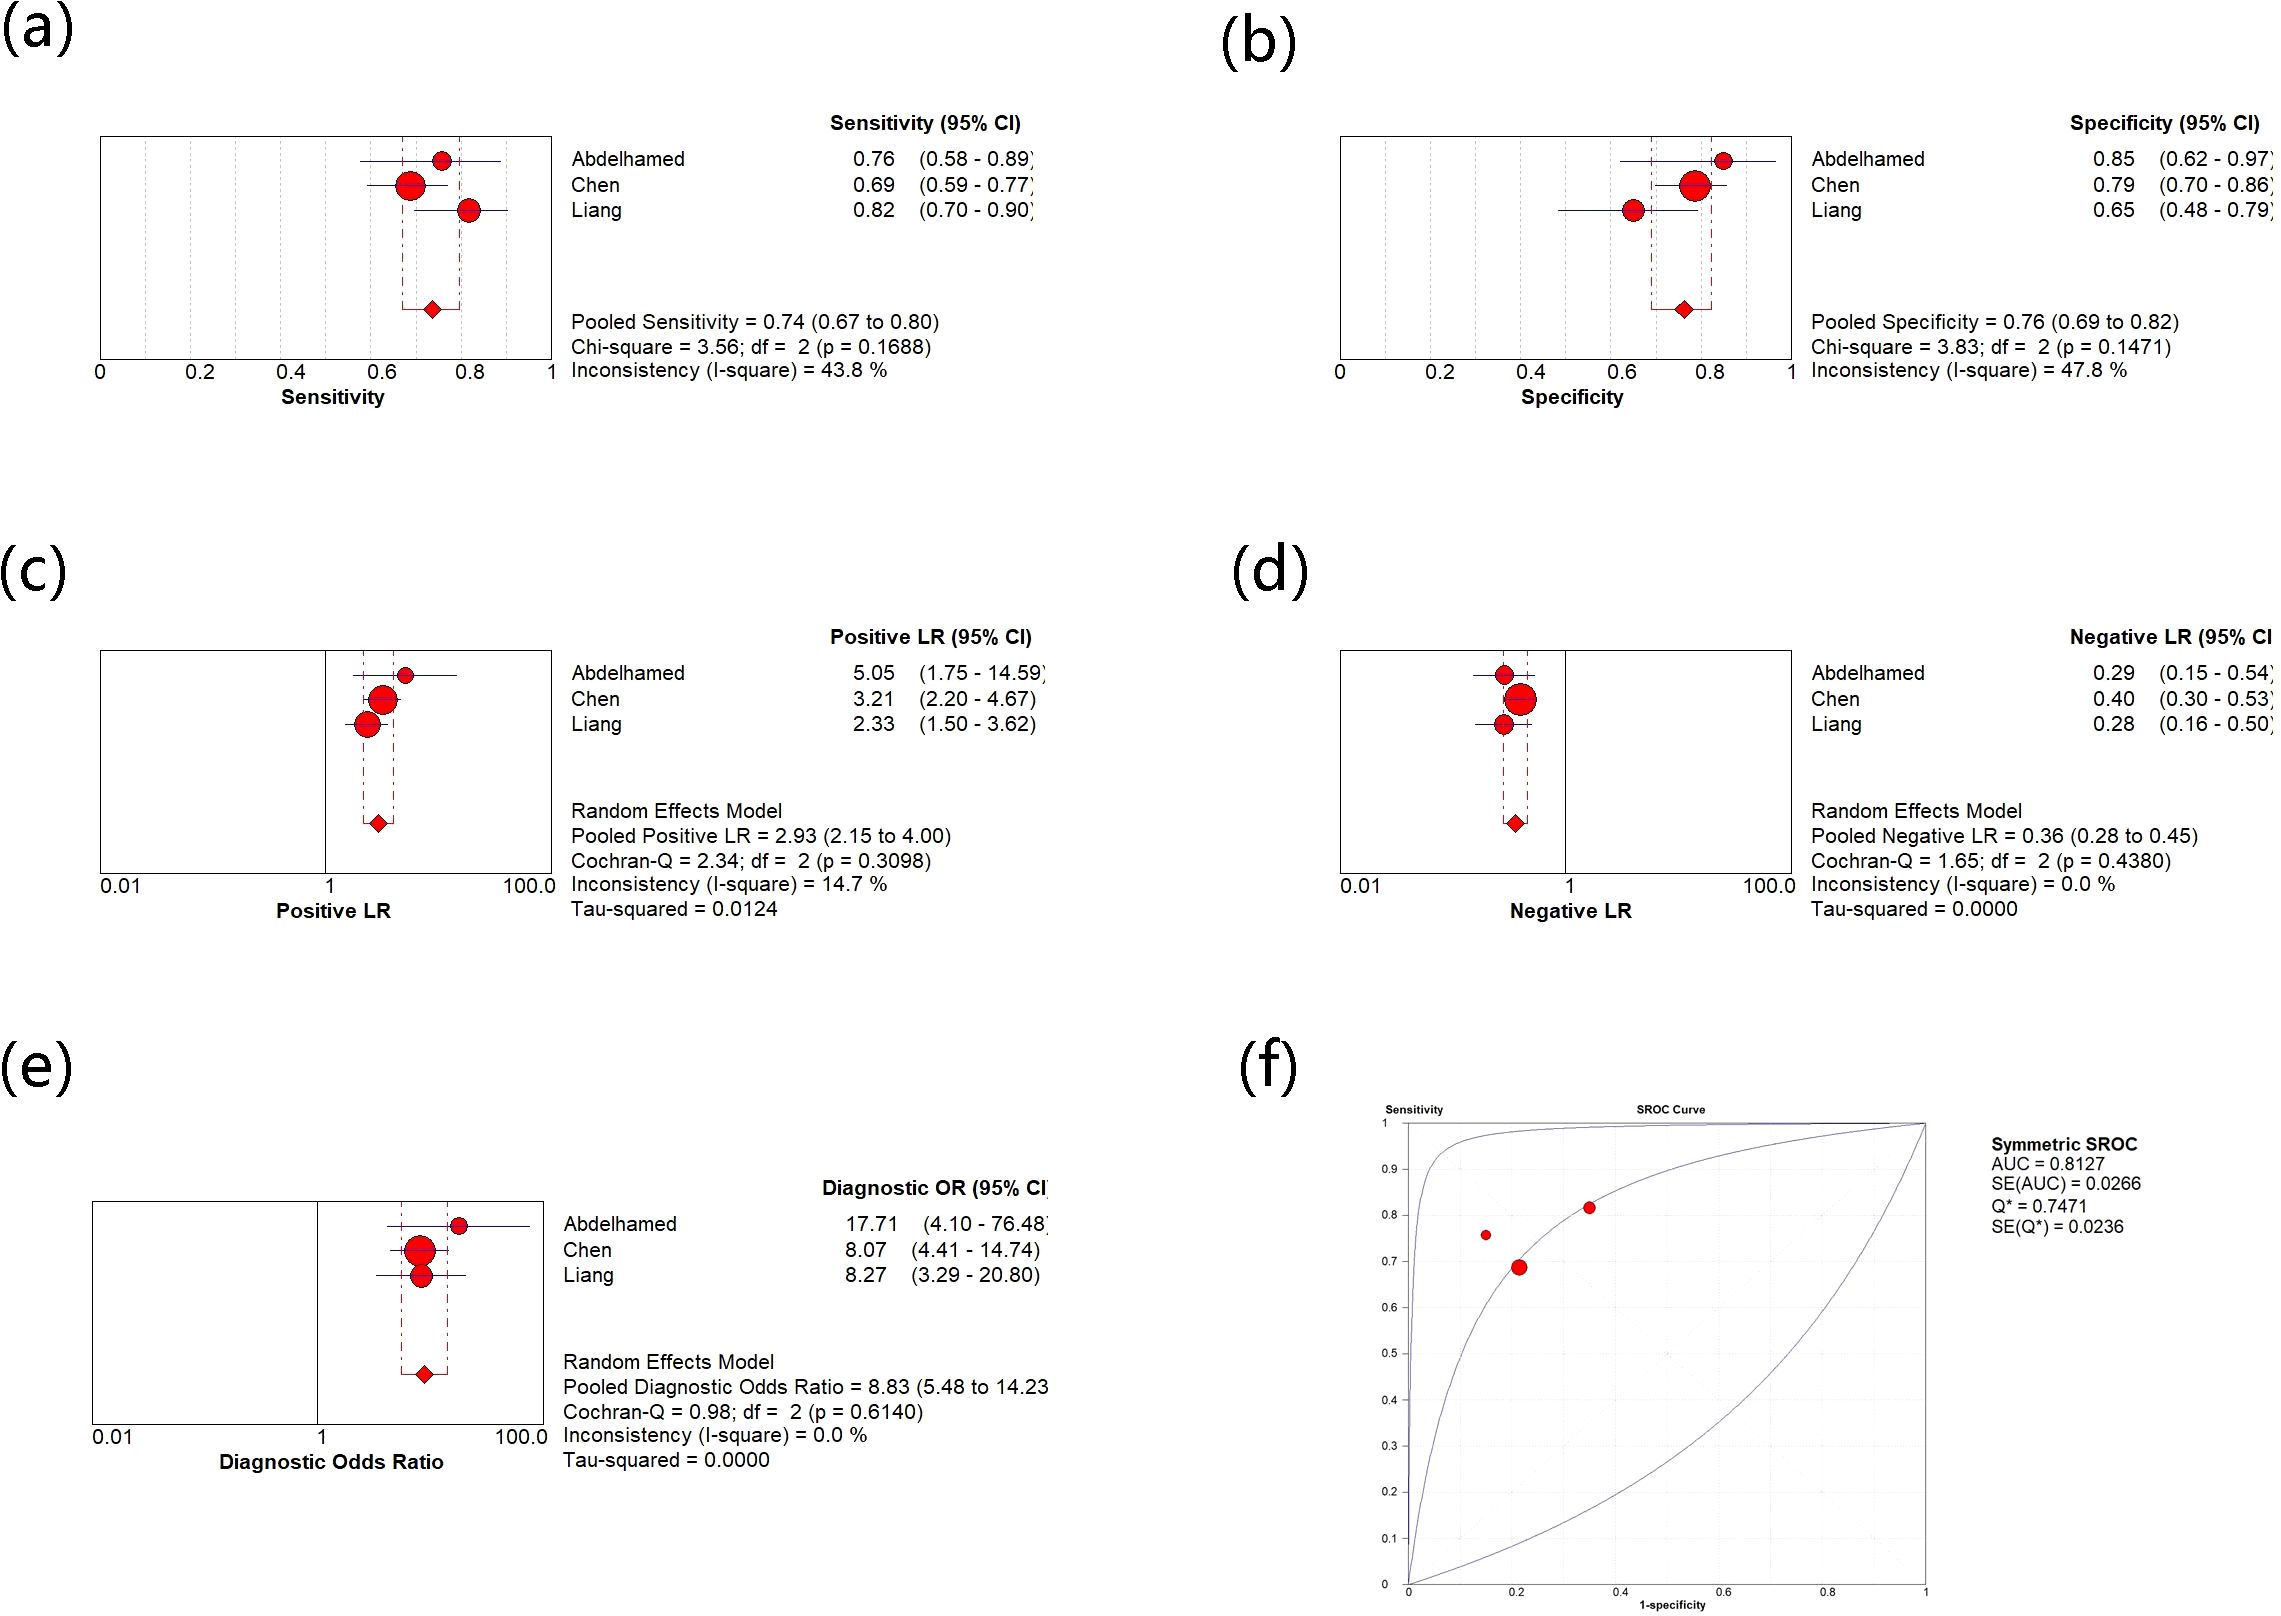
Figure 5. (a) Meta-analysis of sensitivity for circulating vasfatin in diagnosing HCC; (b) Meta-analysis of specificity for circulating vasfatin in diagnosing HCC; (c) Meta-analysis of PLR for circulating vasfatin in diagnosing HCC; (d) Meta-analysis of NLR for circulating vasfatin in diagnosing HCC; (e) Meta-analysis of DOR for circulating vasfatin in diagnosing HCC; (f) ROC curve of circulating visfatin in diagnosing HCC. CI, Confidence Intervals; PLR, Positive Likelihood Ratio; NLR, Negative Likelihood Ratio; DOR, Diagnostic Odds Ratio; ROC, Receiver Operating Characteristic; AUC, Area Under the Curve.
Association between resistin and HCC
Association between circulating resistin and HCC is presented in Figure 6, with 2 studies (3 sets of data). Although only two studies were included, high heterogeneity (I2 = 82.9%, p<0.01) still exists, which explains why a random-effect model was chosen. The results confirm that the expression of circulating resistin levels is significantly higher in HCC patients than in the control group (SMD=4.17, 95% CI: 3.17, 5.17). The number of studies included made it impossible to explore heterogeneity.
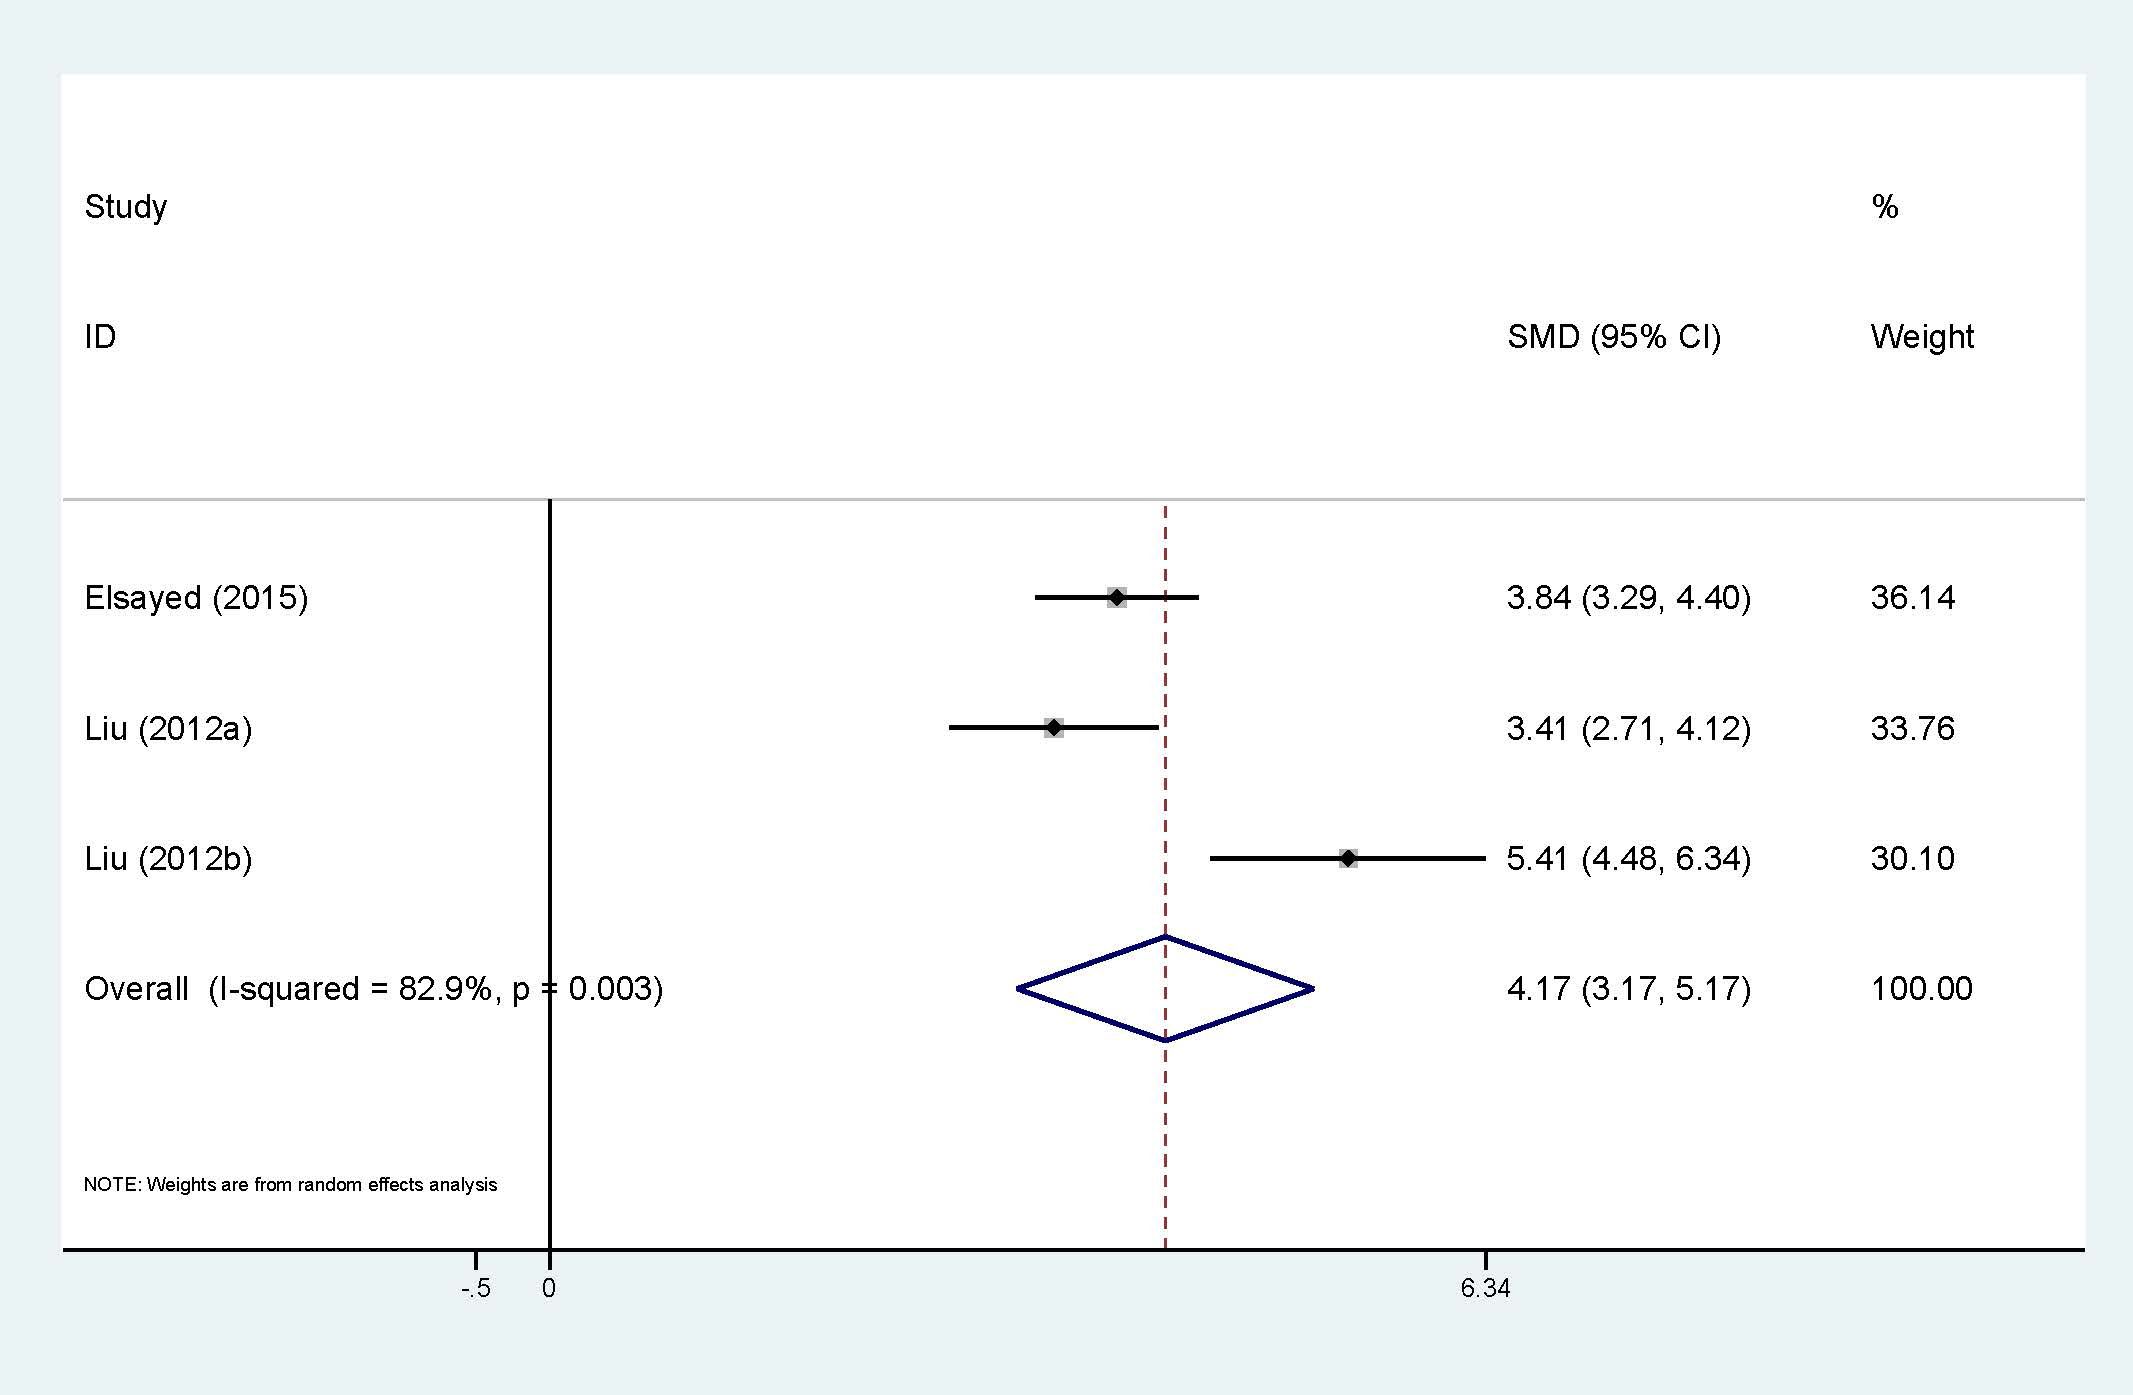
Figure 6. Forest plot of circulating resistin levels between HCC and the control group: SMD= 4.17 (3.17, 5.17). SMD, standardized mean difference; CI, Confidence Intervals.
Association between irisin and HCC
Three studies were applied to the meta-analysis of circulating irisin levels and HCC (Figure 7). Heterogeneity cannot be ignored (I2 = 86%, p<0.01), so the random-effect model has been applied. The results also showed that HCC patients had significantly lower levels of circulating irisin compared to the control group (WMD=-1.16, 95% CI: -1.55, -0.77). Exploration of heterogeneity was not conducted.
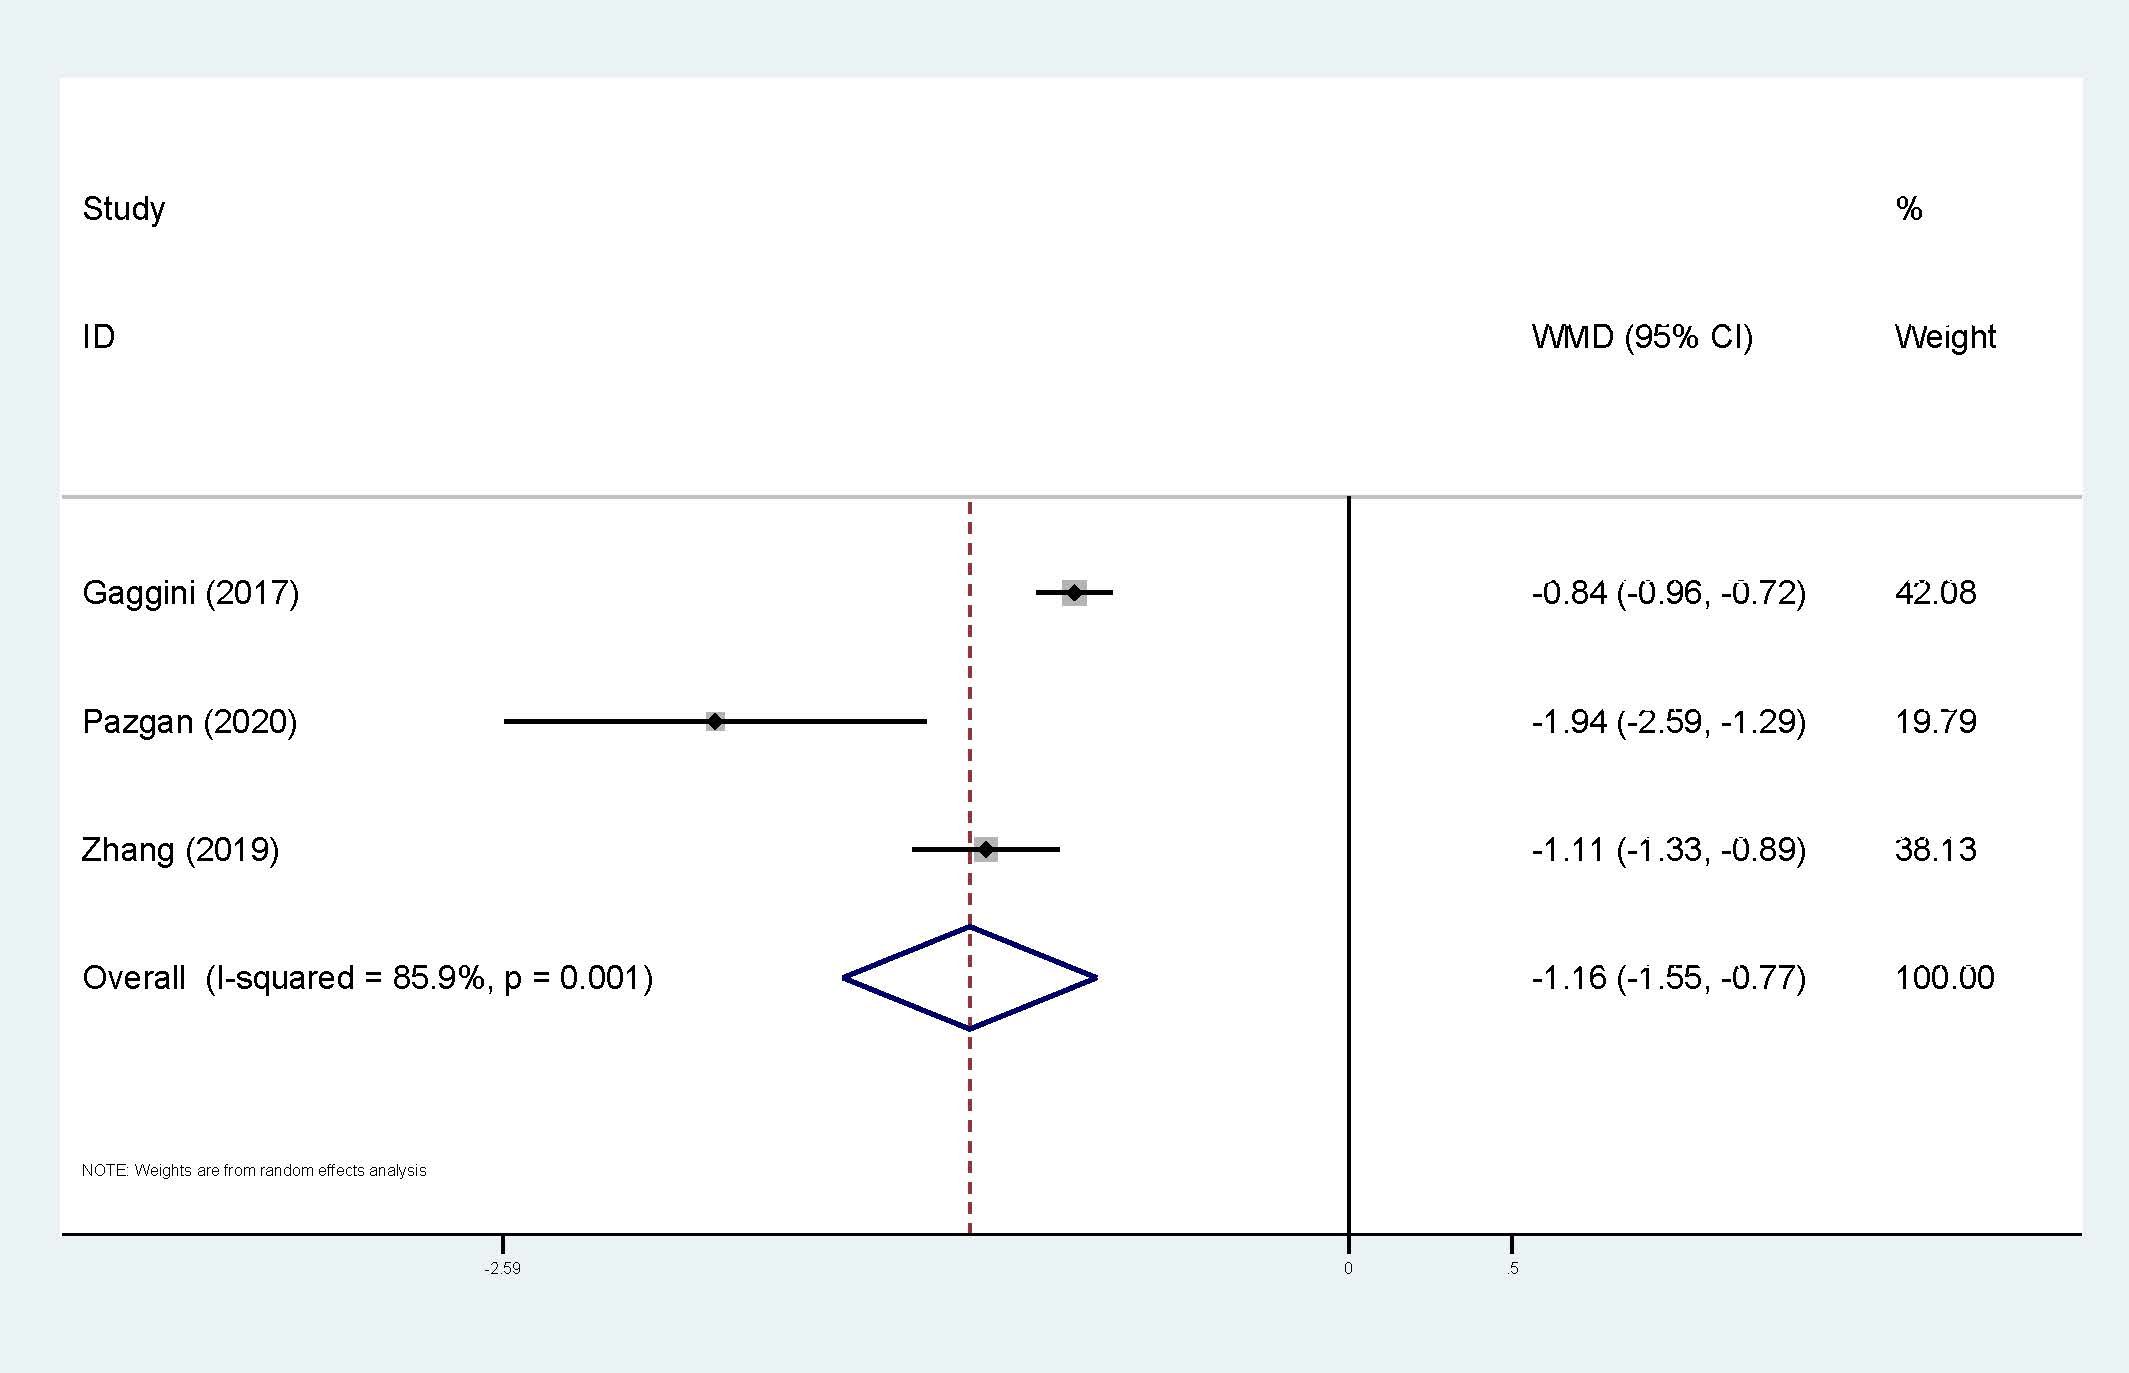
Figure 7. Forest plot of circulating irisin levels between HCC and the control group: WMD=-1.16 (-1.55, -0.77). WMD, weighted mean difference; CI, Confidence Intervals.
Association between other adipokines and HCC
There is only one study on circulating apelin and HCC, and the result shows that circulating apelin levels in HCC patients are significantly higher than those in the control group (28). Furthermore, only one study was included on circulating chemerin and HCC (59), which suggests that HCC patients have higher circulating chemerin levels than the control group.
Sensitivity analysis
Sensitivity analysis was only conducted for circulating adiponectin, leptin, and visfatin (Figure 8). The stability of various meta-analysis results was observed by excluding each single study. If a study was excluded and the result completely deviated from the original scope, it indicates that the stability of the meta-analysis is poor. In our study, the sensitivity analysis results for any type of adipokines are reasonable and stable.
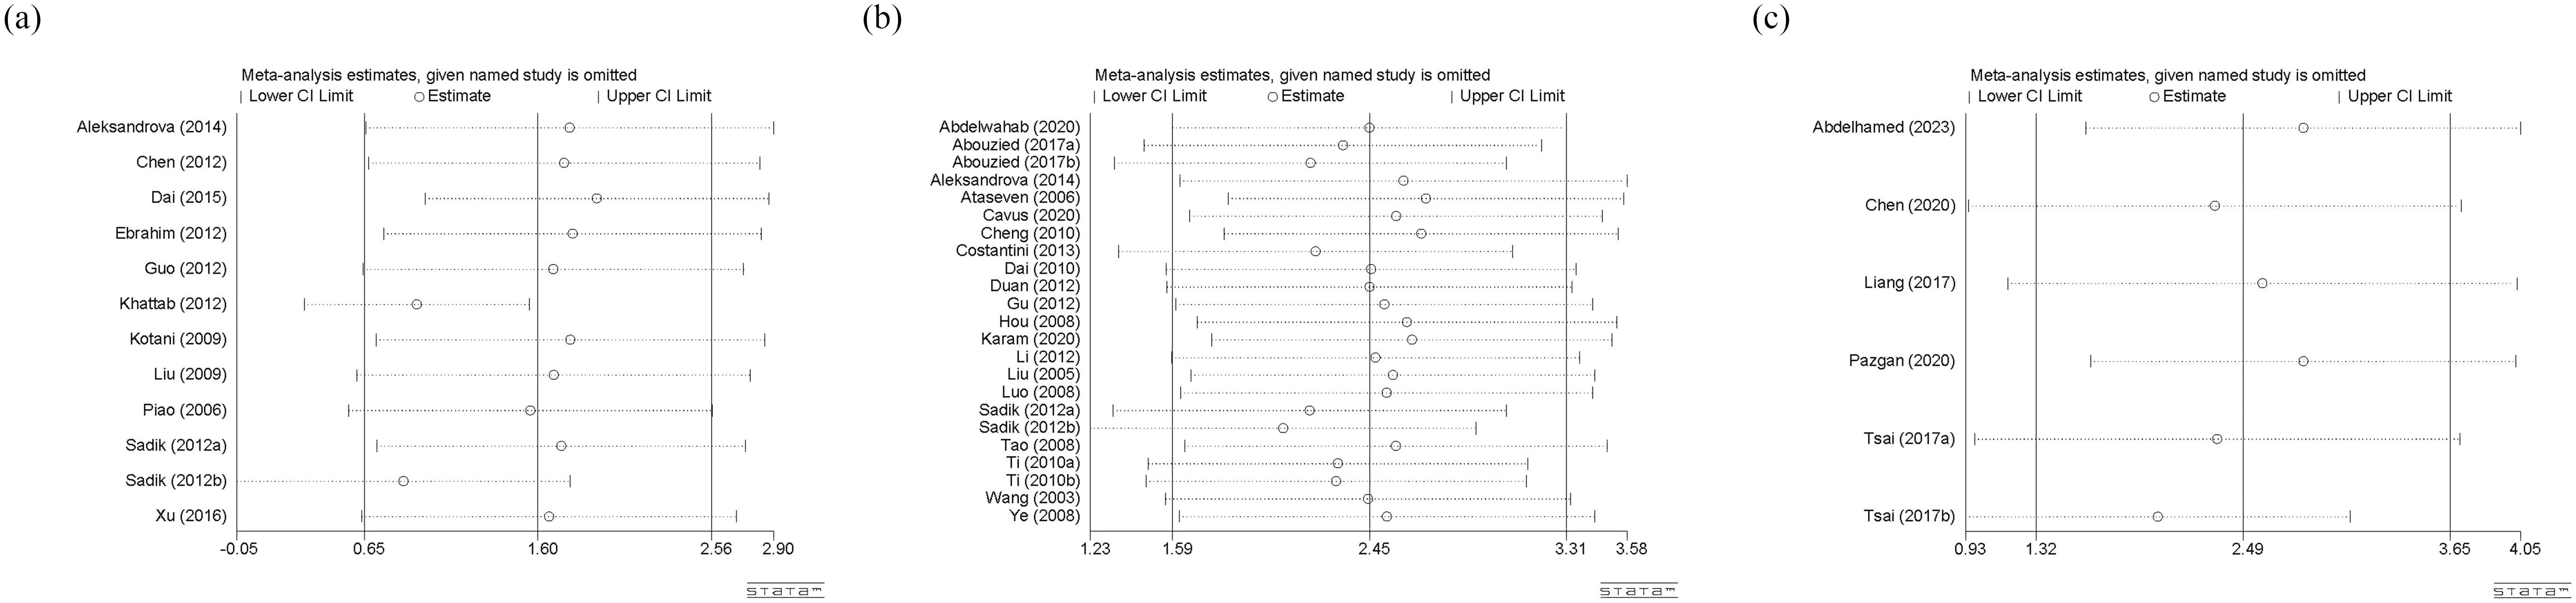
Figure 8. (a) Sensitivity analysis of circulating adiponectin levels; (b) Sensitivity analysis of circulating leptin levels; (c) Sensitivity analysis of circulating visfatin levels. CI, Confidence Intervals.
Publication bias
Egger’s test was used to evaluate publication bias, and the P-value was an important reference (Figure 9). Among them, there is a significant publication bias (p<0.05) for studies on circulating leptin and HCC, so we used the trim-and-filling method for further judgement. The result showed that no trimming was performed and no change happened, even with the addition of several articles. Besides, there is no significant publication bias (p>0.05) among studies on circulating adiponectin and visfatin, indicating that the results are representative.
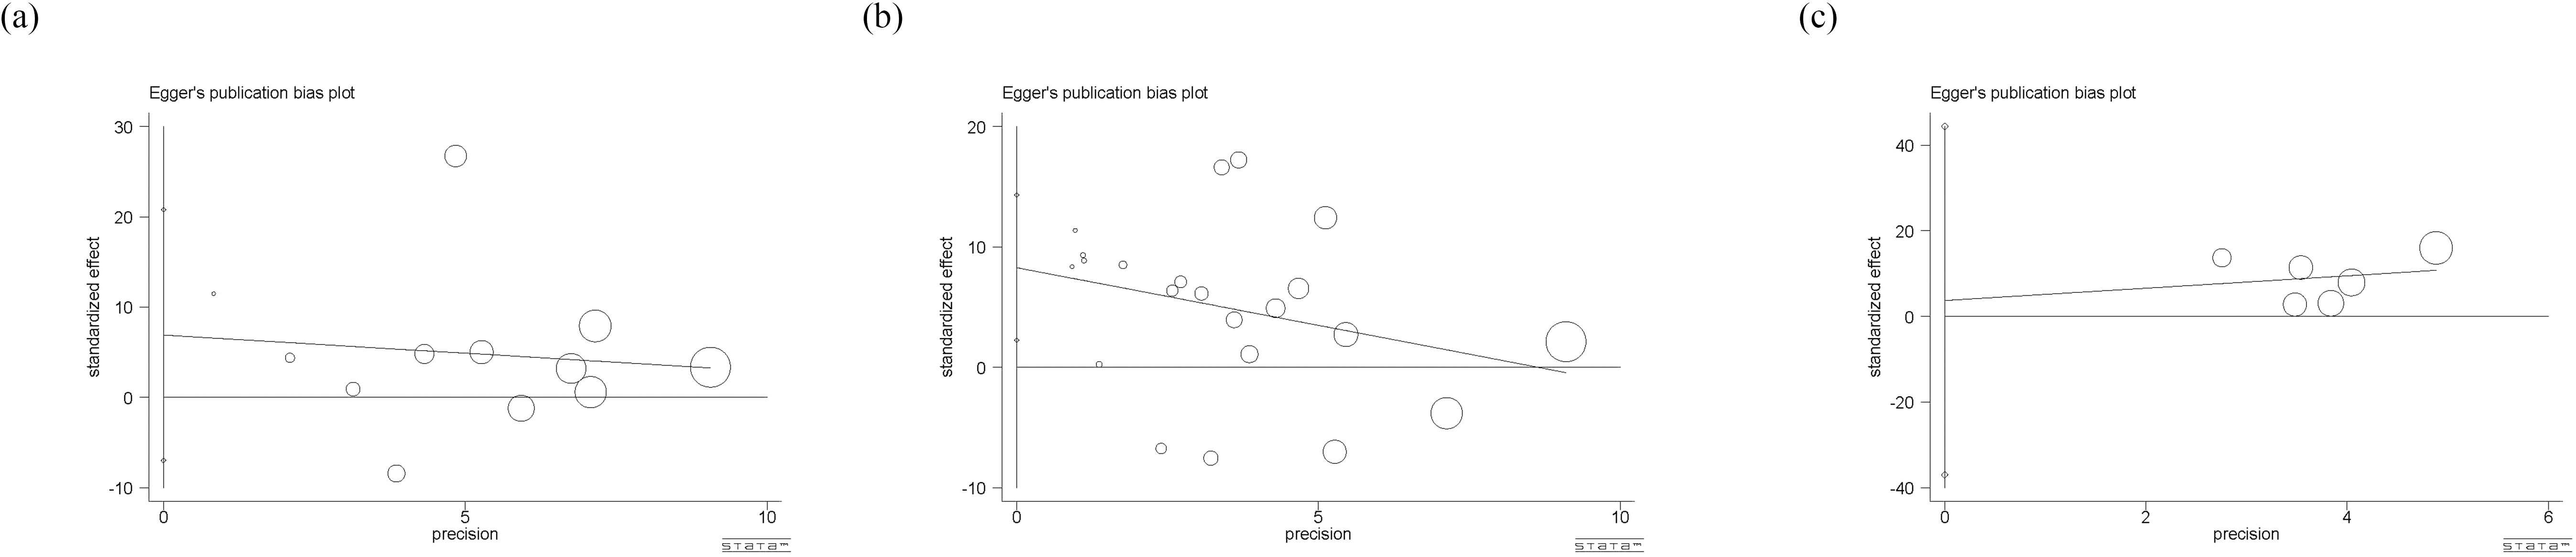
Figure 9. (a) Eggar’s test of circulating adiponectin levels; (b) Eggar’s test of circulating leptin levels; (c) Eggar’s test of circulating visfatin levels. The different sizes of symbols represent the weight of each study.
Discussion
The potential causes of liver cirrhosis are primarily alcoholism, chronic infections with hepatitis B virus (HBV) and hepatitis C virus (HCV), and NASH (67). Long-term cirrhosis can lead to repeated cycles of liver cell death and compensatory regeneration, creating an environment that promotes sustained cell growth and proliferation, which is highly beneficial for the occurrence and development of tumor cells (68). In addition, the pathogenesis of HCC related to obesity and non-alcoholic fatty liver disease (NAFLD) remains unclear, except for HCC caused by liver cirrhosis. Current research suggests that liver fat deformation combined with insulin resistance can promote adipose tissue inflammation, oxidative stress, and the occurrence of lipotoxins, thereby promoting liver cell carcinogenesis and facilitating liver cancer development (69–72). In recent years, there has been an increasing amount of research on HCC and adipokines, with varying focuses and results. Furthermore, research (73) has shown that the inflammatory biomarkers have been identified as key, especially for neuroendocrine neoplasms (NENs), highlighting the importance of early indicator monitoring for disease regulation.
Adiponectin is named after adipose tissue and can be produced by mature adipocytes or hepatocytes (9). Adiponectin mainly activates downstream pathways through two subtypes of receptors, namely R1 and R2 (16). Tontikodou et al. (74) found that patients combined with liver fibrosis and NAFLD had significantly lower levels of adiponectin than those without fibrosis. Jiang et al. (75) demonstrated that ethanol can damage the adiponectin R2- sirtuin 1 (SIRT1)- AMP-activated protein kinase (AMPK) signaling pathway, leading to the development of alcoholic fatty liver in rats. Leptin is a peptide hormone secreted by white adipose tissue (10). It can regulate satiety, energy expenditure, the immune system, angiogenesis, and carcinogenesis (76). It is highly expressed in many liver diseases and can promote the progression of fibrosis in patients with chronic hepatitis B infection (77, 78). Meanwhile, leptin can affect the tumor microenvironment and influence the invasion and distant metastasis of tumor cells in various ways, such as its interaction with cancer-related fibroblasts and the signaling of transforming growth factor beta (TGF-β) (79). Visfatin is a hormone derived from pre-B cell colony-enhancing factor, mainly expressed in bones, muscles, liver, and other tissues (80). Research has shown that the levels of visfatin are elevated in obese patients (81), and this cytokine can promote fibrotic activity (82). Resistin is a peptide secreted by adipocytes that promotes inflammation and insulin resistance (83, 84). Both animal experiments and clinical trials have found a correlation between resistin and obesity (11). In addition, resistin is positively correlated with inflammation and fibrosis in NAFLD (85, 86). Irisin is a novel glycopeptide hormone mainly produced and secreted by skeletal muscles (58), and can also be found in the liver, adipose tissue, and skin (87). It has a heat-generating effect on white adipose tissue during physical exercise, making it closely related to exercise (88). It can also regulate fat metabolism, thereby affecting liver lipid accumulation and determining the worsening prognosis of certain cancers (44, 89).
This meta-analysis explores the relationship between circulating adipokines and HCC, mainly including adiponectin, leptin, visfatin, resistin, irisin, chemerin, and apelin. After searching six databases, 5,039 articles were retrieved. Finally, a total of 41 studies were included, covering studies from Asia, Europe, and Africa. Among them, 11 articles contain circulating adiponectin levels, 20 articles involve circulating leptin, 5 articles are related to visfatin, 3 articles are resistin, 2 articles are irisin, 1 article is chemerin and 1 article is apelin. Relevant information was also extracted for subsequent subgroup analysis and meta-regression, including country, age, gender, testing methods, diagnostic criteria, comorbidities of HCC patients, detection methods, and units of circulating adipokines. Finally, it was found that HCC patients had significantly higher levels of circulating adiponectin, leptin, visfatin, and resistin compared to the control group, whereas circulating irisin levels were significantly lower in HCC patients. Due to the different number of studies included in each part, we only selected circulating adiponectin, leptin, and visfatin for subgroup analysis, and adiponectin and leptin for meta-regression.
After subgroup analysis, it was found that the expression levels of circulating adiponectin were different in HCC patients all combined with viral hepatitis and HCC patients some combined with viral hepatitis, compared with the control group. In addition, circulating adiponectin levels of HCC patients in other areas were significantly higher than those in the control group, while the circulating adiponectin levels of HCC patients in East Asia were no different from those in the control group. However, no possible sources of heterogeneity were found after meta-regression. Perhaps due to the limited number of studies included, it remains to be considered whether area and viral hepatitis are factors affecting the expression level of circulating adiponectin. In terms of circulating leptin, the results of subgroup analysis indicate that age matching, concomitant viral hepatitis, and gender all may contribute to a high degree of heterogeneity. Due to missing information in some studies, only the source of heterogeneity in the presence or absence of viral hepatitis was ultimately discovered through meta-regression. The subgroup analysis of visfatin did not find any sources of heterogeneity. Taking into account the heterogeneity exploration of these three circulating adipokines, we found that there are some differences in circulating adiponectin levels among patients in different areas. Even within the same area, there are significant differences in the levels of circulating adipokine, suggesting that the correlation between adipokine levels and geographic region may not be significant. In addition, there are differences in the degree of age matching among patients in different studies. It is generally accepted that liver metabolism gradually declines with age, so there may be a certain relationship between age and circulating adipokine. However, we only found that age may be a confounding variable reflected in a difference of circulating leptin between age matched and unmatched HCC subgroups, which may be due to limited relevant research on other adipokines and deserves further verification. The difference in hormone secretion between men and women may lead to the difference in the incidence rate or severity of HCC between the sexes. Therefore, we compared the level of circulating adipokine in male and female HCC patients and found that the level of circulating leptin was significantly different in male and female HCC patients. As before, this significant difference is only reflected in the study of circulating leptin, which may be related to the sensitivity of the indicator or the larger number of related studies. Viral hepatitis is currently the main factor leading to liver cancer (90). Viruses can promote the occurrence and development of liver cancer by affecting the lipid metabolism process of the liver (91). Therefore, the comorbidities of viral hepatitis in HCC patients can also affect the study outcomes and may be a key contributor to heterogeneity. Subgroup analyses of both circulating adiponectin and leptin showed that the presence or absence of viral hepatitis may lead to high heterogeneity. Meta-regression further suggests that the presence or absence of viral hepatitis has a significant impact on the expression of circulating adiponectin. Viral infection can cause persistent liver inflammation and immune mediated oxidative stress damage, further accelerating the transformation of inflammation to liver cancer, which may be the reason why it affects circulating adiponectin (92). A study suggests that there is an interaction between adipokines and HBV infection, HBV replication (including viral protein synthesis) (93). Moreover, we also explored the effects of detection methods, disease stage, and unit on heterogeneity, but no significant findings were observed, possibly due to the limited number of included studies. In fact, different disease stages and treatment of HCC patients may also affect lipid metabolism, thereby affecting the expression level of circulating adipokines. The focus of each study is different, and there is little information that can be summarized, which is worth further in-depth and comprehensive research in the future. It is worth mentioning that, unlike other circulating adipokines, irisin is expressed at lower levels in the circulatory system of HCC patients. The specific mechanism of irisin is not yet clear, and its similarities and differences with other circulating adipokines also need to be studied. Perhaps it can serve as a specific indicator for diagnosing and distinguishing liver diseases in the early stages.
In addition to routine meta-analysis, we also summarized the diagnostic analysis data for meta-analysis. Unfortunately, the diagnostic analysis data for many circulating adipokines are incomplete, so we only selected relevant studies on visfatin. The results showed no significant threshold effect, and circulating visfatin demonstrated high sensitivity, specificity, and diagnostic value for HCC. Based on these results, we believe that the level of circulating visfatin has good diagnostic significance for the diagnosis of HCC and deserves more experimental and clinical attention. We also conducted sensitivity analysis and analysis of publication bias to evaluate the reliability representativeness of the results. A potential publication bias was observed among studies on circulating leptin. The additional trim and filling method further confirms the reliability of the result. In general, there is a certain relationship between circulating adipokines and HCC: several types of circulating adipokines (adiponectin, leptin, visfatin, resistin) are expressed at higher levels in HCC patients, and whether HCC is combined with viral hepatitis can also affect the circulating adipokine levels of HCC patients. Additionally, circulating visfatin levels have good clinical value in diagnosing HCC.
Limitations
This study covers the relationship between common circulating adipokines (adiponectin, leptin, visfatin, resistin and irisin) and HCC, but there are also some limitations. Firstly, the insufficient number of studies included has led to operational difficulties in subgroup analysis and meta-regression. Each study has its own focus and contains different data. It was difficult for us to extract the desired data from most studies, which also limited the scope of exploring heterogeneity. Secondly, although our research covers multiple countries and areas such as Asia, Europe, and Africa, it still mainly focuses on the Asian region and lacks research in areas such as the Americas. There are differences in the subgroup analysis of some indicators across different regions, but there are still some indicators that are not applicable. The area may be related to race or dietary habits, which can affect the incidence and severity of HCC (94) and is a point that needs to be further explored. Thirdly, there is only one indicator (circulating visfatin) for meta-analysis in diagnostic analysis. Because many of the included studies did not involve diagnostic studies or only provided ROC curve graphs, it is difficult for us to extract useful information from them. The meta-analysis of diagnostic studies summarized showed that circulating visfatin has a good diagnostic value for HCC. Whether this situation can be applied to other circulating adipokine indicators, or whether the combination of multiple circulating adipokine indicators can comprehensively clarify the incidence, disease severity, or prognosis of HCC, is an important direction for future research. Finally, in order to preliminarily elucidate the differences in circulating adipokine levels between HCC patients and healthy control groups, we conducted this study, and strictly selected healthy individuals as the control group (excluding other liver disease patients). However, cirrhosis could also be a confounder for adipokine levels, given potential alterations in nutritional status, liver synthetic function and the body’s inflammatory state. Perhaps more research can be conducted in the future to focus on the relationship between circulating adipokines and cirrhosis (95, 96). Furthermore, due to the limitation of article length, inconsistencies in objectives and multiple comorbidities with HCC, this article did not introduce a network meta-analysis and only explored the expression of these circulating adipokines in HCC patients to preliminarily clarify their clinical values. It is hoped that there will be opportunities to conduct a network meta-analysis in the future to further explore the comparison and collaboration of different adipokines in HCC and investigate their differences in the diagnosis and identification of liver diseases.
Conclusion
This study summarizes the relationship between circulating adipokines and HCC, and some adipokines can provide a reference for the early diagnosis or prognostic evaluation of HCC. The expression levels of circulating adiponectin, leptin, visfatin, or resistin in HCC patients were significantly higher than those in the control group, while the circulating irisin level was significantly lower in HCC patients. All studies exhibited high heterogeneity, and subgroup analysis and meta-regression were conducted to identify the sources. Factors such as region and age-matching can be considered as possible sources of heterogeneity by subgroup analysis. However, due to the insufficient number of studies included, the meta-regression results demonstrated that the presence or absence of viral hepatitis is a source of high heterogeneity among studies on circulating leptin, which warrants further attention in future research. Additionally, the meta-analysis results of diagnostic studies suggest that circulating visfatin can serve as a good biomarker for diagnosing HCC. The results of the sensitivity analysis for all indicators are stable. By combining publication bias analysis and the trim-and-filling method, we have a clear understanding of the reliability of all the results in this study. However, due to the different focuses of each study, this meta-analysis still has many limitations, especially in exploring the sources of heterogeneity and the levels of circulating adipokines in various liver diseases. This requires further comprehensive and specific research to elucidate.
Data availability statement
The original contributions presented in the study are included in the article/Supplementary Material. Further inquiries can be directed to the corresponding authors.
Author contributions
YK: Data curation, Formal Analysis, Methodology, Software, Writing – original draft, Writing – review & editing. YP: Data curation, Formal Analysis, Methodology, Software, Writing – original draft, Writing – review & editing. XH: Formal Analysis, Methodology, Software, Validation, Writing – original draft, Writing – review & editing. XB: Formal Analysis, Investigation, Resources, Validation, Writing – review & editing. XL: Formal Analysis, Investigation, Methodology, Validation, Writing – review & editing. MZ: Formal Analysis, Investigation, Validation, Visualization, Writing – review & editing. TJ: Conceptualization, Project administration, Resources, Supervision, Validation, Writing – original draft, Writing – review & editing. GZ: Conceptualization, Project administration, Resources, Supervision, Validation, Writing – original draft, Writing – review & editing.
Funding
The author(s) declare that financial support was received for the research and/or publication of this article. Youth Fund of the National Natural Science Foundation of China, No. 82204950. Zhejiang Provincial Natural Science Foundation Youth Project, No. LQ23H270013. Chunyan Traditional Chinese Medicine Development Special Fund Achievement Transformation Research Project, No. CY202302.
Acknowledgments
We would like to deliver our thanks to Shan Liu from the first affiliated hospital of Zhejiang Chinese Medical University for her encouragement and support.
Conflict of interest
The authors declare that the research was conducted in the absence of any commercial or financial relationships that could be construed as a potential conflict of interest.
Generative AI statement
The author(s) declare that no Generative AI was used in the creation of this manuscript.
Publisher’s note
All claims expressed in this article are solely those of the authors and do not necessarily represent those of their affiliated organizations, or those of the publisher, the editors and the reviewers. Any product that may be evaluated in this article, or claim that may be made by its manufacturer, is not guaranteed or endorsed by the publisher.
Supplementary material
The Supplementary Material for this article can be found online at: https://www.frontiersin.org/articles/10.3389/fendo.2025.1548924/full#supplementary-material
Supplementary Data Sheet 1 | PRISMA 2020 checklist.
Supplementary Data Sheet 2 | PROSPERO: Number CRD42023492972.
Supplementary Data Sheet 3 | Databases retrieval strategy.
Abbreviations
HCC, Hepatocellular Carcinoma; TKI, Tyrosine Kinase Inhibitor; NASH, Nonalcoholic Steatohepatitis; NOS, Newcastle-Ottawa Scale; ROC, Receiver Operating Characteristic; SD, Standard Deviation; SMD, Standardized Mean Difference; CI, Confidence Intervals; WMD, Weighted Mean Difference; PLR, Positive Likelihood Ratio; NLR, Negative Likelihood Ratio; DOR, Diagnostic Odds Ratio; AUC, Area Under the Curve; sROC, summary Receiver Operating Characteristic; TNM, Tumor Node Metastasis; HBV, Hepatitis B Virus; HCV, Hepatitis C Virus; NAFLD, Nonalcoholic Fatty Liver Disease; NENs, Neuroendocrine Neoplasms; SIRT1, Sirtuin 1; AMPK, AMP-activated Protein Kinase; TGF-β, Transforming Growth Factor beta.
References
1. Wang ZF, Hu R, Pang JM, Zhang GZ, Yan W, and Li ZN. Serum long noncoding RNA LRB1 as a potential biomarker for predicting the diagnosis and prognosis of human hepatocellular carcinoma. Oncol Lett. (2018) 16:1593–601. doi: 10.3892/ol.2018.8825
2. Llovet JM, Kelley RK, Villanueva A, Singal AG, Pikarsky E, Roayaie S, et al. Hepatocellular carcinoma. Nat Rev Dis Primers. (2021) 7:6. doi: 10.1038/s41572-020-00240-3
3. Tang A, Hallouch O, Chernyak V, Kamaya A, and Sirlin CB. Epidemiology of hepatocellular carcinoma: target population for surveillance and diagnosis. Abdom Radiol (NY). (2018) 43:13–25. doi: 10.1007/s00261-017-1209-1
4. Villanueva A. Hepatocellular carcinoma. N Engl J Med. (2019) 380:1450–62. doi: 10.1056/NEJMra1713263
5. Wang X, Zhang A, and Sun H. Power of metabolomics in diagnosis and biomarker discovery of hepatocellular carcinoma. Hepatology. (2013) 57:2072–7. doi: 10.1002/hep.26130
6. Llovet JM, Zucman-Rossi J, Pikarsky E, Sangro B, Schwartz M, Sherman M, et al. Hepatocellular carcinoma. Nat Rev Dis Primers. (2016) 2:16018. doi: 10.1038/nrdp.2016.18
7. Reig M, Forner A, Rimola J, Ferrer-Fàbrega J, Burrel M, Garcia-Criado Á, et al. BCLC strategy for prognosis prediction and treatment recommendation: The 2022 update. J Hepatol. (2022) 76:681–93. doi: 10.1016/j.jhep.2021.11.018
8. Cui K, Ou Y, Shen Y, Li S, and Sun Z. Clinical value of circulating tumor cells for the diagnosis and prognosis of hepatocellular carcinoma (HCC): A systematic review and meta-analysis. Med (Baltimore). (2020) 99:e22242. doi: 10.1097/MD.0000000000022242
9. Polyzos SA, Kountouras J, and Mantzoros CS. Adipokines in nonalcoholic fatty liver disease. Metabolism. (2016) 65:1062–79. doi: 10.1016/j.metabol.2015.11.006
10. Stojsavljević S, Gomerčić Palčić M, Virović Jukić L, Smirčić Duvnjak L, and Duvnjak M. Adipokines and proinflammatory cytokines, the key mediators in the pathogenesis of nonalcoholic fatty liver disease. World J Gastroenterol. (2014) 20:18070–91. doi: 10.3748/wjg.v20.i48.18070
11. Rajesh Y and Sarkar D. Association of adipose tissue and adipokines with development of obesity-induced liver cancer. Int J Mol Sci. (2021) 22:2163. doi: 10.3390/ijms22042163
12. Polyzos SA, Kountouras J, and Zavos C. Nonalcoholic fatty liver disease: the pathogenetic roles of insulin resistance and adipocytokines. Curr Mol Med. (2009) 9:299–314. doi: 10.2174/156652409787847191
13. Starley BQ, Calcagno CJ, and Harrison SA. Nonalcoholic fatty liver disease and hepatocellular carcinoma: a weighty connection. Hepatology. (2010) 51:1820–32. doi: 10.1002/hep.23594
14. Matondang SBRE, Karismaputri KS, Suharlim E, and Yonathan IWM. Hepatocellular carcinoma with macroscopic fat metamorphosis: A case series. J Clin Imaging Sci. (2021) 11:36. doi: 10.25259/JCIS_221_2020
15. Yeh MM, Liu Y, and Torbenson M. Steatohepatitic variant of hepatocellular carcinoma in the absence of metabolic syndrome or background steatosis: a clinical, pathological, and genetic study. Hum Pathol. (2015) 46:1769–75. doi: 10.1016/j.humpath.2015.07.018
16. Yamauchi T, Kamon J, Ito Y, Tsuchida A, Yokomizo T, Kita S, et al. Cloning of adiponectin receptors that mediate antidiabetic metabolic effects. Nature. (2003) 423:762–9. doi: 10.1038/nature01705
17. Stang A. Critical evaluation of the Newcastle-Ottawa scale for the assessment of the quality of nonrandomized studies in meta-analyses. Eur J Epidemiol. (2010) 25:603–5. doi: 10.1007/s10654-010-9491-z
18. Shi J, Luo D, Wan X, Liu Y, Liu J, Bian Z, et al. Detecting the skewness of data from the five-number summary and its application in meta-analysis. Stat Methods Med Res. (2023) 32:1338–60. doi: 10.1177/09622802231172043
19. Luo D, Wan X, Liu J, and Tong T. Optimally estimating the sample mean from the sample size, median, mid-range, and/or mid-quartile range. Stat Methods Med Res. (2018) 27:1785–805. doi: 10.1177/0962280216669183
20. Wan X, Wang W, Liu J, and Tong T. Estimating the sample mean and standard deviation from the sample size, median, range and/or interquartile range. BMC Med Res Methodol. (2014) 14:135. doi: 10.1186/1471-2288-14-135
21. Schmidt FL, Oh IS, and Hayes TL. Fixed- versus random-effects models in meta-analysis: model properties and an empirical comparison of differences in results. Br J Math Stat Psychol. (2009) 62:97–128. doi: 10.1348/000711007X255327
22. Higgins JP, Thompson SG, Deeks JJ, and Altman DG. Measuring inconsistency in meta-analyses. BMJ. (2003) 327:557–60. doi: 10.1136/bmj.327.7414.557
23. Egger M, Davey Smith G, Schneider M, and Minder C. Bias in meta-analysis detected by a simple, graphical test. BMJ. (1997) 315:629–34. doi: 10.1136/bmj.315.7109.629
24. Luo C, Marks-Anglin A, Duan R, Lin L, Hong C, Chu H, et al. Accounting for publication bias using a bivariate trim and fill meta-analysis procedure. Stat Med. (2022) 41:3466–78. doi: 10.1002/sim.9428
25. Swets JA. Measuring the accuracy of diagnostic systems. Science. (1988) 240:1285–93. doi: 10.1126/science.3287615
26. Abouzied MM, Nazmy MH, Mohamed RM, Fawzy MA, and Eltahir HM. Diagnostic utility of leptin and insulin-like growth factor binding protein-2 in hepatocellular carcinoma of diabetic and non-diabetic Egyptian patients. Trop J Pharm Res. (2017) 16:211–8. doi: 10.4314/tjpr.v16i1.28
27. Costantini S, Capone F, Maio P, Guerriero E, Colonna G, Izzo F, et al. Cancer biomarker profiling in patients with chronic hepatitis C virus, liver cirrhosis and hepatocellular carcinoma. Oncol Rep. (2013) 29:2163–8. doi: 10.3892/or.2013.2378
28. Effenberger M, Grander C, Hausmann B, Enrich B, Pjevac P, Zoller H, et al. Apelin and the gut microbiome: Potential interaction in human MASLD. Dig Liver Dis. (2023) 56:932–40. doi: 10.1016/j.dld.2023.11.023
29. Sadik NA, Ahmed A, and Ahmed S. The significance of serum levels of adiponectin, leptin, and hyaluronic acid in hepatocellular carcinoma of cirrhotic and noncirrhotic patients. Hum Exp Toxicol. (2012) 31:311–21. doi: 10.1177/0960327111431091
30. Tsai IT, Wang CP, Yu TH, Lu YC, Lin CW, Lu LF, et al. Circulating visfatin level is associated with hepatocellular carcinoma in chronic hepatitis B or C virus infection. Cytokine. (2017) 90:54–9. doi: 10.1016/j.cyto.2016.10.007
31. Abdelhamed W, Morsy KH, Hefny HM, and Abudeif A. The role of serum visfatin and vaspin in hepatocellular carcinoma in hepatitis C-related liver cirrhosis. Clin Exp Hepatol. (2023) 9:210–20. doi: 10.5114/ceh.2023.130499
32. Abdelwahab K, Abdelmaaboud M, Magdy M, and Abdelhalim MA. Diagnostic value of serum leptin as a tumor marker in hepatocellular carcinoma. QJM. (2020) 113:i129. doi: 10.1093/qjmed/hcaa052.037
33. Aleksandrova K, Boeing H, Nöthlings U, Jenab M, Fedirko V, Kaaks R, et al. Inflammatory and metabolic biomarkers and risk of liver and biliary tract cancer. Hepatology. (2014) 60:858–71. doi: 10.1002/hep.27016
34. Ataseven H, Bahcecioglu IH, Kuzu N, Yalniz M, Celebi S, Erensoy A, et al. The levels of ghrelin, leptin, TNF-alpha, and IL-6 in liver cirrhosis and hepatocellular carcinoma due to HBV and HDV infection. Mediators Inflammation. (2006) 2006:78380. doi: 10.1155/MI/2006/78380
35. Çavuş B, Akyuz F, İliaz R, Akyuz U, Duranyıldız D, Serilmez M, et al. Assessment of prognostic and diagnostic value of some biomarkers in hepatocellular carcinoma. Exp Oncol. (2020) 42:208–14. doi: 10.32471/exp-oncology.2312-8852.vol-42-no-3.151
36. Chen MJ, Yeh YT, Lee KT, Tsai CJ, Lee HH, and Wang SN. The promoting effect of adiponectin in hepatocellular carcinoma. J Surg Oncol. (2012) 106:181–7. doi: 10.1002/jso.23059
37. Chen L, Chen WX, and Zhao XL. Application of serum TSP-1, PIVKA-II and visfatin detection in the diagnosis of primary hepatocellular carcinoma. Chin J Health Lab Tec. (2020) 30:336–9.
38. Cheng Q, Liu S, Tang D, Wu JP, Zhang ZQ, and Gu J. Correlation between serum L-carnitine and cachexia in patients with advanced liver cancer. Chin J Gastroenterol Hepatol. (2010) 19:78–80.
39. Dai K, Chen J, Yang LH, and Gong ZJ. The relationship of serum leptin and leptin receptor polymorphisms with primary hepatocellular carcinoma. Chin J Gastroenterol Hepatol. (2010) 19:722–4.
40. Dai K, Chen ZB, Yang LH, and Gong ZJ. Expression of adiponectin and adiponectin receptor 2 in hepatocellular carcinoma tissue and its clinical significance. China Med Herald. (2015) 12:34–7.
41. Duan XF. The expression and significance of leptin in hepatocellular carcinoma. Master’s Thesis Tianjin Med Univ. (2012).
42. Ebrahim MA, Shams MEE, Al-Gayyar MMH, and El-Shishtawy MM. Circulating adiponectin in hepatocellular carcinoma: A possible risk factor for development and progression. Eur J Clin Med Oncol. (2012) 4.
43. Elsayed EY, Mosalam NA, and Mohamed NR. Resistin and insulin resistance: A link between inflammation and hepatocarcinogenesis. Asian Pac J Cancer Prev. (2015) 16:7139–42. doi: 10.7314/apjcp.2015.16.16.7139
44. Gaggini M, Cabiati M, Del Turco S, Navarra T, De Simone P, Filipponi F, et al. Increased FNDC5/Irisin expression in human hepatocellular carcinoma. Peptides. (2017) 88:62–6. doi: 10.1016/j.peptides.2016.12.014
45. Gu C and Shi CQ. The sernm expressions of Leptin and MMP-9 and their clinical significance in hepatocellular carcinoma. Chin Hepatol. (2012) 17:170–2.
46. Guo JW, Ma XB, Wang F, Liu M, Qi YZ, and Wang ZG. The study of blood serum adiponectin levels and tumor relations. J Modern Oncol. (2012) 20:2016–8.
47. Hou ZJ, Zhou XY, Yan JH, Chen JR, and Dai DL. Application of ROC curve in the analysis and evaluation of the diagnostic value of the combined detection of AFP-VEGF and lep in hepatocellular carcinoma. Med Philcaophy (Clinical Decision Making Forum Edition). (2008) 29:17–18 + 21.
48. Karam HA, Bessa SS, Ali EMM, Diab T, and Mohamed TM. The inter-relation between leptin receptor (Q223R) gene polymorphism and the risk of Egyptian patients with HCC. Asian Pac J Cancer Prev. (2020) 21:3557–65. doi: 10.31557/APJCP.2020.21.12.3557
49. Khattab MA, Eslam M, Mousa YI, Ela-adawy N, Fathy S, Shatat M, et al. Association between metabolic abnormalities and hepatitis C-related hepatocellular carcinoma. Ann Hepatol. (2012) 11:487–94. doi: 10.1016/S1665-2681(19)31462-0
50. Kotani K, Wakai K, Shibata A, Fujita Y, Ogimoto I, Naito M, et al. Serum adiponectin multimer complexes and liver cancer risk in a large cohort study in Japan. Asian Pac J Cancer Prev. (2009) 10 Suppl:87–90.
51. Li JG, Fan BF, Guan LH, Qian F, and Wang XY. Clinical significance of changes on serum levels of IL-8, lL-10 and leptin in patients with chronic hepatitis B(CHB), liver cirrhosis(LC) and primary hepatocellular carcinoma(PHC). J Radioimmunol. (2012) 25:127–30.
52. Liang NL. Expression and clinical significances of serum visfatin, VEGF in patients with primary liver cancer. Chin J Clin Gastroenterol. (2017) 29:33–6.
53. Liu ZW, Zhang N, Han QY, Zeng JT, Chu YL, Qiu JM, et al. Correlation of serum leptin levels with anthropometric and metabolic parameters and biochemical liver function in Chinese patients with chronic hepatitis C virus infection. World J Gastroenterol. (2005) 11:3357–62. doi: 10.3748/wjg.v11.i22.3357
54. Liu CJ, Chen PJ, Lai MY, Liu CH, Chen CL, Kao JH, et al. High serum adiponectin correlates with advanced liver disease in patients with chronic hepatitis B virus infection. Hepatol Int. (2009) 3:364–70. doi: 10.1007/s12072-008-9111-0
55. Liu XM. The relationship between hepatoma and insulin resistance. Doctoral Thesis Tianjin Med Univ. (2012).
56. Luo NP, Liu HG, Sun XM, and Chen YJ. Relationship between leptin and neuropeptide Y levels in patients with different kinds of tumors. J Radioimmunol. (2008) 21:197–9.
57. Pazgan-Simon M, Kukla M, Zuwała-Jagiełło J, Grzebyk E, Lekstan A, and Simon K. Serum levels of novel adipokines in patients with hepatocellular carcinoma. J Viral Hepatitis. (2018) 25:129–30. doi: 10.1111/jvh.166_12923
58. Pazgan-Simon M, Zuwala-Jagiello J, Menzyk T, Bator M, Derra A, Lekstan A, et al. Serum betatrophin and irisin levels in hepatocellular carcinoma. J Physiol Pharmacol. (2020) 71. doi: 10.26402/jpp.2020.1.11
59. Pazgan-Simon M, Szymanek-Pasternal A, Górka-Dynysiewicz J, Nowicka A, Simon K, Grzebyk E, et al. Serum chemerin level in patients with liver cirrhosis and primary and multifocal hepatocellular carcinoma with consideration of insulin level. Arch Med Sci. (2024) 20:1504–10. doi: 10.5114/aoms/176674
60. Piao LS. Relationship between serum adiponectin level and HCV-related chronic liver disease in patients. Master’s Thesis Yanbian Univ. (2006).
61. Tao ML and Jin R. Study of serum leptin and blood lipid levels in patients with primary hepatocellular carcinoma. Chin J Clin Gastroenterol. (2008) 20:131–132 + 142.
62. Ti DD, Yan GT, Lin J, Zhang K, Wang LH, Hao XH, et al. Leptin expression in serum of liver cancer patients and its clinical significance. J Chin PLA Postgrad Med Sch. (2010) 31:12–13 + 47.
63. Wang YY and Lin SY. Leptin in relation to hepatocellular carcinoma in patients with liver cirrhosis. Horm Res. (2003) 60:185–90. doi: 10.1159/000073231
64. Xu YY, Gong JL, Yan YD, and Shen YS. A study on the correlation between serum adiponectin levels and humoral immune function in patients with chronic hepatitis B virus infection. Modern Pract Med. (2016) 28:592–4.
65. Ye MX, Lei ZM, Deng TG, and Xu MX. Determination of the levels of serum leptin and insulin in patients with primary liver cancer and correlative analysis. J Hepatopancreatobiliary Surg. (2008) 20:33–5.
66. Zhang J, Ke M, Ren Y, Bi J, Du Z, Zhang M, et al. Serum irisin predicts posthepatectomy complications in patients with hepatocellular carcinoma. Dis Markers. (2019) 2019:9850191. doi: 10.1155/2019/9850191
67. Ge PS and Runyon BA. Treatment of patients with cirrhosis. N Engl J Med. (2016) 375:767–77. doi: 10.1056/NEJMra1504367
68. Vanni E and Bugianesi E. Obesity and liver cancer. Clin Liver Dis. (2014) 18:191–203. doi: 10.1016/j.cld.2013.09.001
69. Park EJ, Lee JH, Yu GY, He G, Ali SR, Holzer RG, et al. Dietary and genetic obesity promote liver inflammation and tumorigenesis by enhancing IL-6 and TNF expression. Cell. (2010) 140:197–208. doi: 10.1016/j.cell.2009.12.052
70. Masson N and Ratcliffe PJ. Hypoxia signaling pathways in cancer metabolism: the importance of co-selecting interconnected physiological pathways. Cancer Metab. (2014) 2:3. doi: 10.1186/2049-3002-2-3
71. Neuschwander-Tetri BA. Hepatic lipotoxicity and the pathogenesis of nonalcoholic steatohepatitis: the central role of nontriglyceride fatty acid metabolites. Hepatology. (2010) 52:774–88. doi: 10.1002/hep.23719
72. Zámbó V, Simon-Szabó L, Szelényi P, Kereszturi E, Bánhegyi G, and Csala M. Lipotoxicity in the liver. World J Hepatol. (2013) 5:550–7. doi: 10.4254/wjh.v5.i10.550
73. Giannetta E, La Salvia A, Rizza L, Muscogiuri G, Campione S, Pozza C, et al. Are markers of systemic inflammatory response useful in the management of patients with neuroendocrine neoplasms? Front Endocrinol. (2021) 12:672499. doi: 10.3389/fendo.2021.672499
74. Tontikidou C, Makri ES, Evripidou K, Goulis DG, Goulas A, and Polyzos SA. Circulating adiponectin in patients with nonalcoholic fatty liver disease-related liver fibrosis: A systematic review and a meta-analysis. J Gastroenterol Hepatol. (2022) 37:1853–64. doi: 10.1111/jgh.15926
75. Jiang Z, Zhou J, Zhou D, Zhu Z, Sun L, and Nanji AA. The adiponectin-SIRT1-AMPK pathway in alcoholic fatty liver disease in the rat. Alcohol Clin Exp Res. (2015) 39:424–33. doi: 10.1111/acer.12641
76. Buechler C, Haberl EM, Rein-Fischboeck L, and Aslanidis C. Adipokines in liver cirrhosis. Int J Mol Sci. (2017) 18:1392. doi: 10.3390/ijms18071392
77. Leclercq IA, Farrell GC, Schriemer R, and Robertson GR. Leptin is essential for the hepatic fibrogenic response to chronic liver injury. J Hepatol. (2002) 37:206–13. doi: 10.1016/s0168-8278(02)00102-2
78. Mousa N, Abdel-Razik A, Sheta T, Shabana W, Zakaria S, Awad M, et al. Serum leptin and homeostasis model assessment-IR as novel predictors of early liver fibrosis in chronic hepatitis B virus infection. Br J BioMed Sci. (2018) 75:192–6. doi: 10.1080/09674845.2018.1505187
79. Ray A and Cleary MP. The potential role of leptin in tumor invasion and metastasis. Cytokine Growth Factor Rev. (2017) 38:80–97. doi: 10.1016/j.cytogfr.2017.11.002
80. Samal B, Sun Y, Stearns G, Xie C, Suggs S, and McNiece I. Cloning and characterization of the cDNA encoding a novel human pre-B-cell colony-enhancing factor. Mol Cell Biol. (1994) 14:1431–7. doi: 10.1128/mcb.14.2.1431-1437.1994
81. Terra X, Auguet T, Quesada I, Aguilar C, Luna AM, Hernández M, et al. Increased levels and adipose tissue expression of visfatin in morbidly obese women: the relationship with pro-inflammatory cytokines. Clin Endocrinol (Oxf). (2012) 77:691–8. doi: 10.1111/j.1365-2265.2011.04327.x
82. Liang NL, Men R, Zhu Y, Yuan C, Wei Y, Liu X, et al. Visfatin: an adipokine activator of rat hepatic stellate cells. Mol Med Rep. (2015) 11:1073–8. doi: 10.3892/mmr.2014.2795
83. Yang B, Lu L, Zhou D, Fan W, Barbier-Torres L, Steggerda J, et al. Regulatory network and interplay of hepatokines, stellakines, myokines and adipokines in nonalcoholic fatty liver diseases and nonalcoholic steatohepatitis. Front Endocrinol (Lausanne). (2022) 13:1007944. doi: 10.3389/fendo.2022.1007944
84. Steppan CM and Lazar MA. The current biology of resistin. J Intern Med. (2004) 255:439–47. doi: 10.1111/j.1365-2796.2004.01306.x
85. Pagano C, Soardo G, Pilon C, Milocco C, Basan L, Milan G, et al. Increased serum resistin in nonalcoholic fatty liver disease is related to liver disease severity and not to insulin resistance. J Clin Endocrinol Metab. (2006) 91:1081–6. doi: 10.1210/jc.2005-1056
86. Zou CC, Liang L, Hong F, Fu JF, and Zhao ZY. Serum adiponectin, resistin levels and non-alcoholic fatty liver disease in obese children. Endocr J. (2005) 52:519–24. doi: 10.1507/endocrj.52.519
87. Aydin S, Kuloglu T, Aydin S, Kalayci M, Yilmaz M, Cakmak T, et al. A comprehensive immunohistochemical examination of the distribution of the fat-burning protein irisin in biological tissues. Peptides. (2014) 61:130–6. doi: 10.1016/j.peptides.2014.09.014
88. Chi C, Fu H, Li YH, Zhang GY, Zeng FY, Ji QX, et al. Exerkine fibronectin type-III domain-containing protein 5/irisin-enriched extracellular vesicles delay vascular ageing by increasing SIRT6 stability. Eur Heart J. (2022) 43:4579–95. doi: 10.1093/eurheartj/ehac431
89. Provatopoulou X, Georgiou GP, Kalogera E, Kalles V, Matiatou MA, Papapanagiotou I, et al. Serum irisin levels are lower in patients with breast cancer: association with disease diagnosis and tumor characteristics. BMC Cancer. (2015) 15:898. doi: 10.1186/s12885-015-1898-1
90. Tu T, Bühler S, and Bartenschlager R. Chronic viral hepatitis and its association with liver cancer. Biol Chem. (2017) 398:817–37. doi: 10.1515/hsz-2017-0118
91. Paul B, Lewinska M, and Andersen JB. Lipid alterations in chronic liver disease and liver cancer. JHEP Rep. (2022) 4:100479. doi: 10.1016/j.jhepr.2022.100479
92. D’Souza S, Lau KC, Coffin CS, and Patel TR. Molecular mechanisms of viral hepatitis induced hepatocellular carcinoma. World J Gastroenterol. (2020) 26:5759–83. doi: 10.3748/wjg.v26.i38.5759
93. Hsu CS, Liu WL, Chao YC, Lin HH, Tseng TC, Wang CC, et al. Adipocytokines and liver fibrosis stages in patients with chronic hepatitis B virus infection. Hepatol Int. (2015) 9:231–42. doi: 10.1007/s12072-015-9616-2
94. Holmes-McNary M. Impact factors on development of cirrhosis and subsequent hepatocellular carcinoma. Compend Contin Educ Dent. (2001) 22:19–33.
95. Ismaiel A, Ciornolutchii V, Herrera TE, Ismaiel M, Leucuta DC, Popa SL, et al. Adiponectin as a biomarker in liver cirrhosis-A systematic review and meta-analysis. Eur J Clin Invest. (2025) 55:e14328. doi: 10.1111/eci.14328
Keywords: HCC, hepatocellular carcinoma, adipokine, adiponectin, leptin, meta-analysis
Citation: Ke Y, Pan Y, Huang X, Bai X, Liu X, Zhang M, Jiang T and Zhang G (2025) Correlations between circulating adipokines and hepatocellular carcinoma: a Systematic Review and meta-analysis. Front. Endocrinol. 16:1548924. doi: 10.3389/fendo.2025.1548924
Received: 20 December 2024; Accepted: 30 May 2025;
Published: 18 June 2025.
Edited by:
Evin Iscan, Dokuz Eylül University, TürkiyeReviewed by:
Anna La Salvia, National Institute of Health (ISS), ItalyRenxian Xie, Shantou University, China
Jinliang Dong, Zhoushan Hospital, China
Copyright © 2025 Ke, Pan, Huang, Bai, Liu, Zhang, Jiang and Zhang. This is an open-access article distributed under the terms of the Creative Commons Attribution License (CC BY). The use, distribution or reproduction in other forums is permitted, provided the original author(s) and the copyright owner(s) are credited and that the original publication in this journal is cited, in accordance with accepted academic practice. No use, distribution or reproduction is permitted which does not comply with these terms.
*Correspondence: Guangji Zhang, emdqdGNtQHpjbXUuZWR1LmNu; Tao Jiang, anR0Y21AemNtdS5lZHUuY24=
†These authors share first authorship