 Shijie Wang
 Ruowen Li
 Li Zhang
 Tingbin Xie
 Xinying Wang
- Clinical Nutrition Service Center, Department of General Surgery, Nanjing jinling Hospital, Affiliated Hospital of Medical School, Nanjing University, Nanjing, China
Background: Previous studies have linked kidney damage to insulin resistance (IR), yet the association between triglyceride glucose–body mass (TyG–BMI) index, a reliable marker of IR, and acute kidney injury (AKI) remains unclear.
Methods: Patient data were collected from the Medical Information Mart for Intensive Care IV (MIMIC-IV) database. AKI was set as the primary endpoint, and renal replacement therapy (RRT) was set as the secondary endpoint to represent the progression of AKI. TyG–BMI index and study endpoints were analyzed using Cox regression and restricted cubic spline (RCS) analyses.
Results: A total of 1,117 patients with sepsis were enrolled, of whom 559 (50.0%) developed AKI. The result of Cox regression revealed that the TyG–BMI index was closely related to AKI (P = 0.032), and RCS analysis depicted a nonlinear correlation (P for nonlinear = 0.013). For RRT, similar results were observed. Compared with the simple severity of illness scores (SOFA, APSIII, SAPSII, and SIRS), when combined with the TyG–BMI index, their predictive ability for sepsis-related AKI significantly increased (AUCs: 0.745, 0.732, 0.708, and 0.566 vs. 0.756, 0.747, 0.728, and 0.661; all P < 0.05).
Conclusions: For critically ill patients with sepsis, an elevated TyG–BMI index implies a possible increased risk of AKI. The TyG–BMI index has the potential to be a valuable predictor.
Background
Sepsis, a life-threatening disease, is characterized by multi-organ damage induced by the dysfunction of the host’s immune response to infection (1). Annually, nearly 50 million cases are diagnosed globally, with sepsis-related deaths accounting for more than 50% of in-hospital deaths (2, 3). Despite advancements in medical technology, the mortality rates for sepsis have not significantly improved (4). Sepsis may impair renal function, with approximately 60% of patients experiencing acute kidney injury (AKI) (5, 6). Once it occurs, it increases sepsis mortality by three to five times, leading to worse clinical outcomes (7). Therefore, the early detection of patients with a tendency to develop AKI and timely intervention are crucial to improve the prognosis.
Sepsis is often accompanied by insulin resistance (IR), which may be caused by systemic inflammation (8). Additionally, IR can inhibit the autophagic activity of podocytes, leading to kidney injury, and is positively correlated with kidney injury molecule-1 (9, 10). The triglyceride–glucose (TyG) index, an innovative marker, has been considered a convenient replacement indicator for IR (11). More importantly, the degree of IR in the body is more accurately reflected when used in conjunction with body mass index (BMI) (12). The findings above seem to suggest that TyG–BMI index may predict the occurrence of AKI, which would help to identify high-risk patients and thus enable early intervention. For certain diseases, such as hypertension, myocardial infarction, and chronic kidney disease, a strong association exists between their incidence and TyG–BMI index (13–15). However, it remains unclear whether this correlation exists in individuals with sepsis-associated AKI.
Consequently, the current study hypothesizes an association between TyG–BMI index and sepsis-associated AKI and intends to explore the issue utilizing this large cohort, with a view to guiding clinical practice.
Methods
Study population
Clinical data were retrospectively extracted from the MIMIC-IV database. One author (WSJ) successfully passed all of the required examinations for accessing the database and obtained approval to use the dataset (certification number: 56051808). The review committee of Massachusetts Institute of Technology and Beth Israel Deaconess Medical Center approved the database for medical health-related research without requiring informed consent.
All patients with sepsis met the Sepsis 3.0 criteria, defined as the presence of infection and sequential organ failure assessment (SOFA) score ≥2 (16). The Kidney Disease: Improving Global Outcomes (KDIGO) guideline was used to confirm the presence of AKI (17). The exclusion criteria were as follows: (1) age <18 years, (2) only the first data were extracted if multiple ICU admissions for sepsis existed, (3) missing fasting blood glucose (FBG), triglyceride, and BMI data within 24 h of ICU admission, (4) diagnosed with AKI prior to ICU admission, (5) and missing AKI data within 48 h. Finally, 1,117 patients with sepsis were enrolled, and the cohort was divided according to the TyG–BMI quartile (Figure 1).
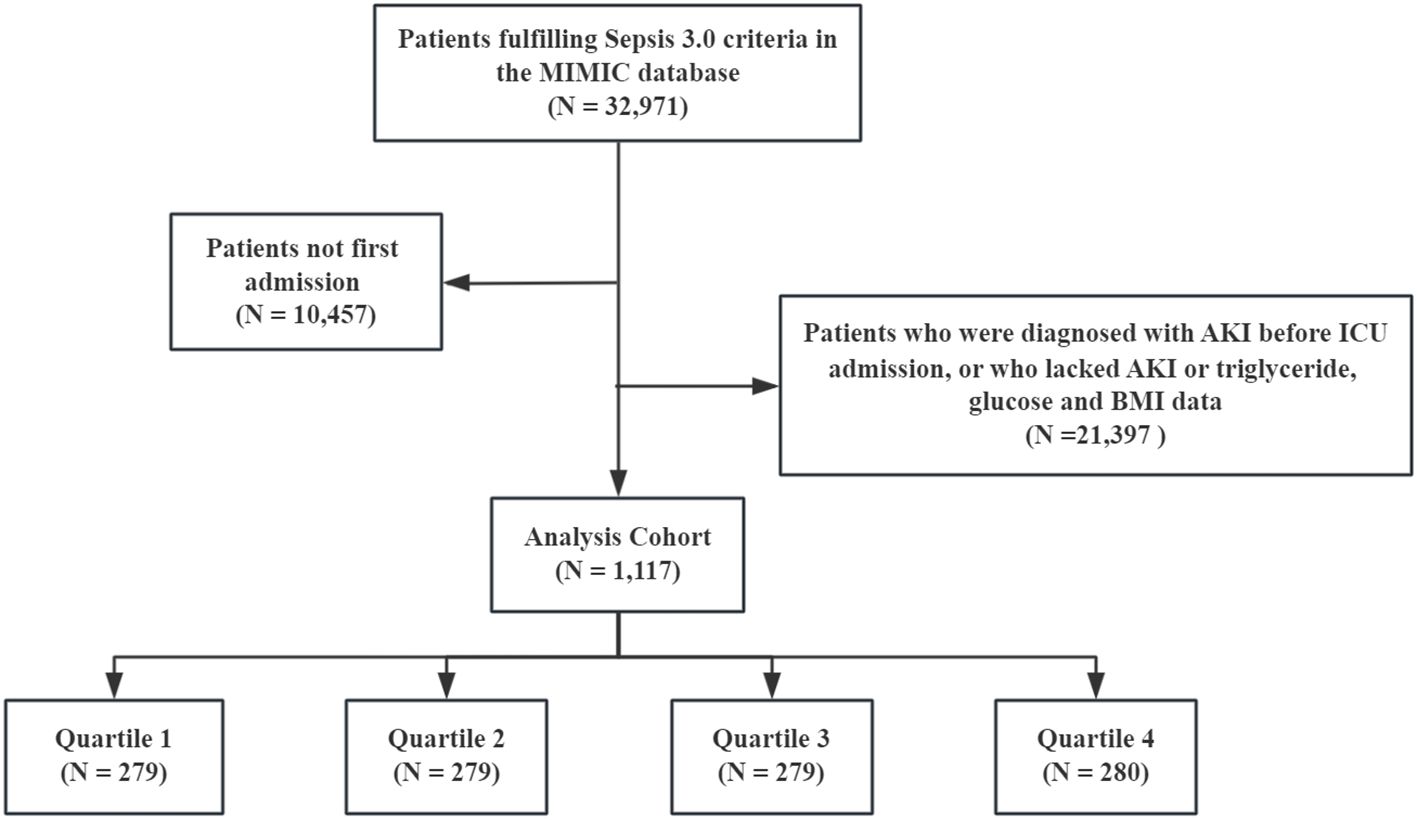
Figure 1. Flow of the included patients.
Data collection
Data on the basic characteristics of the patients were extracted using PostgresSQL and Navicat Premium software and merged with Stata software. Detailed clinical data included demographics (age, sex, race, height, weight, and BMI), laboratory test results (international normalized ratio [INR], blood urea nitrogen [BUN], low-density lipoprotein [LDL], sodium, chloride, aspartate aminotransferase [AST], albumin, red blood cell [RBC], high-density lipoprotein [HDL], neutrophils, hemoglobin, platelets, hematocrit, total bilirubin, prothrombin time [PT], C-reactive protein [CRP], serum creatinine [SCr], alanine aminotransferase [ALT], white blood cells [WBC], alkaline phosphatase [ALP], calcium, lymphocytes, anion gap, activated partial thromboplastin time [APTT], blood glucose, triglycerides, potassium, and total cholesterol [TC]), medication (statin, insulin, and metformin), vital signs, and severity of illness scores. Since the MIMIC database does not explicitly specify which values represent FBG, all values are simply labeled as “blood glucose”. Therefore, we inferred based on patients’ medication use to exclude interference from insulin, glucose injection, and enteral nutrition on blood glucose values as much as possible. Data on the blood collection time for glucose tests on the first day of ICU admission as well as the start times of insulin, glucose injections, and enteral nutrition were extracted. If the blood collection occurred after the start of any of these interventions, the corresponding glucose value was considered interfered and excluded. Specific procedures and codes are provided in the supplementary methods. The International Classification of Diseases (9th and 10th) was used to identify comorbidities, including chronic kidney disease (CKD), cancer, diabetes, hypertension, arterial fibrillation (AF), and heart failure (HF). Within 24 h of ICU admission, all test indicators and scores were collected, and the SCr level and urine output were continuously monitored throughout the hospital stay. Information on medication use in the 24 h prior to ICU admission was collected. The timings of initial AKI and renal replacement therapy (RRT) were determined. Follow-up continued from the date of admission to all study endpoints.
TyG–BMI index formula: ln [triglyceride (mg/dL) × FBG (mg/dL)/2] × BMI (18). For the variables included in this study, multiple interpolation (multiple imputation by chained equations) was used to fill in those with missing values <20%, while those with missing values >20% were deleted (12). Lymphocytes, neutrophils, albumin, HDL, LDL, CRP, and TC contained more than 20% missing value.
Endpoints of interest
AKI was set as the primary endpoint. KDIGO guidelines were utilized: SCr was 1.5-fold higher than baseline within 7 days or elevation of SCr by 0.3 mg/dL in 48 h or urine output less than 0.5 mL/kg per hour for at least 6 h. The reference baseline of SCr was determined as the lowest recorded value within 7 days prior to ICU admission (276 patients), and if this information was not available, the SCr first measured at admission to ICU was used (841 patients). RRT, representing disease progression to AKI, was used as a secondary endpoint. Meanwhile, ICU, in-hospital, 28-day, and 1-year mortality were also specified as secondary endpoints.
Statistical analysis
The proportional hazards assumption was verified using Schoenfeld residual plots, and no violation was detected (Supplementary Figure S1). The occurrence of primary and secondary endpoints was depicted by the Kaplan–Meier curve. By utilizing Cox regression analysis, the study excluded confounders to identify independent association (survival package, version 3.5–5 and survminer package, version 0.4.9). The Fine–Gray model was constructed to analyze the competitive risk in order to evaluate the stability of the results (cmprsk package). To evaluate the possible influence of unmeasured confounding on the observed hazard ratios, E-values were analyzed. To avoid multicollinearity, variables were excluded when the variance inflation factor was greater than 5 (car package). To depict the dose–response effects, restricted cubic spline (RCS) analysis was conducted (ggrcs package, version 0.4.0). Furthermore, subgroup analyses of hypertension, HF, CHD, CKD, AF, diabetes, age, sex, and BMI were conducted (jstable package, version 1.1.7). The interactions were assessed with likelihood ratio tests.
The area under the curve (AUC) was used to reflect the predictive power of existing severity of illness scores for AKI when incorporating the TyG–BMI index (timeROC package). Integrated discrimination improvement (IDI) was computed by subtracting the difference in the probability of positivity predicted by the difference between the different models for the disease group from the difference in the probability of positivity predicted by the old and new models for the non-disease group (19). Reclassified by event occurrence, the net reclassification improvement (NRI) performed a net magnitude synthesis and quantified the degree of improvement. These two indexes allow the risk reclassification of the model (survIDINRI package, version 1.1–2). The analysis and visualization were conducted using R (version 4.1.3) and SPSS (version 27.0). Statistical significance in the current study was defined as P <0.05.
Results
Patient characteristics
A total of 1,117 patients with sepsis were enrolled, of whom 559 (50.0%) developed AKI and 201 (18.0%) received RRT. Meanwhile, 204 (18.5%) ICU deaths and 250 (22.4%) in-hospital deaths occurred.
According to the TyG–BMI index, the overall patients were grouped by quartiles [quartile (Q) 1: <244.37; Q2: 244.37–291.05; Q3: 291.06–355.40; Q4: >355.40]. Patients in the Q4 group had higher BMI, heart rate, and severity of illness scores but were younger. The prevalence of diabetes was higher, and that of CHD was lower in this group. With regard to laboratory indicators, the Q4 group showed higher WBC, anion gap, total bilirubin, ALT, AST, BUN, SCr, FBG, triglycerides, and potassium ions but lower platelets, chloride, and calcium levels. With increasing TyG–BMI index, the incidence of AKI and RRT in the four groups gradually increased (AKI: 36.2% vs. 43.7% vs. 53.4% vs. 66.8%, P < 0.001; RRT: 5.7% vs. 11.8% vs. 24.7% vs. 29.7%, P < 0.001). However, no statistical differences were observed in the in-hospital, ICU, 28-day, and 1-year mortality among the groups (P = 0.552, P = 0.323, P = 0.827, and P = 0.697, respectively) (Table 1).
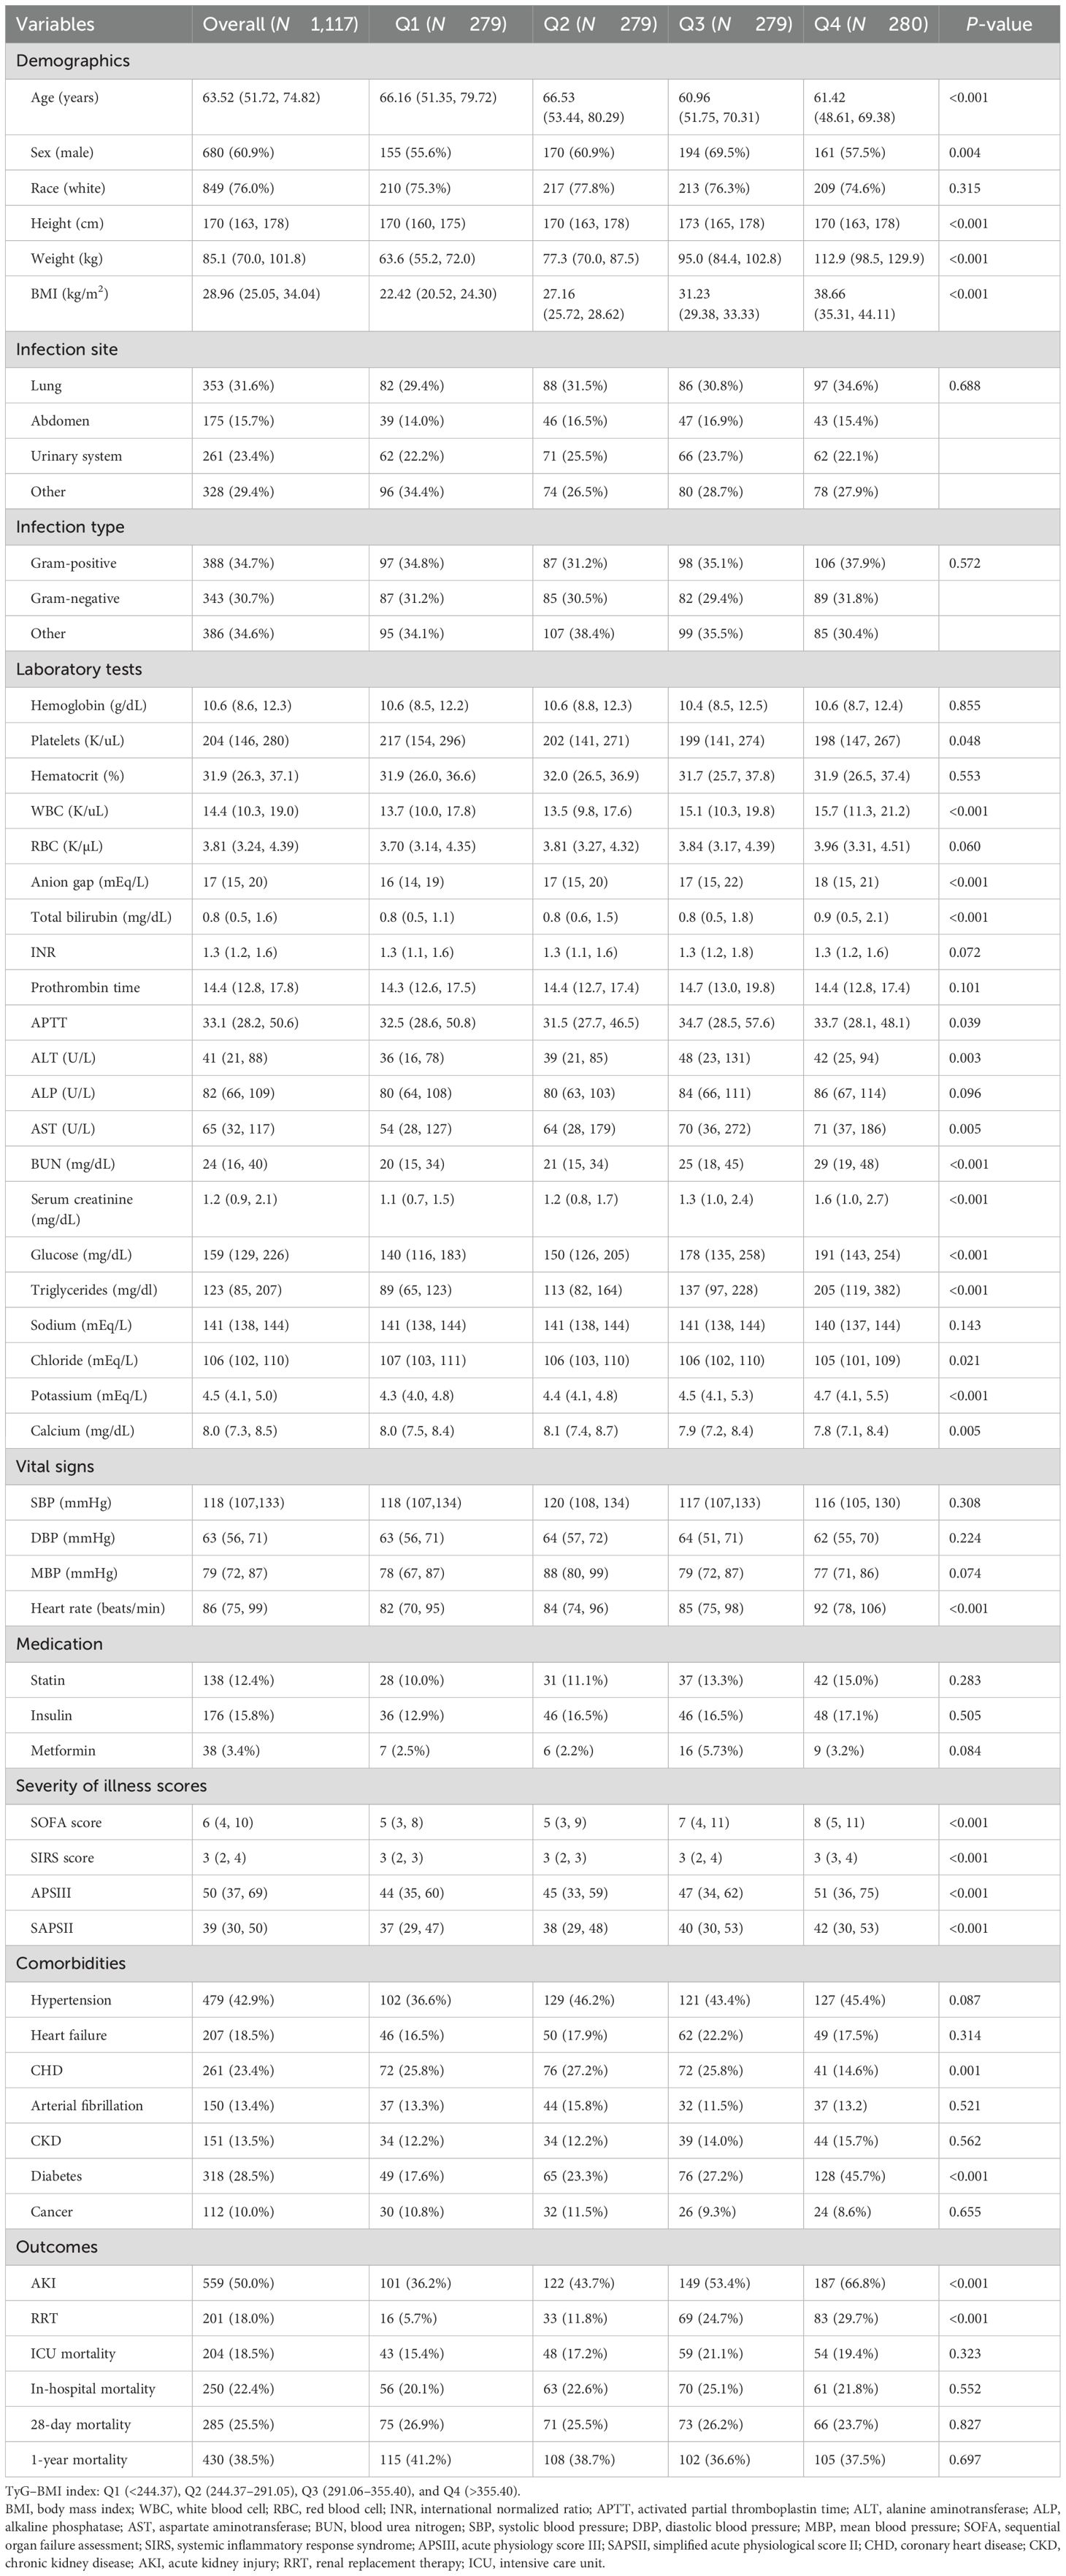
Table 1. Baseline characteristics according to TyG–BMI index quartiles.
Further grouping was determined by the presence of AKI (Table 2). The prevalence of HF, CKD, cancer, and diabetes was higher in the AKI group but with a lower prevalence of hypertension. Meanwhile, the BMI and severity of illness scores were also higher. For laboratory indicators, the AKI group had significantly higher levels of WBC, anion gap, total bilirubin, INR, PT, APTT, ALT, ALP, AST, BUN, SCr, FBG, triglycerides, and potassium. More importantly, the AKI patients showed a higher TyG–BMI index (P < 0.001).
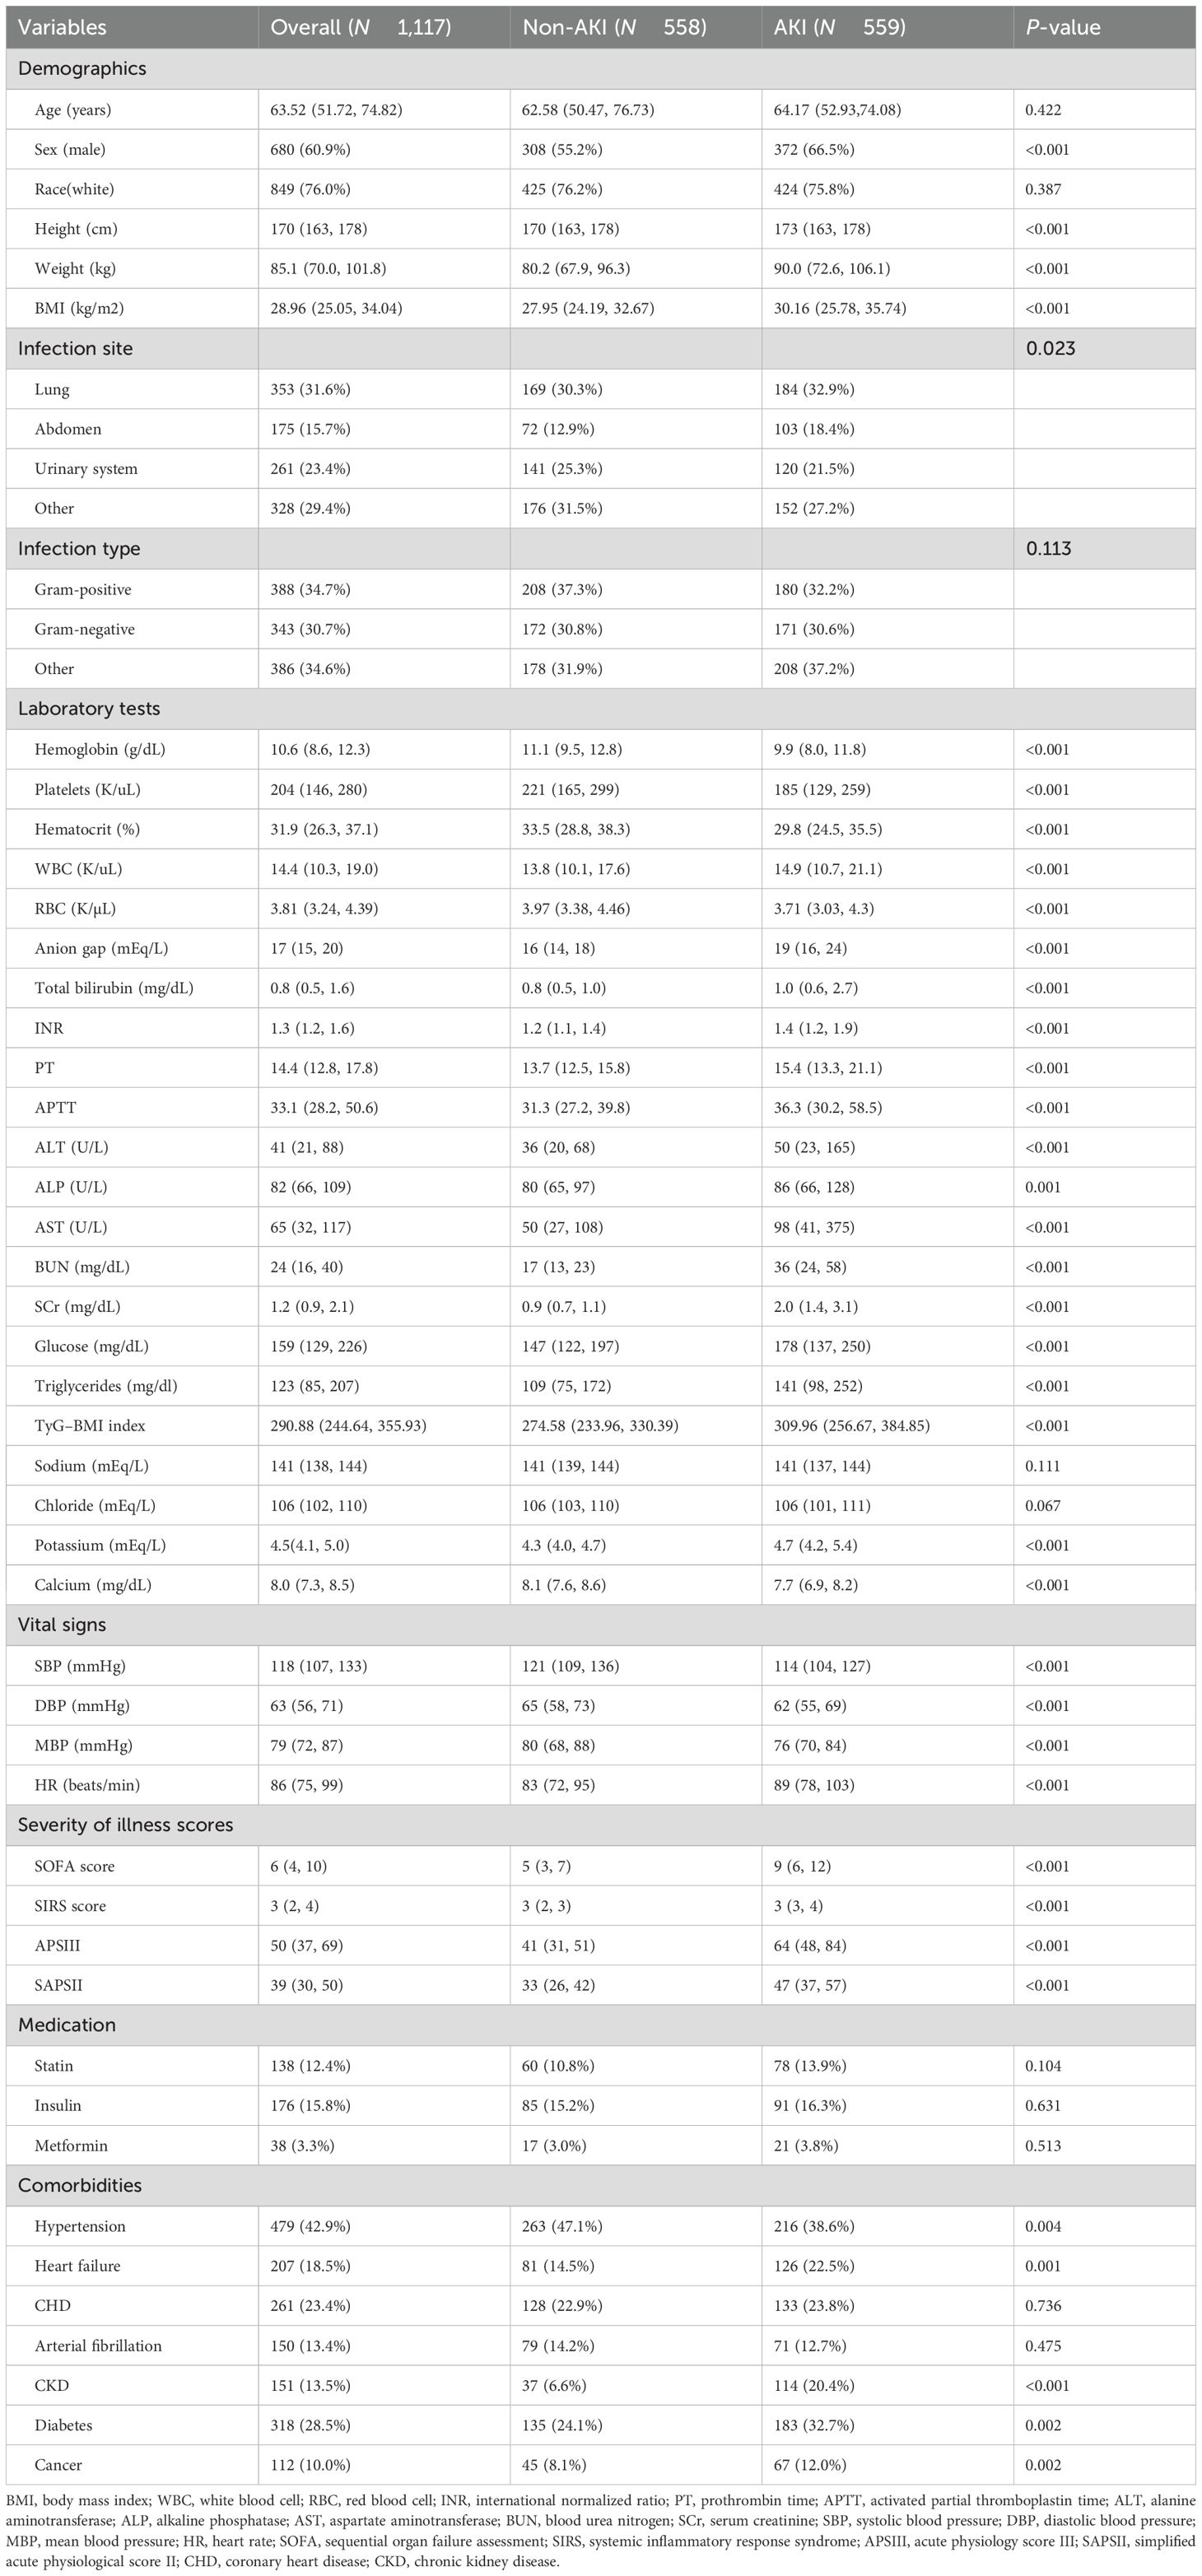
Table 2. Baseline characteristics of the AKI and non-AKI groups.
Primary and secondary endpoints
In order to describe the occurrence of study endpoints, Kaplan–Meier method was employed. For AKI, significant differences were observed; the Q4 group had the highest incidence of AKI (P < 0.001) (Figure 2a). As for RRT, similar results were observed (P < 0.001) (Figure 2b). The cumulative incident curves of AKI and RRT were plotted using the CIF method, and Gray’s test was conducted, showing similar results to the data above (P < 0.001) (Supplementary Figure S2). Nevertheless, no statistical differences existed among the four groups for other secondary endpoints (all P > 0.05) (Supplementary Figure S3).
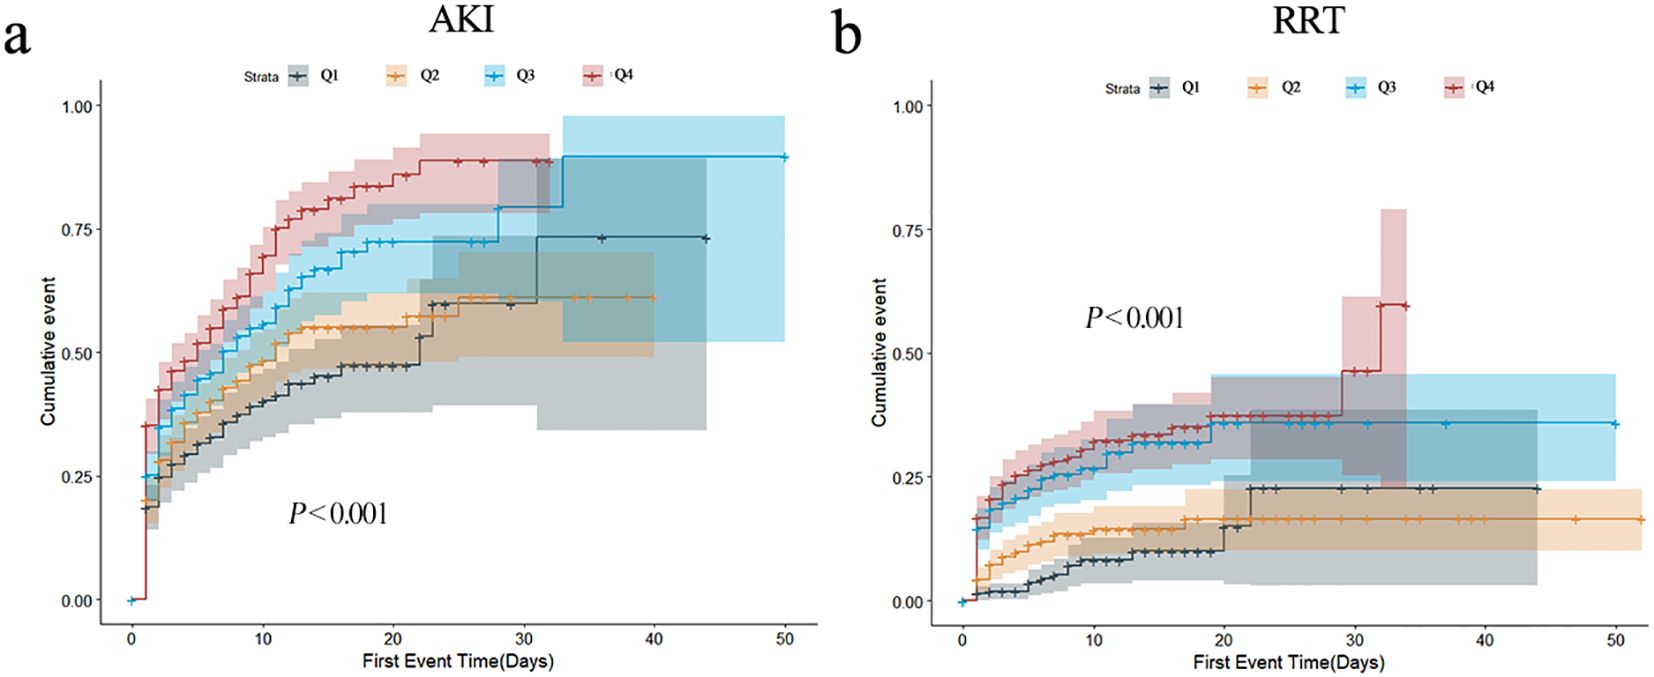
Figure 2. Cumulative event incidence curves for incidence of AKI (a) and requiring RRT (b).
The variance inflation factors were calculated to exclude the collinearity of the factors included in the multivariate analysis (Supplementary Table S1). The TyG–BMI index was incorporated in Cox regression analysis to identify an independent association with AKI and RRT when, as a continuous variable in model 3, the risk of AKI increased by 1.1% for each 10-unit increase in the TyG–BMI index (P = 0.032) (Table 3). When incorporated as a nominal variable in model 3, the Q4 group showed a much higher risk of AKI compared to the Q1 group (P = 0.012) (Table 3); the E-value for this model was 1.73 (Supplementary Figure S4a). Similar results were shown for RRT, with a 2.6% increase in AKI risk for a 10-unit increase in the TyG–BMI index (P < 0.001) (Table 3). In the nominal variable model, significant differences were also observed between groups, with an E-value of 2.05 (Supplementary Figure S4b). Meanwhile, the results of the competitive risk analysis using the Fine–Gray model were similar to those of the Cox regression analysis (Supplementary Table S2). Furthermore, the RCS analysis demonstrated that the risk of both AKI (P for nonlinear = 0.013) and RRT (P for nonlinear = 0.003) were nonlinearly associated with increasing TyG–BMI index (Figure 3).
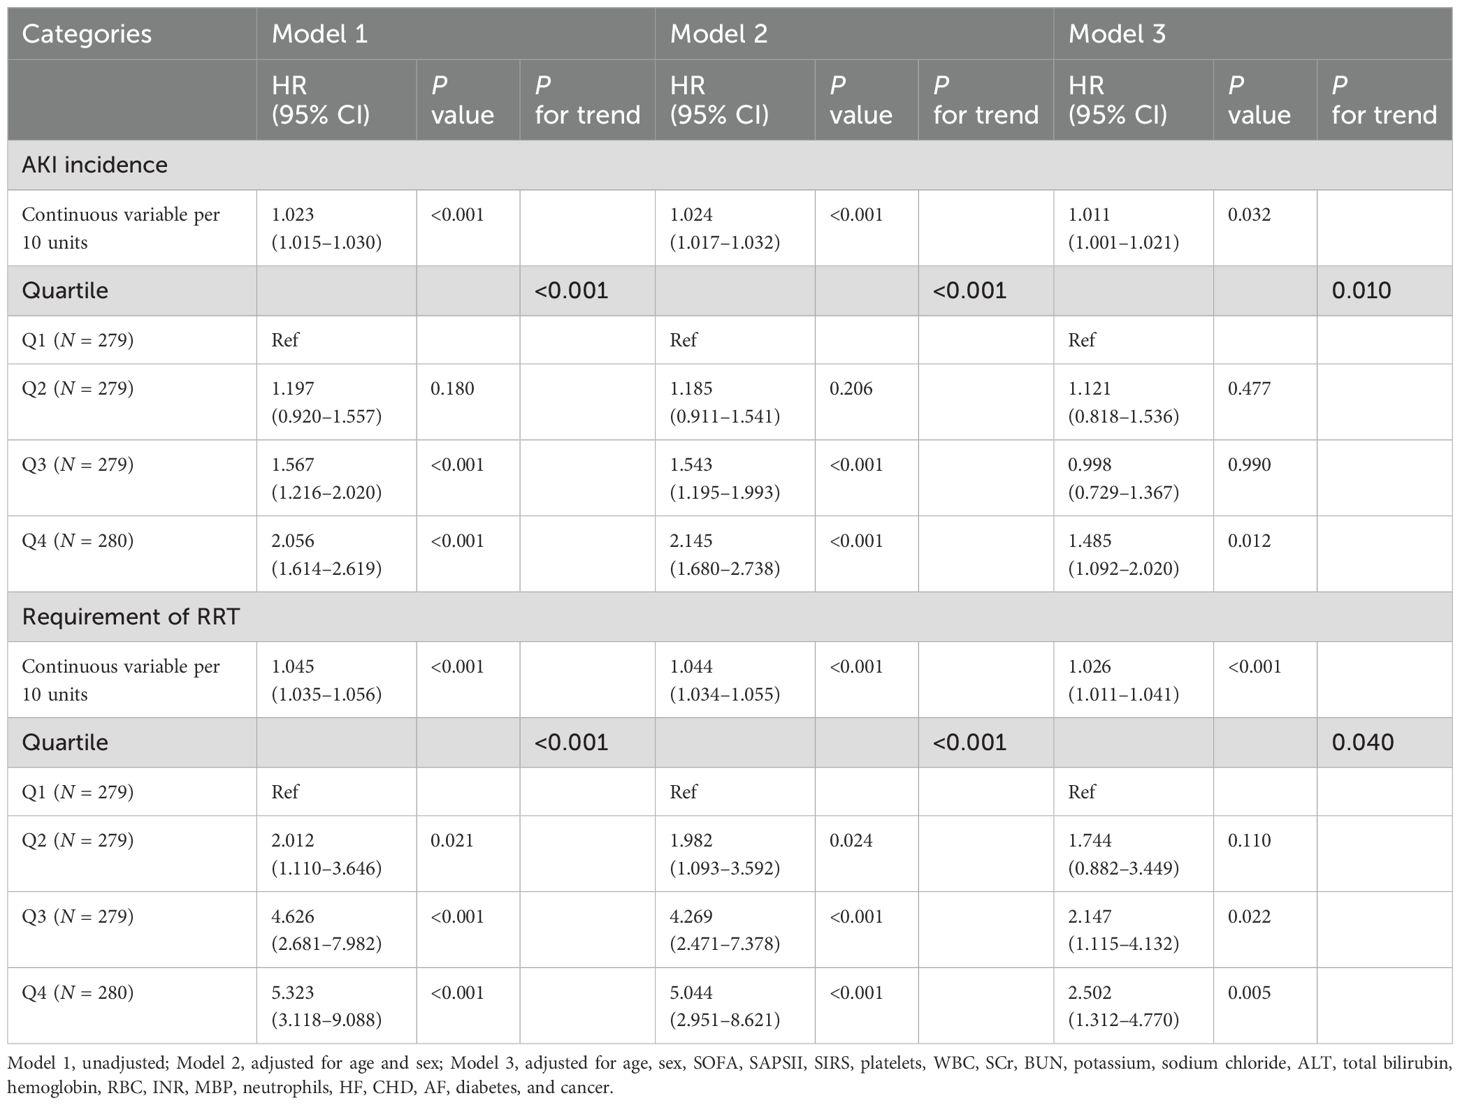
Table 3. Cox proportional hazard ratios (HR) for AKI and requiring RRT.
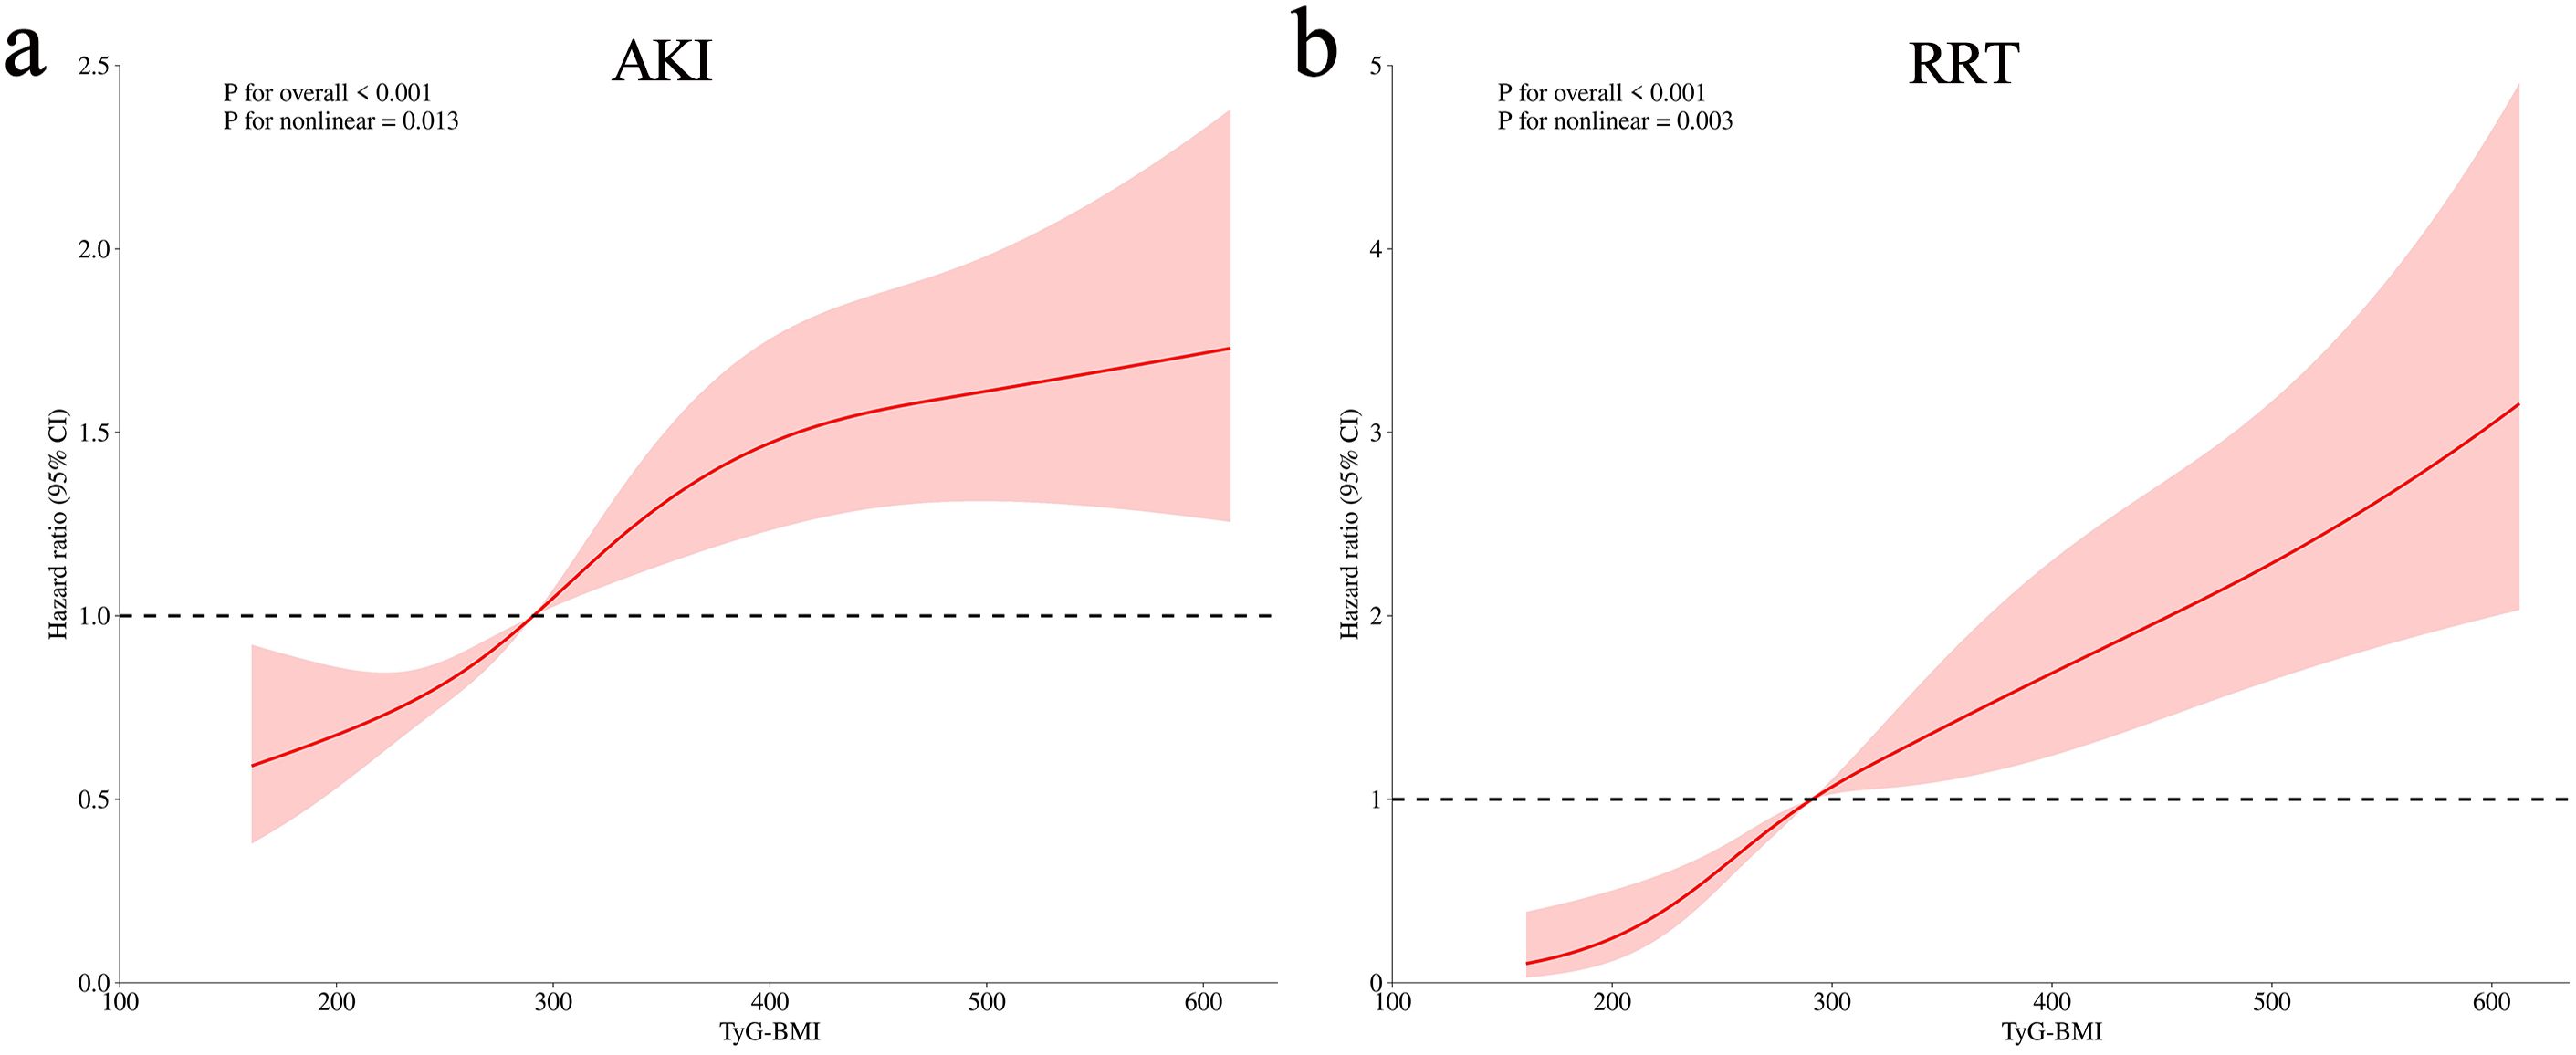
Figure 3. Restricted cubic spline analysis of TyG–BMI index with AKI (a) and requiring RRT (b).
Subgroup analyses
To test whether these associations persist in specific populations, subgroup analyses were conducted. The significant association between AKI and the TyG–BMI index persisted in most subgroups, except for patients with HF and CKD (Figure 4a). Notably, the association was not as pronounced for patients with HF as it was for patients without HF (HR [95% CI] non-HF: 1.03 [1.02–1.04] vs. HF: 1.01 [0.99–1.02], P for interaction = 0.043). However, the prevalence of CKD did not influence the association between AKI and the TyG–BMI index (P for interaction = 0.498). Interestingly, all subgroups of the population experienced an increased risk of RRT with higher TyG–BMI index values (all P < 0.05; Figure 4b).
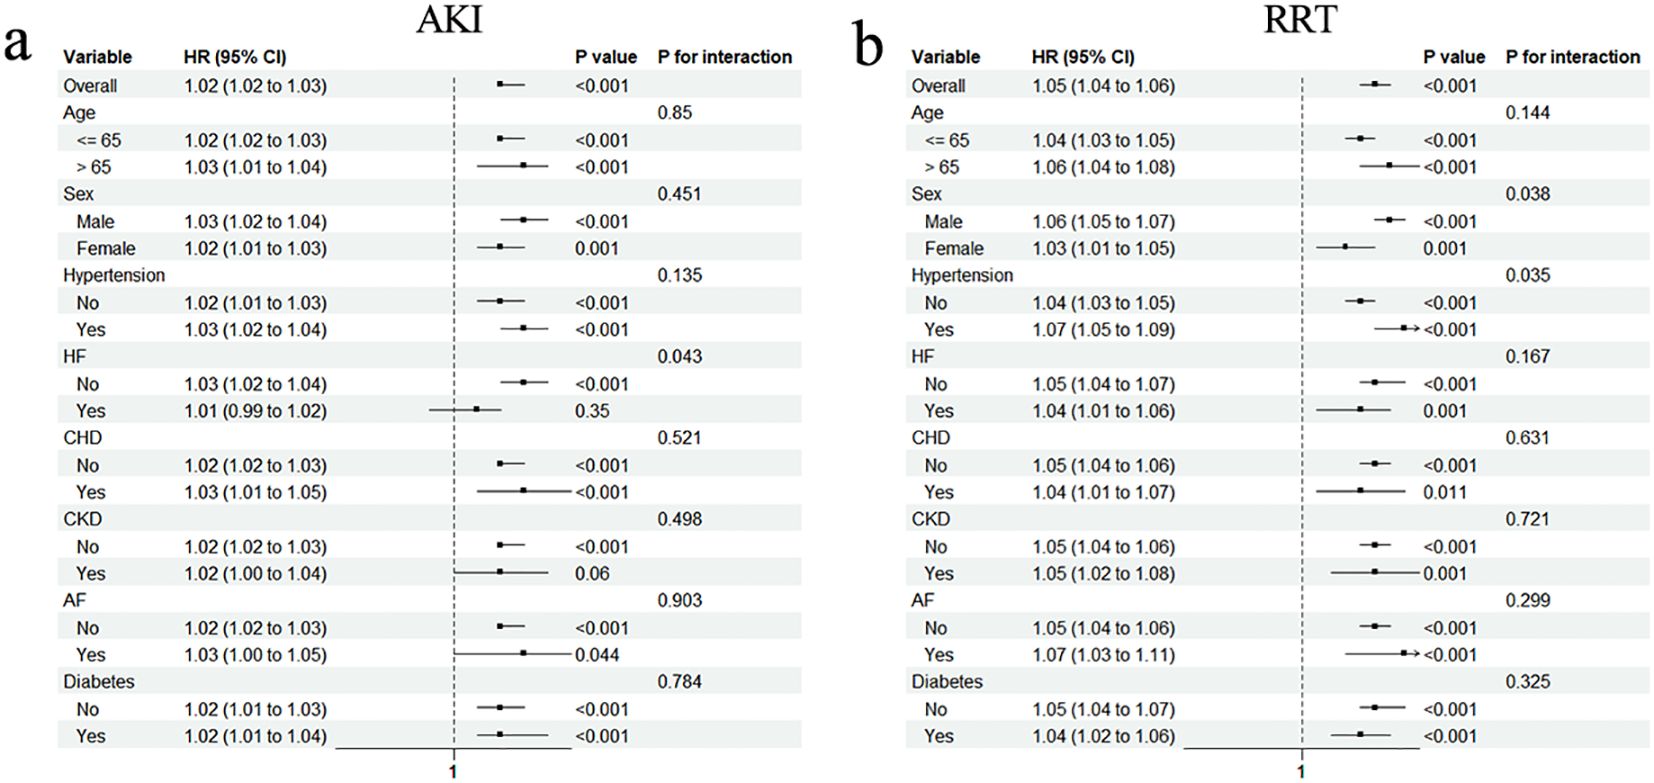
Figure 4. Subgroup analyses for the association of TyG–BMI index with AKI (a) and requiring RRT (b). HR, hazard ratio; CI, confidence interval; HF, heart failure; CHD, coronary heart disease; CKD, chronic kidney disease; AF, arterial fibrillation.
Added predictive value of the TyG–BMI index for AKI
To determine the predictive power of severity of illness scores and the combination with TyG–BMI index for sepsis-associated AKI, the AUCs were calculated. The findings indicated a slight increase in ACUs for SOFA, APSIII, SAPSII, and SIRS when the TyG–BMI index was included (Table 4). For assessing the risk reclassification power, the NRIs and IDIs were computed next. The results showed that, for severity of illness scores (SOFA, APSIII, SAPSII, and SIRS), the combined use of the TyG–BMI index led to a statistically significant increase in NRI and IDI (all P < 0.05) (Table 4).
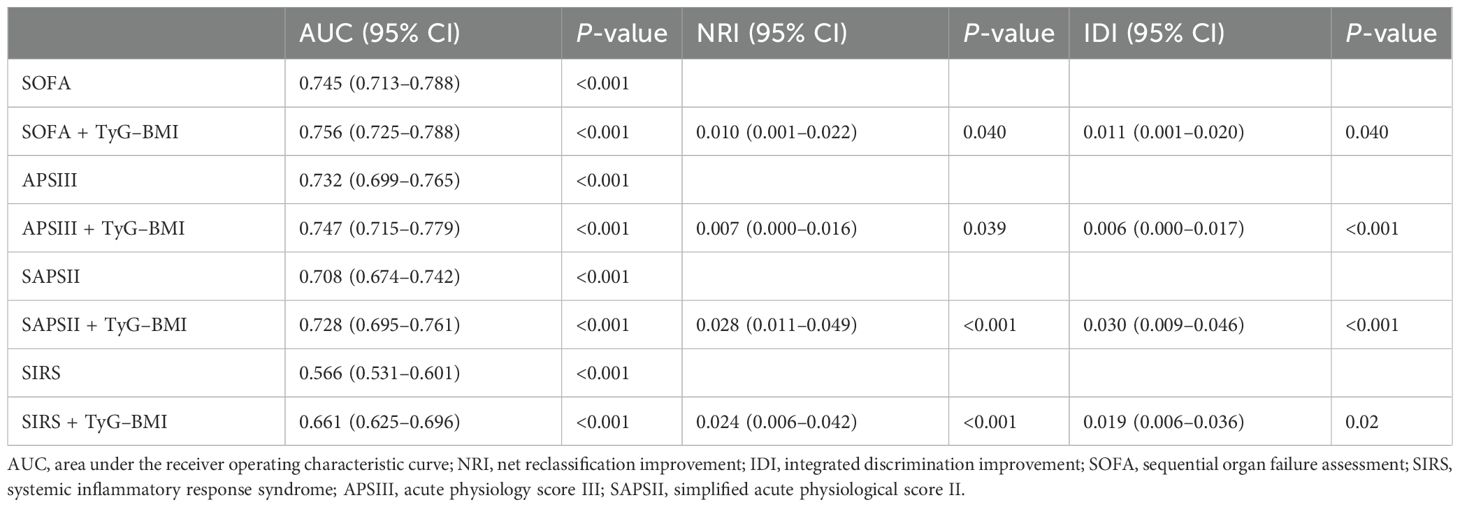
Table 4. Performance metrics of severity of illness scores with and without TyG–BMI index to predict sepsis-associated AKI.
Discussion
The present study is the first to examine the link between the TyG–BMI index and AKI in patients with sepsis. It determined that TyG–BMI exhibited an independent association with AKI, even following adjustment for potential confounding variables, providing a simple and effective predictive tool.
Sepsis often leads to AKI, which not only results in extremely high mortality but also increases the risk of chronic comorbidities (20). Despite ongoing efforts and research, the complex pathophysiology of sepsis-associated AKI has not yet been fully revealed (21). Systemic inflammation and microcirculatory disturbances in the organs were previously thought to be the key mechanisms leading to AKI, but metabolic disturbances during sepsis have attracted increasing attention in recent years (21). During sepsis, elevated catecholamines, release of inflammatory factors, and energy deficits may lead to abnormal lipid metabolism, which, in turn, promotes elevated levels of free fatty acids (22). Meanwhile, tumor necrosis factor can directly inhibit lipoprotein lipase, leading to elevated triglycerides (23). In addition, the release of inflammatory mediators increases liver gluconeogenesis and leads to peripheral IR, resulting in hyperglycemia, even in those without diabetes (24). Hyperglycemia can then trigger ketoacidosis and cause hyponatremia due to high osmolarity, exacerbating kidney damage (25–27). In addition, insulin-like growth factor-binding protein, an important factor involved in IR, has also been found to be directly involved in renal tubule injury (28–30). The abnormalities in blood glucose-related indices have also been shown to be associated with the prognosis of patients with aortic dissection and stroke (31, 32). IR is now recognized as an important causative factor in kidney injury (33).
The TyG–BMI index has been proposed in recent years and proven to better reflect systemic IR in stable populations. Septic patients often experience stress-induced hyperglycemia due to systemic inflammation and catecholamine surge, which may cause changes in the TyG–BMI index to be not only related to IR but also affected by glucose metabolic status (34). This implies that the TyG–BMI index may not accurately represent the state of IR in the body during stress. The specific mechanisms may need to be explored through glucose clamp technique, yet such studies have not been conducted in septic patients so far. Nevertheless, numerous studies have demonstrated its application value in septic patients. Fang et al. demonstrated an independent association between the TyG index and an increased risk of delirium in septic patients (35). In our study, after excluding many confounding factors, the TyG–BMI index was found to be closely related to AKI in the current study; those with a higher index were more prone to AKI. When AKI is progressively aggravated, RRT could address metabolic dysfunction and volume excess, reducing the burden on the kidneys (36). Therefore, the need for RRT is often regarded as an endpoint to represent the progression of AKI severity (37). In the current study, when the TyG–BMI index rose, the incidence of RRT also increased, with a non-linear correlation. Although whether the association between the TyG–BMI index and the study results is attributable to insulin resistance remains unclear, its predictive ability for sepsis-associated AKI and RT is still significant.
To further identify specific populations to which the TyG–BMI index applies, subgroup analyses were performed. The current study showed that the application value of the TyG–BMI index for AKI was not significantly altered by following clinical conditions, including age, sex, hypertension, CHD, AF, and diabetes. However, no significant correlation was found in patients with HF and CKD, which may be partly explained by the fact that HF and CKD are important precipitants to AKI (38, 39). In the context of these diseases, the role of IR and disordered glucose metabolism caused by severe sepsis in the development of AKI may be overshadowed.
The severity of illness scores is a useful tool to objectively quantify disease severity, which helps to identify the disease status and predict its endpoint (40). A previous study has shown that the SOFA score alone did not display a favorable predictive value for major renal adverse events associated with sepsis (41). It is of great value to explore whether combining the severity score with the TyG–BMI index could improve the predictive power. The current results show that the severity of illness scores, when combined with the TyG–BMI index, could significantly improve the ability to predict sepsis-associated AKI. Although it has previously been demonstrated that combining SOFA score with some biomarkers such as calprotectin and cystatin C could also improve the prediction of AKI, these biochemical indices are not routinely tested in most patients, making it easy to miss high-risk patients (42). In contrast, the TyG–BMI index does not increase the financial burden on patients and has the advantages of being simple and easily accessible. The deficiency is that the increment of AUC after combining the TyG–BMI index is relatively small, which seems to lead to a limited clinical impact. However, due to the large number of patients with sepsis and the prevalence of AKI, even a limited increase may bring certain benefits to patients.
Study strengths and limitations
In the current study, a large cohort was used to confirm the relationship between the TyG–BMI index and sepsis-associated AKI for the first time, and the data were analyzed according to different populations. However, several limitations remain. First, given the retrospective nature of the study, selection bias was unavoidable. Second, some important clinical data, such as infection site, procalcitonin, and C-reactive protein, were not included in the study due to insufficient database information. Third, the current study focused only on assessing the baseline values of the TyG–BMI index, ignoring dynamic changes throughout the treatment period. Fourth, there is currently no direct evidence to establish that the association between the TyG–BMI index and AKI is entirely attributable to IR. Future studies using glucose clamp techniques are warranted to further elucidate this relationship. Finally, since the FBG is inferred rather than explicitly recorded in the database, it may lead to deviations from the true FBG. These deviations may affect the accuracy of the TyG–BMI index and cause discrepancies between subsequent clinical applications and study findings. Therefore, conducting prospective cohort studies in the future is essential.
Conclusions
The current study demonstrated that the TyG–BMI index is independently associated with AKI and RRT in critically ill patients with sepsis in a nonlinear manner. This suggests that the TyG–BMI index could be a valuable clinical risk classification tool. Strengthening the detection of patients’ TyG–BMI index in clinical practice may help to identify those at a high risk of AKI and enable early intervention to improve the prognosis. Future studies should validate these findings in clinical practice and explore the underlying mechanisms.
Data availability statement
The original contributions presented in the study are included in the article/Supplementary Material. Further inquiries can be directed to the corresponding author.
Ethics statement
The studies involving humans were approved by The review committee of Massachusetts Institute of Technology and Beth Israel Deaconess Medical Center. The studies were conducted in accordance with the local legislation and institutional requirements. The ethics committee/institutional review board waived the requirement of written informed consent for participation from the participants or the participants’ legal guardians/next of kin because The study used a public, open database.
Author contributions
XW: Funding acquisition, Project administration, Resources, Visualization, Writing – review & editing. SW: Conceptualization, Formal Analysis, Investigation, Software, Writing – original draft, Writing – review & editing. RL: Data curation, Formal Analysis, Methodology, Software, Supervision, Writing – original draft. ZL: Project administration, Supervision, Validation, Writing – original draft. TX: Investigation, Project administration, Validation, Writing – review & editing.
Funding
The author(s) declare that financial support was received for the research and/or publication of this article. The project was supported by the Jiangsu Province Key Research and Development Project (BE2022822).
Acknowledgments
We would like to thank all the staff and patients involved in the construction of the MIMIC-IV database.
Conflict of interest
The authors declare that the research was conducted in the absence of any commercial or financial relationships that could be construed as a potential conflict of interest.
Generative AI statement
The author(s) declare that no Generative AI was used in the creation of this manuscript.
Publisher’s note
All claims expressed in this article are solely those of the authors and do not necessarily represent those of their affiliated organizations, or those of the publisher, the editors and the reviewers. Any product that may be evaluated in this article, or claim that may be made by its manufacturer, is not guaranteed or endorsed by the publisher.
Supplementary material
The Supplementary Material for this article can be found online at: https://www.frontiersin.org/articles/10.3389/fendo.2025.1561228/full#supplementary-material
Supplementary Figure 1 | Visualization of Schoenfeld residuals.
Supplementary Figure 2 | Cumulative incidence curves by cumulative incidence function. (a) AKI. (b) RRT.
Supplementary Figure 3 | Kaplan–Meier survival analysis curve. (a) ICU. (b) In hospital. (c) 28 days. (d) 1-year mortality.
Supplementary Figure 4 | E-value analysis. (a) AKI. (b) RRT.
References
1. van der Poll T, Shankar-Hari M, and Wiersinga WJ. The immunology of sepsis. Immunity. (2021) 54:2450–64. doi: 10.1016/j.immuni.2021.10.012
2. Rudd KE, Johnson SC, Agesa KM, Shackelford KA, Tsoi D, Kievlan DR, et al. Global, regional, and national sepsis incidence and mortality, 1990-2017: analysis for the Global Burden of Disease Study. Lancet. (2020) 395:200–11. doi: 10.1016/s0140-6736(19)32989-7
3. Liu V, Escobar GJ, Greene JD, Soule J, Whippy A, Angus DC, et al. Hospital deaths in patients with sepsis from 2 independent cohorts. Jama. (2014) 312:90–2. doi: 10.1001/jama.2014.5804
4. Rhee C, Dantes R, Epstein L, Murphy DJ, Seymour CW, Iwashyna TJ, et al. Incidence and trends of sepsis in US hospitals using clinical vs claims data, 2009-2014. Jama. (2017) 318:1241–9. doi: 10.1001/jama.2017.13836
5. Zarbock A, Nadim MK, Pickkers P, Gomez H, Bell S, Joannidis M, et al. Sepsis-associated acute kidney injury: consensus report of the 28th Acute Disease Quality Initiative workgroup. Nat Rev Nephrol. (2023) 19:401–17. doi: 10.1038/s41581-023-00683-3
6. Bellomo R, Kellum JA, Ronco C, Wald R, Martensson J, Maiden M, et al. Acute kidney injury in sepsis. Intensive Care Med. (2017) 43:816–28. doi: 10.1007/s00134-017-4755-7
7. Wen X, Li S, Frank A, Chen X, Emlet D, Hukriede NA, et al. Time-dependent effects of histone deacetylase inhibition in sepsis-associated acute kidney injury. Intensive Care Med Exp. (2020) 8:9. doi: 10.1186/s40635-020-0297-3
8. Qu W, Han C, Li M, Zhang J, and Jiang Z. Anti-TNF-α antibody alleviates insulin resistance in rats with sepsis-induced stress hyperglycemia. J Endocrinol Invest. (2018) 41:455–63. doi: 10.1007/s40618-017-0742-7
9. Carlsson AC, Calamia M, Risérus U, Larsson A, Helmersson-Karlqvist J, Lind L, et al. Kidney injury molecule (KIM)-1 is associated with insulin resistance: results from two community-based studies of elderly individuals. Diabetes Res Clin Pract. (2014) 103:516–21. doi: 10.1016/j.diabres.2013.12.008
10. Sarafidis PA and Ruilope LM. Insulin resistance, hyperinsulinemia, and renal injury: mechanisms and implications. Am J Nephrol. (2006) 26:232–44. doi: 10.1159/000093632
11. Ramdas Nayak VK, Satheesh P, Shenoy MT, and Kalra S. Triglyceride Glucose (TyG) Index: A surrogate biomarker of insulin resistance. J Pak Med Assoc. (2022) 72:986–8. doi: 10.47391/jpma.22-63
12. Hu Y, Zhao Y, Zhang J, and Li C. The association between triglyceride glucose-body mass index and all-cause mortality in critically ill patients with atrial fibrillation: a retrospective study from MIMIC-IV database. Cardiovasc Diabetol. (2024) 23:64. doi: 10.1186/s12933-024-02153-x
13. Peng N, Kuang M, Peng Y, Yu H, Zhang S, Xie G, et al. Associations between TyG-BMI and normal-high blood pressure values and hypertension: cross-sectional evidence from a non-diabetic population. Front Cardiovasc Med. (2023) 10:1129112. doi: 10.3389/fcvm.2023.1129112
14. Li X, Wang L, Zhou H, and Xu H. Association between triglyceride-glucose index and chronic kidney disease: results from NHANES 1999-2020. Int Urol Nephrol. (2024) 56:3605-16. doi: 10.1007/s11255-024-04103-8
15. Hu J, Cai X, Li N, Zhu Q, Wen W, Hong J, et al. Association between triglyceride glucose index-waist circumference and risk of first myocardial infarction in chinese hypertensive patients with obstructive sleep apnoea: an observational cohort study. Nat Sci Sleep. (2022) 14:969–80. doi: 10.2147/nss.S362101
16. Singer M, Deutschman CS, Seymour CW, Shankar-Hari M, Annane D, Bauer M, et al. The third international consensus definitions for sepsis and septic shock (Sepsis-3). Jama. (2016) 315:801–10. doi: 10.1001/jama.2016.0287
17. Khwaja A. KDIGO clinical practice guidelines for acute kidney injury. Nephron Clin Pract. (2012) 120:c179–84. doi: 10.1159/000339789
18. Huo RR, Liao Q, Zhai L, You XM, and Zuo YL. Interacting and joint effects of triglyceride-glucose index (TyG) and body mass index on stroke risk and the mediating role of TyG in middle-aged and older Chinese adults: a nationwide prospective cohort study. Cardiovasc Diabetol. (2024) 23:30. doi: 10.1186/s12933-024-02122-4
19. Pencina MJ, D’Agostino RB, D’Agostino RB Jr., and Vasan RS. Evaluating the added predictive ability of a new marker: from area under the ROC curve to reclassification and beyond. Stat Med. (2008) 27:157–72. doi: 10.1002/sim.2929
20. Peerapornratana S, Manrique-Caballero CL, Gómez H, and Kellum JA. Acute kidney injury from sepsis: current concepts, epidemiology, pathophysiology, prevention and treatment. Kidney Int. (2019) 96:1083–99. doi: 10.1016/j.kint.2019.05.026
21. Kuwabara S, Goggins E, and Okusa MD. The pathophysiology of sepsis-associated AKI. Clin J Am Soc Nephrol. (2022) 17:1050–69. doi: 10.2215/cjn.00850122
22. Amunugama K, Pike DP, and Ford DA. The lipid biology of sepsis. J Lipid Res. (2021) 62:100090. doi: 10.1016/j.jlr.2021.100090
23. Spitzer JJ, Bagby GJ, Mészáros K, and Lang CH. Alterations in lipid and carbohydrate metabolism in sepsis. JPEN J Parenter Enteral Nutr. (1988) 12:53s–8s. doi: 10.1177/014860718801200604
24. Marik PE and Bellomo R. Stress hyperglycemia: an essential survival response! Crit Care Med. (2013) 41:e93–4. doi: 10.1097/CCM.0b013e318283d124
25. Orban JC, Maizière EM, Ghaddab A, Van Obberghen E, and Ichai C. Incidence and characteristics of acute kidney injury in severe diabetic ketoacidosis. PloS One. (2014) 9:e110925. doi: 10.1371/journal.pone.0110925
26. Formeck CL, Siripong N, Joyce EL, Ayus JC, Kellum JA, and Moritz ML. Association of early hyponatremia and the development of acute kidney injury in critically ill children. Pediatr Nephrol. (2022) 37:2755–63. doi: 10.1007/s00467-022-05478-5
27. Wolf MB. Hyperglycemia-induced hyponatremia: Reevaluation of the Na(+) correction factor. J Crit Care. (2017) 42:54–8. doi: 10.1016/j.jcrc.2017.06.025
28. Yan H, Li T, Wang Y, Li H, Xu J, and Lu X. Insulin-like growth factor binding protein 7 accelerates hepatic steatosis and insulin resistance in non-alcoholic fatty liver disease. Clin Exp Pharmacol Physiol. (2019) 46:1101–10. doi: 10.1111/1440-1681.13159
29. Yu JT, Hu XW, Yang Q, Shan RR, Zhang Y, Dong ZH, et al. Insulin-like growth factor binding protein 7 promotes acute kidney injury by alleviating poly ADP ribose polymerase 1 degradation. Kidney Int. (2022) 102:828–44. doi: 10.1016/j.kint.2022.05.026
30. Hu BC, Zhu JW, Wu GH, Cai JJ, Yang X, Shao ZQ, et al. Auto- and paracrine rewiring of NIX-mediated mitophagy by insulin-like growth factor-binding protein 7 in septic AKI escalates inflammation-coupling tubular damage. Life Sci. (2023) 322:121653. doi: 10.1016/j.lfs.2023.121653
31. Mutailifu S, Zhu Q, Cai X, Heizhati M, Liu S, Dang Y, et al. Association between admission hyperglycaemia with in-hospital mortality rate in patients with hypertension and acute aortic dissection. J Int Med Res. (2024) 52:3000605241291742. doi: 10.1177/03000605241291742
32. Shen D, Cai X, Zhu Q, Heizhati M, Hu J, Song S, et al. Increased stress hyperglycemia ratio at hospital admission in stroke patients are associated with increased in-hospital mortality and length of stay. Diabetol Metab Syndr. (2024) 16:69. doi: 10.1186/s13098-024-01303-1
33. De Cosmo S, Menzaghi C, Prudente S, and Trischitta V. Role of insulin resistance in kidney dysfunction: insights into the mechanism and epidemiological evidence. Nephrol Dial Transplant. (2013) 28:29–36. doi: 10.1093/ndt/gfs290
34. Zuo Z, Zhou Z, Liu Q, Shi R, and Wu T. Joint association of the triglyceride-glucose index and stress hyperglycemia ratio with incidence and mortality risks of new-onset atrial fibrillation during sepsis: a retrospective cohort study. Cardiovasc Diabetol. (2025) 24:149. doi: 10.1186/s12933-025-02709-5
35. Fang Y, Dou A, Shen Y, Li T, Liu H, Cui Y, et al. Association of triglyceride-glucose index and delirium in patients with sepsis: a retrospective study. Lipids Health Dis. (2024) 23:227. doi: 10.1186/s12944-024-02213-x
36. Wald R, Beaubien-Souligny W, Chanchlani R, Clark EG, Neyra JA, Ostermann M, et al. Delivering optimal renal replacement therapy to critically ill patients with acute kidney injury. Intensive Care Med. (2022) 48:1368–81. doi: 10.1007/s00134-022-06851-6
37. Leaf DE, Rajapurkar M, Lele SS, Mukhopadhyay B, and Waikar SS. Plasma catalytic iron, AKI, and death among critically ill patients. Clin J Am Soc Nephrol. (2014) 9:1849–56. doi: 10.2215/cjn.02840314
38. Schefold JC, Filippatos G, Hasenfuss G, Anker SD, and von Haehling S. Heart failure and kidney dysfunction: epidemiology, mechanisms and management. Nat Rev Nephrol. (2016) 12:610–23. doi: 10.1038/nrneph.2016.113
39. Chiou YY, Jiang ST, Ding YS, and Cheng YH. Kidney-based in vivo model for drug-induced nephrotoxicity testing. Sci Rep. (2020) 10:13640. doi: 10.1038/s41598-020-70502-3
40. Pellathy TP, Pinsky MR, and Hravnak M. Intensive care unit scoring systems. Crit Care Nurse. (2021) 41:54–64. doi: 10.4037/ccn2021613
41. Yu X, Xin Q, Hao Y, Zhang J, and Ma T. An early warning model for predicting major adverse kidney events within 30 days in sepsis patients. Front Med (Lausanne). (2023) 10:1327036. doi: 10.3389/fmed.2023.1327036
Keywords: acute kidney injury, sepsis, triglyceride glucose-body mass index, predictor, insulin resistance
Citation: Wang S, Li R, Zhang L, Xie T and Wang X (2025) Association between triglyceride glucose–body mass index and acute kidney injury and renal replacement therapy in critically ill patients with sepsis: analysis of the MIMIC-IV database. Front. Endocrinol. 16:1561228. doi: 10.3389/fendo.2025.1561228
Received: 15 January 2025; Accepted: 26 June 2025;
Published: 21 July 2025.
Edited by:
Aivaras Ratkevicius, Queen Mary University of London, United KingdomReviewed by:
Xintian Cai, Sichuan Academy of Medical Sciences and Sichuan Provincial People’s Hospital, ChinaYaxin Zhang, Fujian Medical University, China
Copyright © 2025 Wang, Li, Zhang, Xie and Wang. This is an open-access article distributed under the terms of the Creative Commons Attribution License (CC BY). The use, distribution or reproduction in other forums is permitted, provided the original author(s) and the copyright owner(s) are credited and that the original publication in this journal is cited, in accordance with accepted academic practice. No use, distribution or reproduction is permitted which does not comply with these terms.
*Correspondence: Xinying Wang, d2FuZ3hpbnlpbmdAbmp1LmVkdS5jbg==