 Jui-Hsiang Sung
 Fu-Shun Ko
 Tsung-Hui Wu1,2
 Chii-Min Hwu
 Guan-Yu Su
- 1Section of Endocrinology and Metabolism, Department of Medicine, Taipei Veterans General Hospital, Taipei, Taiwan
- 2Faculty of Medicine, National Yang Ming Chiao Tung University School of Medicine, Taipei, Taiwan
- 3Institute of Sports Sciences, University of Taipei, Taipei, Taiwan
Background: The ratio of fat-free mass (FFM) to fat mass (FM) is a key indicator of body composition. Evidence suggests that the FFM/FM ratio is more reliable than body mass index in predicting functional outcomes in older adults with prefrailty. Individuals with type 2 diabetes mellitus (T2DM) exhibit higher FM and faster lean mass loss than do those without T2DM. In this study, we determined whether the FFM/FM ratio can predict functional outcomes in patients with T2DM.
Methods: This study enrolled 166 men and 173 women aged ≥50 years who received a T2DM diagnosis at least 1 year before the initiation of this study. Participants were recruited from Taipei Veterans General Hospital, Taiwan, between April 2019 and December 2023. Based on the FFM/FM ratio, patients were stratified into three groups: high, middle, and low tertiles. Body composition was assessed using InBody 3.0. Physical performance was evaluated through the Short Physical Performance Battery and gait speed measurement. The FFM/FM ratio was calculated using established formulas. Stepwise multiple regression was performed to identify the predictors of the FFM/FM ratio in patients stratified by sex.
Results: In both sexes, individuals in the high-tertile group exhibited superior physical performance than did the other groups, as indicated by higher Short Physical Performance Battery scores (P < 0.001 for both sexes), better performance in the 30-second chair stand test (P < 0.001), faster gait speed in the 6-m walk (P <0.001), and shorter completion time in the timed up and go test (P <0.001). In men, waist circumference, upper arm circumference, age, logarithmic transformation of alanine transaminase level, and uric acid level emerged as independent predictors of the FFM/FM ratio. In women, waist circumference, upper arm circumference, age, and uric acid level emerged as independent predictors; notably, logarithmic transformation of alanine transaminase level was not included in the regression model.
Conclusion: The present study revealed that a decreased FFM/FM ratio is associated with suboptimal physical performance in patients with T2DM, and this ratio may provide meaningful clinical benefits in targeting body composition in this population.
1 Introduction
Fat mass (FM) and fat-free mass (FFM) are commonly used parameters for characterizing body composition. The load–capacity model incorporates both FM and FFM to enhance the prediction of disease risk (1). The relative contributions of FM and FFM to physiological function determine the risks of cardiometabolic diseases, functional disabilities, and sarcopenia (1–4). The ratio of FFM to FM (FFM/FM) has emerged as a meaningful indicator of clinical outcomes across diverse populations. A lower FFM/FM ratio has been associated with increased risks of non-alcoholic fatty liver disease, poor asthma control, and reduced physical performance (5–7). It has also shown predictive value for cardiometabolic risks, with lower ratios more strongly associated with adverse health outcomes (8). Among patients with pancreatic cancer, a reduced FFM/FM ratio has been correlated with worse overall survival (9). Furthermore, the FFM/FM ratio is a key marker for identifying sarcopenic obesity—a condition characterized by metabolic dysfunction and impaired physical function (10). Compared to body mass index (BMI), the FFM/FM ratio provides a more accurate assessment of body composition and has been shown to be a superior predictor of physical performance in prefrail older adults (11).
Type 2 diabetes mellitus (T2DM) is a chronic metabolic disorder characterized by insulin resistance and relative insulin deficiency, leading to hyperglycemia. In addition to its metabolic effects and chronic inflammation, T2DM adversely affects various aspects of physical health, including muscle mass and function. In particular, T2DM alters body composition parameters, such as FM and FFM, thereby compromising physical performance. Adults with T2DM typically gain more FM and lose lean mass more rapidly than do those without T2DM (12).
Although previous studies have analyzed the FFM/FM ratio in older populations that include individuals with T2DM, its role as a reliable predictor of physical performance specifically in patients with T2DM remains uncertain (11). This study aimed to determine whether the FFM/FM ratio can serve as a predictor of functional outcomes in this population. We hypothesized that a lower FFM/FM ratio would be associated with better physical performance in individuals with T2DM. Furthermore, we identified key factors associated with the FFM/FM ratio among these patients.
2 Methods
2.1 Study design and participants
We enrolled ambulatory patients aged ≥50 years who received a T2DM diagnosis at least 1 year before the commencement of the present study. They were recruited from Taipei Veterans General Hospital, Taiwan, between April 2019 and December 2023. Individuals with an estimated glomerular filtration (eGFR) rate of <15 mL/min/1.73 m2 (calculated using the Modification of Diet in Renal Disease Study equation) and those with a history of severe congestive heart failure (New York Heart Association Functional Class III or IV), severe stroke (National Institutes of Health Stroke Scale score > 15), peripheral arterial occlusive disease, or severe muscular disorders were excluded from this study. Patients were ineligible if they had been diagnosed as having foot ulcers or nondiabetic neuropathy 6 months before the present study.
A total of 339 participants (166 men and 173 women) were enrolled in the study, exceeding the calculated minimum sample size of 159 participants required for adequate statistical power. Power calculations were conducted using G*Power 3.1, assuming a medium effect size (f = 0.25), a significance level of α = 0.05, and a power of 0.80. Participants were initially stratified by sex because of known differences in body composition between men and women. Within each sex group, they were further divided into three subgroups based on their FFM/FM ratio: high-tertile, mid-tertile, and low-tertile.
The study protocol was approved by the Ethics Committee of Taipei Veterans General Hospital. Written informed consent was obtained from each patient before their enrollment in this study.
2.2 Clinical examination and measurements
Eligible patients underwent anthropometric and blood pressure assessments at 8 am after a 12-h overnight fast. Seated blood pressure was recorded using an automated blood pressure monitor (HEM-7310; Omron Healthcare, Kyoto, Japan). Waist circumference (WC) was measured at the level of the umbilicus to the nearest millimeter. Upper arm circumference (UAC) was measured at the midpoint between the acromion and olecranon processes by using a tape placed on the shoulder blade and ulna, respectively. Calf circumference (CC)was measured at maximal circumference in a seated position, with feet on the floor and the leg positioned at 90°, by using a nonelastic tape.
Blood samples were collected for biochemical analyses. Serum biochemistry was analyzed using commercial assay kits (Roche Diagnostics, Basel, Switzerland) with an automatic blood chemistry analyzer (Roche-Hitachi 7180; Roche Diagnostics). Glycated hemoglobin was detected through capillary electrophoresis.
A bioelectrical impedance analyzer (InBody 3.0; Biospace, Tokyo, Japan) was used to measure various body composition parameters, such as FM, fat percentage, muscle mass, and muscle percentage. FFM was calculated by subtracting body fat weight (body weight × fat percentage) from body weight. The FFM/FM ratio was calculated using a modified version of the Reshma Aziz Merchant formula (7).
2.3 Physical performance assessment
Physical performance was evaluated through the Short Physical Performance Battery (SPPB), five times sit-to-stand test, 30-second chair stand test, timed up and go test, and gait speed measurement. The SPPB comprises 3 balance components: the Romberg test, Sharpened Romberg test, and one-leg standing test. Each balance test was conducted twice, once with eyes open and once with eyes closed. The duration (in seconds) for which each participant maintained balance during each test was recorded. The total duration was calculated after the completion of the SPPB. Gait speed was measured by calculating the time taken by each participant to walk a 6-m distance. The average gait speed was calculated from 2 trials.
Handgrip strength of the dominant hand was measured using a Jamar hand dynamometer (Model 5030J1; Patterson Medical, Warrenville, IL, USA). Hand dominance was determined by asking participants which hand they preferred for hammering. The dynamometer was adjusted to either the second or third handle position on the basis of each participant’s comfort level. During the test, each participant stood with the arms relaxed at the sides and elbows fully extended and then exerted the maximum force by squeezing the dynamometer. The highest value from 3 trials was recorded for analysis.
Lower-limb muscle strength of the dominant leg—the leg preferred for kicking a ball—was evaluated using a hand-held dynamometer (microFET2; Hoggan Scientific, Salt Lake City, UT, USA). During a knee extensor strength test, each participant sat with the knees and hips flexed at a 90° angle (short sitting position). Ankle dorsiflexor and plantar flexor strength were measured with the participant in the supine position. A trained examiner instructed the participant to actively apply force against the device while the examiner provided resistance. Three trials were performed for each muscle group, and the highest value was recorded. Muscle strength is expressed in Newtons, calculated as kilograms multiplied by the acceleration due to gravity (9.8 m/s2).
2.4 Statistical analysis
Continuous variables are presented as mean ± SD or median (interquartile range) values, whereas categorical variables are presented as number (percentage) values. Because of substantial skewness in triglyceride and alanine transaminase (ALT) levels, logarithmic transformation was performed to reduce the skewness before analysis. One-way analysis of variance with the Scheffe post hoc test was performed for intergroup comparisons of clinical characteristics, body composition, physical performance, and muscle strength. A general linear model was used to identify the association between the FFM/FM ratio and physical performance; this model was adjusted for handgrip strength or ankle plantor flexor strength.
The associations of various clinical characteristics with the FFM/FM ratio were analyzed by calculating Pearson correlation coefficients. A positive correlation was defined as r > 0, while a negative correlation was defined as r < 0. An r value close to 0 indicates little to no meaningful relationship between the variables. The strength of the correlation was interpreted as follows: 0.00–0.10 (negligible), 0.10–0.39 (weak), 0.40–0.69 (moderate), 0.70–0.89 (strong), and 0.90–1.00 (very strong).
Stepwise multiple regression was performed to identify independent predictors associated with the FFM/FM ratio. In this analysis, the dependent variable was the FFM/FM ratio, whereas the independent variables were age, WC, UAC, CC, systolic blood pressure, diastolic blood pressure, logarithmic transformation of ALT level (logALT) level, eGFR, high-density lipoprotein cholesterol level, logarithmic transformation of triglyceride (logTG) level, uric acid (UA) level, glycated hemoglobin level, and fasting plasma glucose level. A P value of <0.05 was indicated statistical significance. All statistical analyses were performed using SPSS (version 25; IBM Corporation, Armonk, NY, USA).
3 Results
The study cohort comprised 166 men and 173 women. The mean age of participants was 69.3 ± 8.7 years, and men constituted 49.0% of the cohort. Table 1 presents the baseline demographic characteristics of the study population. Table 2 lists the clinical characteristics of participants stratified into high-, mid-, and low-tertile groups based on their FFM/FM ratios.
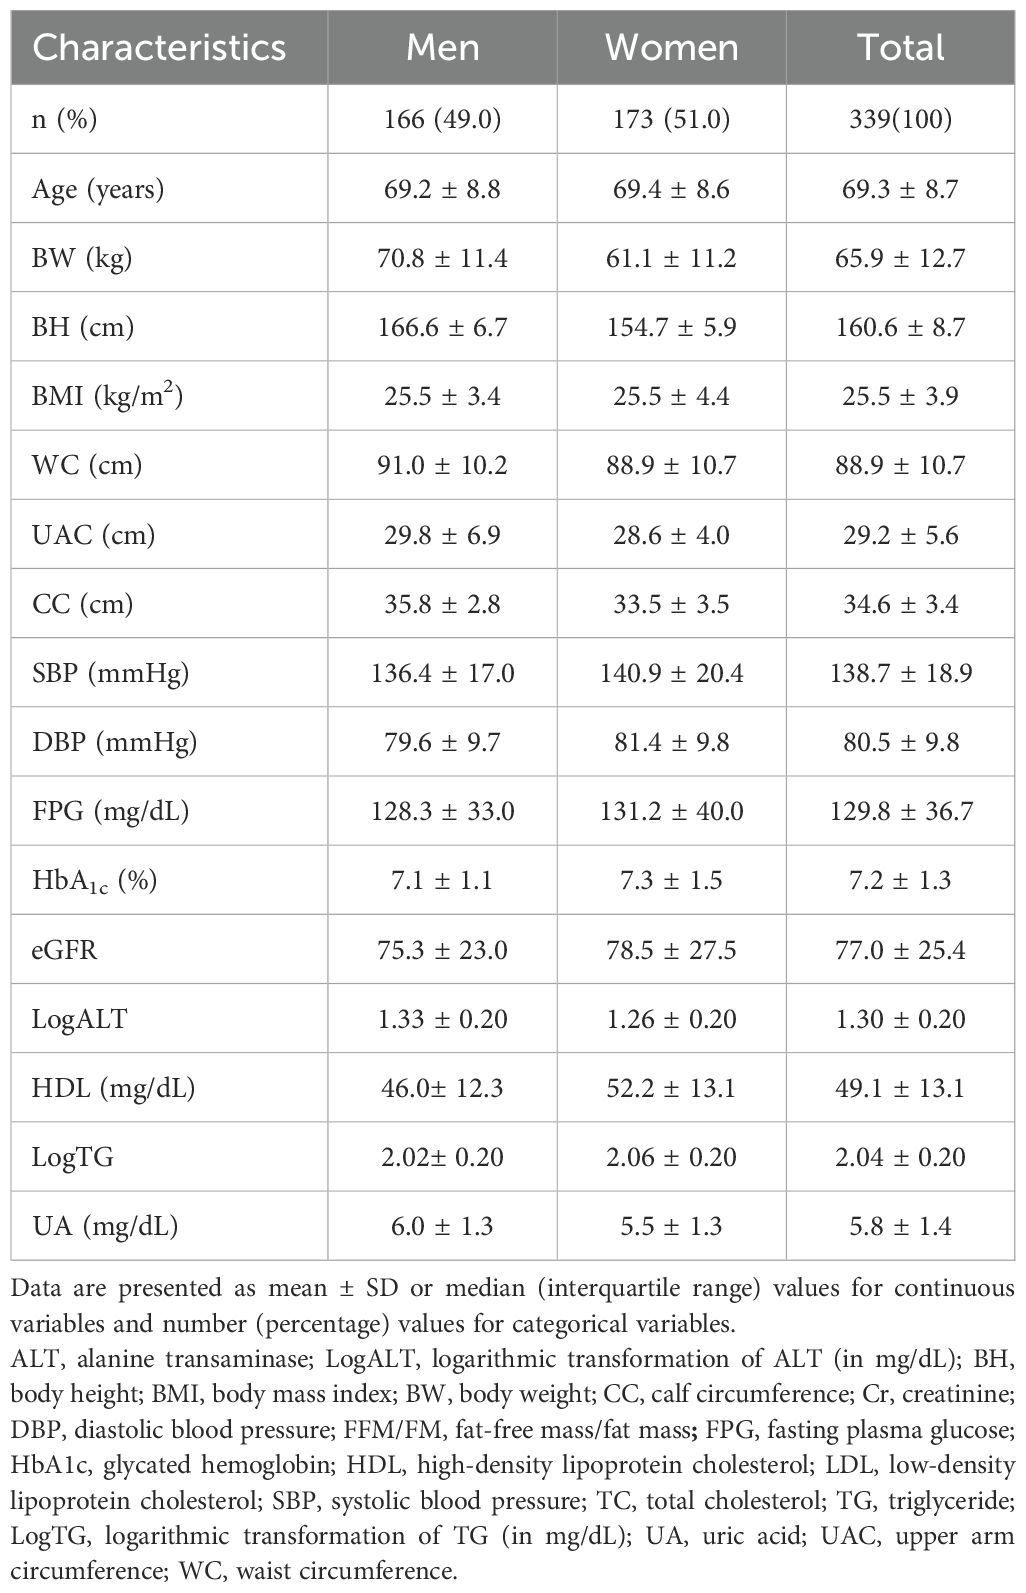
Table 1. Baseline demography of the studied population.
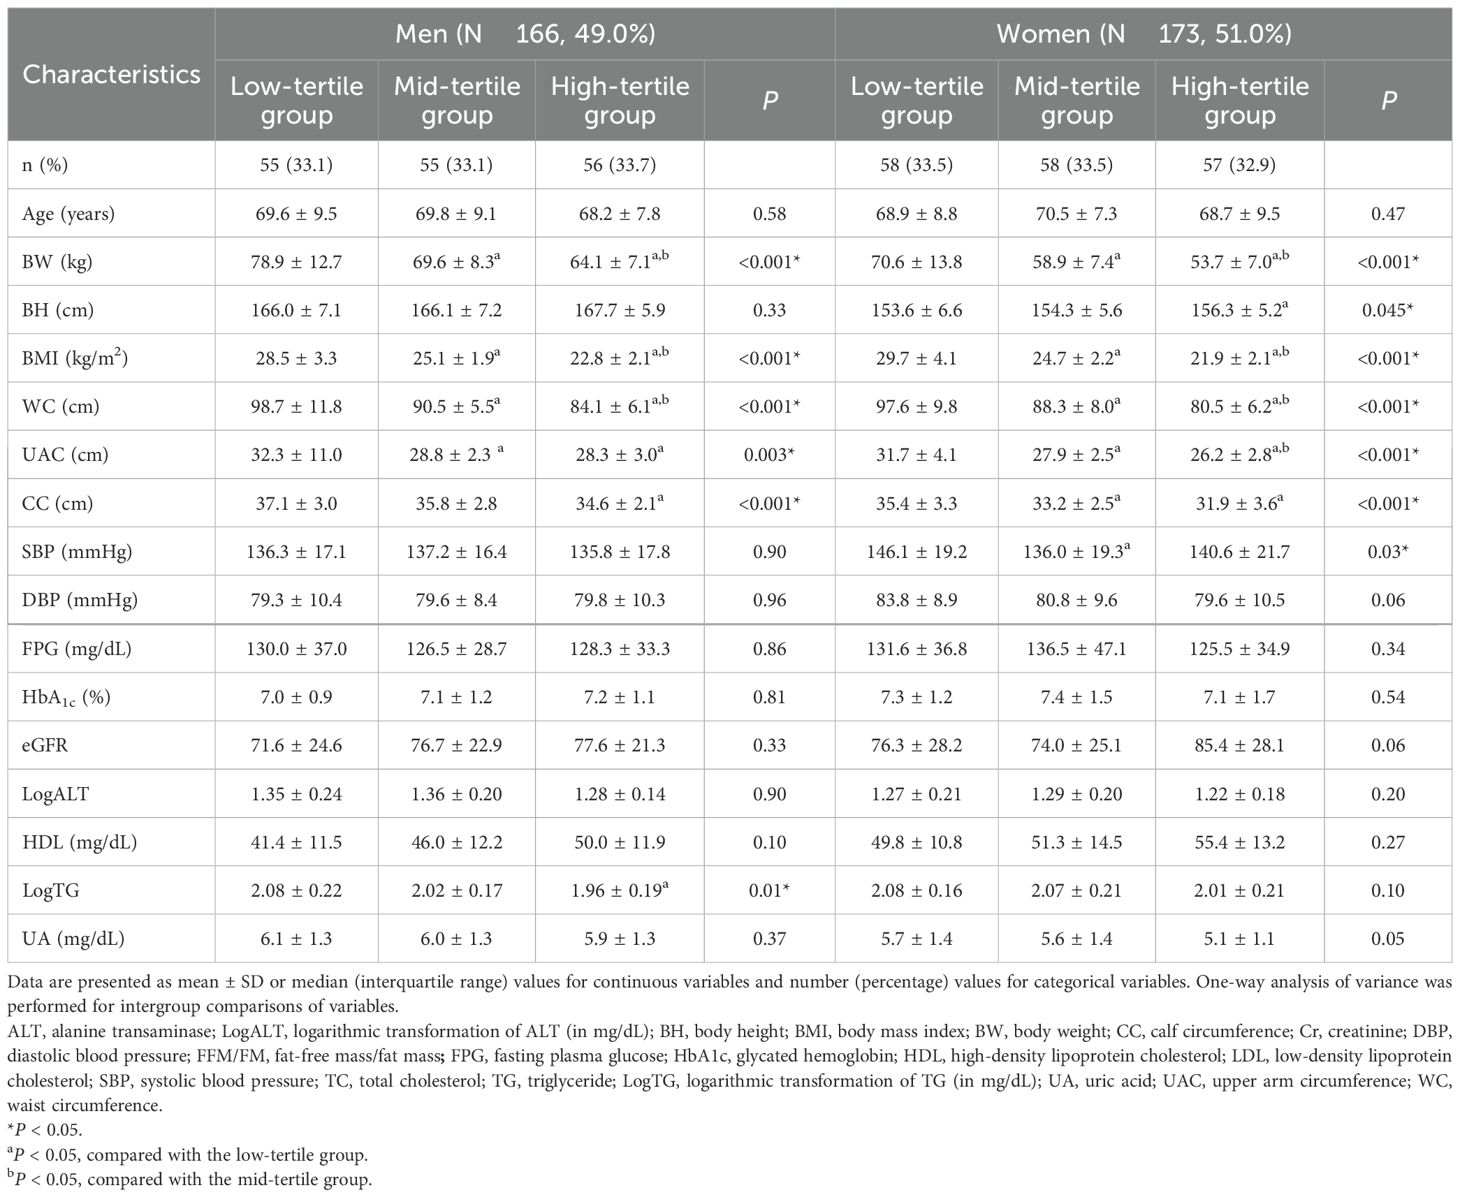
Table 2. Clinical characteristics of the study cohort.
Among men, the low-tertile group had significantly larger WC, UAC, and CC than did the mid-tertile and high-tertile groups (WC: 98.7 ± 11.8 vs 90.5 ± 5.5 vs 84.1 ± 6.1 cm [P < 0.001]; UAC: 32.3 ± 11.0 vs 28.8 ± 2.3 vs 28.3 ± 3.0 cm [P = 0.003]; CC: 37.1 ± 3.0 vs 35.8 ± 2.8 vs 34.6 ± 2.1 cm [P < 0.001]). Furthermore, the level of LogTG was significantly higher in the low-tertile group than in the mid-tertile and high-tertile groups (2.08 ± 0.22, 2.02 ± 0.17, and 1.96 ± 0.19, respectively, P = 0.01). Similarly, among women, the low-tertile group had significantly larger WC, UAC, and CC than did the mid-tertile and high-tertile groups (WC: 97.6 ± 9.8 vs 88.3 ± 8.0 vs 80.5 ± 6.2 cm [P < 0.001]; UAC: 31.7 ± 4.1 vs 27.9 ± 2.5 vs 26.2 ± 2.8 cm [P < 0.001]; CC: 35.4 ± 3.3 vs 33.2 ± 2.5 vs 31.9 ± 3.6 cm [P < 0.001]). However, no significant intergroup difference was observed in LogTG level (P = 0.10).
Figure 1 presents the body composition of the 3 groups. In both men and women, the FFM/FM ratio was negatively correlated with FM, indicating that a higher FFM/FM ratio was associated with a lower FM (men: P < 0.001; women: P < 0.001; Figure 1A). Similarly, the FFM/FM ratio was negatively associated with FM percentage (men: P < 0.001; women: P < 0.001; Figure 1B). However, the FFM/FM ratio was positively associated muscle mass percentage (men: P < 0.001; women: P < 0.001; Figure 1D) and FFM percentage (men: P < 0.001; women: P < 0.001; Figure 1F). In men, significant intergroup differences were noted in both muscle mass (P = .02) and FFM (P = 0.04). By contrast, in women, significant intergroup differences were noted in only muscle mass (P = 0.02; Figure 1C), but not in FFM (Figure 1E).
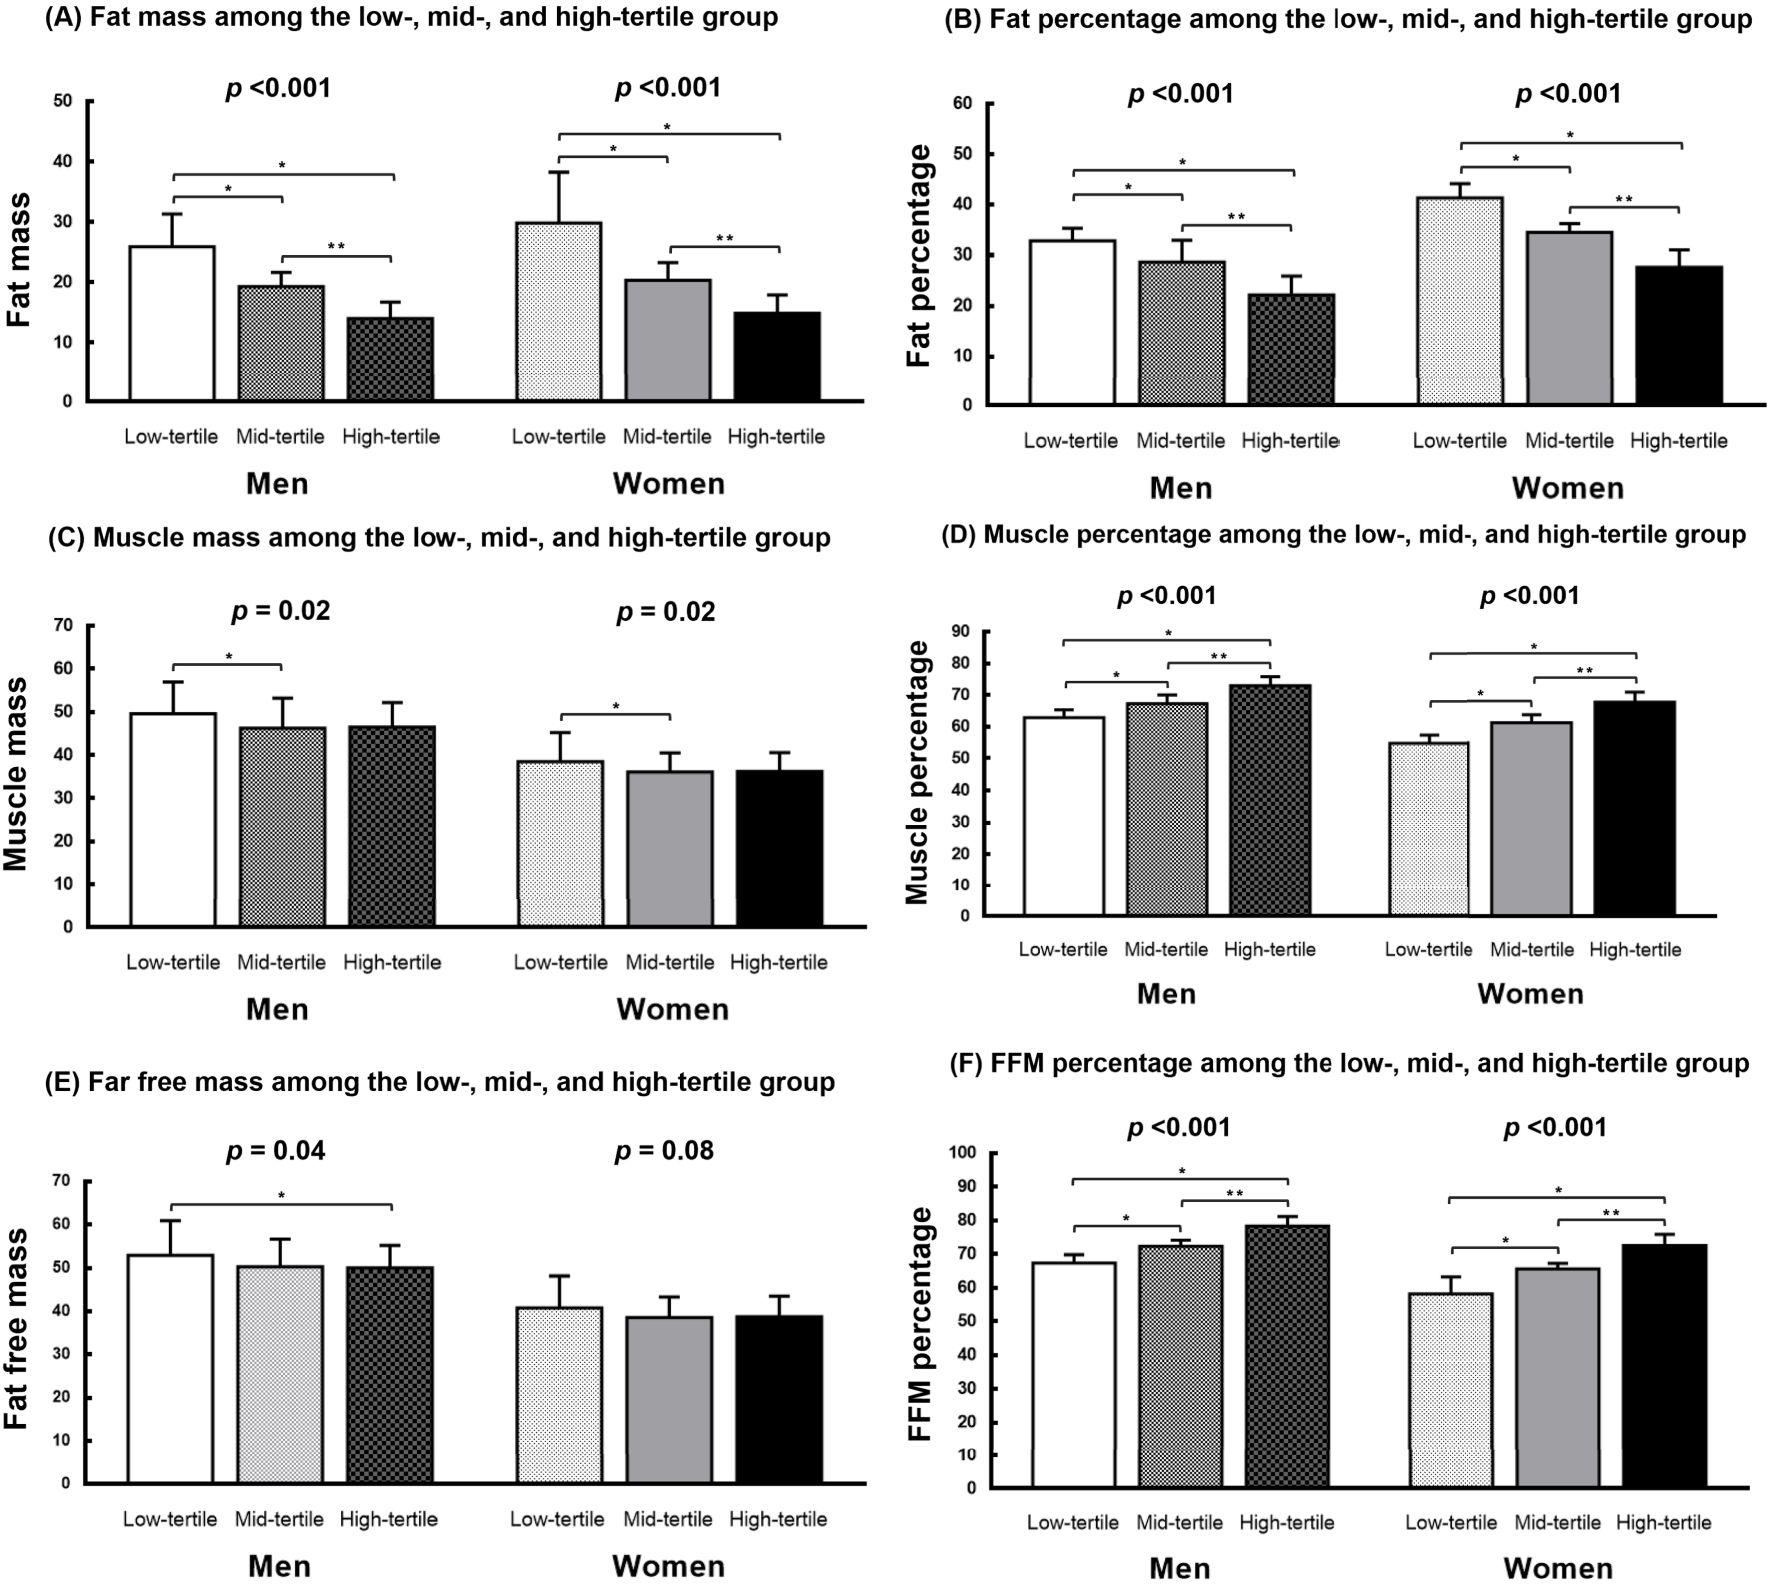
Figure 1. Body composition of the study cohort. (A, B) The FFM/FM ratio showed a negative correlation with both FM and FM percentage in men and women. (C, E) Significant differences between groups were observed in both muscle mass and FFM among men, whereas in women, significant intergroup differences were observed only in muscle mass. (D, F) The FFM/FM ratio showed a positive association with muscle mass percentage and FFM percentage in both men and women. FM, fat mass; FFM, fat-free mass; *P < 0.05, compared with the low-tertile group. **P <0.05, compared with the mid-tertile group.
In both men and women, the high-tertile group exhibited better physical performance than did the low- and mid-tertile groups (Supplementary Table 1). In women, handgrip strength and muscle strength of the ankle plantar flexor were significantly higher in the high-tertile group than in the mid-tertile and low-tertile groups (handgrip strength: 229.4 ± 66.9 vs 217.0 ± 48.3 vs 198.7 ± 46.3 [P = 0.01]; ankle plantor flexor strength: 434.8 ± 94.6 vs 394.4 ± 84.4 vs 400.1 ± 103.2 [P = 0.049]; Supplementary Table 2). By contrast, in men, no significant intergroup differences were noted in handgrip strength or ankle plantar flexor strength (P = 0.17 and P = 0.37, respectively; Supplementary Table 2).
In both men and women, the general linear model adjusted for handgrip strength or ankle plantor flexor strength identified the FFM/FM ratio as an independent predictor of physical performance (Tables 3, 4). In both sex groups, the high-tertile group exhibited superior physical performance than did the other groups. The high-tertile group achieved higher SPPB scores (P < 0.001 for both sexes), completed the 5 times sit-to-stand test in less time (P < 0.001 for both sexes), performed better in the 30-second chair stand test (P < 0.001 for both sexes), attained faster gait speeds in the 6-m walk (P <0.001 for both sexes), and completed the timed up and go test more rapidly (P < 0.001 for both sexes) than did the mid-tertile and low-tertile groups.
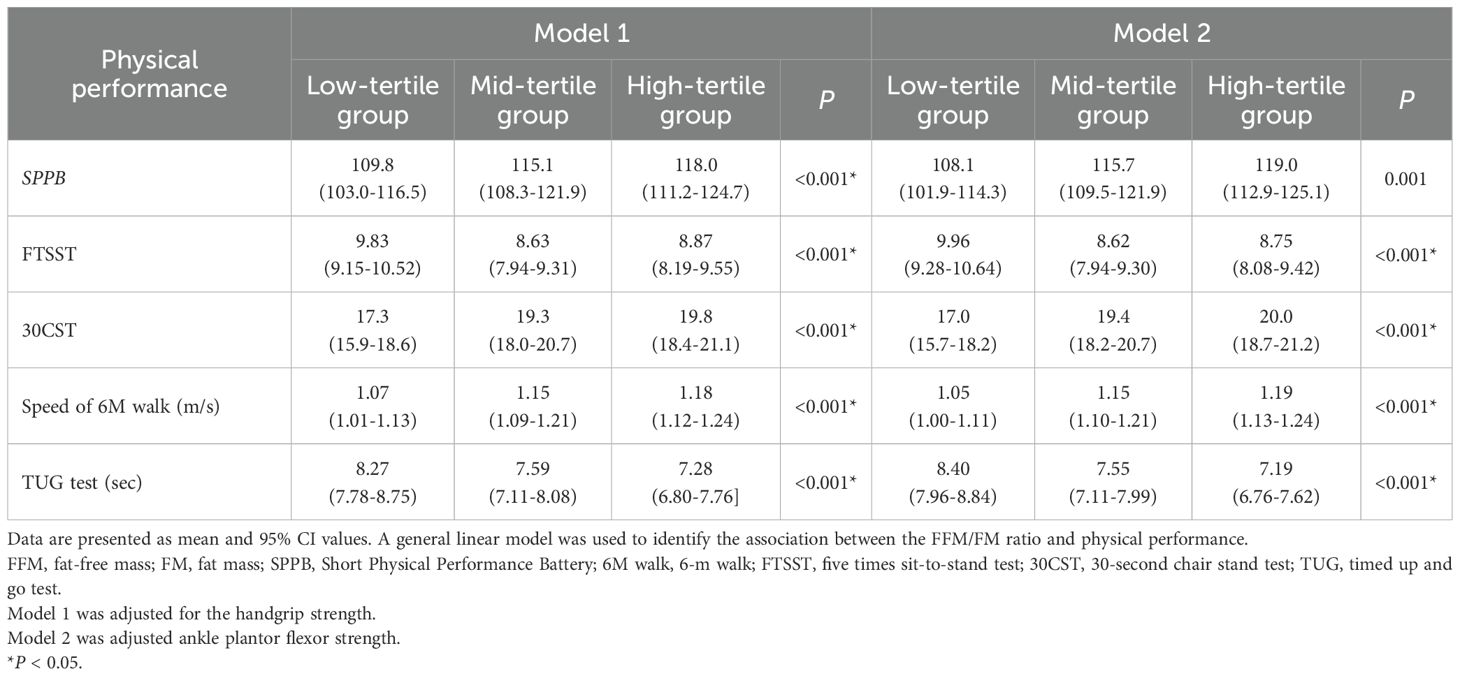
Table 3. Association of physical performance with the FFM/FM ratio in men.
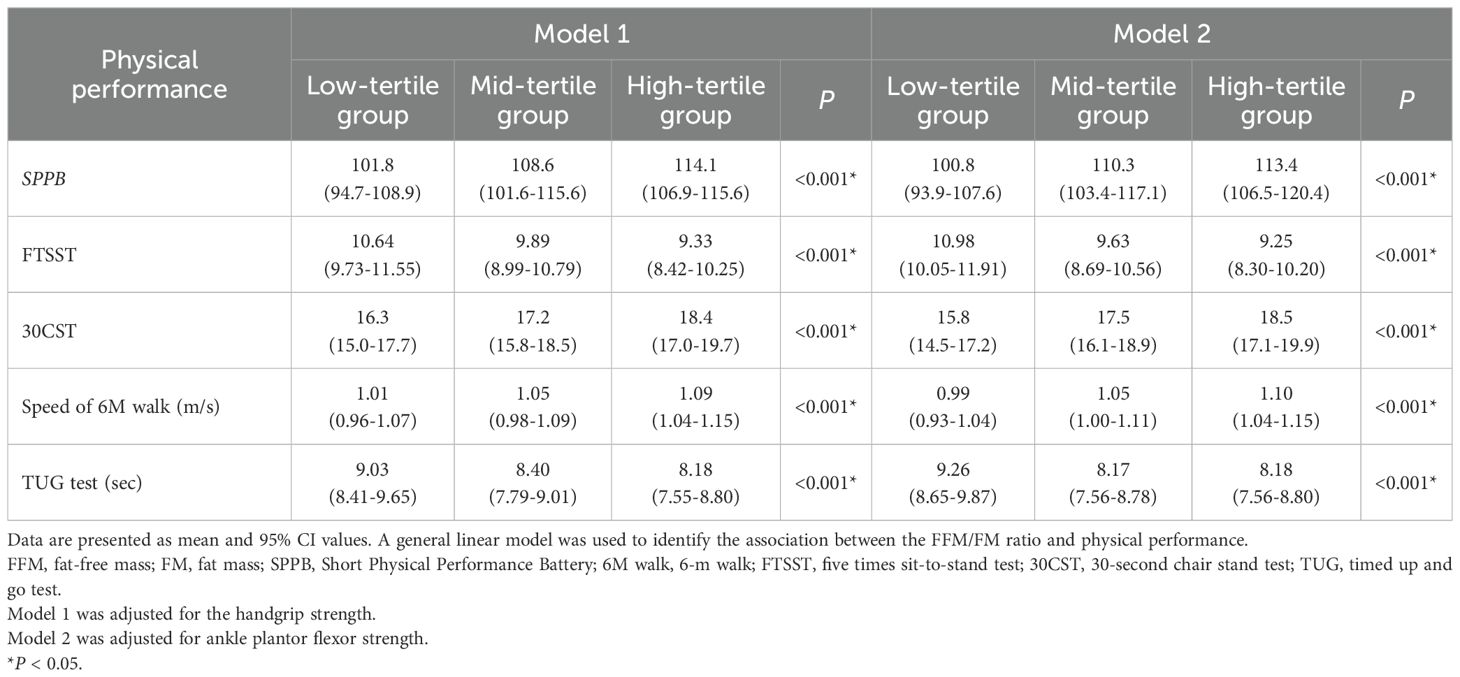
Table 4. Association of physical performance with the FFM/FM ratio in women.
The results of Pearson correlation analyses are summarized in Tables 5, 6. In men, the FFM/FM ratio was significantly associated with WC, UAC, CC, LogALT level, eGFR, HDL level, LogTG level, and UA level. Similarly, in women, the FFM/FM ratio was significantly associated with WC, UAC, CC, HDL level, LogTG level, and UA level. Table 7 presents key factors influencing the FFM/FM ratio. In men, WC emerged as the primary predictor of the FFM/FM ratio in the first step, followed by UAC (second step), age (third step), LogALT level (fourth step), and UA level (fifth step). In women, WC emerged as the primary predictor of the FFM/FM ratio in the first step, followed by UAC (second step), age (third step), and UA level (fourth step). All of these factors independently predicted the variance in the FFM/FM ratio.
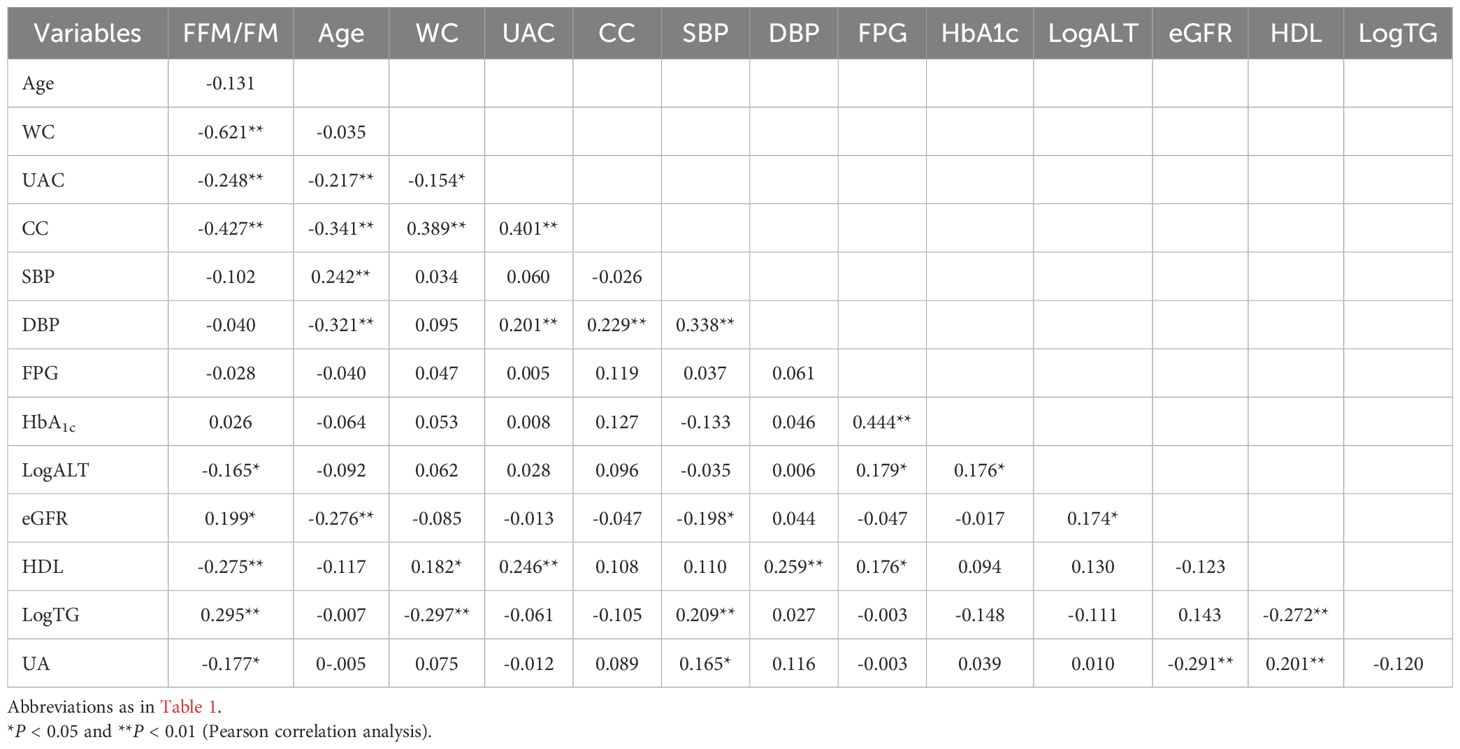
Table 5. Associations of various clinical characteristics with the FFM/FM ratio in men.
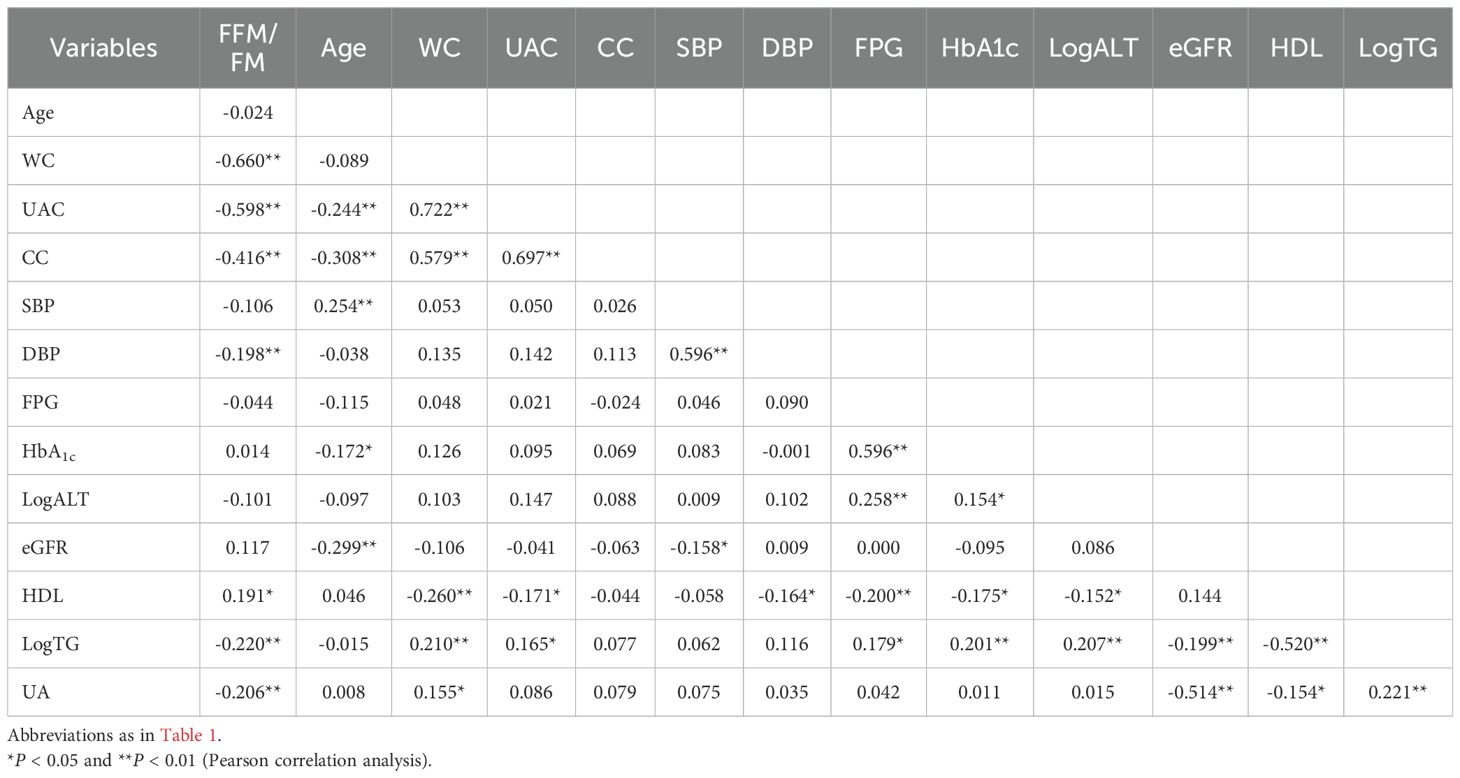
Table 6. Associations of various clinical characteristics with the FFM/FM ratio in women.
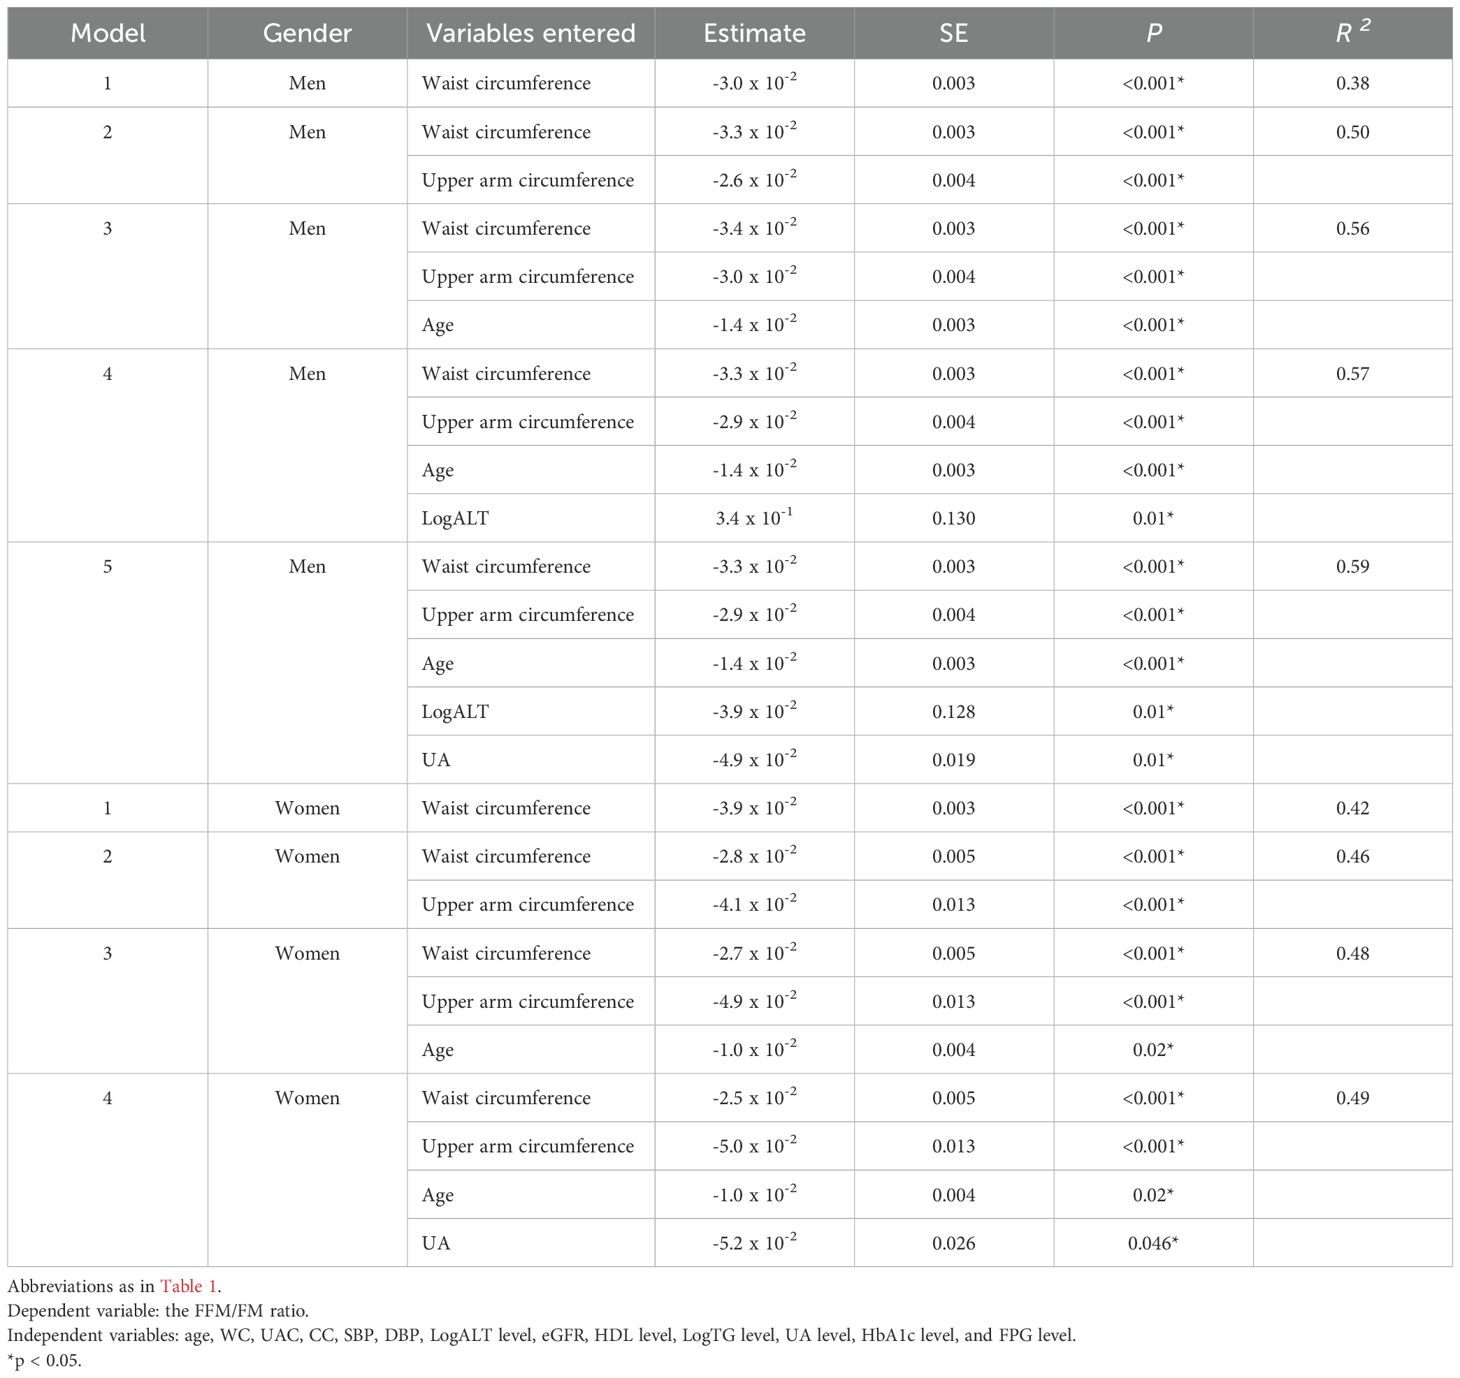
Table 7. Key factors influencing the FFM/FM ratio (N = 339).
4 Discussion
The present study revealed that body composition, particularly an elevated FFM/FM ratio, was associated with enhanced physical performance in patients with T2DM. In both men and women, a higher FFM/FM ratio was associated with lower body weight and BMI and smaller WC, UAC, and CC. In men, WC was the primary predictor of the FFM/FM ratio, followed by UAC, age, LogALT level, and UA level. Similarly, in women, WC was the primary predictor of the FFM/FM ratio, followed by UAC, age, and UA level.
T2DM substantially affects physical performance in individuals ≥50 years by reducing muscle strength, impairing balance, and increasing the fear of falling (13–19). Older adults with T2DM have reduced handgrip strength, which is correlated with slow gait speed and chair stand speed, indicating compromised functional abilities (13). Furthermore, balance-related problems are highly prevalent among patients with T2DM, increasing the risk of falls and the fear of falling in this population; the fear of falling deters these individuals from engaging in physical activity and reduces their quality of life (15, 16).
In the present study, physical performance in patients with T2DM was evaluated through five key tests. These included the SPPB (lower scores indicate reduced mobility), the five times sit-to-stand, and the 30-second chair stand tests, which measure lower limb strength and endurance (19–21). Gait speed was assessed by the 6-m walk test, as recommended by the Asian Working Group for Sarcopenia (22). The timed up and go test was used to evaluate fall risk and mobility and has been linked to mortality prediction in older adults (23). A general linear model adjusted for muscle strength showed that a lower FFM/FM ratio, in both men and women, was associated with poorer physical performance.
A lower FFM/FM ratio typically reflects a reduction in fat-free mass, an increase in fat mass, or both. FFM encompasses skeletal muscle, bone, body water, and internal organs, with skeletal muscle playing a critical role in maintaining strength, balance, endurance, and mobility. In individuals with T2DM, sarcopenia—the progressive loss of skeletal muscle mass—is frequently observed, particularly with advancing age and worsening insulin resistance. This decline in muscle mass, which indicated a decrease of muscle strength, significantly impairs mobility and increases the risk of disability (24).
Conversely, excess fat mass, particularly visceral adiposity, exerts multiple harmful effects on muscle health. Findings from the Health, Aging, and Body Composition Study demonstrated that greater adiposity is associated with reduced muscle quality and predicts an accelerated decline in lean mass (25). Visceral fat may contribute to both inter- and intramuscular fat infiltration, which can impair mitochondrial function, elevate the production of reactive oxygen species, and trigger the secretion of pro-inflammatory myokines (26). Moreover, visceral adipose tissue releases cytokines such as tumor necrosis factor-alpha (TNF-α) and interleukin-6 (IL-6), which further promote muscle catabolism by suppressing protein synthesis and enhancing proteolysis (27). Increased fat mass also exacerbates insulin resistance, compromising glucose and amino acid uptake in skeletal muscle and thereby impairing muscle repair and regeneration (28). These mechanisms may explain why the FFM/FM ratio serves as a potential indicator of functional health.
In both men and women with T2DM, WC, UAC, and age emerged as significant predictors of the FFM/FM ratio. WC is a strong predictor of visceral adiposity and is associated with insulin resistance and cardiovascular risk in patients with T2DM (29, 30). A higher WC indicates central obesity with increased FM, which is correlated with a lower FFM/FM ratio. UAC serves as a measure of skeletal muscle mass and strength, both of which are crucial indicators of physical performance and metabolic health. The Asian Working Group for Sarcopenia recommends UAC as a screening tool for sarcopenia (22, 31, 32). In our study, a smaller UAC was associated with a higher FFM/FM ratio, indicating relatively greater muscle mass and better physical performance (32). Aging is associated with changes in body composition—for example, the loss of muscle mass and an increase in FM, which reduce the FFM/FM ratio (11, 33).
To the best of our knowledge, this study is the first to investigate whether the FFM/FM ratio could predict physical performance in Asian patients with T2DM. A relevant study reported that age, sex, and BMI influenced the FM/FFM ratio in older adults (7). However, in the present study, BMI was not identified as a significant predictor of the FFM/FM ratio in patients with T2DM. This finding may be attributable to the moderate correlation of BMI with T2DM and other chronic diseases (34). In addition, although BMI is commonly used to define obesity, it does not differentiate between FM and FFM (35). A study on BMI and WC revealed that a higher BMI was associated with a better functional and cognitive status, particularly in men (36). These findings explain why BMI exerted no significant effect on the FFM/FM ratio in our study.
This study has several limitations. First, the cross-sectional design of our study precludes the evaluation of longitudinal changes in physical function relative to changes in the FFM/FM ratio. Second, as a single-center study with a relatively small sample size, the generalizability of our findings to the broader population may be limited. Third, FM and FFM were estimated using bioelectrical impedance analysis (BIA), which, though endorsed by the Asian Working Group for Sarcopenia (2019) and strongly correlated with dual-energy X-ray absorptiometry (DEXA), may still introduce potential measurement imprecision (22, 37). Fourth, detailed information on diabetes onset and duration, daily physical activity levels, nutritional assessment parameters, and pharmacological treatments for glycemic control were not quantitatively recorded. Their absence from the statistical model may have influenced the observed relationship between body composition and functional capacity, thereby limiting the overall accuracy and reliability of the study’s findings. Additionally, our regression model explained only approximately 59% and 49% of the variance in the FFM/FM ratio for men and women, respectively. Finally, our study lacks a normoglycemic control cohort. Without this comparative group, it remains unclear whether the observed association between the FFM/FM ratio and physical performance represents a diabetes-specific phenomenon or a general physiological relationship.
5 Conclusion
Our study revealed a significant association between the FFM/FM ratio and physical performance in patients with T2DM, with lower ratios linked to poorer performance in both sexes. WC, UAC, and age were identified as significant predictors of the FFM/FM ratio in both men and women. Interventions targeting the improvement of body composition—such as personalized exercise programs, dietary modifications, and lifestyle changes—could provide meaningful clinical benefits. To further advance this research, future research should adopt longitudinal designs, incorporate a wider range of clinical and metabolic variables, and utilize advanced imaging techniques to enhance measurement precision and strengthen the evidence supporting the relationship between body composition and functional health.
Data availability statement
The original contributions presented in the study are included in the article/Supplementary Material. Further inquiries can be directed to the corresponding authors.
Ethics statement
The studies involving humans were approved by Institutional Review Board, Taipei Veterans General Hospital. The studies were conducted in accordance with the local legislation and institutional requirements. The participants provided their written informed consent to participate in this study.
Author contributions
JS: Conceptualization, Data curation, Writing – original draft. FK: Data curation, Formal analysis, Investigation, Writing – review & editing. TW: Formal analysis, Investigation, Writing – review & editing. ST: Investigation, Methodology, Writing – review & editing. CH: Conceptualization, Investigation, Methodology, Project administration, Supervision, Writing – review & editing. GS: Conceptualization, Project administration, Supervision, Visualization, Writing – review & editing.
Funding
The author(s) declare that financial support was received for the research and/or publication of this article. This study was supported by grants from Taipei Veterans General Hospital (V113C-166, V114C-177) and the National Science and Technology Council, R.O.C. (NSTC113-2314-B-075-007-). We also gratefully acknowledge the Szu-Yuan Research Foundation of Internal Medicine and the Y.L. Lin Hung Tai Education Foundation for their administrative, technical, and financial support. The funding sources had no involvement in the study design, data collection and analysis, decision to publish, or preparation of the manuscript.
Acknowledgments
This manuscript was edited by Wallace Academic Editing. We thank all study participants and the research staff who participated in this work.
Conflict of interest
The authors declare that the research was conducted in the absence of any commercial or financial relationships that could be construed as a potential conflict of interest.
Generative AI statement
The author(s) declare that no Generative AI was used in the creation of this manuscript.
Publisher’s note
All claims expressed in this article are solely those of the authors and do not necessarily represent those of their affiliated organizations, or those of the publisher, the editors and the reviewers. Any product that may be evaluated in this article, or claim that may be made by its manufacturer, is not guaranteed or endorsed by the publisher.
Supplementary material
The Supplementary Material for this article can be found online at: https://www.frontiersin.org/articles/10.3389/fendo.2025.1562870/full#supplementary-material
References
1. Siervo M, Prado CM, Mire E, Broyles S, Wells JC, Heymsfield S, et al. Body composition indices of a load-capacity model: gender- and BMI-specific reference curves. Public Health Nutr. (2015) 18:1245–54. doi: 10.1017/S1368980014001918
2. Raguso CA, Kyle U, Kossovsky MP, Roynette C, Paoloni-Giacobino A, Hans D, et al. A 3-year longitudinal study on body composition changes in the elderly: role of physical exercise. Clin Nutr. (2006) 25:573–80. doi: 10.1016/j.clnu.2005.10.013
3. Chumlea WC, Guo SS, Kuczmarski RJ, Flegal KM, Johnson CL, Heymsfield SB, et al. Body composition estimates from NHANES III bioelectrical impedance data. Int J Obes Relat Metab Disord. (2002) 26:1596–609. doi: 10.1038/sj.ijo.0802167
4. Baumgartner RN. Body composition in healthy aging. Ann N Y Acad Sci. (2000) 904:437–48. doi: 10.1111/j.1749-6632.2000.tb06498.x
5. Dai H, Xiang J, Hou Y, Xuan L, Wang T, Li M, et al. Fat Mass to Fat-Free Mass Ratio and the Risk of non-Alcoholic Fatty Liver Disease and Fibrosis in non-Obese and Obese Individuals. Nutr Metab (Lond). (2021) 18:21. doi: 10.1186/s12986-021-00551-6
6. Rugila DF, Oliveira JM, MaChado FVC, Correia NS, Puzzi VC, Passos NFP, et al. Fat mass to fat-free mass ratio and its associations with clinical characteristics in asthma. Heart Lung. (2022) 56:154–60. doi: 10.1016/j.hrtlng.2022.07.006
7. Sepúlveda-Loyola W, Silva-Díaz YA, Molari M, Jiménez Torres EA, Odar-Rojas C, Teixeira D, et al. Association between the fat mass/fat-free mass ratio and muscle strength, static balance and exercise capacity in older adults: a cross-sectional study. Nutr Hosp. (2025) 43:464–9. doi: 10.20960/nh.05616
8. Chen Y-Y, Fang W-H, Wang C-C, Kao T-W, Yang H-F, Wu C-J, et al. Fat-to-muscle ratio is a useful index for cardiometabolic risks: A population-based observational study. PLoS One. (2019) 14:e0214994–e. doi: 10.1371/journal.pone.0214994
9. Sandini M, Paiella S, Cereda M, Angrisani M, Capretti G, Famularo S, et al. Independent effect of fat-to-muscle mass ratio at bioimpedance analysis on long-term survival in patients receiving surgery for pancreatic cancer. Front Nutr. (2023) 10:1118616. doi: 10.3389/fnut.2023.1118616
10. Gažarová M, Bihari M, and Šoltís J. Fat and fat-free mass as important determinants of body composition assessment in relation to sarcopenic obesity. Rocz Panstw Zakl Hig. (2023) 74:59–69. doi: 10.32394/rpzh.2023.0243
11. Merchant RA, Seetharaman S, Au L, Wong MWK, Wong BLL, Tan LF, et al. Relationship of fat mass index and fat free mass index with body mass index and association with function, cognition and sarcopenia in pre-frail older adults. Front Endocrinol (Lausanne). (2021) 12:765415. doi: 10.3389/fendo.2021.765415
12. Al-Sofiani ME, Ganji SS, and Kalyani RR. Body composition changes in diabetes and aging. J Diabetes Complications. (2019) 33:451–9. doi: 10.1016/j.jdiacomp.2019.03.007
13. Yokoyama H, Shiraiwa T, Takahara M, Iwamoto M, Kuribayashi N, Nomura T, et al. Applications of physical performance measures to routine diabetes care for frailty prevention concept: fundamental data with grip strength, gait speed, timed chair stand speed, standing balance, and knee extension strength. BMJ Open Diabetes Res Care. (2020) 8:e001562. doi: 10.1136/bmjdrc-2020-001562
14. Napoleone JM, Boudreau RM, Lange-Maia BS, El Khoudary SR, Ylitalo KR, Kriska AM, et al. Metabolic syndrome trajectories and objective physical performance in mid-to-early late life: the study of women’s health across the nation (SWAN). J Gerontol A Biol Sci Med Sci. (2022) 77:e39–47. doi: 10.1093/gerona/glab188
15. Vongsirinavarat M, Mathiyakom W, Kraiwong R, and Hiengkaew V. Fear of falling, lower extremity strength, and physical and balance performance in older adults with diabetes mellitus. J Diabetes Res. (2020) 2020:8573817. doi: 10.1155/2020/8573817
16. Azizan A, Anum A, and Alias NA. Comparison of Physical Performances with Cognitive Functions and Fear of Falls among Elderly with and without Diabetes Mellitus. Environment-Behaviour Proc J. (2018) 3:46–54. doi: 10.21834/e-bpj.v3i9.1536
17. Farzana T and Meerjady SF. Influence of Diabetes on Physical Function among the elderly Persons. Ibrahim Med Coll J. (2009) 3:45–9. doi: 10.3329/imcj.v3i2.4162
18. Assar ME, Laosa O, and Rodríguez Mañas L. Diabetes and frailty. Curr Opin Clin Nutr Metab Care. (2019) 22:52–7. doi: 10.1097/MCO.0000000000000535
19. Welch SA, Ward RE, Beauchamp MK, Leveille SG, Travison T, and Bean JF. The short physical performance battery (SPPB): A quick and useful tool for fall risk stratification among older primary care patients. J Am Med Dir Assoc. (2021) 22:1646–51. doi: 10.1016/j.jamda.2020.09.038
20. Melo TA, Duarte ACM, Bezerra TS, França F, Soares NS, and Brito D. The Five Times Sit-to-Stand Test: safety and reliability with older intensive care unit patients at discharge. Rev Bras Ter Intensiva. (2019) 31:27–33. doi: 10.5935/0103-507X.20190006
21. McAllister LS and Palombaro KM. Modified 30-second sit-to-stand test: reliability and validity in older adults unable to complete traditional sit-to-stand testing. J Geriatr Phys Ther. (2020) 43:153–8. doi: 10.1519/JPT.0000000000000227
22. Chen LK, Woo J, Assantachai P, Auyeung TW, Chou MY, Iijima K, et al. Asian working group for sarcopenia: 2019 consensus update on sarcopenia diagnosis and treatment. J Am Med Dir Assoc. (2020) 21:300–307.e2. doi: 10.1016/j.jamda.2019.12.012
23. Ascencio EJ, Cieza-Gómez GD, Carrillo-Larco RM, and Ortiz PJ. Timed up and go test predicts mortality in older adults in Peru: a population-based cohort study. BMC Geriatr. (2022) 22:61. doi: 10.1186/s12877-022-02749-6
24. Izzo A, Massimino E, Riccardi G, and Della Pepa G. A narrative review on sarcopenia in type 2 diabetes mellitus: prevalence and associated factors. Nutrients. (2021) 13:183. doi: 10.3390/nu13010183
25. Koster A, Ding J, Stenholm S, Caserotti P, Houston DK, Nicklas BJ, et al. Does the amount of fatmass predict age-related loss of lean mass, muscle strength, and muscle quality in older adults? J Gerontol A Biol Sci Med Sci. (2011) 66:888–95. doi: 10.1093/gerona/glr070
26. Kalinkovich A and Livshits G. Sarcopenic obesity or obese sarcopenia: A cross talk between age-associated adipose tissue and skeletal muscle inflammation as a main mechanism of the pathogenesis. Ageing Res Rev. (2017) 35:200–21. doi: 10.1016/j.arr.2016.09.008
27. Mu ZJ, Fu JL, Sun LN, Chan P, and Xiu SL. Associations between homocysteine, inflammatory cytokines and sarcopenia in Chinese older adults with type 2 diabetes. BMC Geriatr. (2021) 21:692. doi: 10.1186/s12877-021-02622-y
28. Hong SH and Choi KM. Sarcopenic obesity, insulin resistance, and their implications in cardiovascular and metabolic consequences. Int J Mol Sci. (2020) 21:494. doi: 10.3390/ijms21020494
29. Balkau B, Deanfield JE, Després JP, Bassand JP, Fox KA, Smith SC Jr, et al. International Day for the Evaluation of Abdominal Obesity (IDEA): a study of waist circumference, cardiovascular disease, and diabetes mellitus in 168,000 primary care patients in 63 countries. Circulation. (2007) 116:1942–51. doi: 10.1161/CIRCULATIONAHA.106.676379
30. Després JP. Body fat distribution and risk of cardiovascular disease: an update. Circulation. (2012) 126:1301–13. doi: 10.1161/CIRCULATIONAHA.111.067264
31. Jonathan T, Aldo S, Pieter CJ, and Erik C. Reliability of standard circumferences in domain-related constitutional applications. Am J Hum Biol. (2013) 25:637–42. doi: 10.1002/ajhb.22423
32. Sun Y-S, Kao T-W, Chang Y-W, Fang W-H, Wang C-C, Wu L-W, et al. CC as a novel tool for risk of disability of the elderly population. Sci Rep. (2017) 7:16359. doi: 10.1038/s41598-017-16347-9
33. Hughes VA, Frontera WR, Roubenoff R, Evans WJ, and Singh MA. Longitudinal changes in body composition in older men and women: role of body weight change and physical activity. Am J Clin Nutr. (2018) 108:32–9.
34. Ashwell M, Gunn P, and Gibson S. Waist-to-height ratio is a better screening tool than waist circumference and BMI for adult cardiometabolic risk factors: systematic review and meta-analysis. Obes Rev. (2012) 13:275–86. doi: 10.1111/j.1467-789X.2011.00952.x
35. Wang S and Ren J. Obesity paradox in aging: from prevalence to pathophysiology. Prog Cardiovasc Dis. (2018) 61:182–9. doi: 10.1016/j.pcad.2018.07.011
36. Merchant RA, Wong MWK, Lim JY, and Morley JE. Association of central obesity and high body mass index with function and cognition in older adults. Endocr Connect. (2021) 10:909–17. doi: 10.1530/EC-21-0223
Keywords: fat-free mass, fat mass, ratio of fat-free mass to fat mass, physical performance, type 2 diabetes mellitus
Citation: Sung J-H, Ko F-S, Wu T-H, Tsai S-C, Hwu C-M and Su G-Y (2025) Ratio of fat-free mass to fat mass is associated with physical performance in patients with type 2 diabetes mellitus. Front. Endocrinol. 16:1562870. doi: 10.3389/fendo.2025.1562870
Received: 18 January 2025; Accepted: 30 June 2025;
Published: 18 July 2025.
Edited by:
Jian Sun, Guangzhou Sport University, ChinaReviewed by:
Jing Dai, Guangzhou Sport University, ChinaYeo Ju Sohn, Ewha Womans University Seoul Hospital, Republic of Korea
Copyright © 2025 Sung, Ko, Wu, Tsai, Hwu and Su. This is an open-access article distributed under the terms of the Creative Commons Attribution License (CC BY). The use, distribution or reproduction in other forums is permitted, provided the original author(s) and the copyright owner(s) are credited and that the original publication in this journal is cited, in accordance with accepted academic practice. No use, distribution or reproduction is permitted which does not comply with these terms.
*Correspondence: Guan-Yu Su, Z3lzdUB2Z2h0cGUuZ292LnR3; c3VndWFueXUxMjIwQGdtYWlsLmNvbQ==; Chii-Min Hwu, Y2hod3VAdmdodHBlLmdvdi50dw==