 Xinhui Yang1†Xiuying Zhang2†Chen Sun1†Cuiling Zhao1Xiangshuang Kong1
 Mingming Zhao3*
 Linong Ji2*
 Yufeng Li1*‡
- 1Department of Endocrinology, Beijing Friendship Hospital Pinggu Campus, Capital Medical University, Beijing, China
- 2Department of Endocrinology and Metabolism, Peking University People’s Hospital, Peking University Diabetes Centre, Beijing, China
- 3Department of Cardiology and Institute of Vascular Medicine, Peking University Third Hospital, Beijing, China
Aim: We aimed to assess the effects of acarbose and vildagliptin on levels of plasma trimethylamine N-oxide (TMAO) and its metabolic precursor in overweight and obese patients with type 2 diabetes mellitus and ascertain the correlation between TMAO and characteristics of diabetes.
Methods: This study employed a randomized, controlled, open interventional design and recruited 100 participants who were overweight/obese and newly diagnosed with type 2 diabetes at Pinggu Hospital, Beijing Friendship Hospital, Capital Medical University, between December 2016 and December 2017. Using the sealed envelope method, participants were randomly allocated (1:1) to either the acarbose group (n = 50) or the vildagliptin group (n = 50). Participants received 6 months of treatment with oral glucose-lowering medications, acarbose, or vildagliptin. Anthropometric measurements, including height, weight, waist and hip circumferences, and blood pressure, were recorded at baseline and 3 and 6 months after the intervention. Blood samples were obtained to assess blood glucose, insulin, gut hormones, TMAO, and metabolic precursors. Data analysis focused on intragroup and intergroup variations.
Results: Baseline characteristics, including weight, BMI, waist and hip circumferences, blood glucose, and gut hormone levels, were comparable between the acarbose and vildagliptin groups (all p>0.05). Intragroup analysis indicated a significant decrease in TMAO levels at 6 months compared with baseline (adjusted p<0.05). L-carnitine and γ-butyrobetaine levels significantly increased at 6 months (all adjusted p<0.05), whereas betaine and choline levels remained non-significant throughout the intervention. Intergroup analysis revealed significantly lower TMAO levels in the acarbose group at 6 months (p<0.05), without significant intergroup differences in L-carnitine, γ-butyrobetaine, choline, or betaine levels (all p>0.05). In the acarbose group, positive correlations were observed between changes in TMAO and BMI, waist circumference, postprandial glucose, fasting insulin, fasting C-peptide, and HOMA-IR from baseline to 6 months (p<0.05).
Conclusions: Both acarbose and vildagliptin treatments significantly reduced TMAO levels in newly diagnosed T2DM patients, with a more pronounced reduction observed in the acarbose group. Furthermore, the decline in TMAO levels correlated significantly with improvements in insulin resistance parameters.
Clinical trial registration: https://clinicaltrials.gov, identifier NCT02999841.
1 Introduction
Diabetes mellitus represents a spectrum of metabolic disorders that are characterized by dysregulated carbohydrate metabolism, wherein diminished peripheral glucose utilization and excessive hepatic glucose production collectively drive hyperglycemia (1). As the predominant subtype accounting for 90–95% of cases, type 2 diabetes mellitus (T2DM) originates from the synergistic interplay of insulin resistance in key metabolic tissues (skeletal muscle, liver, and adipose) and progressive β-cell dysfunction. This dual pathophysiology disrupts the insulin secretion–demand equilibrium, which ultimately overwhelms compensatory mechanisms and results in relative insulin deficiency (2). In 2022, an estimated 828 million adults (those aged 18 years and older) were affected by diabetes, marking a staggering 630 million increase since 1990 (3) and imposing a global economic burden exceeding $996 billion annually (4). More than 50% of patients with diabetes in low- and middle-income countries remain undiagnosed, and this contributes to preventable complications (3, 5). Chronic hyperglycemia induces microvascular (retinopathy, nephropathy) and macrovascular complications (cardiovascular disease), accounting for the majority of the substantial global economic burden attributable to diabetes (6). Despite advances in therapeutic strategies, the intricate interplay among oral antidiabetic drugs (OADs), gut microbiota dynamics, and metabolic outcomes remains underexplored.
Emerging evidence implicates gut microbiota-derived metabolites as critical mediators of metabolic homeostasis. Among these, trimethylamine N-oxide (TMAO; (CH3)3NO), a gut microbiota-dependent metabolite derived from dietary choline and carnitine (abundant in red meat and dairy) (7, 8), has emerged as a potent biomarker and pathogenic effector in cardiometabolic diseases (9, 10). Critically, TMAO is strongly associated with T2DM development (11–15). Preclinical studies demonstrate that TMAO exacerbates IR by activating hepatic PERK/FoxO1 signaling activation, which impairs insulin receptor substrate phosphorylation (16), and by suppressing bile acid synthesis via CYP7A1 inhibition, thereby disrupting glucose homeostasis (17, 18). Zhuang et al. (14) conducted a dose-response meta-analysis encompassing 12 clinical studies with over 15,000 participants around the world and reported that circulating TMAO concentrations were positively correlated with a high risk of T2DM, with longitudinal studies corroborating its predictive value for incident T2DM in middle-aged populations (15, 19). Furthermore, patients with T2DM with elevated circulating TMAO levels are at higher risk of doubling serum creatinine, progressing to end-stage kidney disease, and mortality. TMAO is a potential biomarker for kidney function progression and mortality in patients with T2DM (20, 21).
Oral antidiabetic drugs (OADs) exhibit pleiotropic effects beyond glycemic control, particularly through gut microbiota modulation (22–24). Acarbose, an α-glucosidase inhibitor, reduces postprandial hyperglycemia by delaying carbohydrate absorption in the small intestine. Undigested carbohydrates reaching the colon undergo microbial fermentation, reshaping the gut ecosystem. In both high-starch and high-fiber diet backgrounds, acarbose treatment has been shown to increase the levels of short-chain fatty acids (SCFAs), including butyrate (25). In obese mice, acarbose enriches propionate-producing Parasutterella, suppressing adipose inflammation (26). Our prior clinical trials demonstrated that acarbose selectively enriches SCFA-producing bacteria in prediabetes (27) while reducing Bacteroides species and boosting Bifidobacterium members (28). Similarly, vildagliptin, a dipeptidyl peptidase-4 (DPP-4) inhibitor, prolongs incretin signaling by inhibiting glucagon-like peptide-1 (GLP-1) degradation, which may indirectly modulate microbial ecology. Evidence from a study of fecal microbiota transplantation (FMT) has indicated that the DPP-4i-altered microbiome can enhance glucose tolerance in colonized mice, concomitantly increasing the abundance of Bacteroidetes (29). Our previous study suggested that both acarbose and vildagliptin monotherapy can significantly improve glycemic control and alter gut microbiota in patients with T2DM (28), however, the impact of this two medication on TMAO level remain unexplored.
This study was conducted to investigate the influence of acarbose and vildagliptin on plasma TMAO concentrations within an identical cohort of patients with T2DM and to explore the correlation between TMAO and characteristics of diabetes. Based on the role of TMAO in impairing insulin signaling and the microbiota-modulating properties of acarbose and vildagliptin, we hypothesize that both acarbose and vildagliptin reduce plasma TMAO concentrations in newly diagnosed T2DM patients, and that TMAO reduction correlates with improvements in insulin resistance (HOMA-IR).
2 Materials and methods
2.1 Participants
This study enrolled 100 adults aged 30–70 years with newly diagnosed, treatment-naïve T2DM (NDT2D) from the endocrinology outpatient clinics of Pinggu Hospital (Beijing, China) between December 2016 and December 2017. The age range was selected to encompass the peak T2DM incidence window, while excluding individuals with monogenic diabetes (age <30 years) and polypharmacy confounders among older adults (age >70 years) (30, 31).
Inclusion criteria:1) Newly diagnosed T2DM per 1999 WHO criteria (32), confirmed by a 75-g oral glucose tolerance test (OGTT), with disease duration ≤12 months and no prior glucose-lowering medication use (or ≤1 month of prior use followed by a 3-month washout). 2) Body mass index (BMI) 24.0 -30.0 kg/m², classified as overweight (24.0-27.9 kg/m²) or obese(≥28.0 kg/m²) per Chinese obesity criteria (33). 3) HbA1c 7.0–9.0% (53–75 mmol/mol), aligned with efficacy-safety thresholds for oral monotherapy in the Chinese Diabetes Guidelines (2013) (34).
Excluded criteria comprised pregnancy, lactation, or intention to conceive; gastrointestinal diseases; infectious liver diseases (hepatitis B and C); endocrine diseases affecting glucose metabolism; psychiatric disorders; alcohol dependence; neoplasia; or any other severe disease that could affect the outcomes of the study. None of the participants had consumed or injected medicines or food containing antibiotics, hormones, or probiotics for at least 1 month before the initiation of the study and had a history of weight loss, dyslipidemia, hyperglycemia, or hypertension.
All participants underwent on-site screening, including informed consent (detailing gastrointestinal risks of acarbose), medical history review, anthropometric measurements and biochemical analysis. Participants were urban residents of Pinggu District with comparable dietary and lifestyle behaviors.
2.2 Study design
This study involved biomarker exploration and data mining derived from a previously conducted exploratory, randomized, controlled, open-label intervention trial (without a placebo arm) (28) (Figure 1). The sample size for this exploratory trial (50 per group) was determined based on prior human gut microbial intervention studies (22–51 subjects per group) (35–37), accounting for potential attrition.
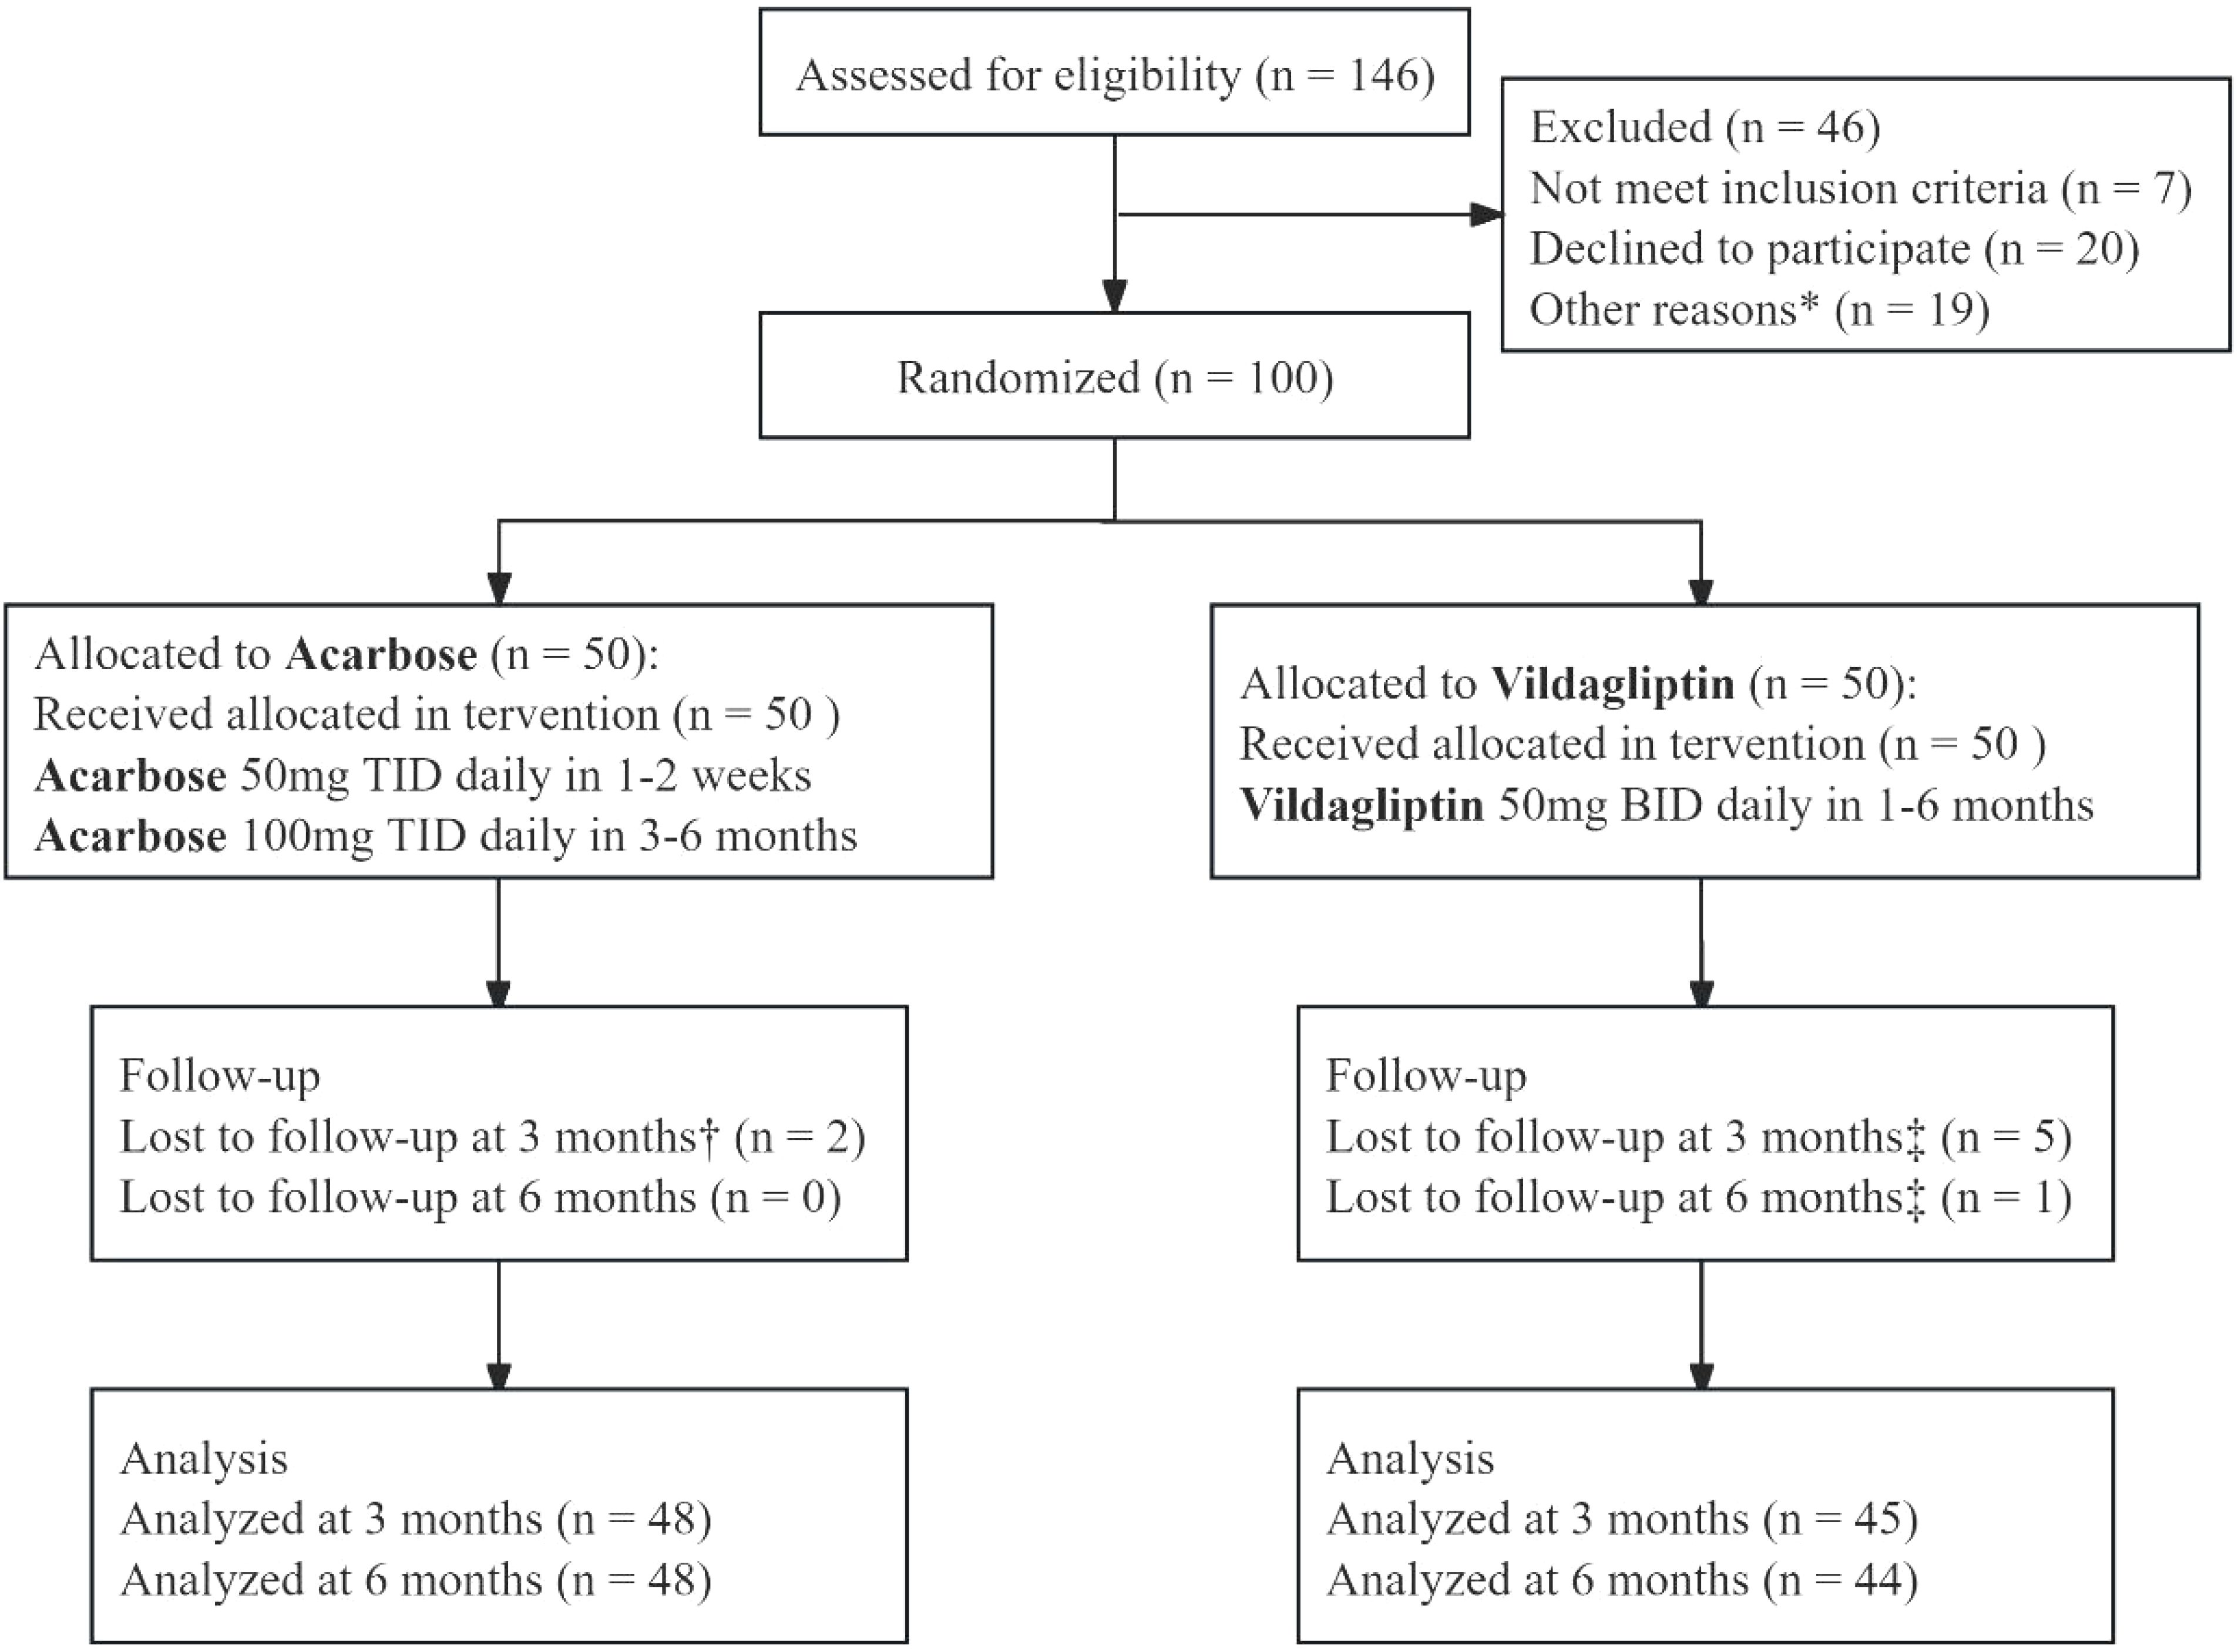
Figure 1. CONSORT flow diagram of a 6-month randomized controlled trial comparing vildagliptin and acarbose monotherapy in newly diagnosed type 2 diabetes mellitus. The diagram outlines participant screening (n=146), exclusion (n=46: unmet inclusion criteria [n=7], declined participation [n=20], other reasons [n=19]), randomization (n=100), and attrition. Acarbose (50 mg TID escalated to 100 mg TID at week 3) and vildagliptin (50 mg BID) were administered. Participants with 80–120% adherence were included in the per-protocol analysis (96% [48/50] acarbose, 88% [44/50] vildagliptin). *Other reasons: Participants withdrew consent (n = 12) or failed biochemical criteria (n = 7). †Acarbose group lost to follow-up: 1 relocated, 1 withdrew consent. ‡Vildagliptin group lost to follow-up: 3 lost contact, 2 withdrew consent (3 months); 1 lost contact (6 months).
Eligible participants were randomly assigned (1:1) to the acarbose or vildagliptin group via simple randomization. A computer-generated random number sequence was created using SAS 9.0 by an independent statistician. Allocation concealment was ensured using opaque, sealed envelopes. The study treatments were as follows (1): Acarbose group (n = 50): acarbose (Bayer Medical and Health Co., Ltd., 50 mg/tablet) was initiated at 50 mg three times daily (TID) with the first meal for weeks 1-2, then escalated to 100 mg TID from week 3 onward to mitigate gastrointestinal adverse effects (e.g., bloating, flatulence). (2) Vildagliptin group (n = 50): vildagliptin (Swiss Novartis Limited, 50 mg/tablet) was administered as 50 mg twice daily (BID) before meals. All participants received telephone reminders 1–2 days prior to each visit, completing 5 telephone follow-ups and 3 on-site visits. During each visit, all participants received comprehensive lifestyle guidance according to the Chinese Diabetes Guidelines (2013) (34), which included daily caloric reduction (400–500 kcal), saturated fat restriction (<30% total fat), and ≥150 minutes/week of moderate-intensity exercise (e.g., brisk walking). Medication adherence was monitored through dosing diaries, pill counts, and returned packaging. Participants with 80–120% adherence were included in the Per Protocol Population (PPS).
2.3 Measurements of glucose and insulin concentrations
Blood specimens were collected via venipuncture at baseline and at 3 months (3M) and 6 months (6M) post-intervention. Glycosylated hemoglobin (HbA1c) was measured using cation-exchange high-pressure liquid chromatography (HPLC) method (Adams A1c HA-8160; Arkray, Kyoto, Japan). Plasma concentrations of fasting plasma glucose (FPG) and postprandial 2-h glucose (PPG) after a routine 75-g OGTT were measured using the glucose oxidase method. Fasting insulin (Fins) and postprandial 2-hour insulin (Pins) levels were determined using an electrochemiluminescence immunoassay (Elecsys 2010 system, Roche Diagnostic Ltd, Basel, Switzerland). C-peptide levels were measured using Direct Chemiluminescence (Atellica IM series; Siemens Healthcare Diagnostics).
HOMA-IR score was calculated using the following formula:
HOMA-β score was calculated using the following formula:
2.4 Measurement of plasma TMAO, choline, L-carnitine, betaine, and γ-butyrobetaine levels
Levels of TMAO, choline, L-carnitine, betaine and γ-butyrobetaine were quantified using stable isotope dilution liquid chromatography–tandem mass spectrometry, as described previously (38). Briefly, 20 μL plasma were aliquoted into a 1.5-mL tube and mixed with 80 μL 10 μM internal standard composed of d9-TMAO, d9-choline, d9-carnitine, d11-betaine, and d9-γ-butyrobetaine in methanol. Protein in the samples was precipitated and the supernatant was recovered following centrifugation at 20,000 g at 4°C for 10 min, and the resulting supernatants were analyzed by injection onto a silica column (2.0*150 mm, Luna 5u Silica 100A; Cat. No. 00F-4274-B0, Phenomenex, Torrance, CA) at a flow rate of 0.4 mL/min using a LC-20AD Shimadazu pump system, SIL-20AXR autosample interfaced with an API 5500Q-TRAP mass spectrometer (AB SCIEX, Framingham, MA). A discontinuous gradient was employed to separate the analytes by mixing solvent A (0.1% propanoic acid in water) with solvent B (0.1% acetic acid in methanol) at different ratios, starting from 2% B linearly to 95% B, over 5.0 min, then held for 1.0 min, and then back to 2% B. Analytes were monitored using electrospray ionization in positive-ion mode with multiple reaction monitoring (MRM) of precursor and characteristic product-ion transitions of TMAO at m/z 76→58, d9-TMAO at m/z 85 →66, choline at m/z 104 →59.8, d9-choline at m/z 113.2→68.9, carnitine at m/z 162.1→103, d9-carnitine at m/z 171.1→102.8, betaine at m/z 118 →59, d11-betaine at m/z 129.1→65.9, γ-butyrobetaine at m/z 146.1→87, d9-γ-butyrobetaine at m/z 155.1→87, respectively.
2.5 Other measurements
The fasting serum lipid profile, including total cholesterol (TC), triglyceride (TG), high-density lipoprotein cholesterol (HDL-C), and low-density lipoprotein cholesterol (LDL-C) levels, was ascertained using an automated biochemical analyzer. Serum concentrations of gut hormones, including active glucagon-like peptide-1 (GLP-1), ghrelin, peptide YY (PYY), and leptin, were quantified in the fasting state using standard enzyme-linked immunosorbent assay (ELISA) kits (EGLP-35K, EZGRT-89K, EZHPYYT66K, Merck Millipore, USA). The radioimmunoassay method (RK-069-04, Phoenix Peptide, USA) was used to measure serum cholecystokinin (CCK). Each participant was subjected to a series of anthropometric assessments, including body weight, height, waist and hip circumference, and systolic and diastolic blood pressure (SBP and DBP, respectively). BMI was calculated as the weight divided by height squared (kg/m2). The waist-to-hip ratio (WHR) was calculated as waist circumference divided by hip circumference. All anthropometric measurements were taken by registered nurses at the baseline, 3M, and 6M visits.
2.6 Statistical analysis
We analyzed the differences between the vildagliptin and acarbose treatment arms in clinical variables at baseline. Shapiro–Wilk test for determining whether continuous variables are normally distributed. Normally distributed quantitative variables are described as mean and standard deviation (SD); the independent samples t-test was used for intergroup comparisons. Non-normally distributed quantitative variables are presented as median (25th, 75th percentiles), and the Mann–Whitney U test was used to compare the two groups. Longitudinal changes in gut microbial metabolites (TMAO, L-carnitine, betaine, choline, and γ-butyrobetaine) across three timepoints (baseline, 3 months [3M], and 6 months [6M]) were evaluated using the Friedman test, a non-parametric repeated-measures analysis. Post hoc pairwise comparisons were conducted with Dunn’s test, adjusted for multiple testing via Bonferroni correction. To compare the degrees of posttreatment changes in clinical variables of different treatment group, we normalized the changes (Δ) of each variable from the baseline examination to 6M of the drug intervention. For each individual, change from baseline of a given variable was calculated using the following equation: . where Basevariable and M6variable are the values of a given variable from the same individual at baseline and 6M in the acarbose and vildagliptin groups, respectively. To investigate the correlation between the levels of gut microbial metabolites and glucose metabolic variables during treatment with different agents, Spearman bivariate correlation analysis was conducted between the changing glucose metabolic characteristics and plasma levels of TMAO, L-carnitine, betaine, choline, and γ-butyrobetaine at 6M. All analyses were two-tailed, with p < 0.05 considered statistically significant, and performed in SPSS 25.0 and GraphPad Prism 9.5.0. A correlation heatmap was drawn using ChiPlot (https://www.chiplot.online/) (accessed 10 October 2024).
2.7 Ethics approval
This study was approved by the Ethics Committee of the Peking University Health Science Center (2015PHB175-01; Date: 18 November 2015) and was conducted in compliance with the Declaration of Helsinki. The study was registered at ClinicalTrials.gov (NCT02999841). All participants provided written informed consent.
3 Results
3.1 Baseline characteristics of participants
One hundred eligible patients with NDT2D (54 men and 46 women) were randomly assigned (1:1) to either the acarbose or vildagliptin treatment group. Seven participants were lost to follow-up at the 3-month visit and eight at the 6-month visit after starting the intervention. In total, 92 participants completed the 6-month trial: 48 in the acarbose group and 44 in the vildagliptin group. No serious drug-related adverse events were observed.
Baseline clinicodemographic characteristics were comparable between the study groups (Table 1). No significant differences were observed in age (p= 0.434) or sex distribution (p= 0.108). Glycemic parameters (HbA1c, FPG, PPG, Fins, Pins, HOMA-β, HOMA-IR), obesity measures (body weight, BMI, waist circumference, and hip circumference), and lipid profiles (TC, TG, LDL-C) were balanced between the two groups (p>0.05 for all; Table 1). However, HDL-C levels were significantly higher in the vildagliptin group (p=0.030). Additionally, there were no significant intergroup differences in blood pressure, intestinal hormone levels, or adipokine levels (p>0.05 for all; Table 1). More detailed information has been published (28).
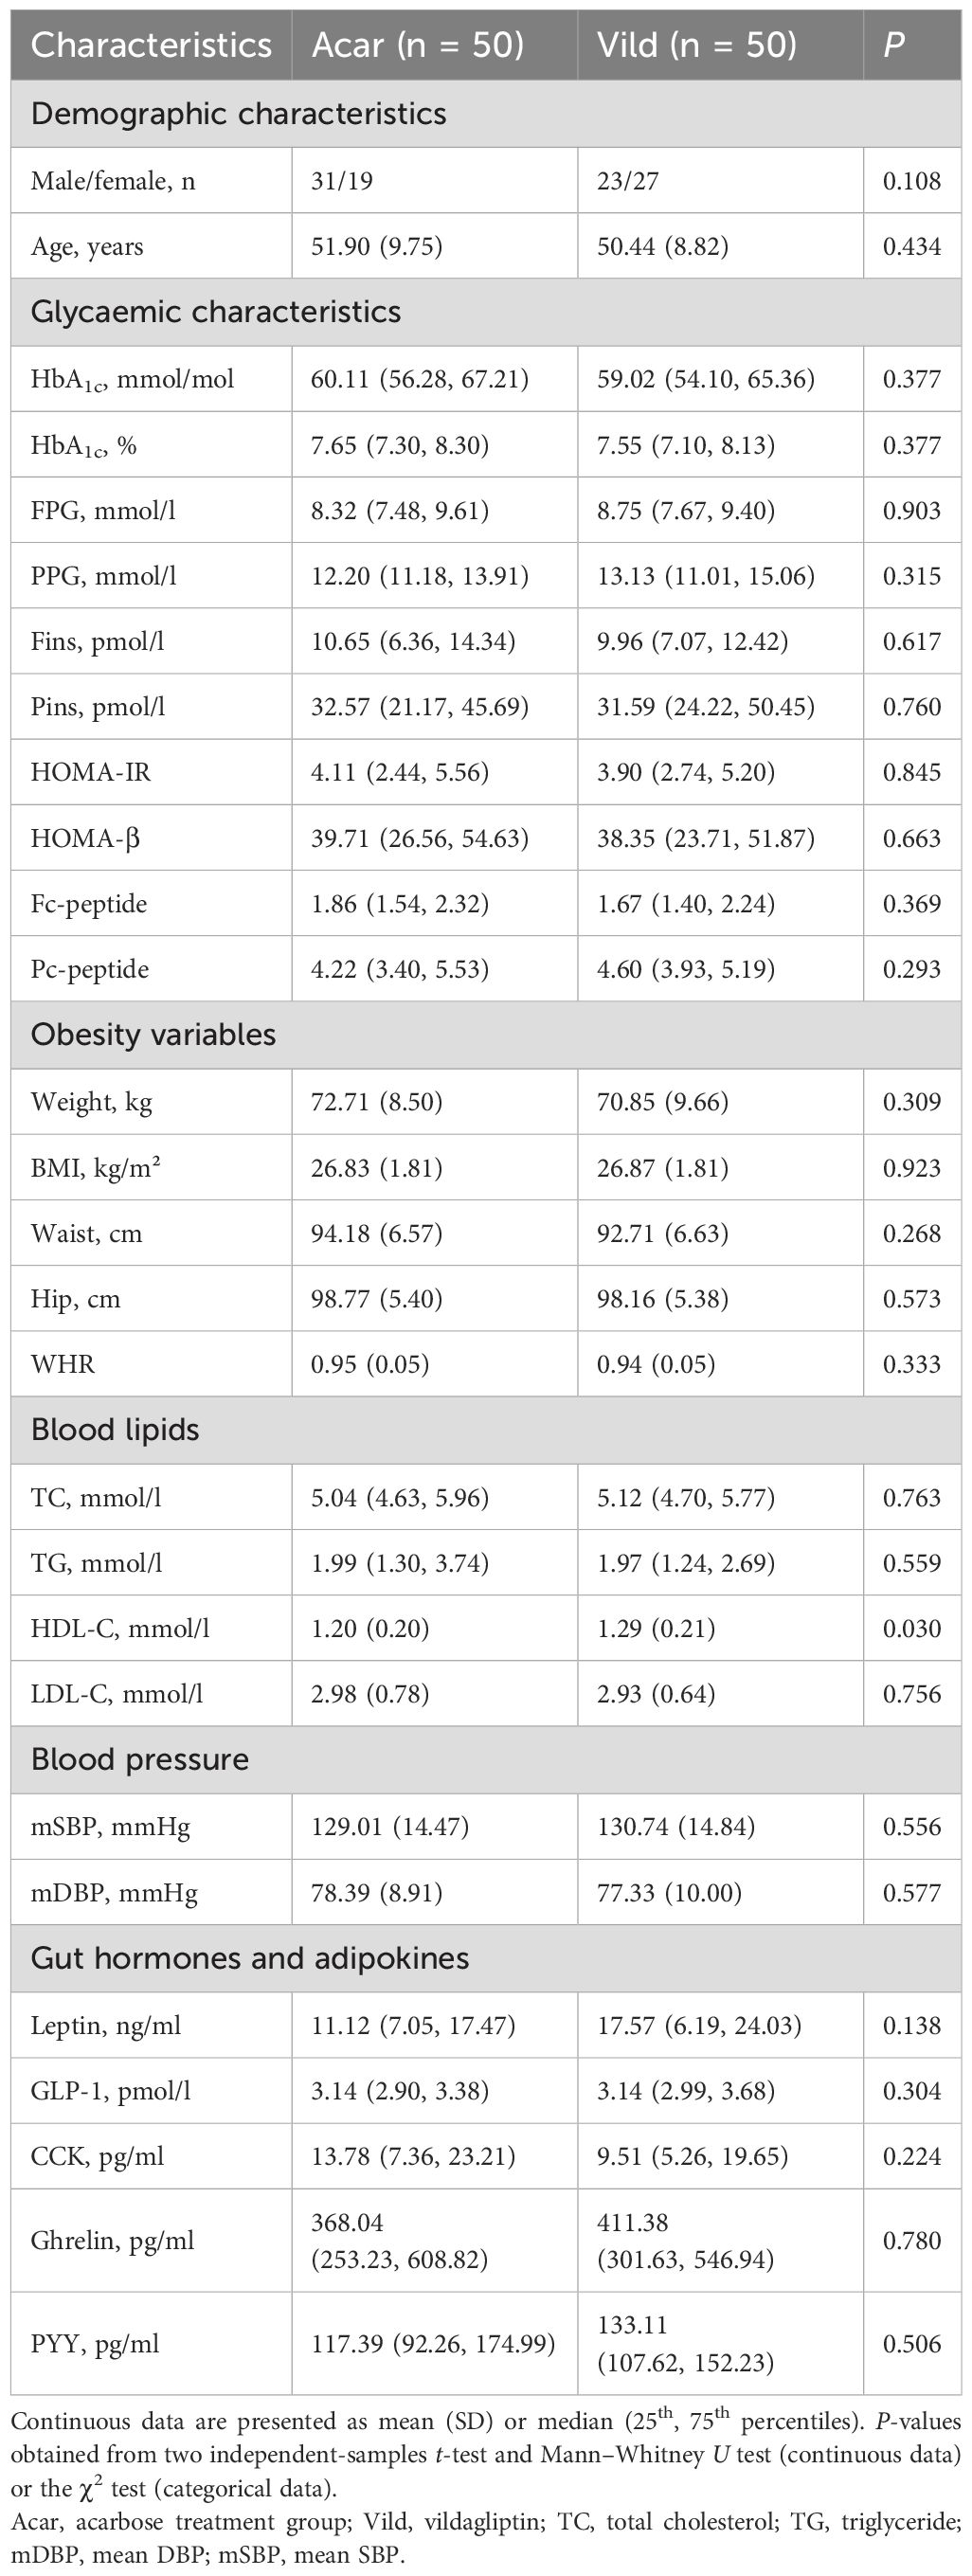
Table 1. Demographic and metabolic characteristics of the participants.
3.2 Gut microbiota metabolite dynamics during treatment
Longitudinal analysis of plasma gut microbiota metabolites revealed no baseline intergroup differences in TMAO, L-carnitine, betaine, choline, or γ-butyrobetaine concentrations (p > 0.05 for all; Table 2).At 6 months, TMAO concentrations were significantly lower in the acarbose group versus vildagliptin (p < 0.05), while other metabolites showed no intergroup divergence (p>0.05 for all; Table 2).
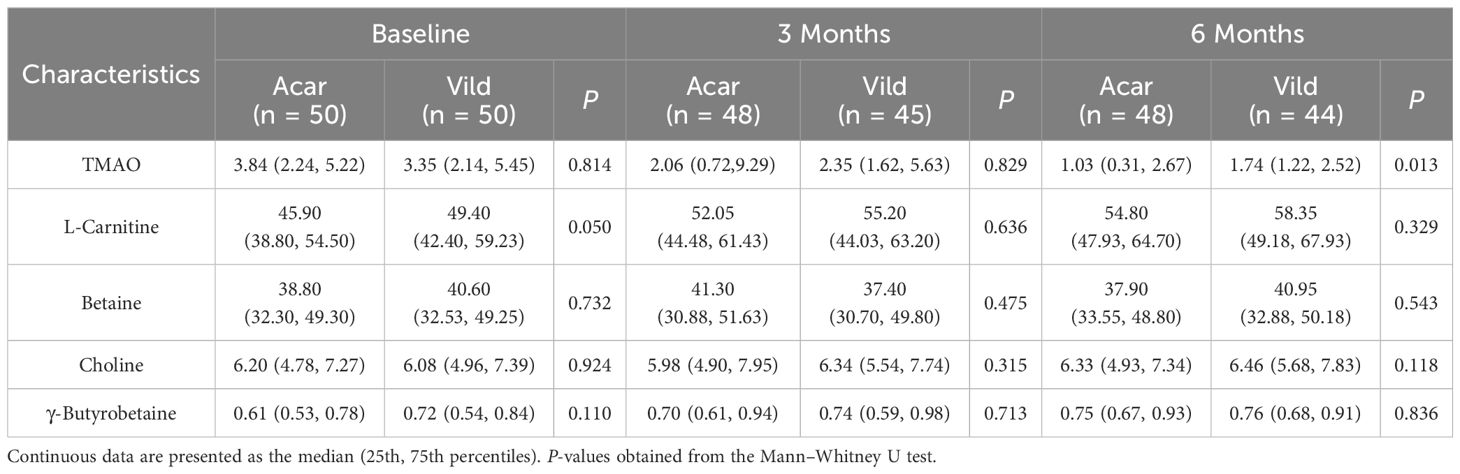
Table 2. Intergroup differences in the levels of gut microbial metabolites.
Intragroup comparisons using the Friedman test demonstrated time-dependent changes. In the acarbose group, plasma TMAO concentrations decreased significantly at 6 months compared to baseline and 3 months (Bonferroni-adjusted p < 0.05; Figure 2a). L-carnitine and γ-butyrobetaine concentrations increased at 3 and 6 months versus baseline (Bonferroni-adjusted p < 0.05; Figures 2b, e), while betaine and choline remained stable (Bonferroni-adjusted p > 0.05; Figures 2c, d).
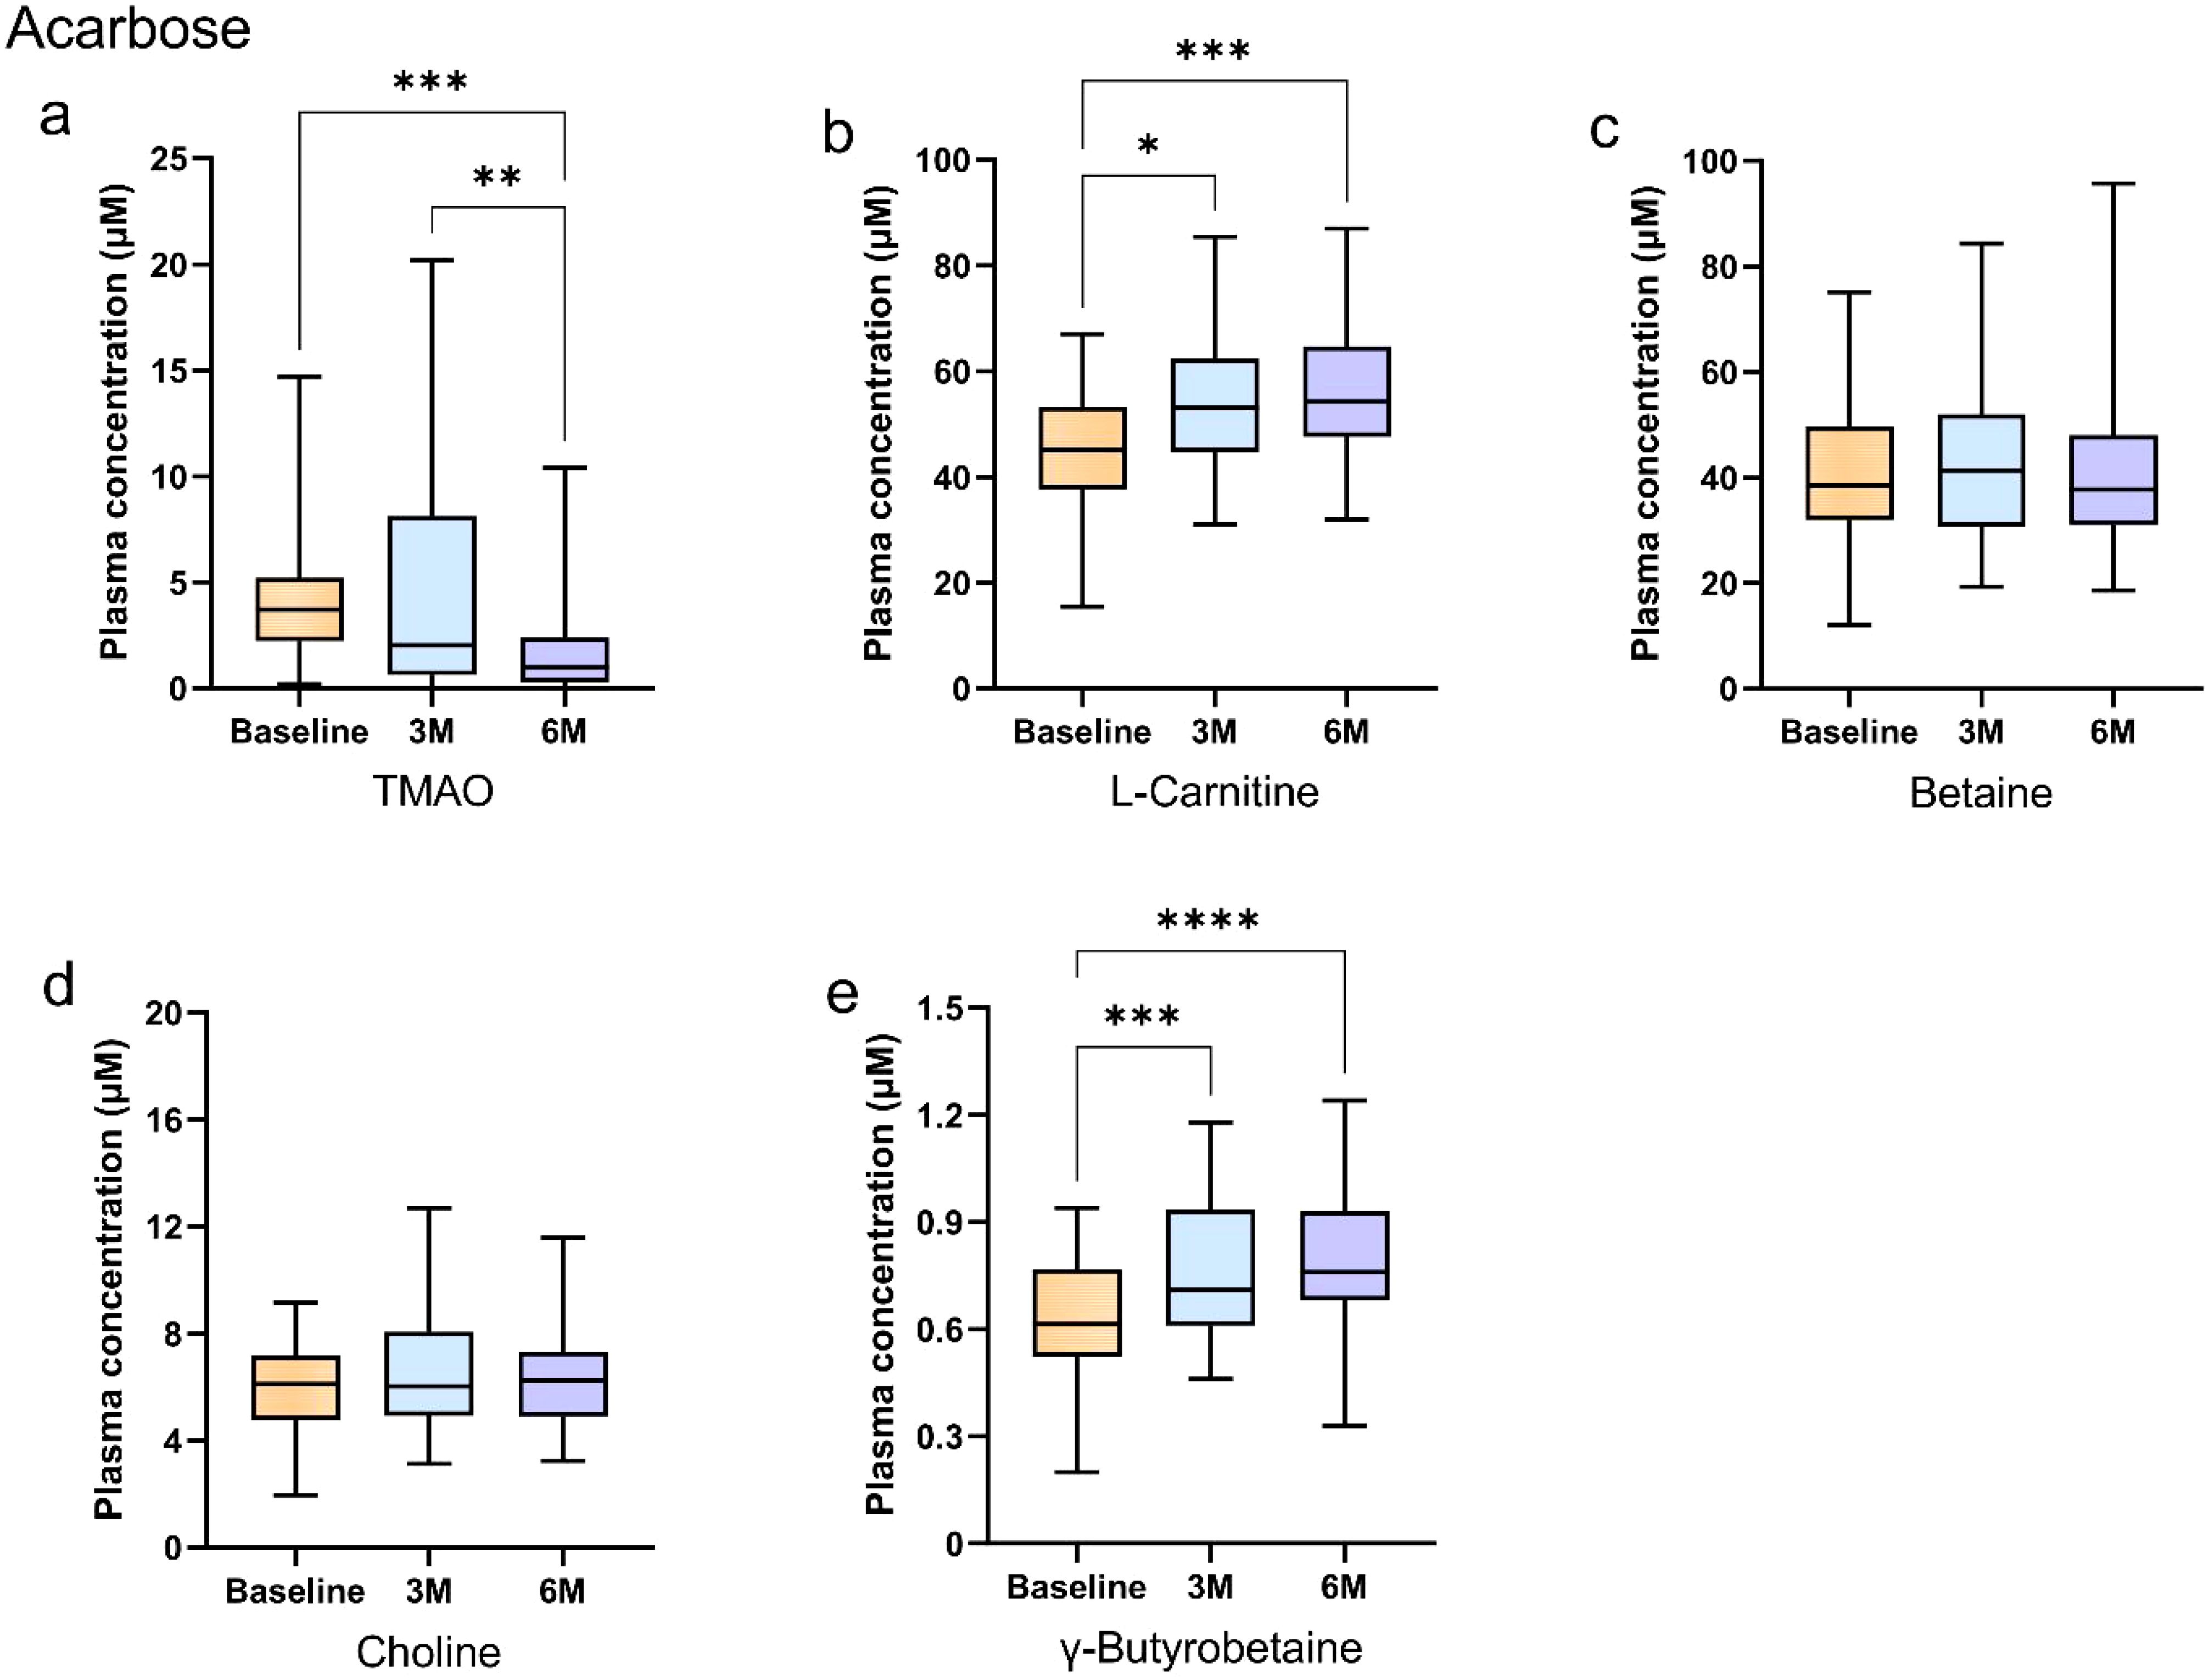
Figure 2. Longitudinal changes in plasma gut microbiota metabolites during acarbose treatment in newly diagnosed type 2 diabetes patients. (A–E) Box plots show longitudinal changes in plasma concentrations of (a) trimethylamine N-oxide (TMAO), (b) L-carnitine, (c) betaine, (d) choline, and (e) γ-butyrobetaine at baseline (orange), 3 months (blue), and 6 months (purple). Statistical analysis was performed using the Friedman test (non-parametric repeated measures) followed by Dunn’s post hoc test with Bonferroni correction for pairwise comparisons. Significance levels: *Bonferroni-adjusted p<0.05; **adjusted p<0.01; ***adjusted p<0.001; ****adjusted p<0.0001. Data are presented as median (25th, 75th). Detailed data are presented in Supplementary Tables 1, 2.
In the vildagliptin group, plasma TMAO concentrations decreased significantly at 6 months compared to baseline (Bonferroni-adjusted p < 0.05; Figure 3a). L-carnitine increased at 6 months versus baseline (Bonferroni-adjusted p < 0.05; Figure 3b), while γ-butyrobetaine concentrations increased progressively at both 3 and 6 months (Bonferroni-adjusted p < 0.05; Figure 3e). In contrast, betaine and choline concentrations remained stable (p > 0.05; Figures 3c, d). The details of the statistical analysis are available in the Supplementary Material.
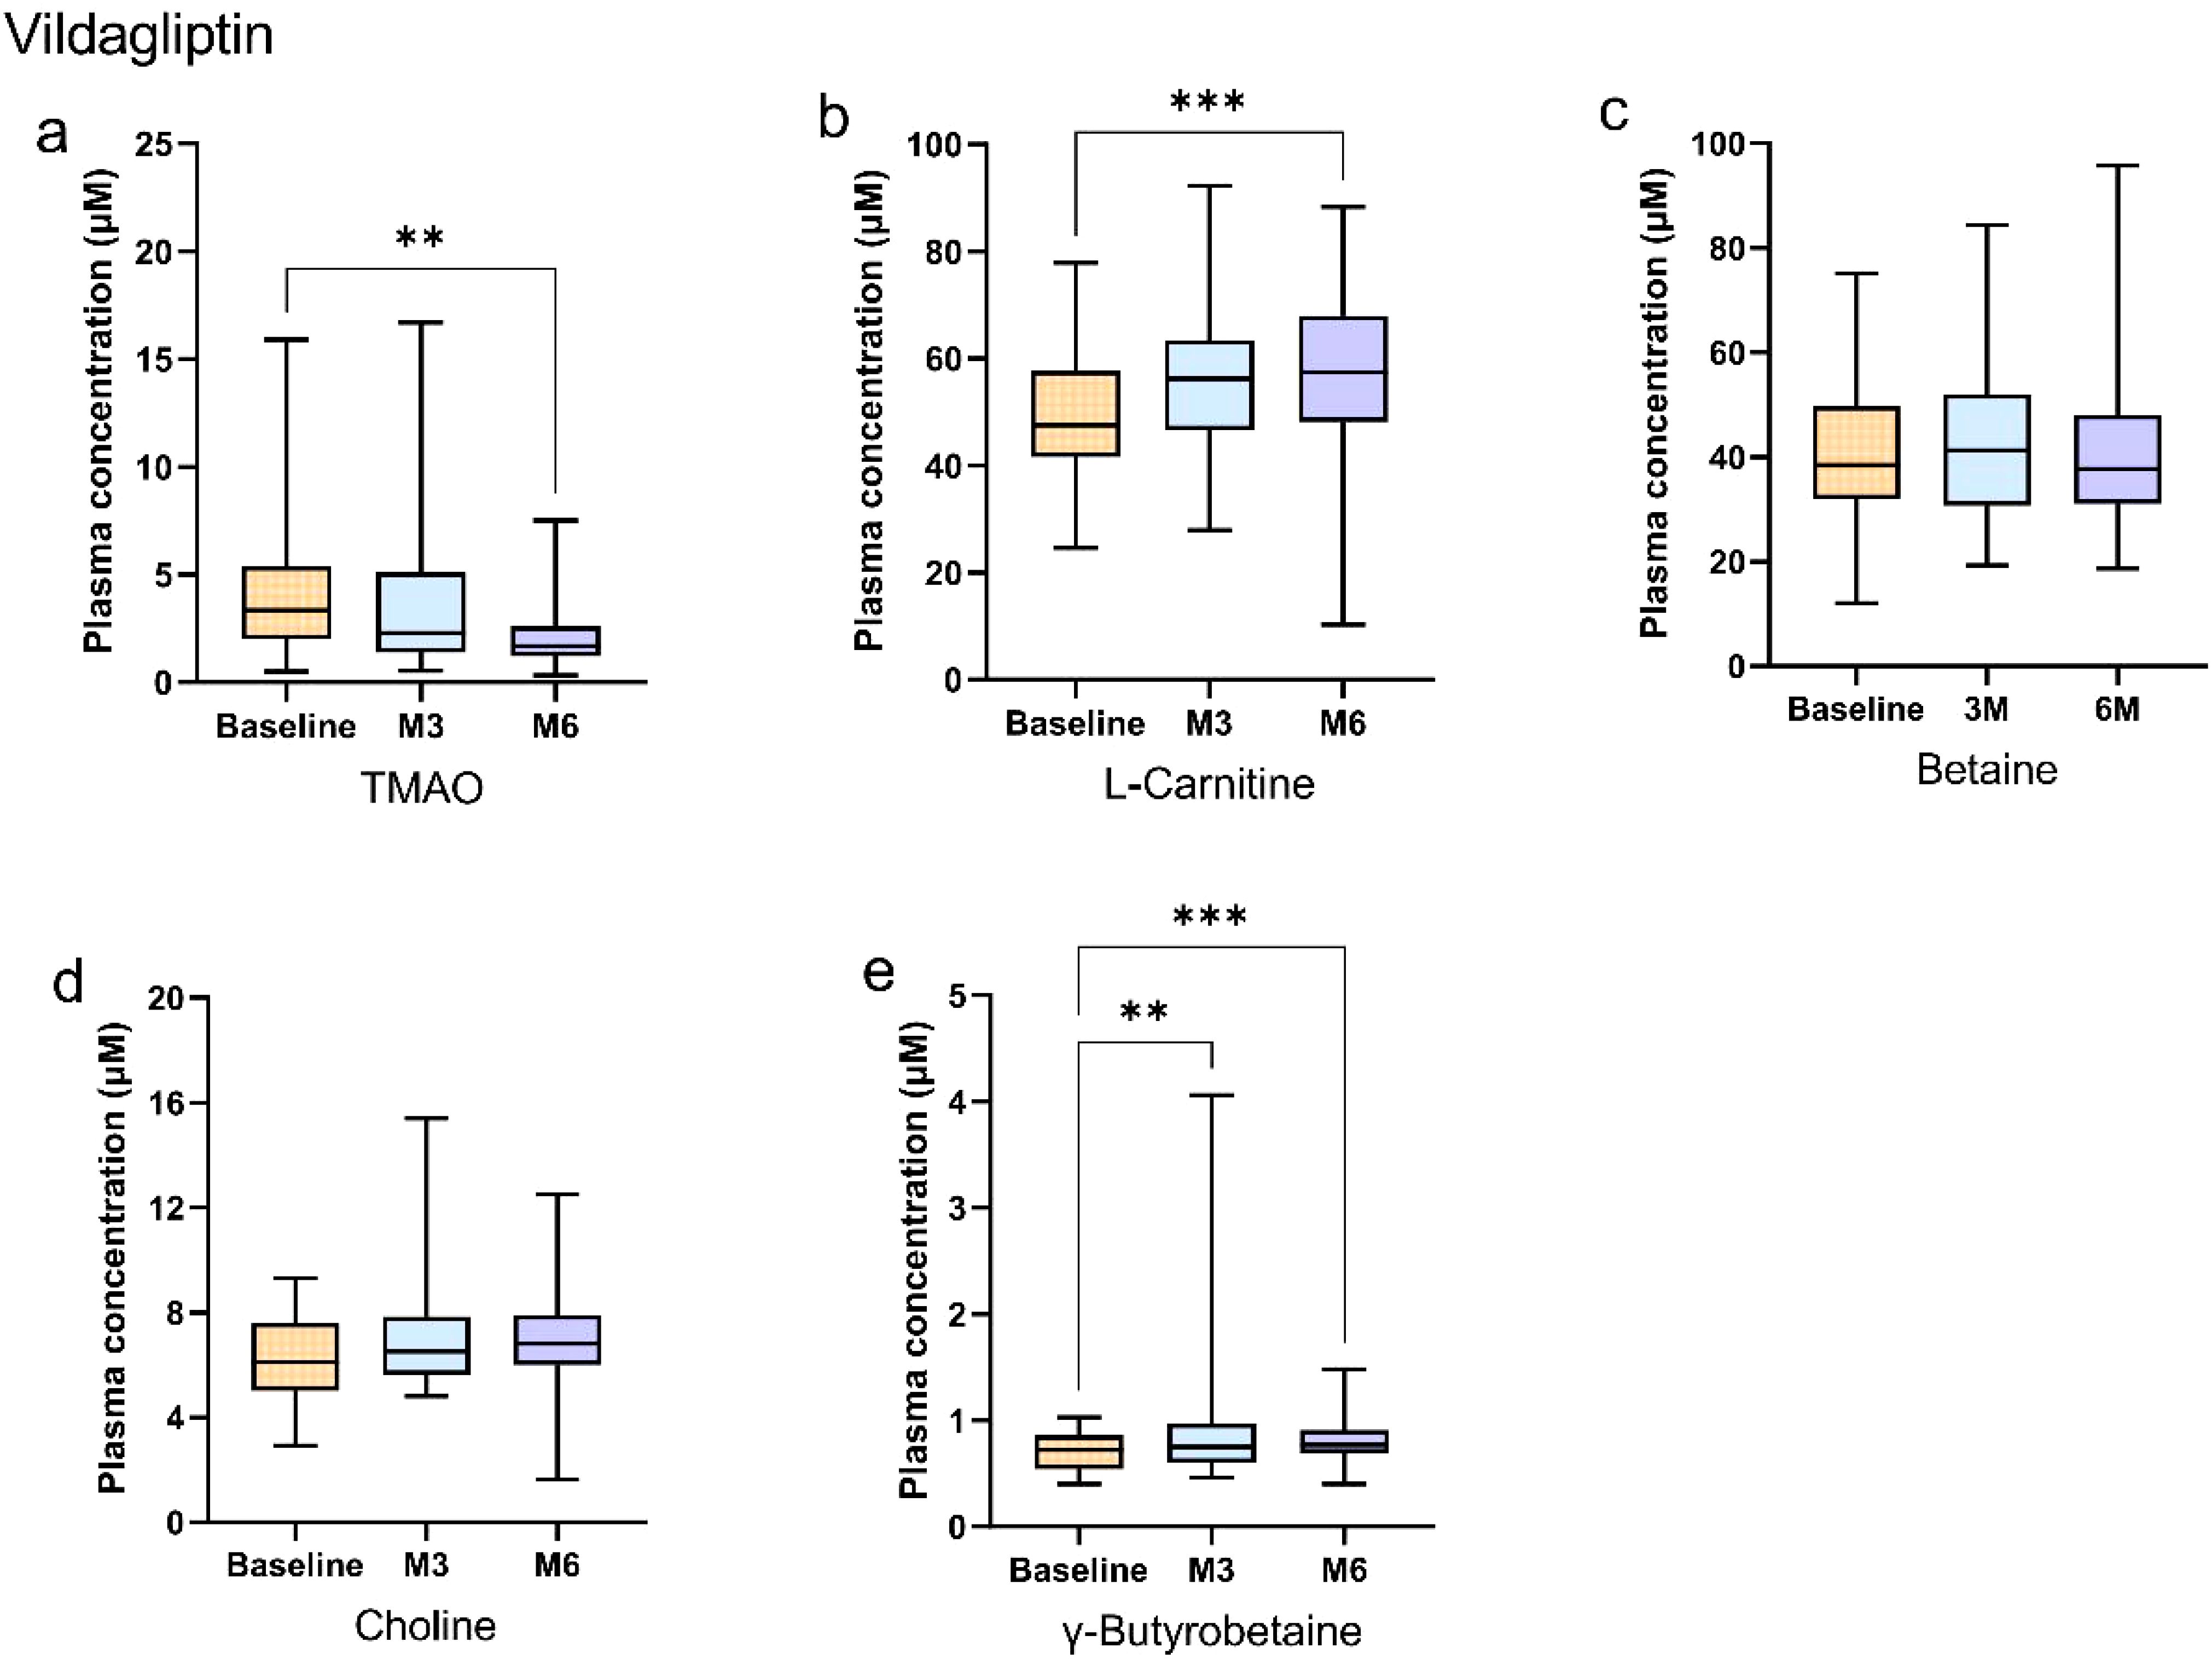
Figure 3. Longitudinal changes in plasma gut microbiota metabolites during vildagliptin treatment in newly diagnosed type 2 diabetes patients. (a–e) Box plots show longitudinal changes in plasma concentrations of (a) trimethylamine N-oxide (TMAO), (b) L-carnitine, (c) betaine, (d) choline, and (e) γ-butyrobetaine at baseline (orange), 3 months (blue), and 6 months (purple). Statistical analysis was performed using the Friedman test (non-parametric repeated measures) followed by Dunn’s post hoc test with Bonferroni correction for pairwise comparisons. Significance levels: *Bonferroni-adjusted p<0.05; **adjusted p<0.01; ***adjusted p<0.001; ****adjusted p<0.0001. Data are presented as median (25th, 75th). Detailed data are presented in Supplementary Tables 1, 2.
3.3 Association of changes in gut microbiota metabolites with glucose metabolic characteristics
In our prior study, both acarbose and vildagliptin demonstrated significant improvements in glycemic control, lipid profiles, and blood pressure in newly diagnosed type 2 diabetes patients after 6 months of intervention (28). Building on these findings, we investigated correlations between gut microbial metabolites and glucose metabolic variables in the current work.
Spearman bivariate correlation analysis at 6 months demonstrated significant associations in the acarbose group. ΔTMAO correlated positively with changes in BMI (r = 0.323), waist circumference (r = 0.423), PPG (r = 0.338), Fins (r = 0.436), fasting C-peptide (r = 0.328), HOMA-IR (r = 0.484), and leptin (r = 0.396) (p < 0.05). ΔBetaine correlated with Δghrelin (r = 0.524, p < 0.001), and both ΔL-carnitine and Δγ-butyrobetaine correlated with Δfasting C-peptide (r = 0.319, p = 0.037; r = 0.360, p = 0.017; Figure 4, Supplementary Table 3).
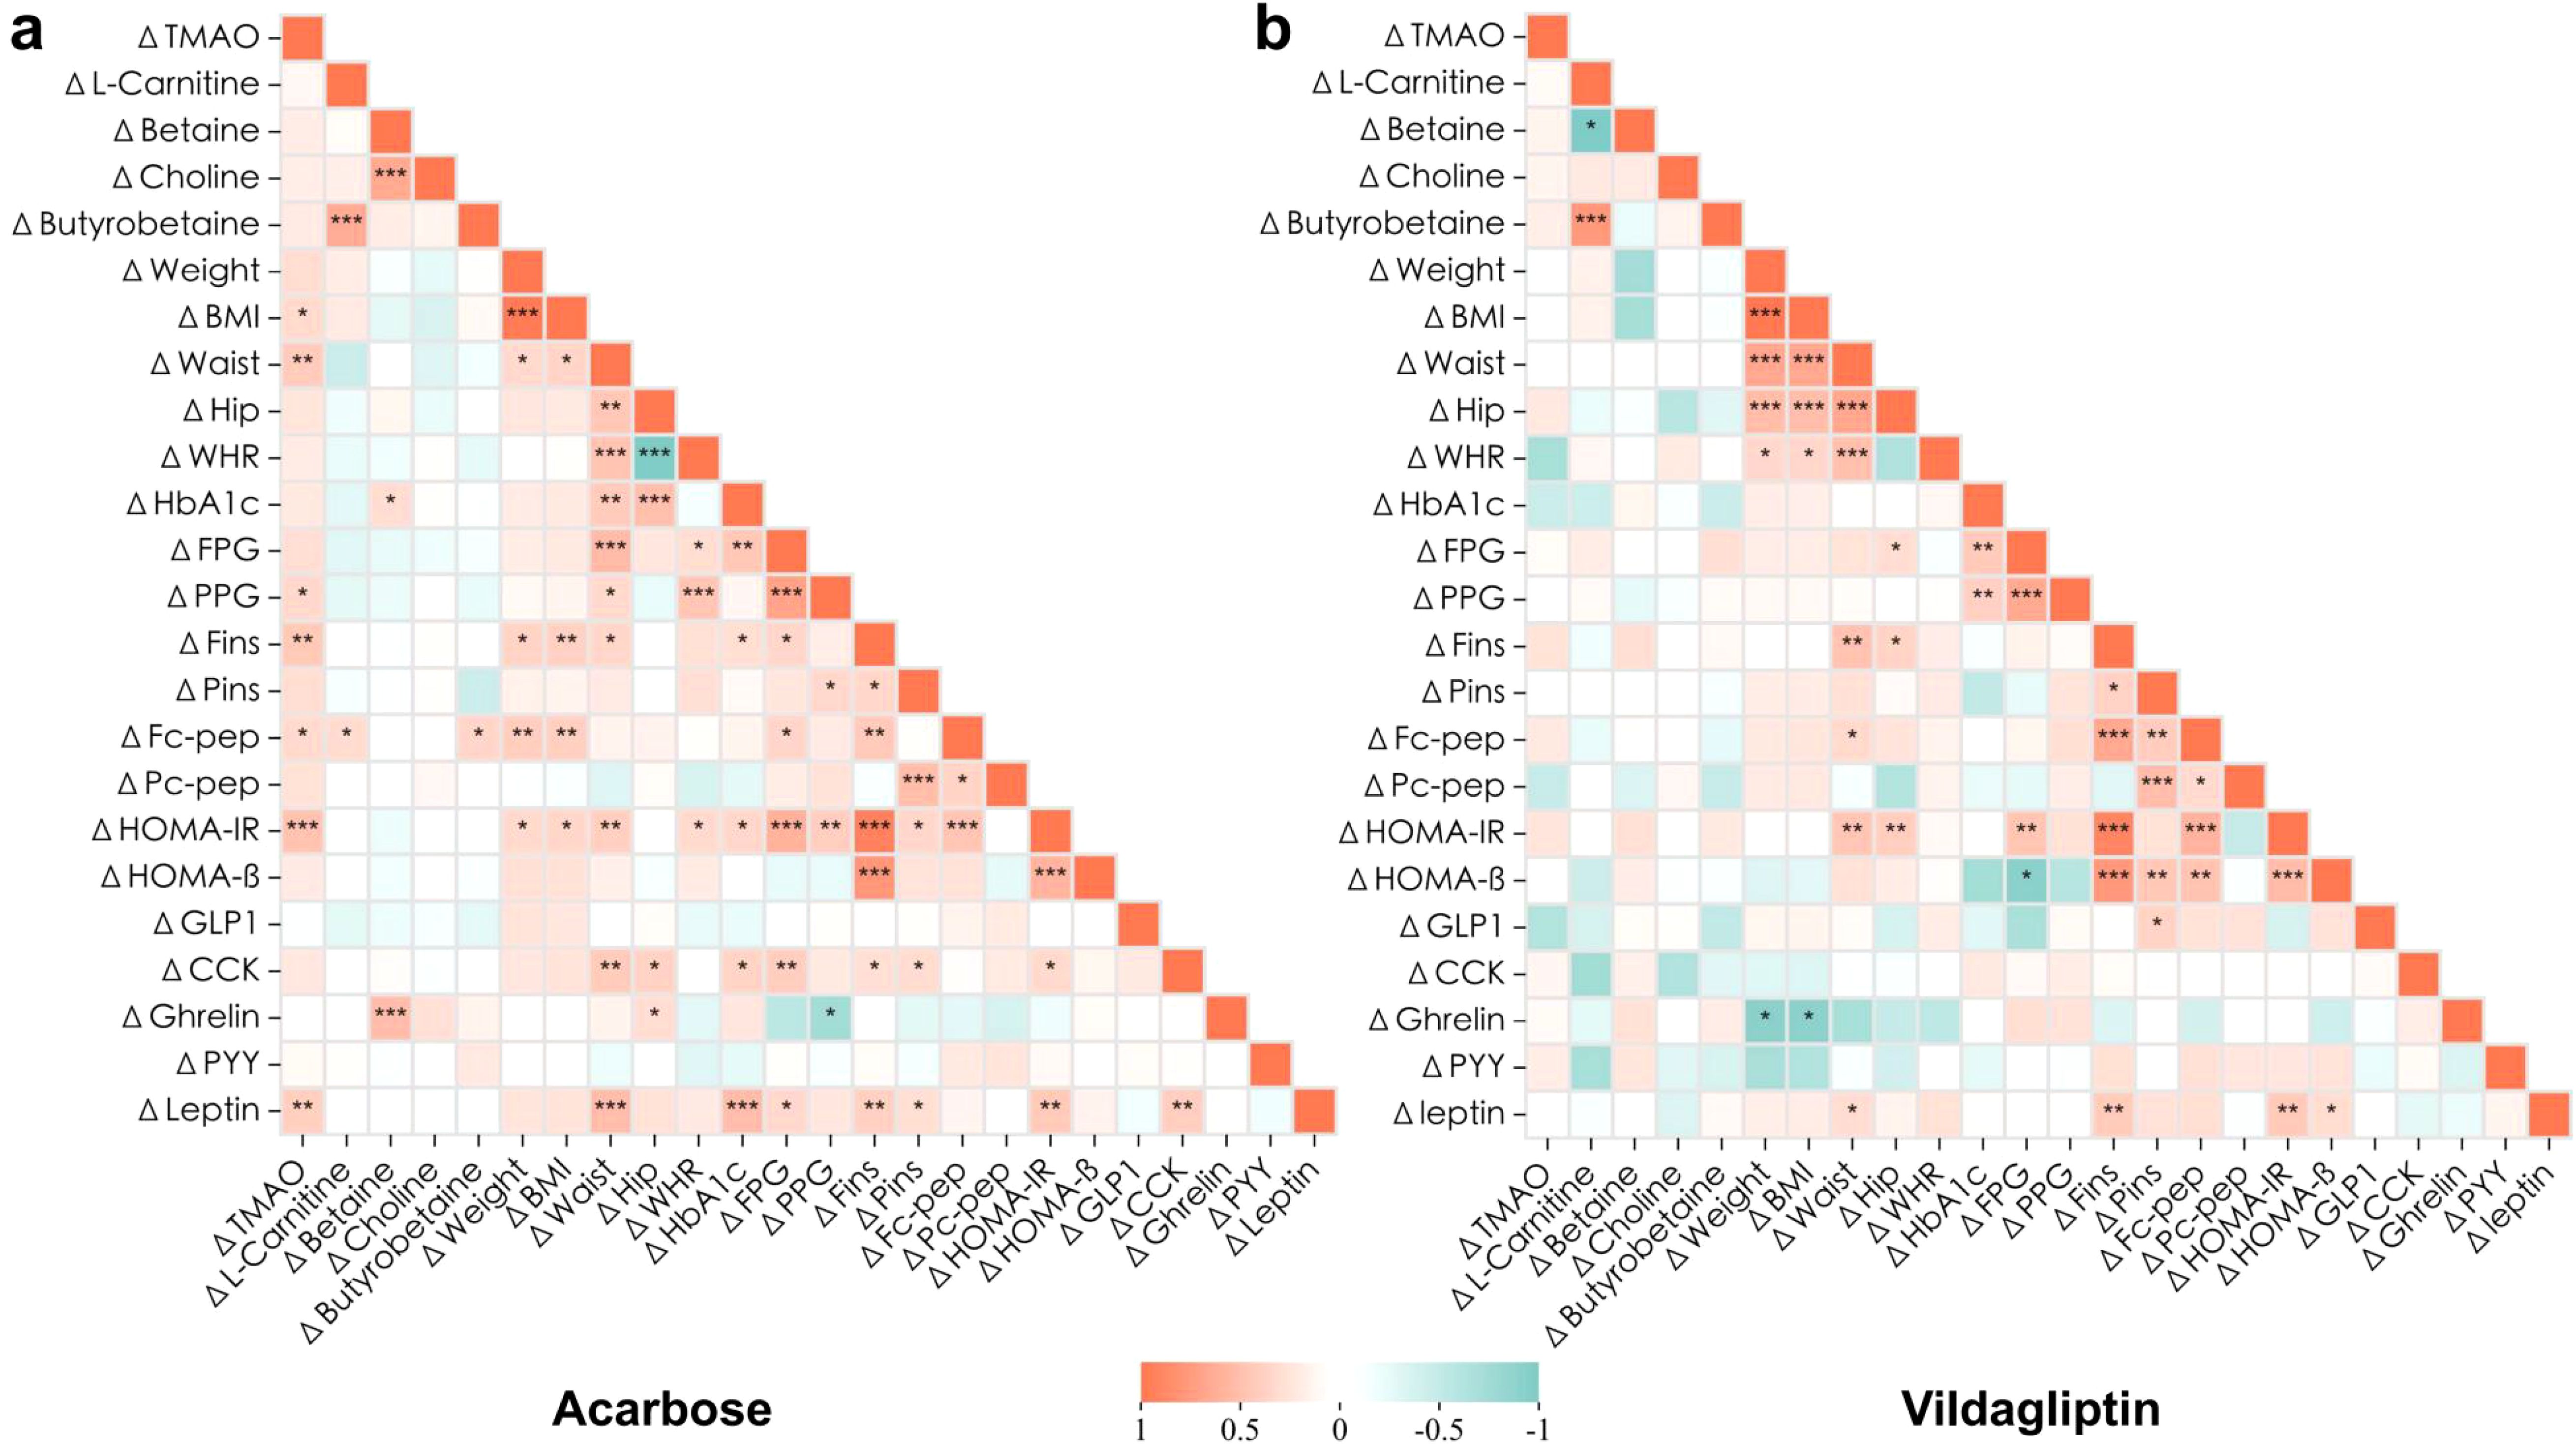
Figure 4. Association of changes in the clinical metabolic characteristics and plasma levels of gut microbiota metabolites after 6-month intervention. Heatmaps resulting from Spearman rank correlation coefficients (Spearman’s rho) of the changes () of each variable to its baseline with consistent responses to 6-month acarbose (a) or vildagliptin (b) treatment. *p<0.05, **p<0.01, ***p<0.001. Red and green indicate that the two variables are positively and negatively correlated, respectively. Detailed statistical data are presented in Supplementary Table 3.
By contrast, no significant correlations were observed between changes in gut microbiota metabolites and metabolic parameters in the vildagliptin group (p > 0.05). Notably, a strong positive correlation between ΔL-carnitine and Δγ-butyrobetaine was consistent across both groups (r = 0.644, p < 0.001; r = 0.771 p < 0.001; Figure 4, Supplementary Table 3), indicating coordinated regulation of these metabolites.
4 Discussion
Our RCT provides novel evidence that both acarbose and vildagliptin, two widely used oral antidiabetic agents, significantly reduce plasma TMAO levels in patients with newly diagnosed T2DM. These findings extend the previous work on gut microbiota remodeling by these agents (28) and align with emerging insights into microbial contributions toward diabetes-induced dysmetabolism (19). Specifically, both drugs attenuated the carnitine→γ-butyrobetaine→TMA metabolic axis, which implicates a shared downstream effect on TMAO synthesis despite distinct pharmacological mechanisms.
4.1 Gut microbiota-driven TMAO biosynthesis
The gut microbiota plays a central role in TMAO biosynthesis. Bioinformatics suggested that gut microbiota can convert carnitine, betaine, and choline to TMA, through the utilization of three TMA-lyase complexes, namely cntA/B, yeaW/X, and cutC/D (39). Choline, abundant in egg yolk and red meat (40), is predominantly metabolized by Lachnoclostridium and Intestinibacter (Firmicutes) via cutC/D, genera enriched in cardiometabolic disorders (39, 41). Active L-carnitine is mainly found in meat and dairy products (42). For L-carnitine catabolism, Proteobacteria (e.g., Escherichia and Shigella) directly cleave its C-N bond via cntA/B-encoded oxygenases in the cecum (43, 44), while Emergencia timonensis (Actinobacteria) employs an alternative pathway involving γ-butyrobetaine as a transient intermediate through uncharacterized oxidoreductases (45–47). Owing to the presence of the “enterohepatic axis”, TMA can be rapidly oxidized to TMAO by hepatic FMO3 and subsequently released into the circulation (8). In the present study, the observed reduction in TMAO and accumulation of L-carnitine and γ-butyrobetaine suggest that both acarbose and vildagliptin impede the metabolic pathway of carnitine → γ-butyrobetaine → TMA, albeit through distinct mechanisms. To elucidate the impact of these two drugs on the TMAO metabolic pathway, it is important to consider the complex interplay between pharmacological interventions and the gut microbiome.
4.2 Pharmacological modulation of the TMAO pathway
As a first-line α-glucosidase inhibitor (AGI), acarbose delays small intestinal carbohydrate absorption, thereby reducing postprandial hyperglycemia. Undigested carbohydrates reaching the colon undergo microbial fermentation, which reshapes the gut ecosystem (48, 49). This microbiota-dependent effect may underlie its therapeutic benefits in T2DM. In mice fed with either a high-starch or high-fiber diet, acarbose increased Bacteroidaceae and Bifidobacteriaceae while reducing Akkermansia muciniphila and Bacteroidales S24-7, accompanied by elevated SCFAs (25, 50). In humans, however, our prior work revealed host-specific divergence: 6-month acarbose treatment decreased gut microbial alpha diversity and Bacteroides species, but enriched Streptococcus (S. sanguinis, S. salivarius) and Bifidobacterium (28).
Vildagliptin, a DPP-4 inhibitor, enhances endogenous GLP-1 activity to improve glycemic control (51). While its glucose-lowering effects are partially microbiota-mediated, the specific taxonomic shifts differ across studies. In animal studies, sitagliptin increased Bacteroidetes abundance in mice fed a high-fat diet, correlating with improved glucose homeostasis (29). In contrast, our previous study yielded differing results: vildagliptin enriched Bifidobacterium adolescentis and Intestinibacter bartlettii, while reducing Paraprevotella spp., Parabacteroides distasonis and Bacteroides spp.(e.g. B. finegoldii, B. caccae) (28). Notably, a cross-sectional analysis observed a heightened abundance of these two Bacteroides species in treatment-naïve patients with T2DM as opposed to those with prediabetes or normal glucose tolerance (52), underscoring their role in diabetic dysbiosis.
Although these two drugs differ in their gastrointestinal mechanisms of glycemic control, our study indicates that they elicit comparable effects on the gut microbiota, particularly with respect to the proliferation of B. adolescentis and the reduction of several species belonging to the phylum Bacteroidetes (B. caccae and B. finegoldii). This overlap may explain their similar metabolic outcomes. Acarbose’s stronger TMAO-lowering effect could stem from its direct impact on microbial carbohydrate fermentation, which selectively depletes TMA-lyase-producing taxa. Conversely, vildagliptin’s milder effect might involve indirect GLP-1-mediated modulation of gut ecology. Crucially, baseline TMAO levels were comparable between groups, ruling out preexisting differences and emphasizing drug-induced microbial reprogramming.
4.3 Associations between TMAO and insulin resistance
After 6 months of treatment with acarbose, the blood glucose levels of participants were effectively controlled, including decreases in FPG, PPG, HbA1c and HOME-IR, with significant decreases in body weight and BMI (28). IR is defined as a state of decreased insulin sensitivity and/or responsiveness. This study, we used HOMA-IR to quantify the extent of IR in an individual and calculated it by combining the FPG and fin levels. A reduction in the HOMA-IR is typically indicative of enhanced insulin sensitivity. In the present study, we found a positive correlation between the changes in TMAO and PPG, Fin, fasting C-peptide, and HOMA-IR after 6-month acarbose treatment, suggesting a mechanistic interplay between gut microbiota-derived TMAO and IR.
Experimental studies corroborate these clinical observations. Dietary TMAO supplementation exacerbates impaired glucose tolerance in high-fat diet-fed mice by disrupting hepatic insulin signaling and inducing adipose tissue inflammation, thereby elevating HOMA-IR indices (53). FMO3 is an enzyme expressed primarily in the liver and catalyzes the conversion of TMA to TMAO (8). In vitro studies have confirmed that FMO3 is repressed by insulin; however, its expression is increased in obese and insulin-resistant male mice, mirroring a similar increase observed in humans. Notably, the experimental suppression of FMO3 in insulin-resistant mice effectively inhibited FoxO1, a key metabolic regulatory node, and completely circumvented the progression of hyperglycemia, hyperlipidemia, and atherosclerosis (54). In parallel with these findings, another mouse study revealed a sophisticated mechanism through which TMAO exacerbates metabolic dysfunction. This study indicates that TMAO binds to and activates the endoplasmic reticulum stress kinase PERK (EIF2AK3), thereby triggering the transcription factor FoxO1 in a PERK-dependent cascade. This signaling pathway culminates in metabolic impairment. Interventions targeting TMAO reduction, whether via microbiota modulation or FMO3 inhibition, downregulate PERK-FoxO1 signaling, thereby ameliorating metabolic dysfunction (16). These findings collectively implicate TMAO as a mediator of IR through multiple pathways, yet key questions remain unresolved. Whether TMAO reduction directly enhances insulin sensitivity or merely reflects acarbose-induced microbiota remodeling requires causal validation through fecal microbiota transplantation studies.
Thus, based on the results of the present study, we clarify that both acarbose and vildagliptin treatments significantly reduced TMAO levels in newly diagnosed T2DM patients, with a more pronounced reduction observed in the acarbose group. Furthermore, the decline in TMAO levels demonstrated a significant association with improvements in insulin resistance parameters.
Our study also has several strengths. Primarily, this two-arm RCT employed stringent inclusion criteria and meticulous follow-up protocols, ensuring high-quality data collection. Additionally, we comprehensively investigated TMAO dynamics by analyzing not only TMAO itself but also its four key precursors (L-carnitine, betaine, choline, and γ-butyrobetaine), an approach rarely adopted in prior studies. Third, by leveraging longitudinal blood sampling, this work represents the first exploration of acarbose and vildagliptin effects on TMAO metabolism in a Chinese T2DM population, enhancing the translational relevance of our findings.
Despite these advances, there are some limitations. First, as an exploratory RCT designed to investigate gut microbiota-mediated mechanisms, the sample size (n = 50/group) was determined based on prior studies, rather than a formal power analysis. While this design aligns with the exploratory nature of our hypothesis-generating objectives, future trials with larger cohorts are needed to validate these findings and assess subgroup-specific effects. Second, although our 6-month data demonstrate progressive TMAO reduction, the study duration may not represent the optimal therapeutic window. The long-term efficacy of glucose-lowering drugs on TMAO dynamics—including whether suppression stabilizes or continues to decline—remains unknown. Future trials should extend follow-up to 9–12 months to clarify the durability of TMAO reduction and its relationship to glycemic control and cardiovascular outcomes. Third, while microbial shifts correlated with TMAO reduction, our analysis did not pinpoint specific taxa responsible for TMAO metabolism (e.g., cntA/B- or cutC/D-harboring bacteria) or establish causality. Mechanistic validation through animal studies, fecal microbiota transplantation (FMT), or targeted metagenomic sequencing of TMA-lyase genes is essential to confirm these associations.
Data availability statement
The raw data supporting the conclusions of this article will be made available by the authors, without undue reservation.
Ethics statement
This study was approved by the Ethics Committee of the Peking University Health Science Center (2015PHB175-01) and was conducted in compliance with the Declaration of Helsinki. The studies were conducted in accordance with the local legislation and institutional requirements. The participants provided their written informed consent to participate in this study.
Author contributions
XY: Data curation, Writing – original draft, Writing – review & editing. XZ: Conceptualization, Data curation, Methodology, Writing – original draft. CS: Data curation, Writing – original draft, Writing – review & editing. CZ: Project administration, Supervision, Writing – review & editing. XK: Data curation, Writing – review & editing. MZ: Formal Analysis, Writing – review & editing. LJ: Resources, Writing – review & editing. YL: Project administration, Resources, Supervision, Writing – review & editing.
Funding
The author(s) declare that financial support was received for the research and/or publication of this article. This work was supported by the Beijing Natural Science Foundation (grant number: 7222238).
Acknowledgments
We thank the research teams from the endocrinology and metabolic departments of Beijing Pinggu Hospital, Peking University People’s Hospital, and Peking University Third Hospital for their contributions to the clinical trial and data collection.
Conflict of interest
The authors declare that the research was conducted in the absence of any commercial or financial relationships that could be construed as a potential conflict of interest.
Generative AI statement
The author(s) declare that no Generative AI was used in the creation of this manuscript.
Publisher’s note
All claims expressed in this article are solely those of the authors and do not necessarily represent those of their affiliated organizations, or those of the publisher, the editors and the reviewers. Any product that may be evaluated in this article, or claim that may be made by its manufacturer, is not guaranteed or endorsed by the publisher.
Supplementary material
The Supplementary Material for this article can be found online at: https://www.frontiersin.org/articles/10.3389/fendo.2025.1575087/full#supplementary-material
References
1. Sacks DB, Arnold M, Bakris GL, Bruns DE, Horvath AR, Lernmark Å, et al. Guidelines and recommendations for laboratory analysis in the diagnosis and management of diabetes mellitus. Diabetes Care. (2023) 46:e151–e99. doi: 10.2337/dci23-0036
2. ElSayed NA, McCoy RG, Aleppo G, Balapattabi K, Beverly EA, Briggs Early K, et al. 2. Diagnosis and classification of diabetes: standards of care in diabetes—2025. Diabetes Care. (2025) 48:S27–49. doi: 10.2337/dc25-S002
3. Zhou B, Rayner AW, Gregg EW, Sheffer KE, Carrillo-Larco RM, Bennett JE, et al. Worldwide trends in diabetes prevalence and treatment from 1990 to 2022: A pooled analysis of 1108 population-representative studies with 141 million participants. Lancet. (2024) 404:2077–93. doi: 10.1016/s0140-6736(24)02317-1
4. Sun H, Saeedi P, Karuranga S, Pinkepank M, Ogurtsova K, Duncan BB, et al. Idf diabetes atlas: global, regional and country-level diabetes prevalence estimates for 2021 and projections for 2045. Diabetes Res Clin Pract. (2022) 183:109119. doi: 10.1016/j.diabres.2021.109119
5. Ogurtsova K, Guariguata L, Barengo NC, Ruiz PL-D, Sacre JW, Karuranga S, et al. Idf diabetes atlas: global estimates of undiagnosed diabetes in adults for 2021. Diabetes Res Clin Pract. (2022) 183:109118. doi: 10.1016/j.diabres.2021.109118
6. Martinez L, Zahra T. Chronic complications of diabetes. EMJ Diabetes. (2022) 47(1):26–43. doi: 10.33590/emjdiabet/21-00180
7. Zhai LX, Wu JY, Lam YY, Kwan HY, Bian ZX, Wong HLX. Gut-microbial metabolites, probiotics and their roles in type 2 diabetes. Int J Mol Sci. (2021) 22:19. doi: 10.3390/ijms222312846
8. Fennema D, Phillips IR, Shephard EA. Trimethylamine and trimethylamine-N-oxide, a flavin-containing monooxygenase 3 (Fmo3)-mediated host-microbiome metabolic axis implicated in health and disease. Drug Metab Dispos. (2016) 44:1839–50. doi: 10.1124/dmd.116.070615
9. Heianza Y, Ma WJ, DiDonato JA, Sun Q, Rimm EB, Hu FB, et al. Long-term changes in gut microbial metabolite trimethylamine N-oxide and coronary heart disease risk. J Am Coll Cardiol. (2020) 75:763–72. doi: 10.1016/j.jacc.2019.11.060
10. Yao ME, Liao PD, Zhao XJ, Wang L. Trimethylamine-N-oxide has prognostic value in coronary heart disease: A meta-analysis and dose-response analysis. BMC Cardiovasc Disord. (2020) 20:9. doi: 10.1186/s12872-019-01310-5
11. Heianza Y, Sun DJY, Li X, DiDonato JA, Bray GA, Sacks FM, et al. Gut microbiota metabolites, amino acid metabolites and improvements in insulin sensitivity and glucose metabolism: the pounds lost trial. Gut. (2019) 68:263–70. doi: 10.1136/gutjnl-2018-316155
12. Dambrova M, Latkovskis G, Kuka J, Strele I, Konrade I, Grinberga S, et al. Diabetes is associated with higher trimethylamine N-oxide plasma levels. Exp Clin Endocrinol Diabetes. (2016) 124:251–6. doi: 10.1055/s-0035-1569330
13. Zhilei S, Taoping S, Hao H, Sijing C, Liangkai C, Cheng L, et al. Association between microbiota-dependent metabolite trimethylamine-N-oxide and type 2 diabetes. Am J Clin Nutr. (2017) 106:888–94. doi: 10.3945/ajcn.117.157107
14. Zhuang RL, Ge XY, Han L, Yu P, Gong X, Meng QS, et al. Gut microbe-generated metabolite trimethylamine-N-oxide and the risk of diabetes: A systematic review and dose-response meta-analysis. Obes Rev. (2019) 20:883–94. doi: 10.1111/obr.12843
15. Li SY, Chen S, Lu XT, Fang AP, Chen YM, Huang RZ, et al. Serum trimethylamine-N-oxide is associated with incident type 2 diabetes in middle-aged and older adults: A prospective cohort study. J Transl Med. (2022) 20:10. doi: 10.1186/s12967-022-03581-7
16. Chen SF, Henderson A, Petriello MC, Romano KA, Gearing M, Miao J, et al. Trimethylamine N-oxide binds and activates perk to promote metabolic dysfunction. Cell Metab. (2019) 30:1141–51. doi: 10.1016/j.cmet.2019.08.021
17. Ding L, Chang M, Guo Y, Zhang L, Xue C, Yanagita T, et al. Trimethylamine-N-oxide (Tmao)-induced atherosclerosis is associated with bile acid metabolism. Lipids Health Dis. (2018) 17(1):286. doi: 10.1186/s12944-018-0939-6
18. Chávez-Talavera O, Tailleux A, Lefebvre P, Staels B. Bile acid control of metabolism and inflammation in obesity, type 2 diabetes, dyslipidemia, and nonalcoholic fatty liver disease. Gastroenterology. (2017) 152:1679–94.e3. doi: 10.1053/j.gastro.2017.01.055
19. Yuliang H, Yani W, Yao Z, He B, Ruiheng P, Wenli R, et al. Dynamic changes in gut microbiota-derived metabolite trimethylamine-N-oxide and risk of type 2 diabetes mellitus: potential for dietary changes in diabetes prevention. Nutrients. (2024) 16:1711. doi: 10.3390/nu16111711
20. Huo L, Li H, Zhu M, Liu Y, Ren L, Hu J, et al. Enhanced trimethylamine metabolism and gut dysbiosis in type 2 diabetes mellitus with microalbumin. Front Endocrinol. (2023) 14:1257457. doi: 10.3389/fendo.2023.1257457
21. Yu P-S, Wu P-H, Hung W-W, Lin M-Y, Zhen Y-Y, Hung W-C, et al. Association between trimethylamine N-oxide and adverse kidney outcomes and overall mortality in type 2 diabetes mellitus. J Clin Endocrinol Metab. (2024) 109:2097–105. doi: 10.1210/clinem/dgae009
22. Whang A, Nagpal R, Yadav H. Bi-directional drug-microbiome interactions of anti-diabetics. EBioMedicine. (2019) 39:591–602. doi: 10.1016/j.ebiom.2018.11.046
23. Ding QY, Tian JX, Li M, Lian FM, Zhao LH, Wei X-, et al. Interactions between therapeutics for metabolic disease, cardiovascular risk factors, and gut microbiota. Front Cell Infection Microbiol. (2020) 10:530160. doi: 10.3389/fcimb.2020.530160
24. Ren H, Shi Z, Yang F, Wang S, Yuan F, Li T, et al. Deciphering unique and shared interactions between the human gut microbiota and oral antidiabetic drugs. iMeta. (2024) 3(2):e179. doi: 10.1002/imt2.179
25. Baxter NT, Lesniak NA, Sinani H, Schloss PD, Koropatkin NM. The glucoamylase inhibitor acarbose has a diet-dependent and reversible effect on the murine gut microbiome. mSphere. (2019) 4:12. doi: 10.1128/mSphere.00528-18
26. Li X, Zheng S, Xu H, Zhang Z, Han X, Wei Y, et al. The direct and indirect inhibition of proinflammatory adipose tissue macrophages by acarbose in diet-induced obesity. Cell Rep Med. (2025) 6(1):101883. doi: 10.1016/j.xcrm.2024.101883
27. Zhang XY FZ, Zhang C, Xia H, Jie Z, Han X, Chen Y, et al. Effects of acarbose on the gut microbiota of prediabetic patients: A randomized, double-blind, controlled crossover trial. Diabetes Ther. (2017) 8:293–307. doi: 10.1007/s13300-017-0226-y
28. Zhang XY, Ren H, Zhao C, Shi Z, Qiu L, Yang F, et al. Metagenomic analysis reveals crosstalk between gut microbiota and glucose-lowering drugs targeting the gastrointestinal tract in chinese patients with type 2 diabetes: A 6 month, two-arm randomised trial. Diabetologia. (2022) 65:1613–26. doi: 10.1007/s00125-022-05768-5
29. Liao XY, Song LY, Zeng BH, Liu BY, Qiu YY, Qu H, et al. Alteration of gut microbiota induced by dpp-4i treatment improves glucose homeostasis. EBioMedicine. (2019) 44:665–74. doi: 10.1016/j.ebiom.2019.03.057
30. Zhang T. The effects of economic development and built environment on diabetes in China. Population Health Metrics. (2017) 15(1):35. doi: 10.1186/s12963-017-0152-2
31. Sinclair A, Dunning T, Rodriguez-Mañas L. Diabetes in older people: new insights and remaining challenges. Lancet Diabetes Endocrinol. (2015) 3:275–85. doi: 10.1016/s2213-8587(14)70176-7
32. Alberti K, Zimmet PZ, Consultation WHO. Definition, diagnosis and classification of diabetes mellitus and its complications part 1: diagnosis and classification of diabetes mellitus - provisional report of a who consultation. Diabetic Med. (1998) 15:539–53. doi: 10.1002/(sici)1096-9136(199807)15:7<539::Aid-dia668>3.0.Co;2-s
33. Chen C, Lu FC. The guidelines for prevention and control of overweight and obesity in chinese adults. Biomed Environ sciences: BES. (2004) 17 Suppl:1–36.
34. Society CD. China T2dm prevention and treatment guideline (2013). Chin J Diabetes. (2014) 22(08):2–42.
35. Wu H, Esteve E, Tremaroli V, Khan MT, Caesar R, Mannerås-Holm L, et al. Metformin alters the gut microbiome of individuals with treatment-naive type 2 diabetes, contributing to the therapeutic effects of the drug. Nat Med. (2017) 23:850. doi: 10.1038/nm.4345
36. Gu YY, Wang XK, Li JH, Zhang YF, Zhong HZ, Liu RX, et al. Analyses of gut microbiota and plasma bile acids enable stratification of patients for antidiabetic treatment. Nat Commun. (2017) 8:12. doi: 10.1038/s41467-017-01682-2
37. Sun LL, Xie C, Wang G, Wu Y, Wu Q, Wang XM, et al. Gut microbiota and intestinal fxr mediate the clinical benefits of metformin. Nat Med. (2018) 24:1919. doi: 10.1038/s41591-018-0222-4
38. Zhao MM, Zhao L, Xiong XL, He Y, Huang W, Liu ZH, et al. Tmava, a metabolite of intestinal microbes, is increased in plasma from patients with liver steatosis, inhibits Γ-butyrobetaine hydroxylase, and exacerbates fatty liver in mice. Gastroenterology. (2020) 158:2266. doi: 10.1053/j.gastro.2020.02.033
39. Craciun S, Balskus EP. Microbial conversion of choline to trimethylamine requires a glycyl radical enzyme. Proc Natl Acad Sci. (2012) 109:21307–12. doi: 10.1073/pnas.1215689109
40. Zeisel SH, Mar MH, Howe JC, Holden JM. Concentrations of choline-containing compounds and betaine in common foods. J Nutr. (2003) 133:1302–7. doi: 10.1093/jn/133.5.1302
41. Cai YY, Huang FQ, Lao XZ, Lu YW, Gao XJ, Alolga RN, et al. Integrated metagenomics identifies a crucial role for trimethylamine-producing lachnoclostridium in promoting atherosclerosis. NPJ Biofilms Microbomes. (2022) 8:1. doi: 10.1038/s41522-022-00303-1
42. Meadows JA, Wargo MJ. Carnitine in bacterial physiology and metabolism. Microbiology-(UK). (2015) 161:1161–74. doi: 10.1099/mic.0.000080
43. Zhu YJ, Jameson E, Crosatti M, Schäfer H, Rajakumar K, Bugg TDH, et al. Carnitine metabolism to trimethylamine by an unusual rieske-type oxygenase from human microbiota. Proc Natl Acad Sci U S A. (2014) 111:4268–73. doi: 10.1073/pnas.1316569111
44. Koeth RA, Wang ZE, Levison BS, Buffa JA, Org E, Sheehy BT, et al. Intestinal microbiota metabolism of L-carnitine, a nutrient in red meat, promotes atherosclerosis. Nat Med. (2013) 19:576–85. doi: 10.1038/nm.3145
45. Koeth RA, Levison BS, Culley MK, Buffa JA, Wang ZN, Gregory JC, et al. Γ-butyrobetaine is a proatherogenic intermediate in gut microbial metabolism of L-carnitine to tmao. Cell Metab. (2014) 20:799–812. doi: 10.1016/j.cmet.2014.10.006
46. Rajakovich LJ, Fu B, Bollenbach M, Balskus EP. Elucidation of an anaerobic pathway for metabolism of L-carnitine-derived Γ-butyrobetaine to trimethylamine in human gut bacteria. Proc Natl Acad Sci U S A. (2021) 118:11. doi: 10.1073/pnas.2101498118
47. Buffa JA, Romano KA, Copeland MF, Cody DB, Zhu WF, Galvez R, et al. The microbial gbu gene cluster links cardiovascular disease risk associated with red meat consumption to microbiota L-carnitine catabolism. Nat Microbiol. (2022) 7:73. doi: 10.1038/s41564-021-01010-x
48. Liu ZY, Ma ST. Recent advances in synthetic -glucosidase inhibitors. ChemMedChem. (2017) 12:819–29. doi: 10.1002/cmdc.201700216
49. Chen YX, Wang MA. New insights of anti-hyperglycemic agents and traditional chinese medicine on gut microbiota in type 2 diabetes. Drug Des Dev Ther. (2021) 15:4849–63. doi: 10.2147/dddt.S334325
50. Smith BJ, Miller RA, Ericsson AC, Harrison DC, Strong R, Schmidt TM. Changes in the gut microbiome and fermentation products concurrent with enhanced longevity in acarbose-treated mice. BMC Microbiol. (2019) 19:16. doi: 10.1186/s12866-019-1494-7
51. Deacon CF. Dipeptidyl peptidase 4 inhibitors in the treatment of type 2 diabetes mellitus. Nat Rev Endocrinol. (2020) 16:642–53. doi: 10.1038/s41574-020-0399-8
52. Zhong HZ, Ren HH, Lu Y, Fang C, Hou GX, Yang ZY, et al. Distinct gut metagenomics and metaproteomics signatures in prediabetics and treatment-naive type 2 diabetics. EBioMedicine. (2019) 47:373–83. doi: 10.1016/j.ebiom.2019.08.048
53. Gao X, Liu XF, Xu J, Xue CH, Xue Y, Wang YM. Dietary trimethylamine N-oxide exacerbates impaired glucose tolerance in mice fed a high fat diet. J Biosci Bioeng. (2014) 118:476–81. doi: 10.1016/j.jbiosc.2014.03.001
Keywords: oral antidiabetic drugs, type 2 diabetes mellitus, trimethylamine N-oxide, randomized controlled trial, gut microbiota-derived metabolites
Citation: Yang X, Zhang X, Sun C, Zhao C, Kong X, Zhao M, Ji L and Li Y (2025) Effect of acarbose and vildagliptin on plasma trimethylamine N-oxide levels in patients with type 2 diabetes mellitus: a 6-month, two-arm randomized controlled trial. Front. Endocrinol. 16:1575087. doi: 10.3389/fendo.2025.1575087
Received: 11 February 2025; Accepted: 07 April 2025;
Published: 06 May 2025.
Edited by:
Nazarii Kobyliak, Bogomolets National Medical University, UkraineReviewed by:
Neha Saboo, RUHS College of Medical Sciences, IndiaYushan Li, The Affiliated Hospital of Qingdao University, China
Chimakurthy Jithendra, Vignan’s Foundation for Science, Technology and Research, India
Copyright © 2025 Yang, Zhang, Sun, Zhao, Kong, Zhao, Ji and Li. This is an open-access article distributed under the terms of the Creative Commons Attribution License (CC BY). The use, distribution or reproduction in other forums is permitted, provided the original author(s) and the copyright owner(s) are credited and that the original publication in this journal is cited, in accordance with accepted academic practice. No use, distribution or reproduction is permitted which does not comply with these terms.
*Correspondence: Mingming Zhao, emhhb21pbmdtaW5nQHBrdS5lZHUuY24=; Linong Ji, amlsbkBiam11LmVkdS5jbg==; Yufeng Li, ZG9jdG9ybHlmQDEyNi5jb20=
†These authors have contributed equally to this work and share first authorship
‡ORCID: Yufeng Li, orcid.org/0000-0003-3403-9539