 Zhen Tan
 Yijun Liu1†
 Xiaoping Li
 Hongqiang Ren
- 1Department of Cardiology, Suining Central Hospital, Suining, Sichuan, China
- 2Department of Cardiology, Sichuan Provincial People’s Hospital, University of Electronic Science and Technology of China, Chengdu, Sichuan, China
Background: Estimated glucose disposal rate (eGDR) was a novel non-insulin-based marker of insulin resistance (IR), which had been used in many studies to evaluate the clinical prognosis of diabetes. However, the association of eGDR with atrial fibrillation (AF), heart failure (HF) and cardiovascular mortality in patients with diabetes remains unclear.
Methods: The study utilized UK Biobank data from 31,733 participants. Kaplan-Meier curves and Log-rank tests assessed AF, HF, and cardiovascular mortality incidence. Multivariate Cox models and restricted cubic splines analyzed the associations of eGDR with these outcomes. Polygenic Risk Score (PRS) analysis evaluated the joint effects of eGDR and PRS. Boruta algorithm filtered key predictive variables. Subgroup analysis was performed using cardiovascular high-risk factors, and mediation analysis explored the relationships of eGDR with the outcomes.
Results: Subjects with higher eGDR were more likely to be female, younger, more physically active, non-smoker, and non-drinker. The cumulative incidence of AF, HF, and cardiovascular mortality in the higher quartiles of GDR were significantly lower than those in the lowest quartile (log-rank P < 0.001 for all). eGDR exhibited an independent negative linear correlation with the risk of AF (HR = 0.94, 95% CI: 0.91-0.96), HF (HR = 0.78, 95% CI: 0.74-0.82), and cardiovascular mortality (HR = 0.86, 95% CI: 0.83-0.88) risk. eGDR made the most significant contribution to the predicted outcomes. In diabetic patients with high genetic susceptibility, high eGDR could reduce the risk of AF (HR = 0.68, 95% CI: 0.51-0.90), HF (HR = 0.43, 95% CI: 0.29-0.62), and cardiovascular mortality (HR = 0.30, 95% CI: 0.22-0.42). Mediation analysis demonstrated that 10.7%, 7.9%, and 10.3% of the relationship between eGDR and AF, HF, and cardiovascular mortality among individuals with diabetes were mediated by eGFR, respectively.
Conclusions: This study demonstrated that higher eGDR levels were associated with a decreased risk of AF, HF, and cardiovascular mortality. Therefore, eGDR may serve as a valuable tool for predicting the risk of AF, HF, and cardiovascular mortality in patients with diabetes.
Introduction
Diabetes, a chronic metabolic disorder characterized by persistently elevated blood glucose levels, has emerged as a significant global health burden, ranking among the leading causes of death and disability worldwide (1). Individuals with diabetes exhibit a markedly increased risk of cardiovascular disease (CVD), which encompasses myocardial infarction (MI), heart failure (HF), atrial fibrillation (AF), and cardiovascular mortality (2, 3). Identifying risk factors for CVD in diabetic patients is critical, prompting extensive research into various biomarkers that can assess CVD risk in both diabetic and non-diabetic populations (4–7).
The estimated glucose disposal rate (eGDR) is an index derived from waist circumference, hypertension, and glycated hemoglobin (HbA1c), used to evaluate the body’s capacity to process glucose (8). Notably, eGDR is closely linked to insulin resistance (IR), a key risk factor for CVD (9). IR not only underpins type 2 diabetes but also contributes to a cluster of metabolic abnormalities, including dyslipidemia, inflammation, and endothelial dysfunction, all of which drive the onset and progression of CVD (10). Consequently, eGDR has increasingly been utilized as a predictor of cardiovascular mortality risk (11–13). Traditional methods for assessing insulin sensitivity, such as the glucose clamp technique, are often complex, invasive, time-consuming, expensive, and require specialized equipment and trained personnel (14). In contrast, eGDR offers a simple, convenient, and cost-effective alternative, as it can be readily calculated using routinely available clinical parameters. This makes eGDR particularly suitable for routine clinical practice and large-scale epidemiological studies (15, 16).
Previous studies have demonstrated that eGDR is independently and negatively correlated with coronary artery disease severity, suggesting its potential utility in early identification and risk stratification of coronary heart disease patients, thereby improving prognosis (17). Similarly, eGDR has been shown to predict cardiovascular events and mortality in non-diabetic patients with chronic kidney disease (18). Additionally, eGDR has been associated with arterial stiffness and mortality in adults with non-alcoholic fatty liver disease (19). However, evidence regarding the association between eGDR and AF, HF, and cardiovascular mortality remains limited. Given that AF and HF represent two major cardiovascular complications of diabetes, elucidating their relationship with eGDR could provide novel insights into the pathophysiology of these conditions and inform more effective preventive and therapeutic strategies. Therefore, the aim of this study was to evaluate the association of eGDR with AF, HF, and cardiovascular mortality in patients with diabetes and to explore the underlying mechanisms.
Materials and methods
Study population
The UK Biobank (UKB) is a large-scale biomedical database and research resource and has collected an unprecedented amount of biological and medical data on 500,000 participants (229,041 males and 273,293 females) from UK. UKB has received approval from the North West Multi-centre Research Ethics Committee (MREC) as a Research Tissue Bank (RTB) approval. Therefore, researchers do not require separate ethical clearance and can operate under the RTB approval. Data from the UKB are accessible to researchers after receiving research approval from the UKB. This study was conducted under UKB licence (Application ID:106027).
This study sifted 36,126 participants who had evidence of diabetes at baseline, the inclusion criteria were as follows: (1) Hospital diagnosis records indicating diabetes. (2) HbA1c ≥ 6.5%. (3) Fasting glucose ≥ 7.0mmol/L. (4) Receipt of hypoglycemic treatment. Participants were excluded if they had missing data on waist circumference (WC), glycosylated hemoglobin (HbA1c), or a history of AF and HF. As a result, a total of 31,733 participants were included in the final analysis.
Data collection and definition
At recruitment, participants completed computerised questionnaires on lifestyle, baseline demographic, and medical history, including gender, age, race, education level, body mass index (BMI), WC, height, smoking status (never, former, and current), alcohol consumption status (never, former, and current), frequency of moderate physical activity (Never, < 3 times per day, ≥ 3 times per day), household income. Hypertension was defined as systolic blood pressure (SBP) ≥ 140 mmHg, diastolic blood pressure (DBP) ≥ 90 mmHg, a hospital diagnosis record, use of blood pressure medication, specialist diagnosis, drug reimbursement records, or self-reported information. Additional data collected included the use of aspirin, insulin, blood pressure medication, and cholesterol-lowering medication. Laboratory assessments included measurements of glycated hemoglobin (HbA1c), glucose (Glu), albumin (ALB), serum creatinine (Scr), uric acid (Ua), blood urea nitrogen (BUN), triglycerides (TG), total cholesterol (TC), high-density lipoprotein cholesterol (HDL-C), low-density lipoprotein cholesterol (LDL-C), estimated glomerular filtration rate (eGFR), and C-reactive protein (CRP).
The formula used to calculate the eGDR was as follows: eGDR=21.158 - [(0.09 × waist circumference (cm)] - [(3.407 × Hypertension (yes or no)] - [0.551 × HbA1c (%)] (15). Participants were categorized into four groups (Q1, Q2, Q3, Q4) based on eGDR level using the 25th, 50th, and 75th percentiles as cutoff points. The lowest quartile (Q1) served as the reference group.
Assessment of atrial fibrillation, heart failure and cardiovascular mortality
Hospital records linked to disease outcomes were obtained from the UK Biobank. The international statistical classification of diseases (ICD-10) was used to define the classification of diseases. The primary endpoints of this study were the diagnosis of AF (codes I48, I48.0-4, and I48.9), HF (codes I50, I13.0, I13.2, and I11.0) and cardiovascular death. Cardiovascular death was defined based on records as mortality caused by acute myocardial infarction (AMI), AF, HF, arrhythmia, cardiac surgery, or other cardiovascular-related causes. For this study, the hospital admission and death data were updated up to 19 December 2022, and thus the follow-up period was terminated on this date. The date of diagnosis was defined as the earliest day when the disease manifested. The follow-up duration was calculated as the time interval between the baseline survey date and the earliest occurrence among the disease diagnosis date, the death date, the loss-to-follow-up date, or the end of the follow-up period. During the follow-up period, cardiovascular mortality rates were computed for each quartile of eGDR.
Definition of polygenic risk score
Patients with missing Polygenic Risk Score (PRS) data were excluded from the analysis. Consequently, a total of 31,375 diabetic patients were included in the PRS analysis. Standard PRS for AF and CVD, available from the UK Biobank, has been previously published. The PRS was calculated as the weighted sum of the effect sizes of individual genetic variants multiplied by their allele dosages, using a Bayesian approach applied to meta-analyze summary statistics derived from genome-wide association study (GWAS) data (20). In this study, the PRS of AF and CVD were categorized into low genetic risk (quintile 1), intermediate genetic risk (quintile 2 to 4) and high genetic risk (quintile 5).
Statistical analysis
R software (version 4.3.0, Institute for Statistics and Mathematics, Vienna, Austria) was used for all analyses. Continuous variables were expressed as mean ± standard deviation, and if variables were normally distributed, analysis of variance (ANOVA) was performed to assess differences between groups. Otherwise, they were presented as Median or quartile M (P25, P75). Mann Whitney U test was used for comparison among quartiles. Categorical variables were expressed as frequency and percentage. Chi-square tests were conducted to compare proportions across groups. Missing values of covariates were handled using multiple imputation. The maximum proportion of missing values was 6.1%, with an average of 0.51%.
The cumulative incidence rate curves for AF, HF, and cardiovascular mortality were estimated using the Kaplan-Meier method and compared using the log-rank test across eGDR quartile groups. Three multivariate Cox proportional hazards regression models were constructed to evaluate the the association of eGDR with AF, HF and cardiovascular mortality in patients with diabetes. Model 1 was unadjusted; model 2 adjusted for age, gender, race, education level, BMI, smoking status, and alcohol consumption status. Model 3 included all variables from Model 2, and further adjusted for SBP, DBP, TG, TC, eGFR, UA, aspirin, cholesterol-lowering medication, blood pressure medication, and insulin use. Nonlinear correlations between eGDR and AF, HF and cardiovascular mortality were explored using a restricted cubic spline (RCS) curve based on Cox regression model.
To evaluate the joint effects of PRS on the association of eGDR with risk of AF, HF and cardiovascular mortality, analyses were stratified by genetic risk categories (low genetic risk, intermediate genetic risk and high genetic risk). Each genetic risk category was further divided into four groups (Q1, Q2, Q3, Q4) based on eGDR level using the 25th, 50th, and 75th percentiles as cutoff points individually. The association of eGDR with the risk of AF, HF, and cardiovascular mortality was analyzed using multivariate Cox proportional hazards regression Model 3.
Subgroup analyses were conducted for significant covariates (age, gender, BMI, education level, smoking status, and alcohol consumption status) to assess the effects of eGDR on the incidence of AF, HF, and cardiovascular mortality across several subgroups. We used the Random Forest-based Boruta`s algorithm for feature selection to filter out the variables that contribute most to prediction model by generating shadow features and comparing their importance. Mediation analysis was performed to investigate the mediating effects of eGDR on AF, HF, and cardiovascular mortality. Variables in Model 3 that exhibited substantial relationships with eGDR were selected as potential mediators. The percentage mediated was computed as indirect effect/(indirect+direct impact). A two-sided P values<0.05 indicated statistical significance.
Result
Demographic characteristics of the study participants
A total of 31,733 diabetes patients without AF and HF were included in this study from the UKB finally, and the patient selection process was shown in Figure 1. Demographic characteristics of the subjects according to the quartiles of eGDR were showed in Table 1. The average age of the subjects was 59.192 ± 7.295 years, with a majority being non-Hispanic White (88.56%). The mean value of eGDR was 5.934 ± 2.532. Subjects with higher eGDR were more likely to be female, younger, more physically active, non-smoker, and non-drinker. Additionally, subjects with atrial fibrillation, heart failure, or cardiovascular death exhibited lower eGDR levels. The group with the highest eGDR exhibited the lowest proportion of patients using blood pressure medication, cholesterol-lowering medication, aspirin, and insulin.
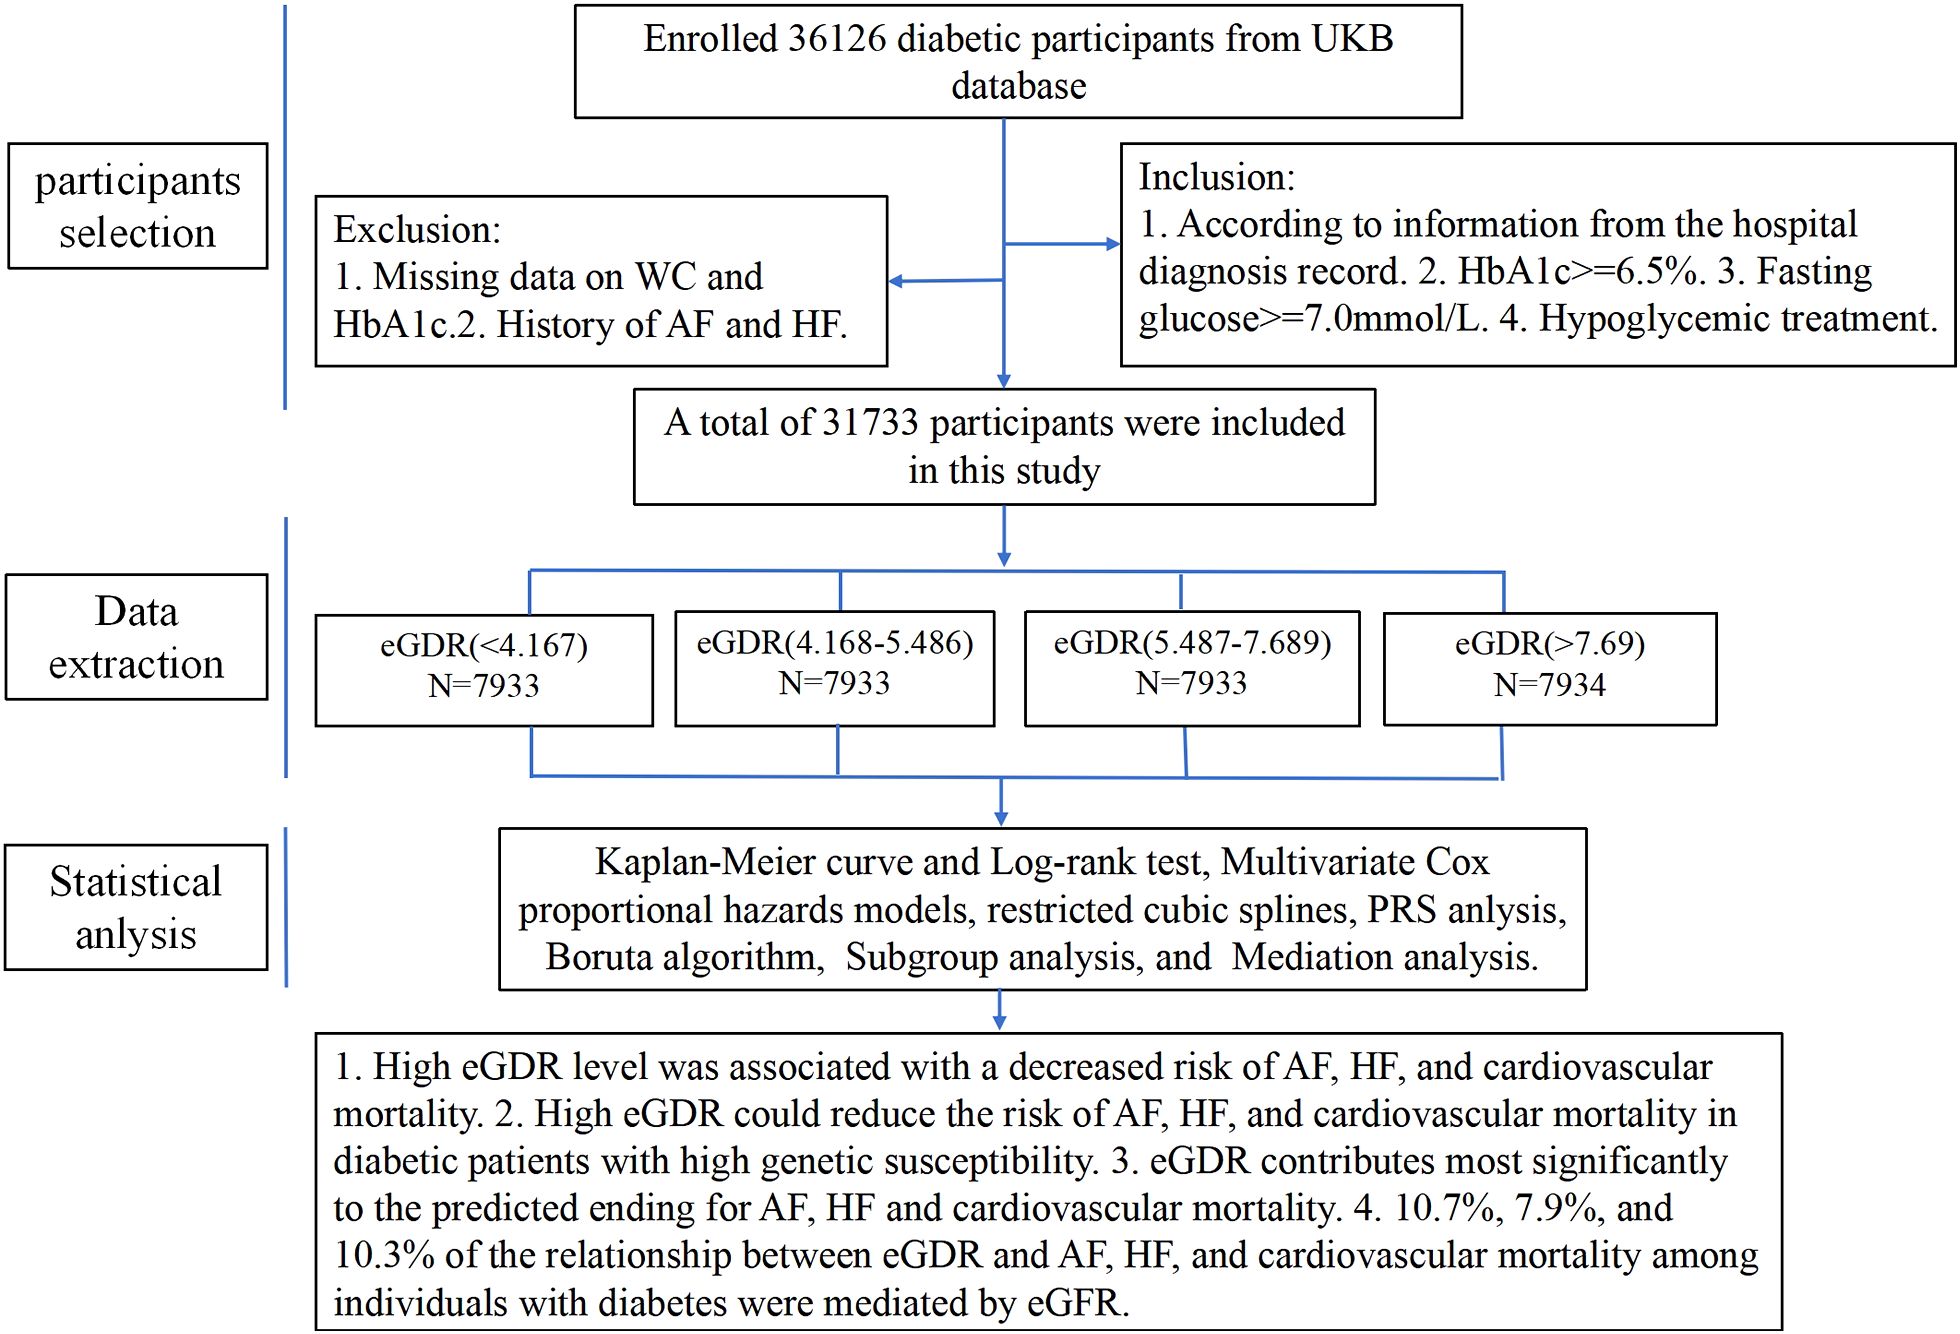
Figure 1. Flow chart of study selection.
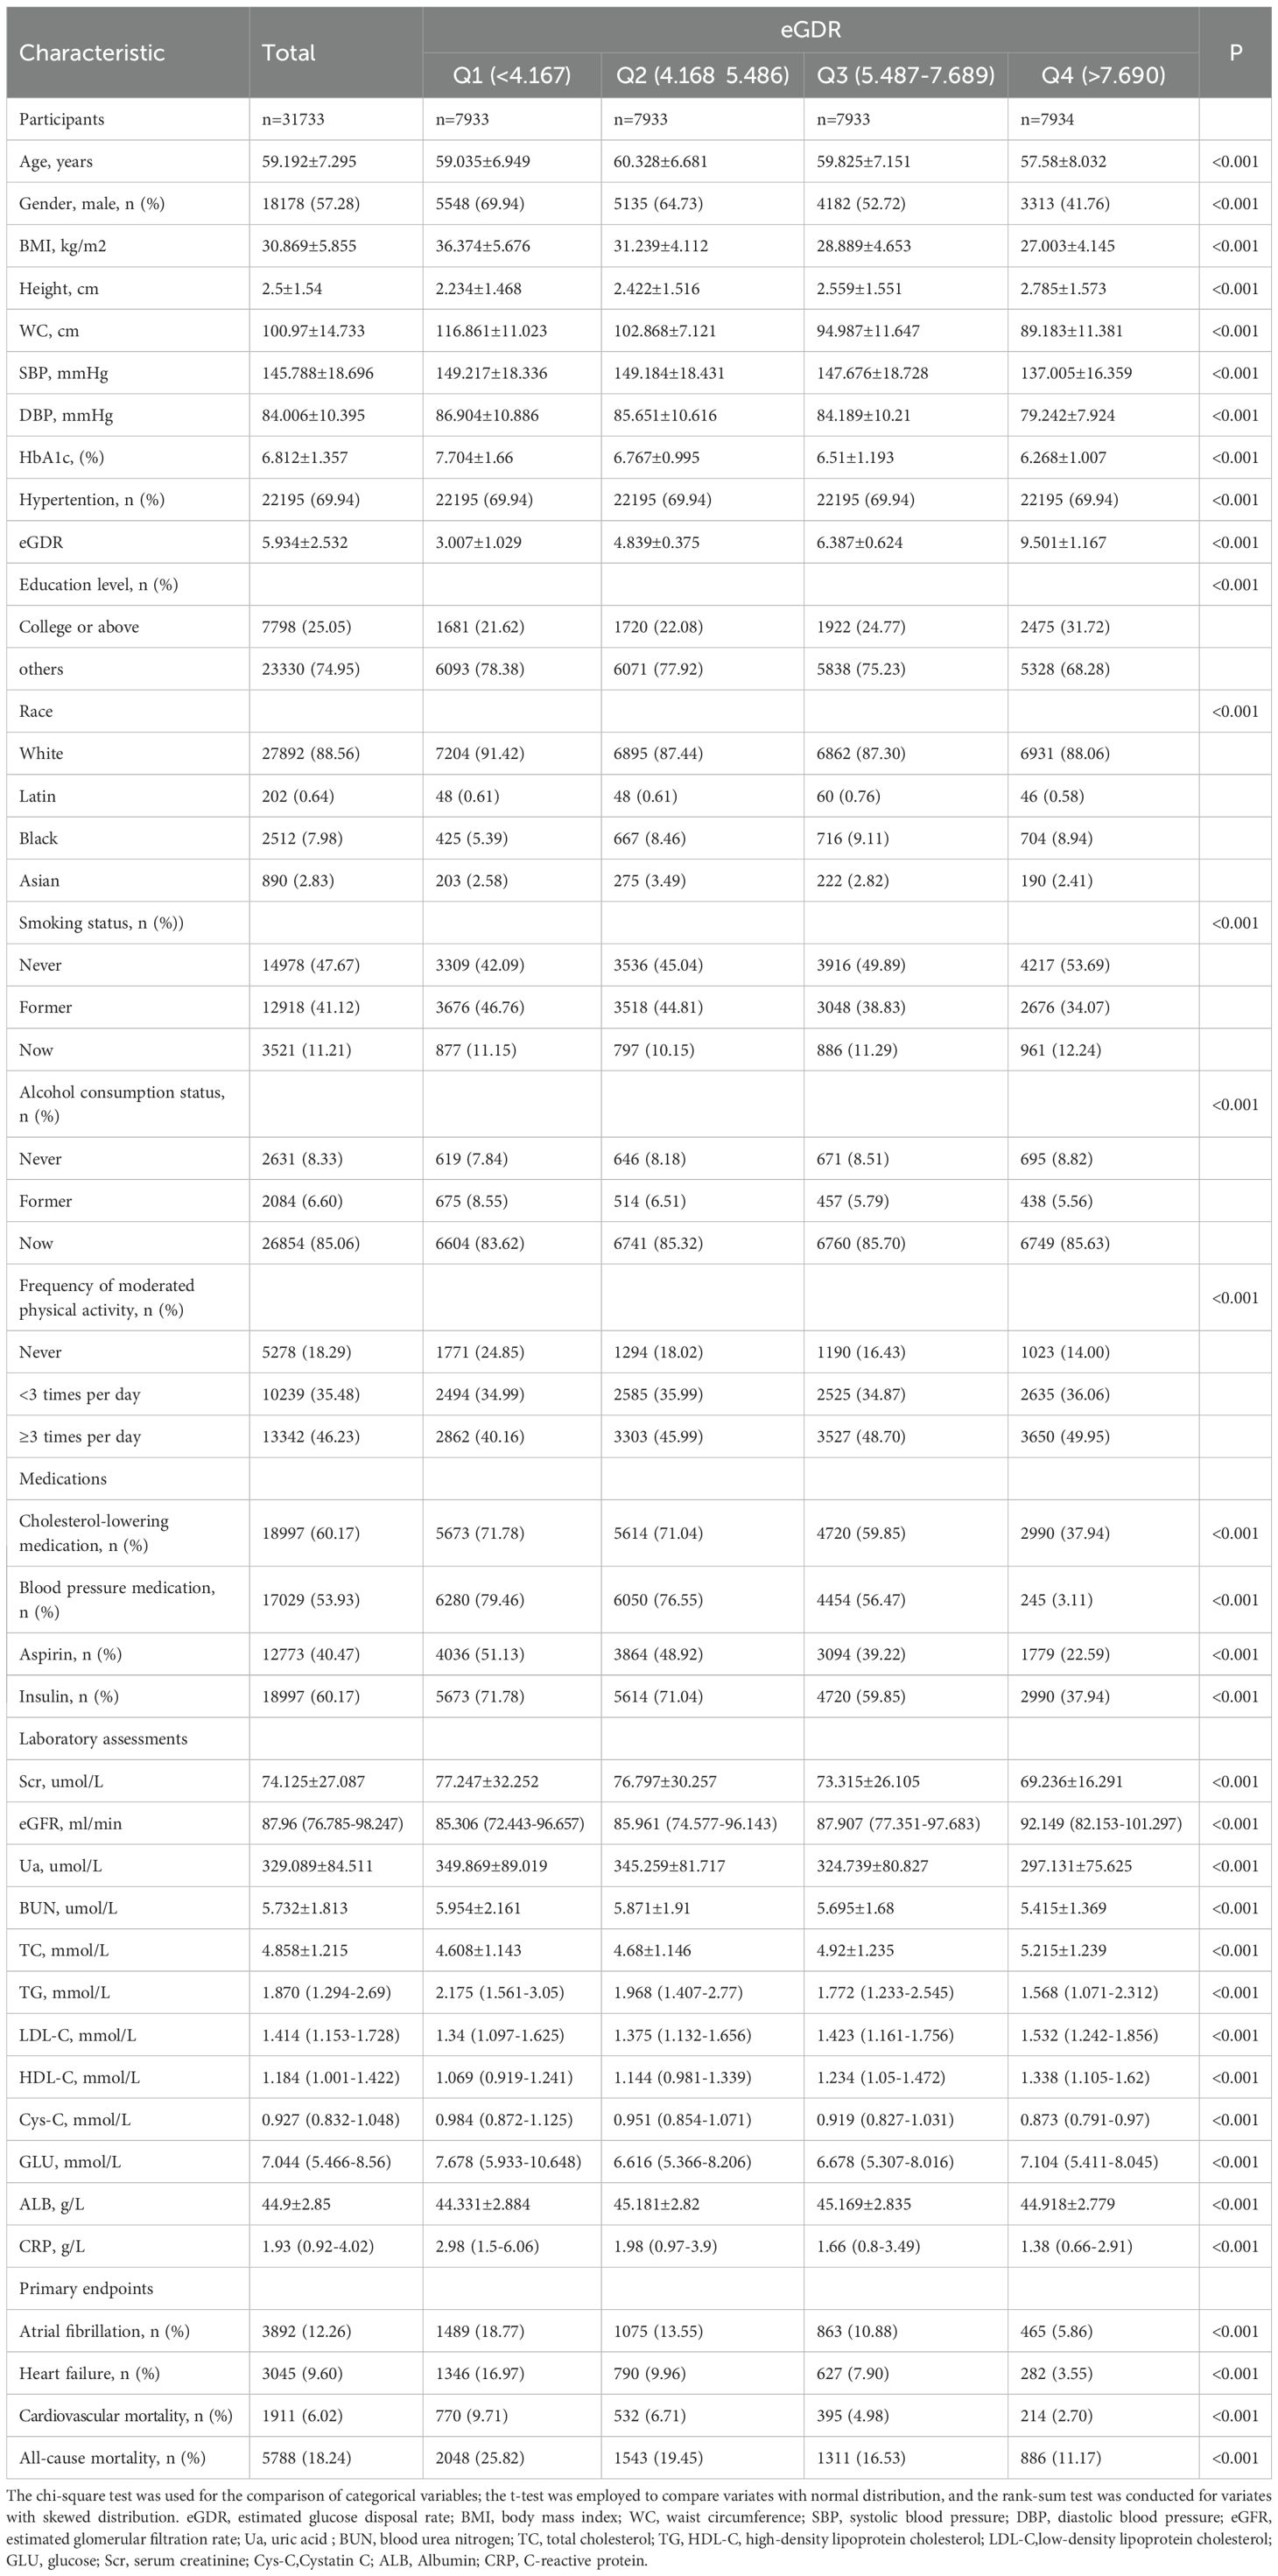
Table 1. Demographic characteristics of the study participants.
Analysis of the association of eGDR with AF, HF, and cardiovascular mortality
During a median follow-up of 12.8 years, 3,892 (12.26%) subjects developed atrial fibrillation (AF), 3,045 (9.60%) subjects developed heart failure (HF), and 1,911 (6.02%) subjects experienced cardiovascular mortality. The Kaplan-Meier survival curves and Log-rank test showed that the cumulative incidence of AF, HF and cardiovascular mortality was was significantly lower in the highest eGDR quartile compared to the lowest quartile (log-rank P < 0.001 for all) (Figure 2).
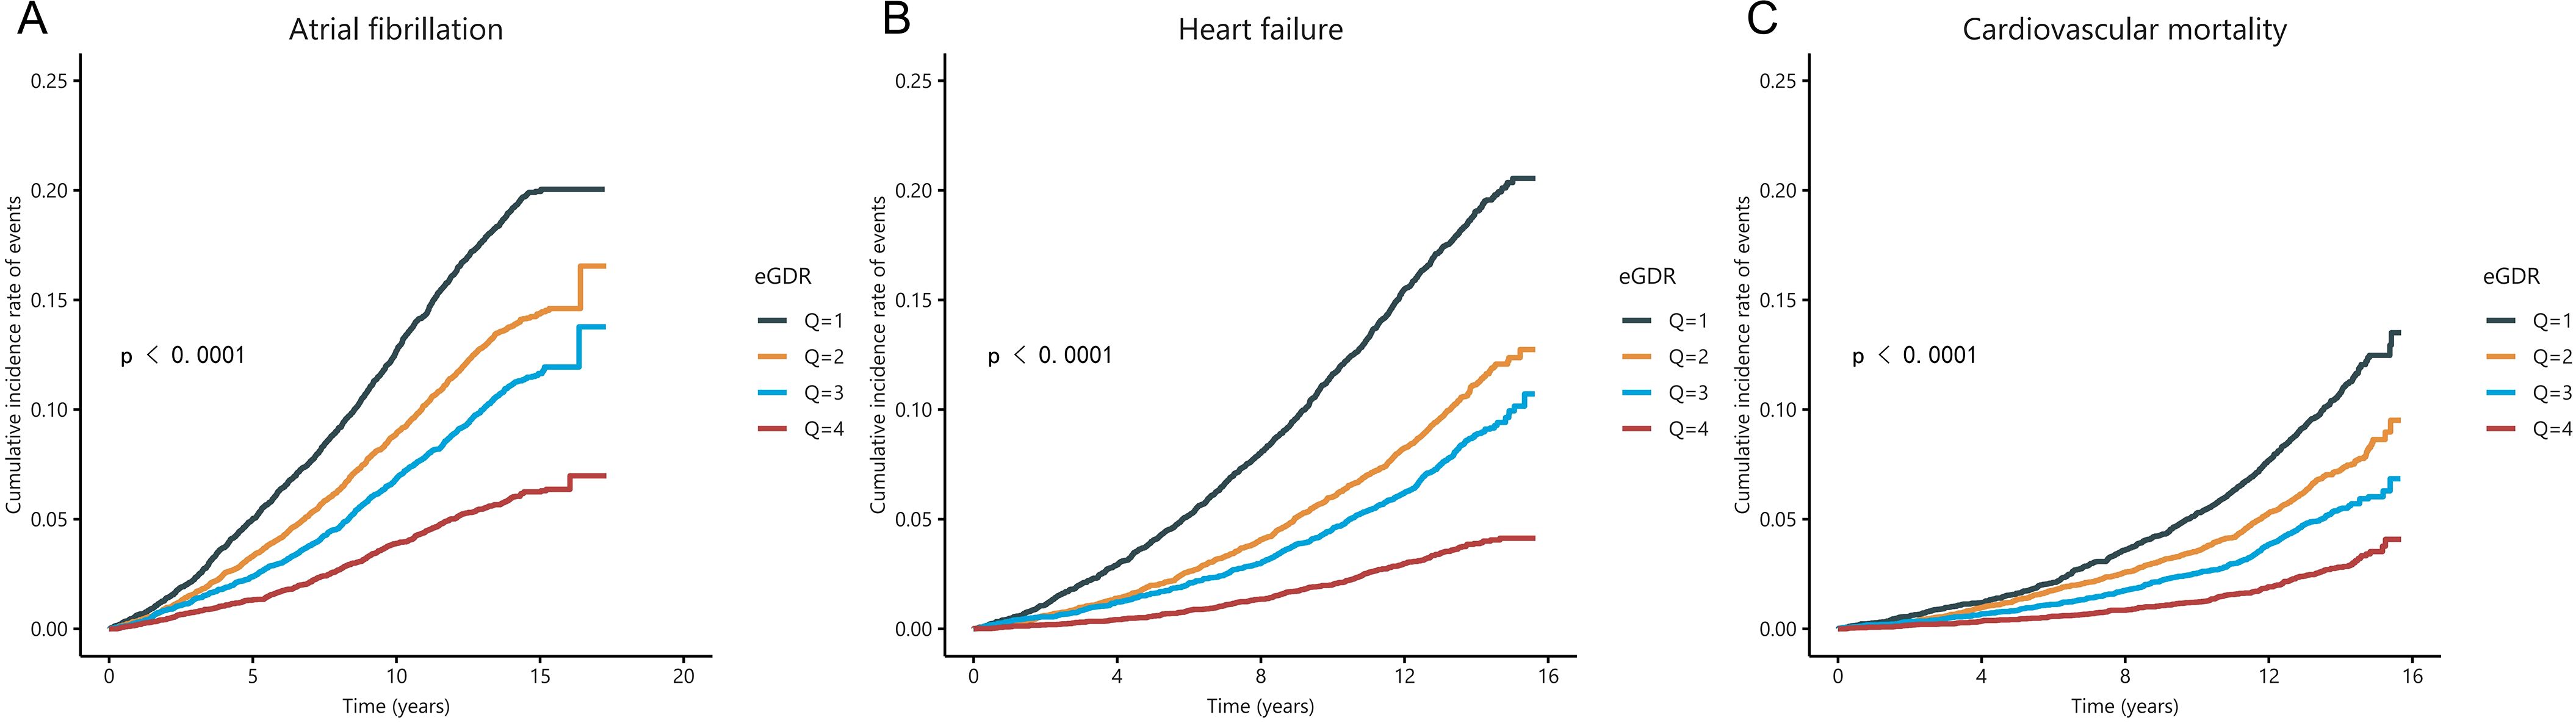
Figure 2. The Kaplan-Meier curve for cumulative incidence of AF (A), HF (B), and cardiovascular mortality (C) was based on eGDR quartiles for diabetic participants.
We conducted three Cox regression models to investigate the associations between eGDR with the risk of AF, HF and cardiovascular mortality. The results demonstrated that eGDR was significantly associated with both AF (HR=0.84, 95% CI: 0.83-0.85 in Model 1; HR = 0.90, 95% CI: 0.88-0.92 in Model 2; HR = 0.94, 95% CI: 0.91-0.96 in Model 3), HF (HR = 0.79, 95% CI: 0.78-0.80 in Model 1; HR = 0.82, 95% CI: 0.81-0.84 in Model 2; HR = 0.78, 95% CI: 0.74-0.82 in Model 3), and cardiovascular mortality (HR = 0.81, 95% CI: 0.80-0.83 in Model 1; HR = 0.84, 95% CI: 0.82-0.86 in Model 2; HR = 0.86, 95% CI: 0.83-0.88 in Model 3) (Table 2).
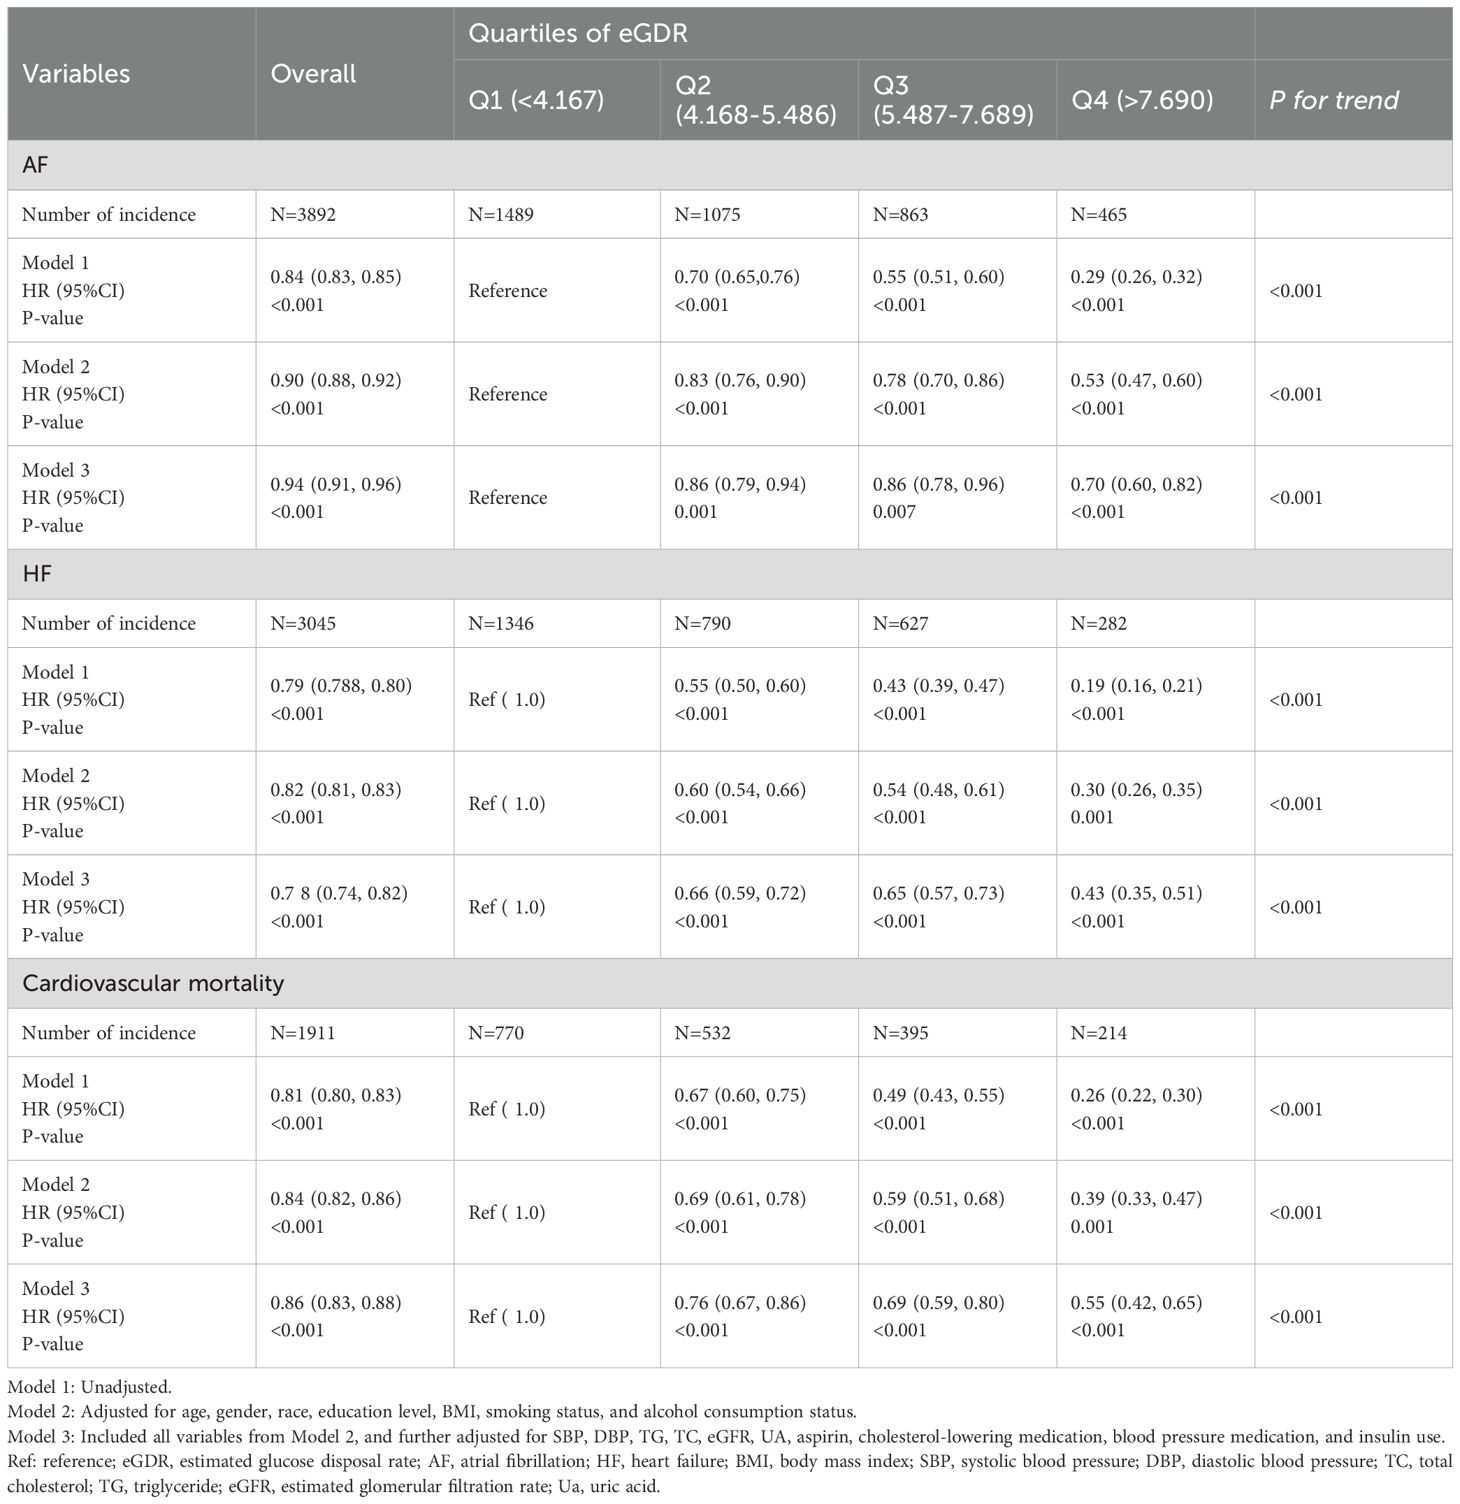
Table 2. HRs (95% CIs) for AF, HF, and cardiovascular mortality according to the eGDR quartiles.
We performed restrictive cubic spline analysis based on the Cox proportional hazards regression model to investigate nonlinear correlations between eGDR and AF, HF and cardiovascular mortality. With eGDR as the x-axis and the hazard ratio as the y-axis, the smoothed curve fitting diagram after adjusting for confounding factors from Model 3 showed that eGDR presented a negative linear correlation with the AF (P for non-linear = 0.227) and HF (P for non-linearity = 0.067), and a non-linearity relationship with cardiovascular mortality (P for non-linearity = 0.012). Notably, despite the nonlinear pattern, an increasing level of eGDR was still associated with a decreasing trend in cardiovascular mortality (Figure 3).
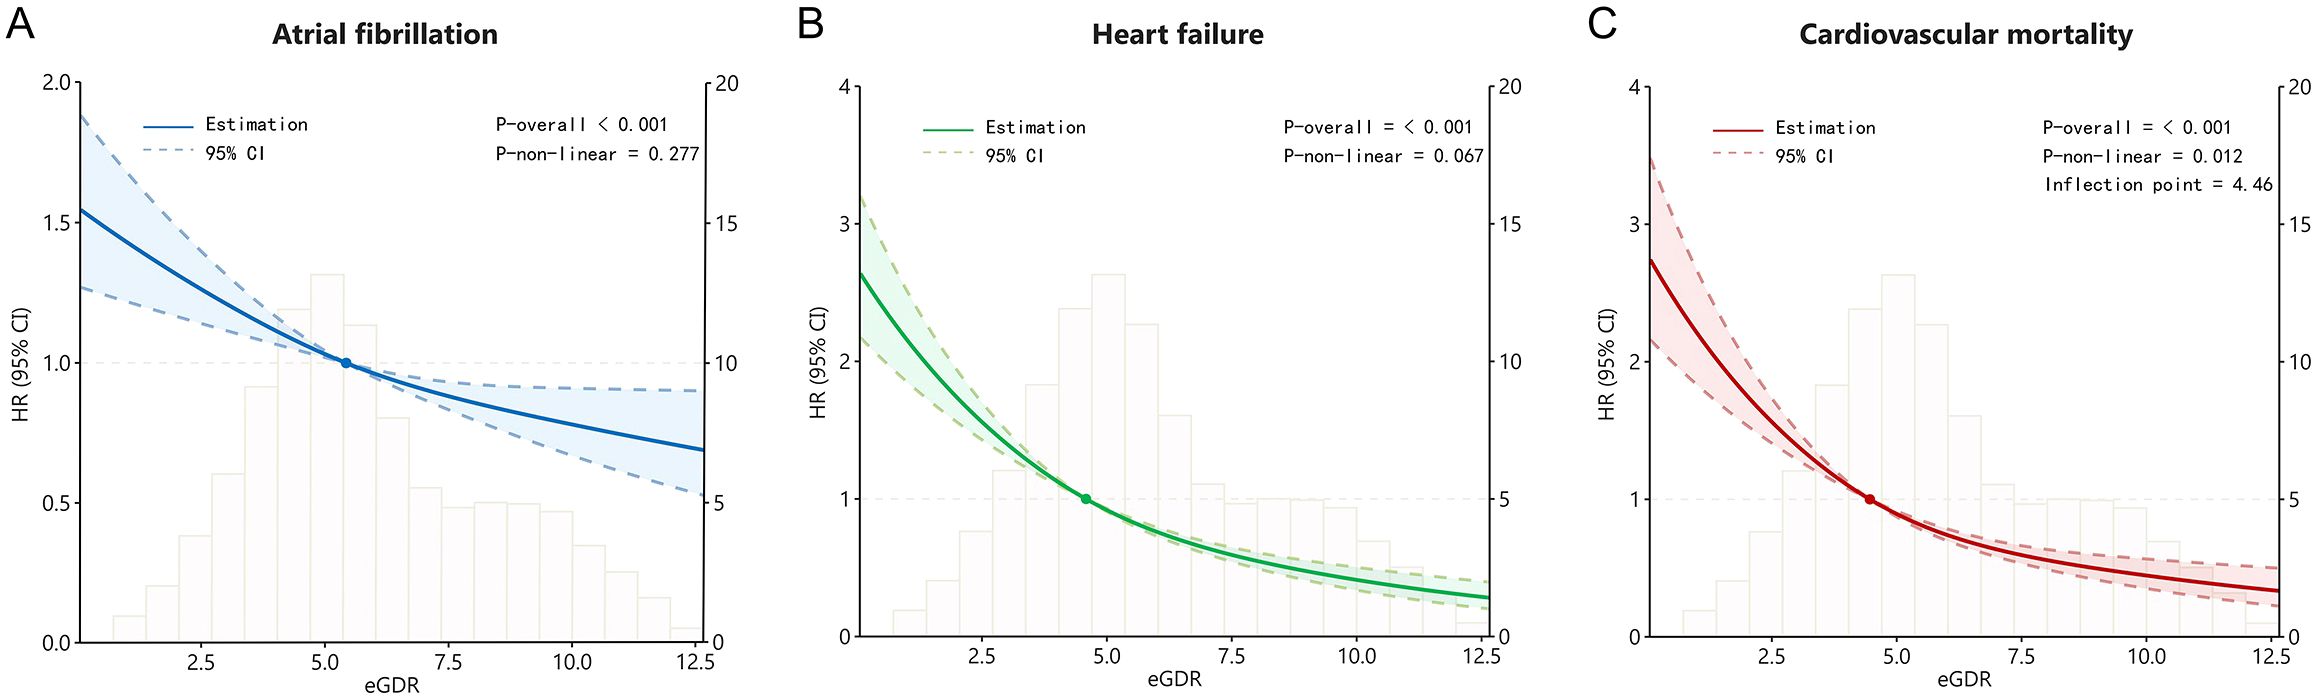
Figure 3. The restricted cubic spline curves for atrial fibrillation (A), heart failure (B), and cardiovascular mortality (C) based on eGDR for diabetic participants.
Joint association of eGDR and PRS with AF, HF and cardiovascular mortality
Compared to low genetic risk, high genetic risk was associated with increased risk of AF (HR = 2.84, 95% CI:2.54-3.17), HF (HR = 1.55, 95% CI:1.38-1.74), and cardiovascular mortality (HR = 1.65, 95% CI:1.43-1.91), respectively (Supplementary Table S1). Behavioral and genetic factors jointly contributed to the risk of AF, HF and cardiovascular mortality. Therefore, we further investigated whether appropriate eGDR levels could mitigate the risks of AF, HF, and cardiovascular mortality in individuals with genetic susceptibility. Figure 4A1 showed that no statistically significant difference between low genetic risk and eGDR for AF risk (P =0.335). However, high eGDR was associated with a 27% and 32% reduced risk of AF among intermediate (HR = 0.73, 95% CI: 0.60-0.89) and high genetic risk groups (HR = 0.68, 95% CI: 0.51-0.90), respectively. Figure 4B1 showed that high eGDR was associated with a 63%, 55% and 53% reduced risk of HF among low (HR = 0.37, 95% CI: 0.23-0.59), intermediate (HR = 0.45, 95% CI: 0.36-0.57) and high genetic risk groups (HR = 0.47, 95% CI: 0.29-0.62), respectively. Figure 4C1 showed that high eGDR was associated with a 77%, 75% and 70% reduced risk of cardiovascular mortality among low (HR = 0.23, 95% CI: 0.26-0.33), intermediate (HR = 0.25, 95% CI: 0.21-0.31) and high genetic risk groups (HR = 0.30, 95% CI: 0.22-0.42), respectively. Individuals with low eGDR and high genetic risk exhibited a increased risk of AF, HF, and cardiovascular mortality compared with those with high eGDR and low genetic risk (Figures 4A2, B2, C2; Supplementary Table S2).
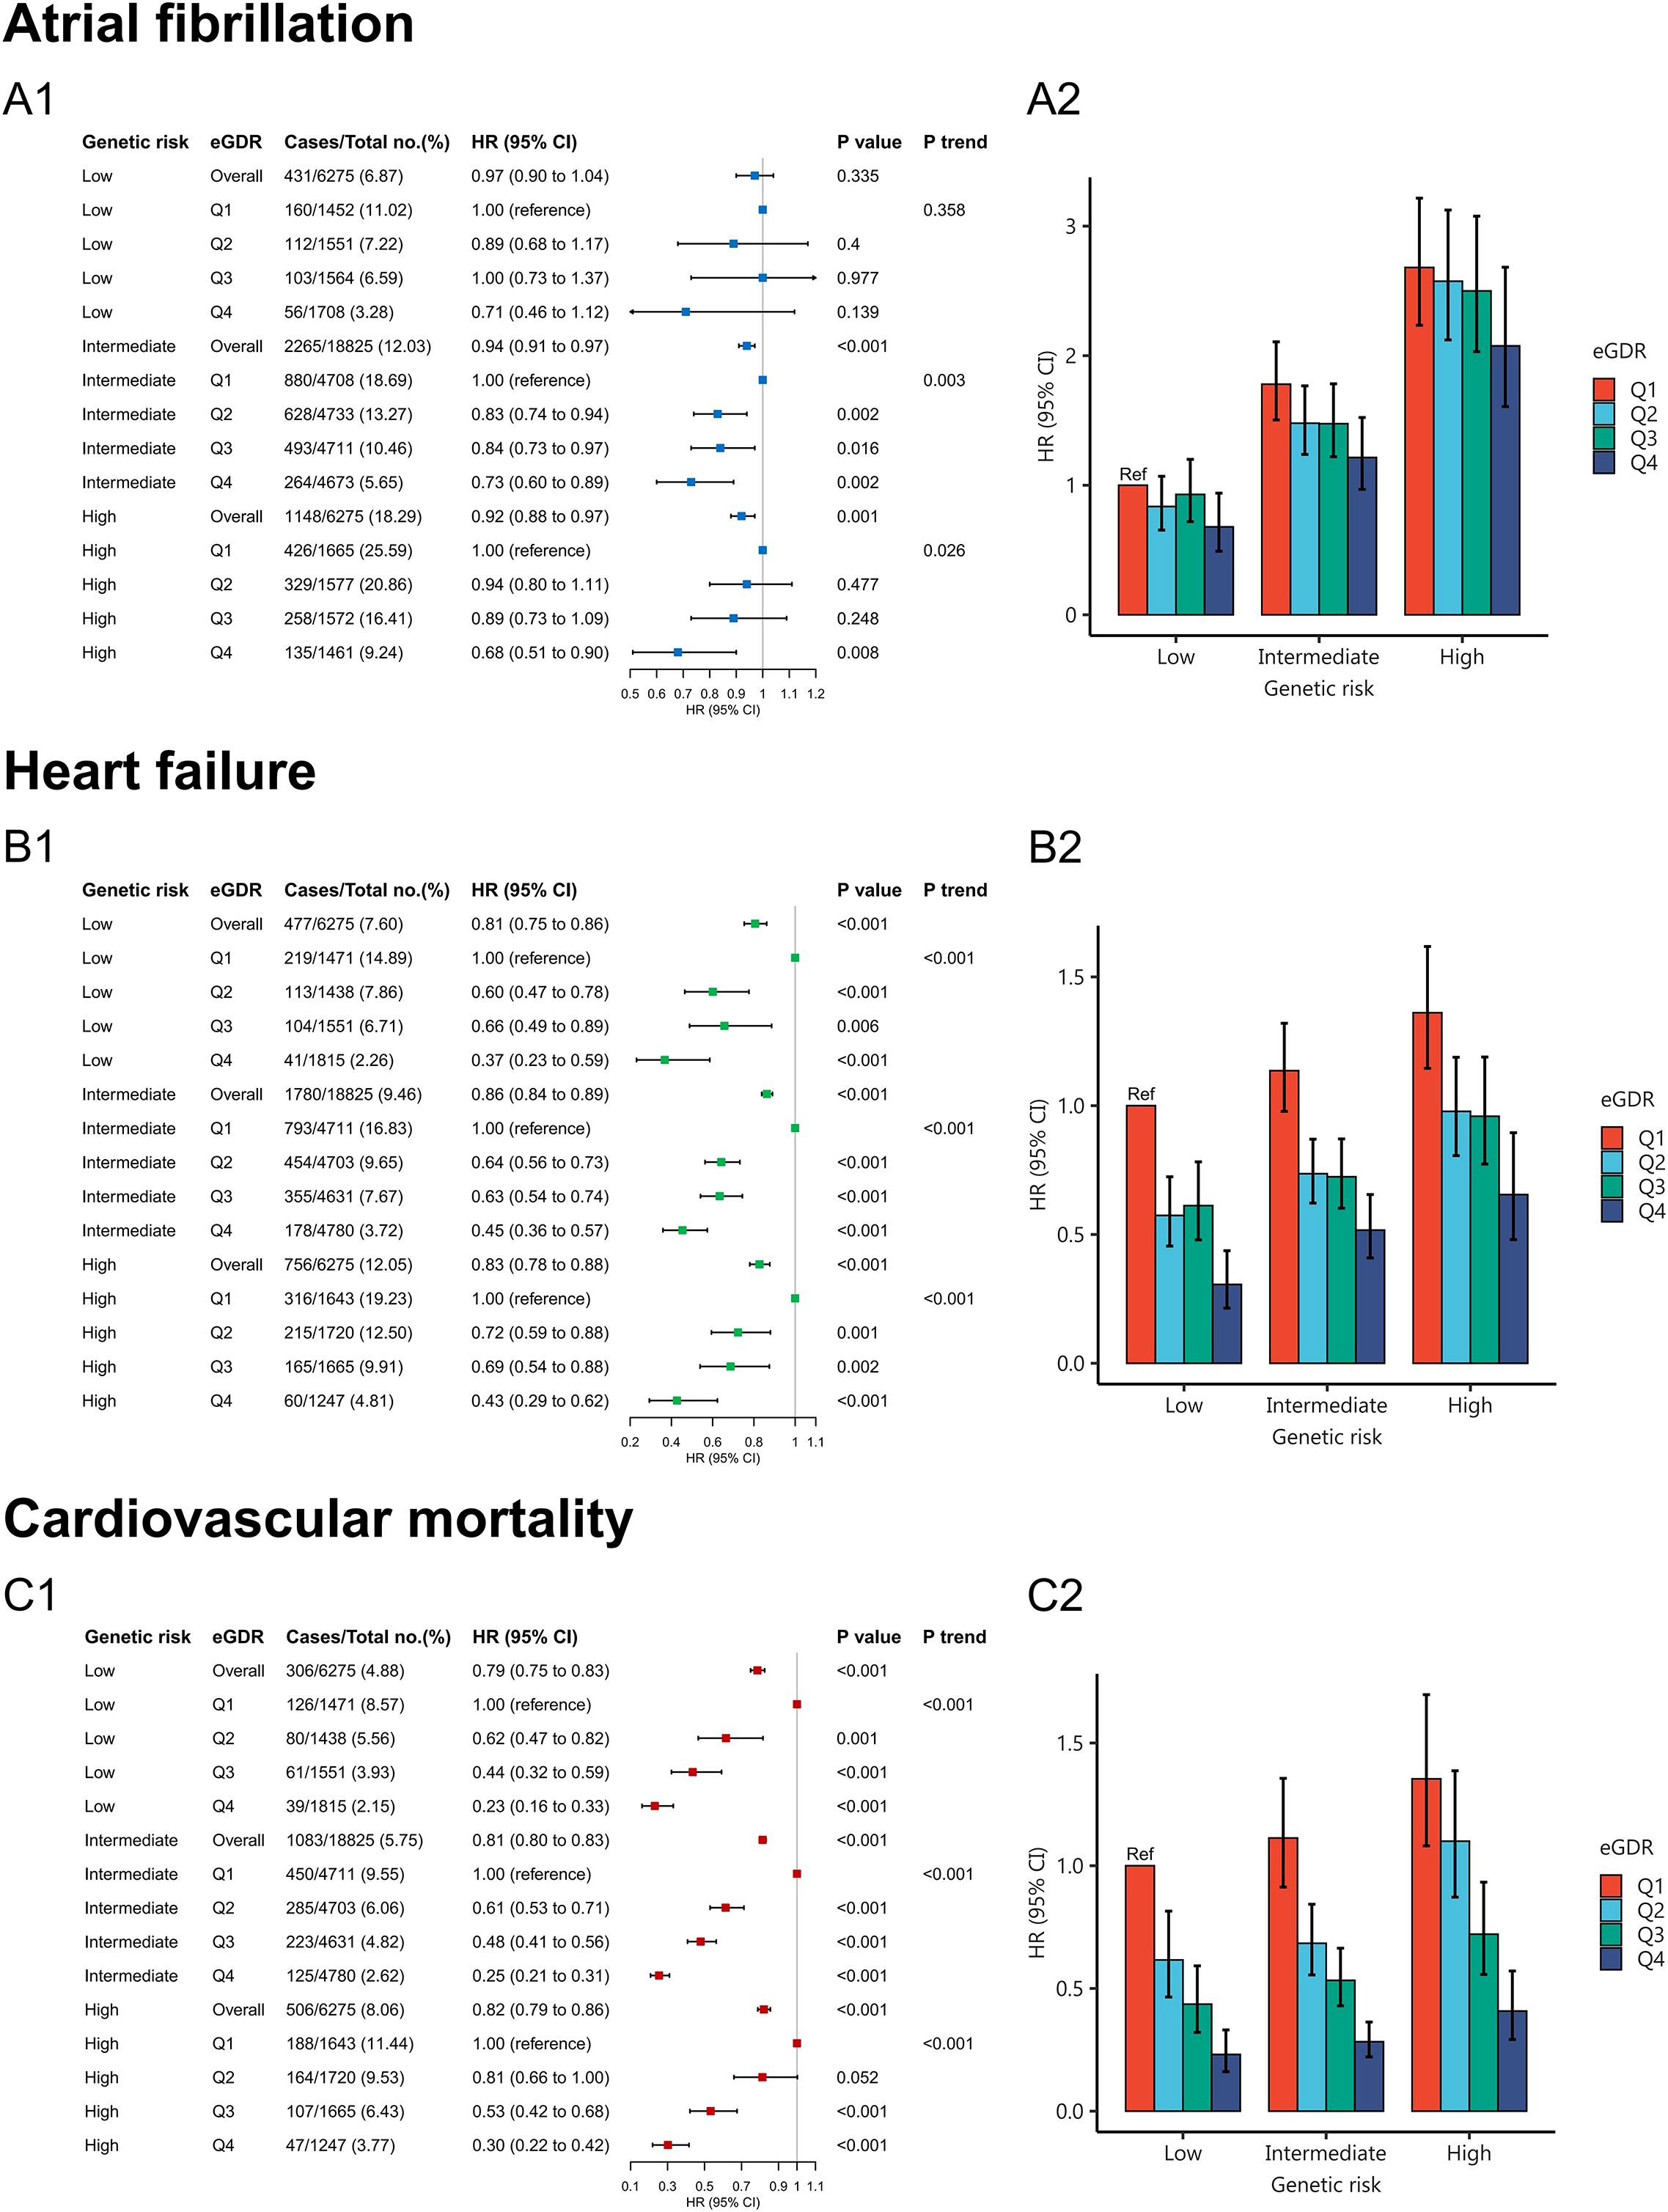
Figure 4. Joint association of eGDR and PRS with atrial fibrillation (A1, A2), heart failure (B1, B2), and cardiovascular mortality (C1, C2).
The variables that contribute most to model predictions
The feature screening results based on Boruta`s algorithm were showed in Figure 5; Supplementary Figure S1. After 500 iterations it was determined that the 20 variables most closely associated with AF were age, eGDR, BMI, WC, eGFR, DBP, SBP, HbAc1, UA, TC, AF-PRS, TG, gender, cholesterol-lowering medication, hypertension, blood pressure medication, asprin, insulin, race, alcohol consumption status, and smoking status. The 19 variables most closely associated with HF were eGDR, BMI, WC, eGFR, HbA1C, age, DSP, SBP, UA, TC, TG, blood pressure medication, insulin, hypertension, cholesterol-lowering medication, gender, asprin, CVD-PRS, and race. And the 20 variables most closely associated with cardiovascular mortality were eGDR, BMI, WC, eGFR, HbA1C, SBP, age, DSP, TC, UA, TG, gender, insulin, hypertension, cholesterol-lowering medication, blood pressure medication, race, asprin, smoking status, CVD-PRS, and education level. The analysis demonstrated that eGDR contributes most significantly to the the prediction of HF and cardiovascular mortality outcomes. While age contributes most significantly to the prediction of AF outcomes, eGDR ranks second in importance after age.
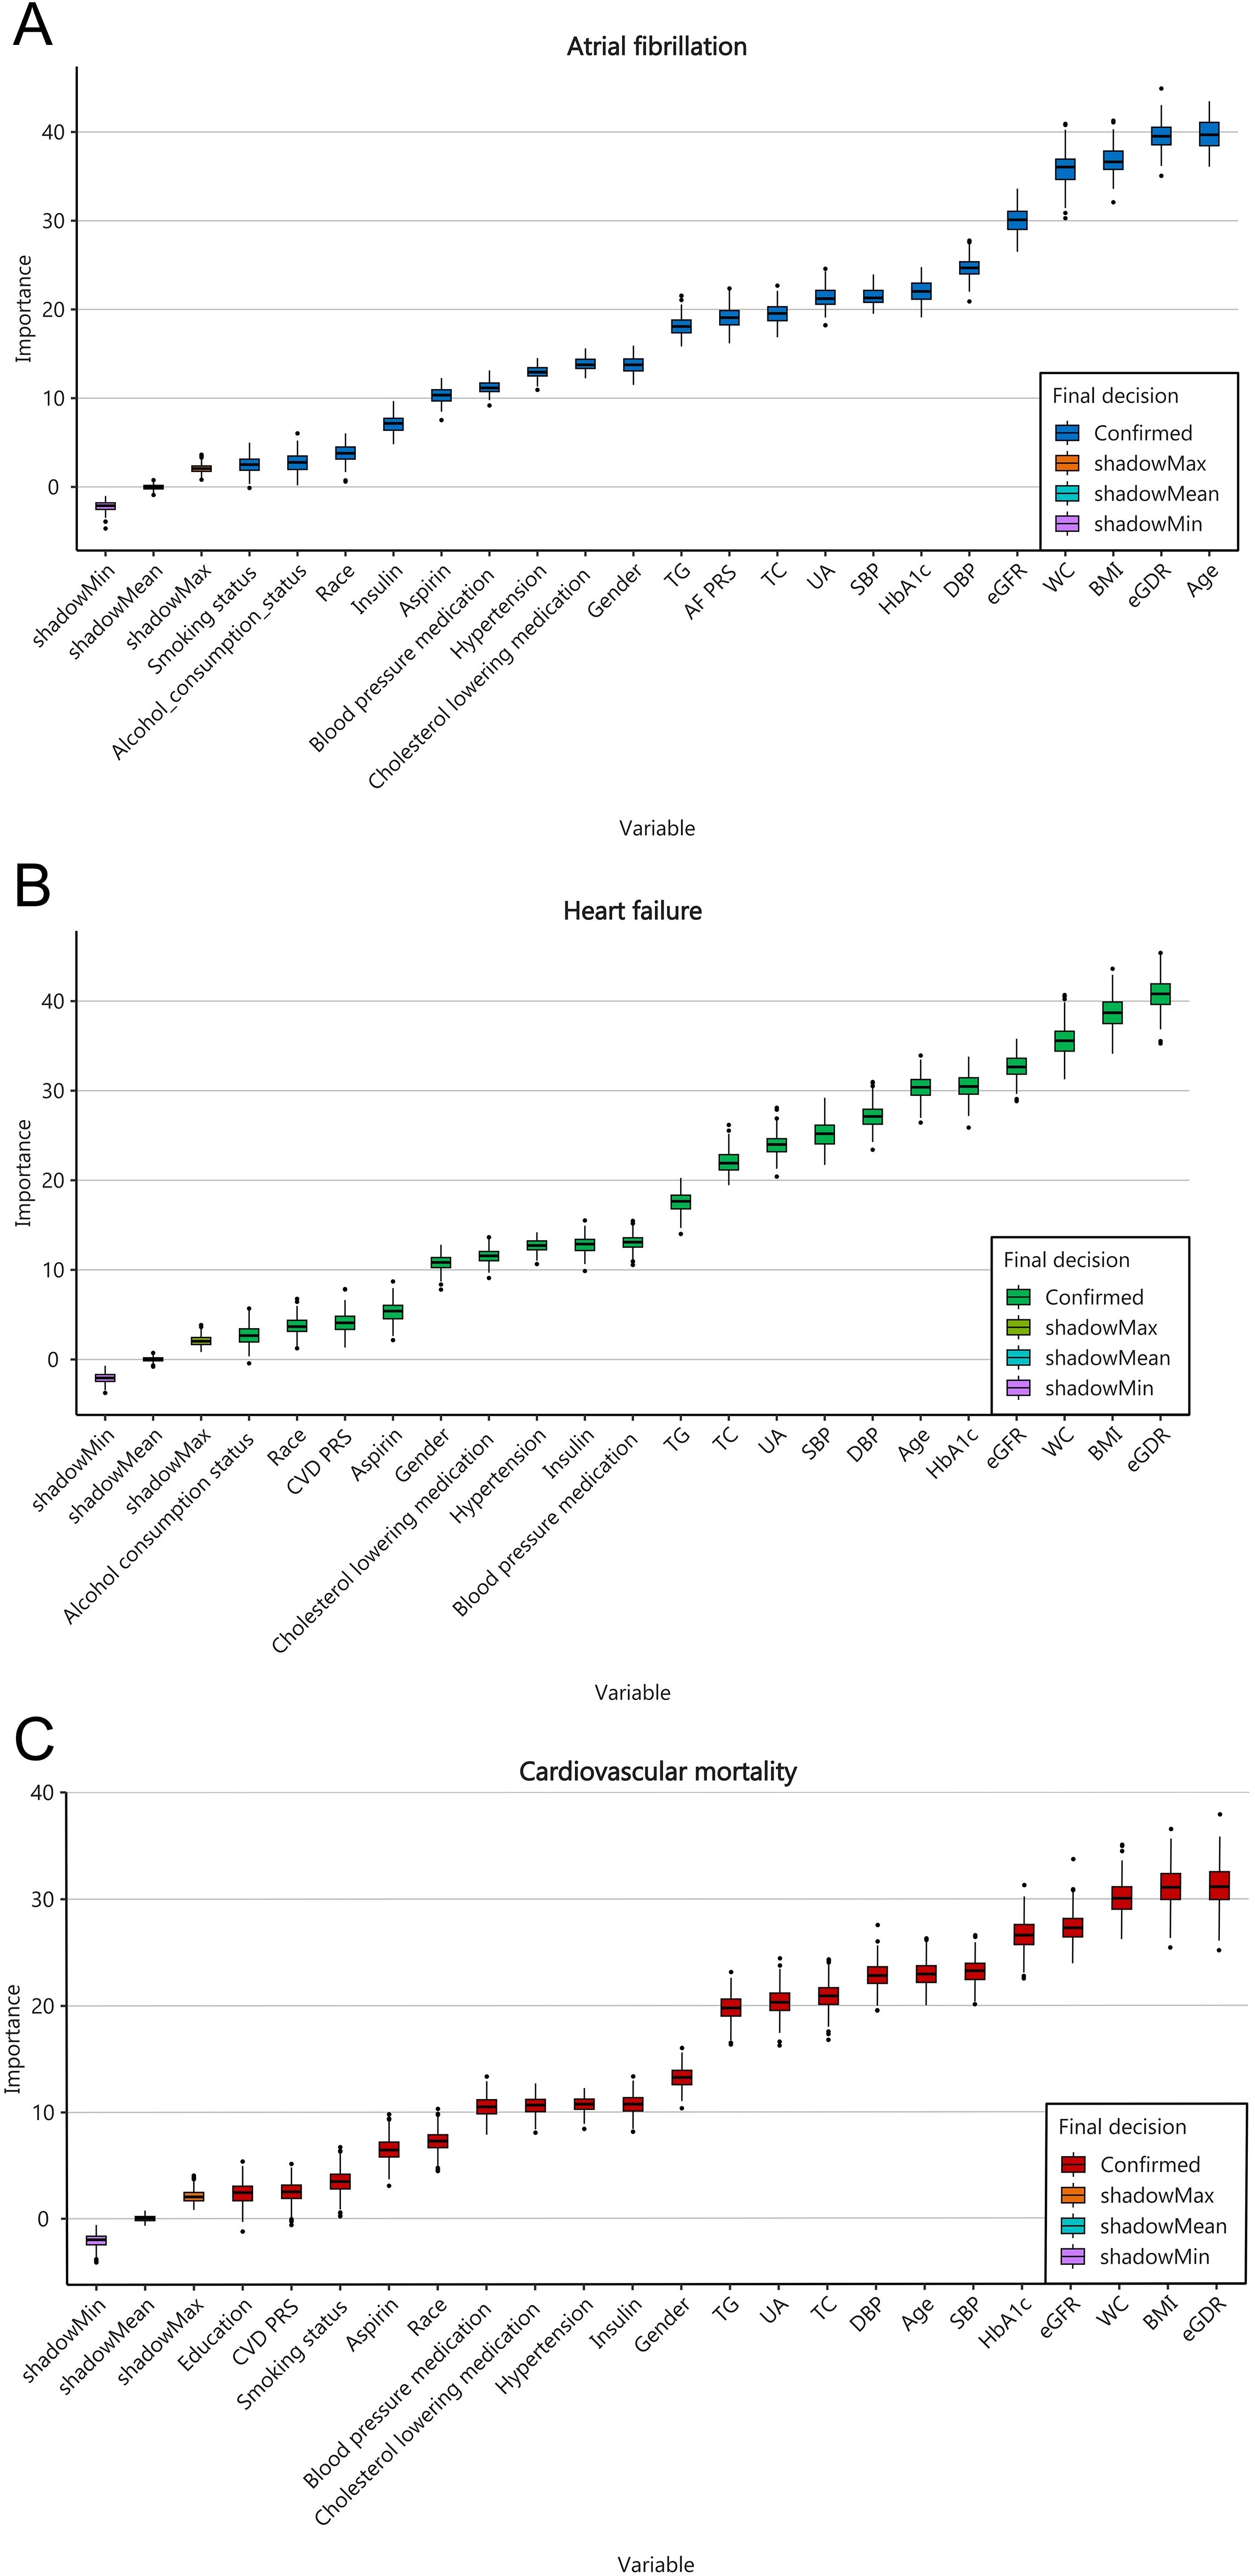
Figure 5. Feature selection based on the Boruta`s algorithm for AF (A), HF (B), and cardiovascular mortality (C).
Subgroup analysis
To further evaluate the effect of eGDR on outcome indicators, subgroup analyses was performed according to ages, gender, BMI, education level, smoking status, and alcohol consumption status. The subgroup analysis of AF (Figure 6) revealed that there was no significant interaction between most subgroups (gender, education level, smoking status, and alcohol consumption status) (P for interaction > 0.05). However, significant interactions were observed between eGDR and age as well as BMI subgroups. we found eGDR was strongly associated with AF incidence in the age subgroup (P for interaction = 0.002). Compared with the lowest eGDR, high eGDR was associated with a 53% reduced risk of AF incidence in subjects < 65 years (HR = 0.47, 95% CI: 0.35–0.65) and a 24% reduced risk in subjects ≥ 65 years (HR = 0.76, 95% CI: 0.64–0.92). In the BMI subgroup, an interaction was also observed between eGDR and AF incidence (P for interaction = 0.009). High eGDR was associated with a 29% reduced risk of AF incidence in subjects with BMI < 30 kg/m2 (HR = 0.71, 95% CI: 0.54-0.93) and a 43% reduced risk in subjects with BMI ≥ 30 kg/m2 (HR = 0.57, 95% CI: 0.46-0.71).
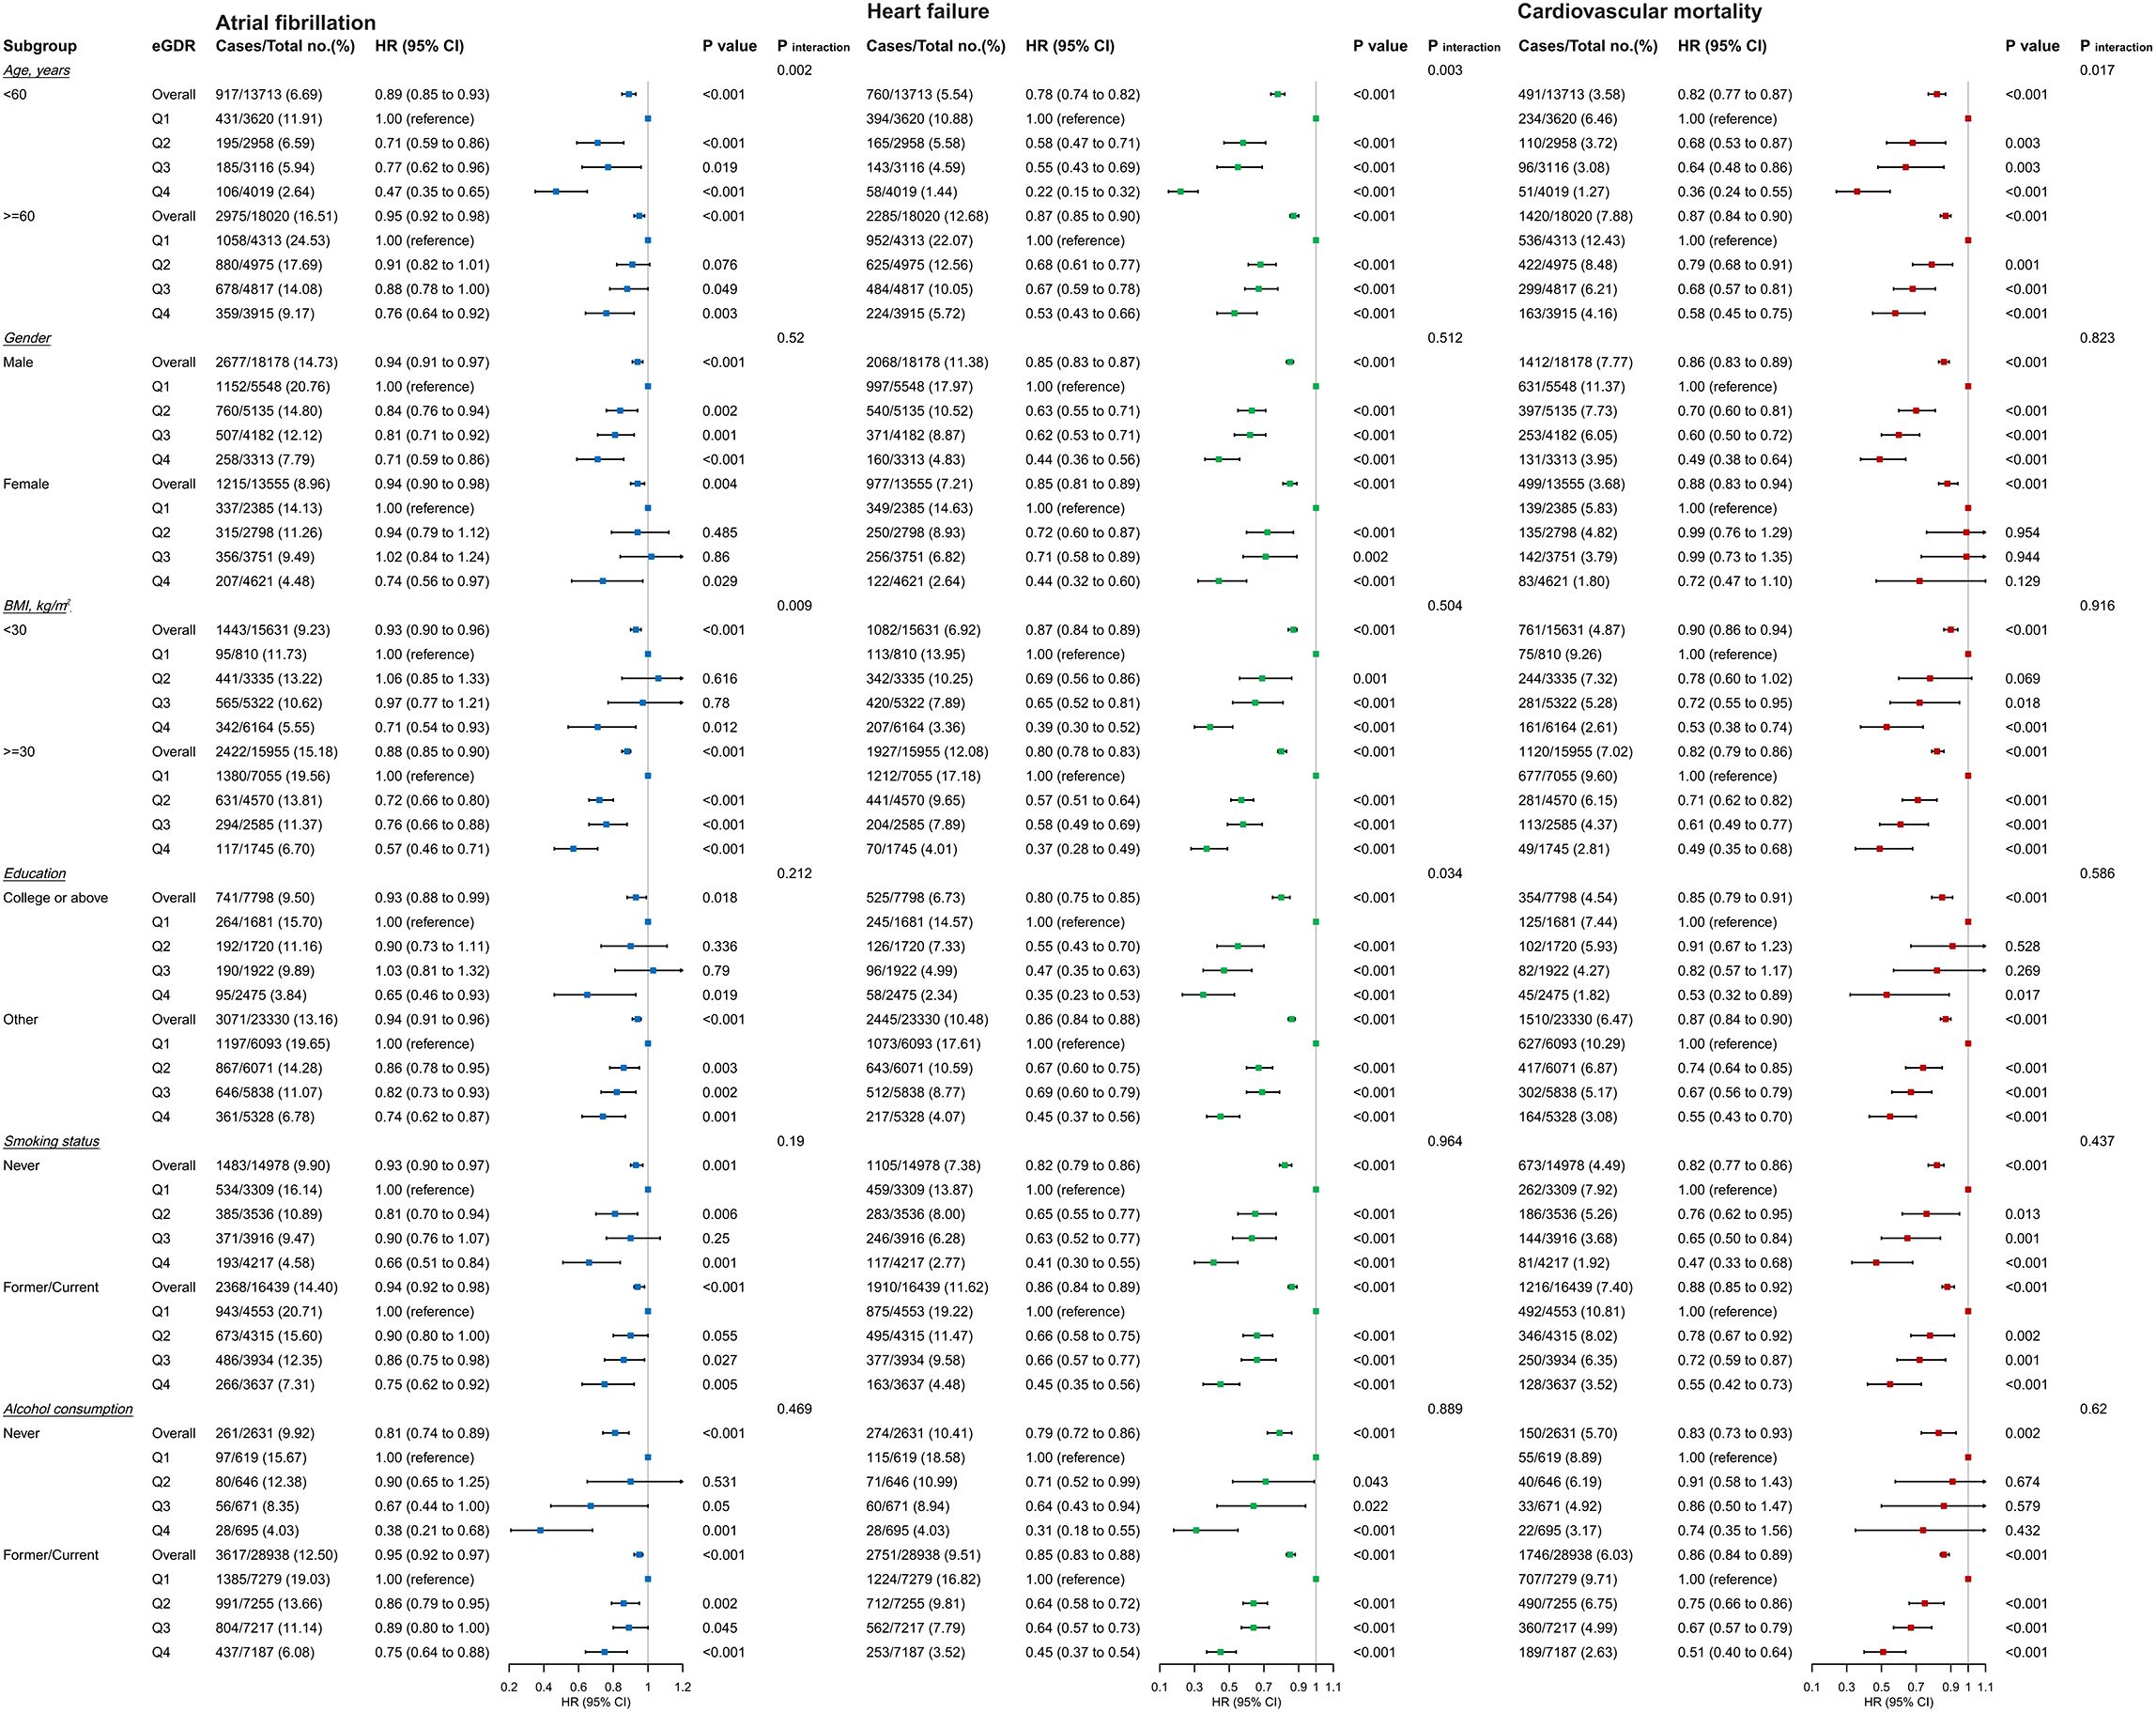
Figure 6. Subgroup and interaction analyses among the quartile Q1-Q4 and AF, HF, and cardiovascular mortality across various subgroups.
The subgroup analysis of heart failure (HF) (Figure 6) showed that there was no significant interaction between eGDR and most subgroups (gender, BMI, smoking status, and alcohol consumption status) (P for interaction > 0.05). However, a significant interaction was observed between eGDR and age (P for interaction < 0.001). High eGDR was associated with a 78% reduced risk of HF incidence in subjects < 65 years (HR = 0.22, 95% CI: 0.15-0.32) and a 47% reduced risk in subjects ≥ 65 years (HR = 0.53, 95% CI: 0.43-0.66).
The subgroup analysis of cardiovascular mortality (Figure 6) demonstrated that there was no significant interaction between eGDR and any subgroups (P for interaction > 0.05), except for the age subgroup (P for interaction = 0.017). High eGDR was associated with a 64% reduced risk of cardiovascular mortality in subjects < 65 years (HR = 0.36, 95% CI: 0.24-0.55) and a 42% reduced risk in subjects ≥ 65 years (HR = 0.58, 95% CI: 0.45-0.75).
Mediation analysis
Insulin resistance was associated with renal function, particularly in individuals with diabetes. Mediation analysis revealed that 10.7%, 7.9%, and 10.3% of the associations between eGDR and AF, HF, and cardiovascular mortality, respectively, among individuals with diabetes were mediated by eGFR. eGFR was positively correlated with a reduced risk of AF (Estimate ± SE = 0.006 ± 0.001, P < 0.001), HF (Estimate ± SE = 0.009 ± 0.001, P < 0.001), and cardiovascular mortality (Estimate ± SE = -0.010 ± 0.001, P < 0.001). Additionally, eGDR was positively correlated with eGFR (Estimate ± SE = 0.897 ± 0.047, P < 0.001) and a reduced risk of AF (Estimate ± SE = 0.043 ± 0.009, P < 0.001), HF (Estimate ± SE = 0.097 ± 0.007, P < 0.001), and cardiovascular mortality (Estimate ± SE = 0.081 ± 0.008, P < 0.001) (Figure 7).
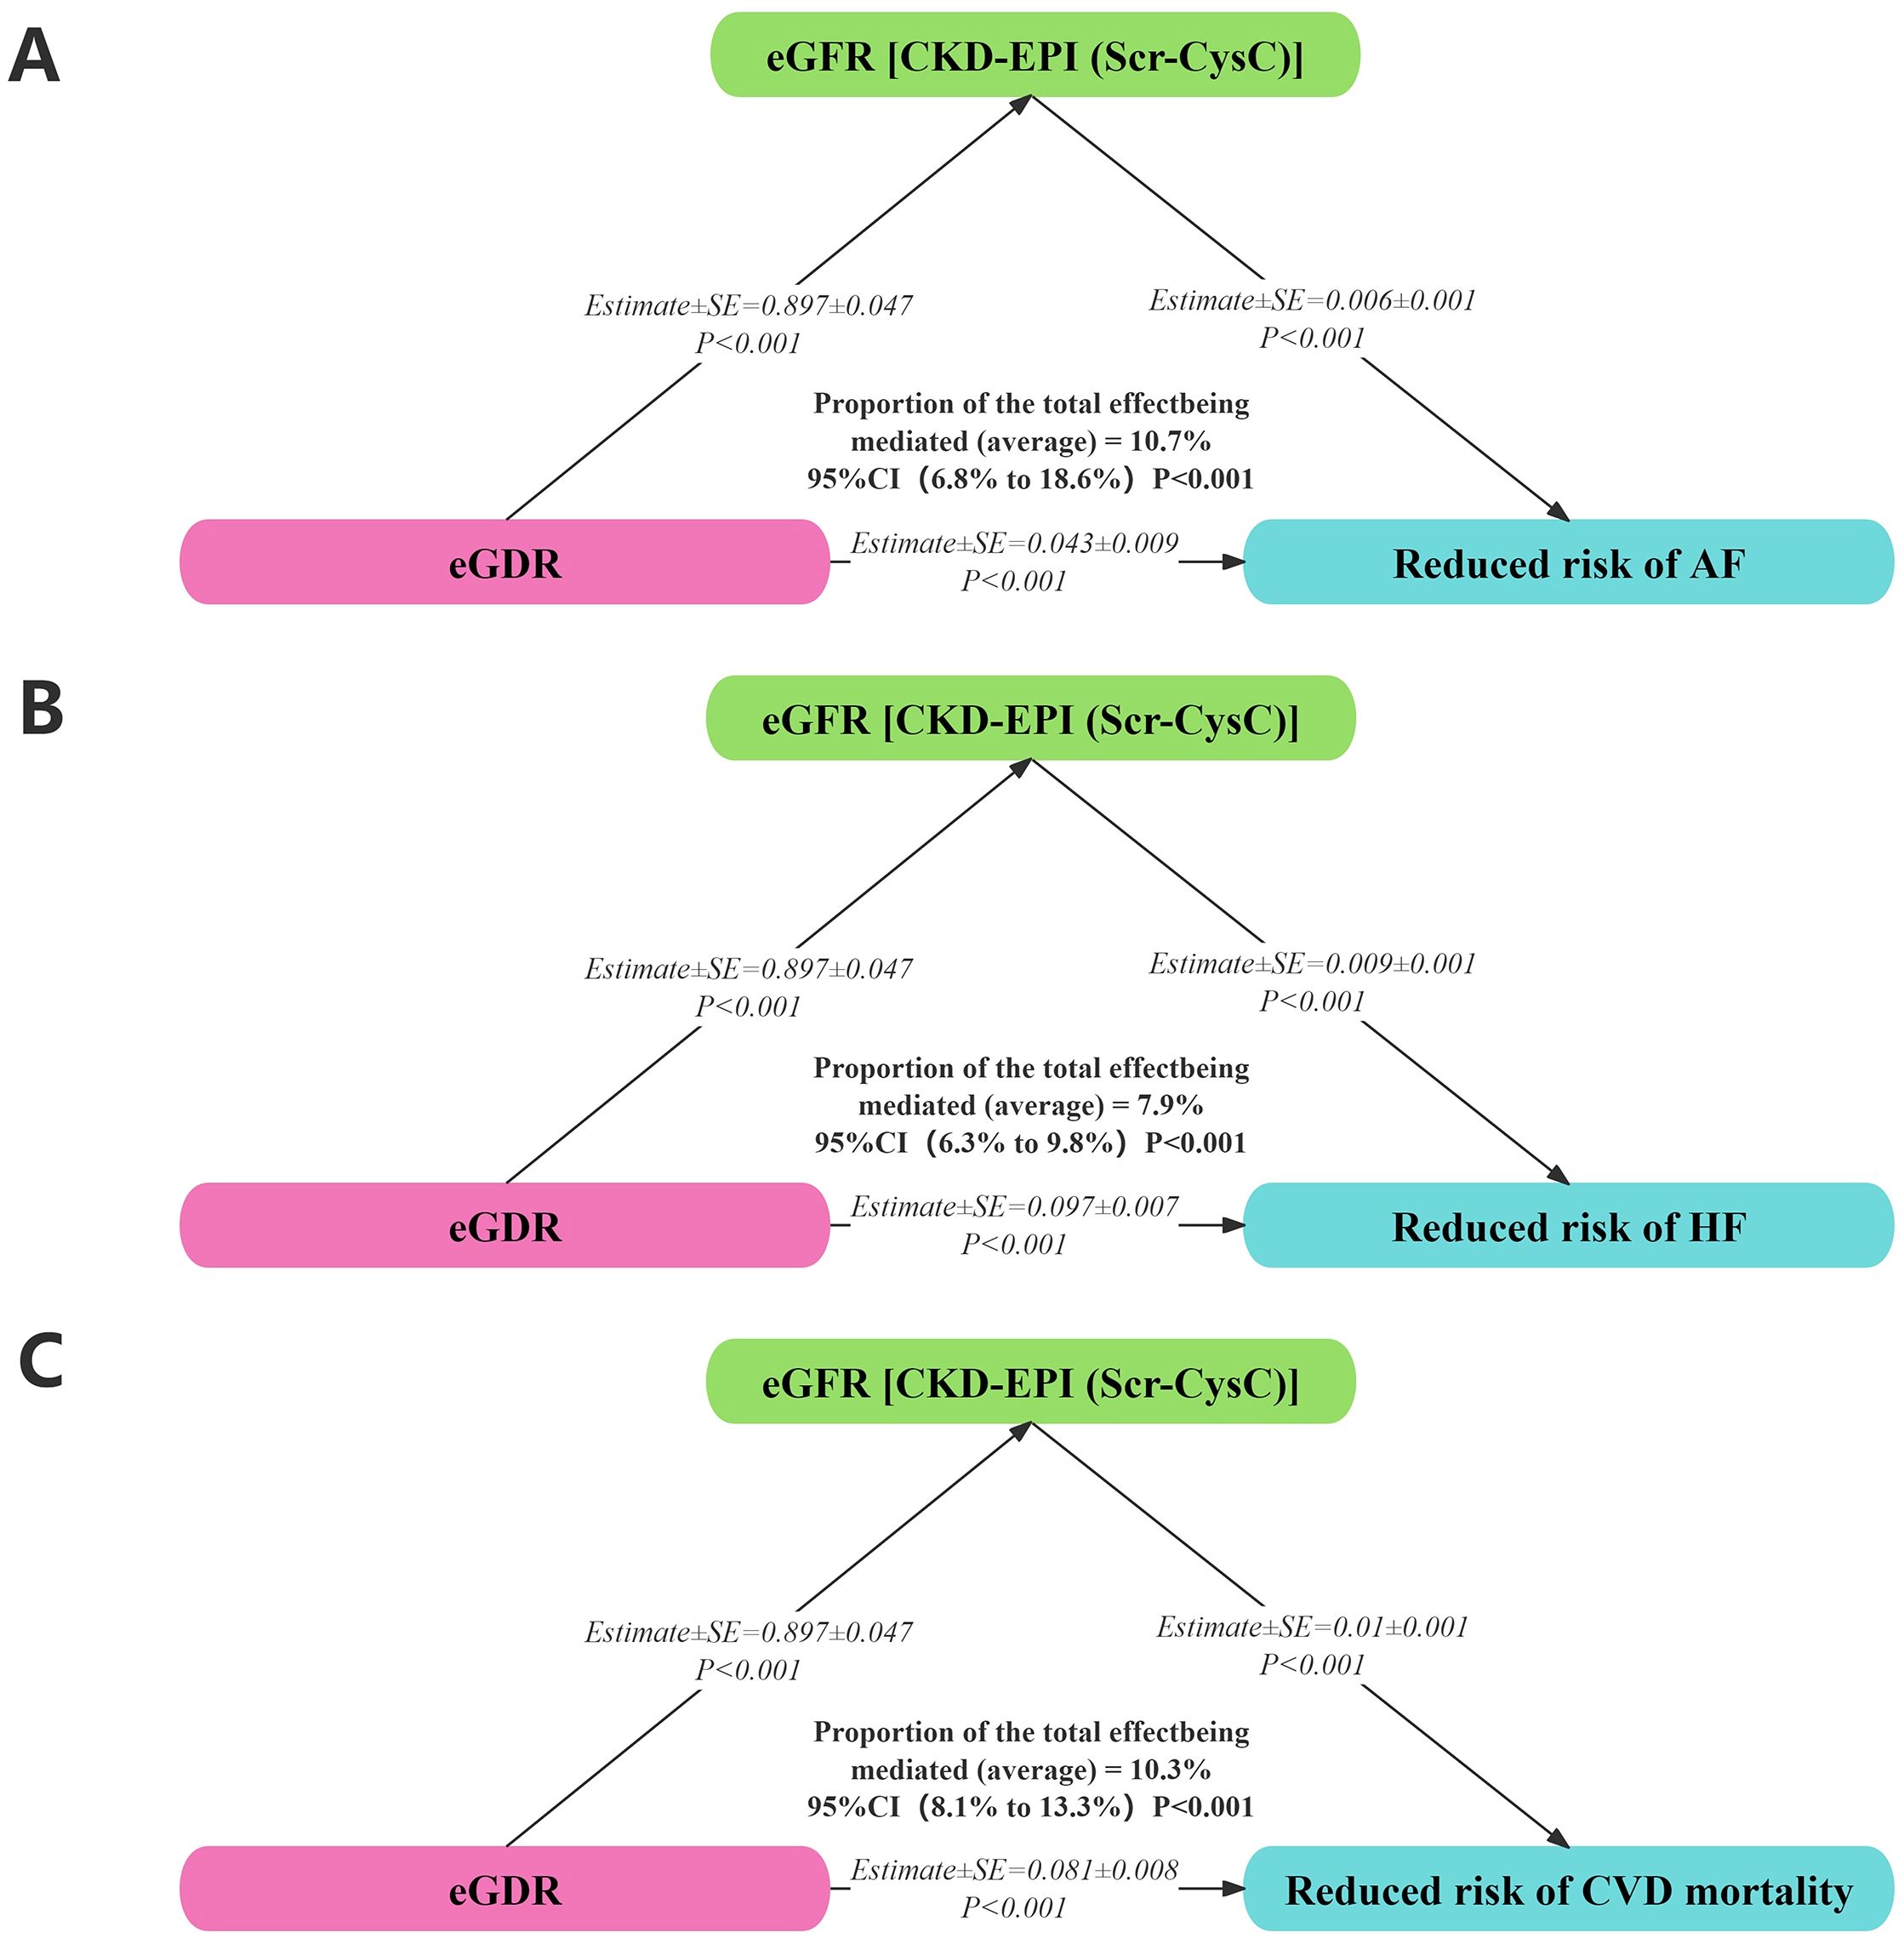
Figure 7. Mediation analysis on associations between eGDR with AF (A), HF (B), and cardiovascular mortality (C).
Discussion
This study clearly reveals a strong correlation between eGDR and atrial AF, HF, and cardiovascular mortality, providing important insights for a deeper understanding of the pathophysiology and clinical management of CVD. The following key findings were obtained: (1) Compared with the lowest eGDR group, the highest eGDR group exhibited a 30.1%, 57.2%, and 47.8% reduction in the risk of AF, HF, and cardiovascular mortality, respectively. eGDR demonstrated a linear relationship with AF and HF; as eGDR increased, the risks of AF and HF progressively decreased. Although eGDR was non-linearly associated with cardiovascular mortality, it exhibited a negative correlation. When eGDR was ≥ 4.46, it showed a protective effect on cardiovascular mortality in diabetic patients. (2) High eGDR was associated with a 27% and 32% reduced risk of AF in intermediate and high genetic risk groups, respectively, a 63%, 55%, and 57% reduced risk of HF in low, intermediate, and high genetic risk groups, respectively, and a 77%, 75%, and 70% reduced risk of cardiovascular mortality in low, intermediate, and high genetic risk groups, respectively. High eGDR could reduce the risk of AF, HF, and cardiovascular mortality in diabetic patients with high genetic susceptibility. (3) Boruta’s algorithm demonstrated that eGDR contributes most significantly to the prediction of AF, HF, and cardiovascular mortality outcomes. (4) Mediation analysis revealed that 10.7%, 7.9%, and 10.3% of the relationships between eGDR and AF, HF, and cardiovascular mortality, respectively, among individuals with diabetes were mediated by eGFR.
The impact of IR on the cardiovascular system is multidimensional. IR reduces cellular sensitivity to insulin, rendering glucose ineffective for cellular use, and prolongs hyperglycaemic states, which may cause a range of vascular lesions. This leads to lipid deposition on vascular walls and accelerates the progression of atherosclerosis. Some reports indicate that IR represents a chronic inflammatory state (21, 22). In the pathology of IR, adipose tissue secretes various inflammatory factors such as interleukin-6 (IL-6) and tumour necrosis factor-α (TNF-α) (23, 24). These inflammatory factors activate inflammatory cells such as monocytes and T-lymphocytes, which adhere to vascular endothelial cells and migrate to the subendothelium, where they phagocytose lipids to form foam cells, an early event in atherosclerotic plaque formation (25). Additionally, inflammatory factors inhibit the synthesis of nitric oxide, an important vasodilator, and a decrease in its synthesis leads to vascular endothelial dysfunction, promoting vasoconstriction and platelet aggregation, further increasing the risk of CVD (26).
A clear correlation between IR and hypertension has been demonstrated (27). On the one hand, insulin can directly act on renal tubules to increase sodium reabsorption; on the other hand, IR activates the sympathetic nervous system, increases catecholamine secretion, stimulates the renin-angiotensin-aldosterone system (RAAS), and contributes to increased aldosterone secretion (28, 29). These changes lead to sodium and water retention, resulting in high blood pressure. Chronic high blood pressure increases cardiac afterload, leading to myocardial hypertrophy, ventricular remodelling, and an increased risk of AF, HF, and cardiovascular mortality (30, 31). In addition, IR and insulin secretion are closely associated with the pancreas and gastrointestinal system (32, 33). Previous study had demonstrated a significant link between gastrointestinal disorders and CVD, particularly AF. Despite their apparent differences as distinct pathological phenomena, they in fact share common pathogenic mechanisms, thereby establishing interconnections (34). We found that, among diabetic patients with a BMI ≥ 30 kg/m2, an increase in eGDR was associated with a decreased risk of AF. Previous studies have demonstrated that obesity, IR, and excise are associated with the occurrence of AF, and however, the interrelationship among these three factors requires further investigation (35–37).
In past clinical practice, fasting plasma glucose (FPG), triglyceride-glucose index (TyG index), metabolic score for insulin resistance (METS-IR), and homeostasis model assessment of insulin resistance (HOMA-IR) were commonly used to evaluate IR (38–41). The TyG index was positively correlated with the incidence of CVD, all-cause mortality, and cardiovascular mortality in the general population (42). Previous studies have shown that METS-IR has important predictive value for coronary heart disease, hypertension, coronary artery calcification, diabetes, and non-alcoholic fatty liver disease, and higher levels of METS-IR indicate a higher degree of IR, placing individuals at higher risk of metabolic disorders (38, 43). HOMA-IR is calculated as (fasting plasma glucose × fasting plasma insulin)/22.5, serving as a quantifiable measure of IR (44). However, the complicated calculation formula and inconvenient detection method hindered its widespread use, and risk assessment for CVD in patients with diabetes was mainly based on traditional risk factors such as age, blood pressure, lipids, and blood glucose, which often do not comprehensively reflect the patient’s cardiovascular risk status. Several previous findings indicate that eGDR impacts the prognosis of CVD (45–47). Therefore, the potential application value of eGDR deserves in-depth exploration. Xing et al. (48) found that eGDR serves as a potential biomarker for CVD risk assessment as a comprehensive indicator of glucose metabolic status. A nationwide prospective cohort study in China indicated that sustained low eGDR was associated with an increased risk of new-onset CVD (HR = 2.51, 95% CI: 2.04-3.09) in middle-aged and elderly populations (49). Besides, recent studies suggested that low eGDR was associated with an increased risk of stroke (HR = 0.77, 95% CI: 0.69-0.87) and cardiovascular mortality (HR = 0.82, 95% CI: 0.70-0.95) in individuals with type 2 diabetes (50). Li et al. (51) found that eGDR could be a potential biomarker for predicting AF recurrence after ablation, and participants with an eGDR ≥ 8 mg/kg/min had a lower risk of AF recurrence than those with an eGDR < 4 mg/kg/min (HR = 0.28, 95% CI: 0.18-0.42).
Peng et al. proved that eGDR could be a promising tool for predicting cardiovascular comorbidities and mortality, and non-diabetic chronic kidney disease (CKD) patients with high eGDR levels had lower risks of CVD events (HR = 0.641, 95% CI: 0.559-0.734) (18). Therefore, we further investigated the association of eGDR with AF, HF, and cardiovascular mortality using mediation analysis and found that eGDR influences AF, HF, and cardiovascular mortality through eGFR (10.7%, 7.9%, and 10.3%, respectively) in patients with diabetes. However, how eGDR interacts with eGFR to influence the prognosis of cardiovascular disease remains unclear. The kidney plays a critical role in maintaining water-electrolyte balance and excreting metabolic wastes from the body. Sodium and water retention increases cardiac preload, places cardiomyocytes under long-term stress, and promotes myocardial remodelling (52, 53). Electrolyte disturbances, such as abnormalities in potassium and magnesium ion concentrations, affect the electrophysiological stability of cardiomyocytes and predispose individuals to atrial fibrillation (54). Activation of the RAAS is a key component of renal dysfunction affecting the cardiovascular system (55). After RAAS activation, angiotensin II production increases, causing vasoconstriction and elevated blood pressure, which further aggravates cardiac afterload and stimulates cardiomyocytes to become hypertrophic and fibrotic, accelerating the progression of CVD (56).
The latest research has shown that eGDR is inversely associated with the incidence of myocardial infarction (MI), HF, AF, and ischemic stroke in the general population, and it is believed that eGDR serves as a more valuable predictive indicator than TyG, TyG-WC, TyG-BMI, TyG-WHtR, TG/HDL-C, and METS-IR for CVD events in clinical practice (57). Zhang et al. found (58) that eGDR may have a linear and robust association with prevalent HF (P for non-linearity = 0.313) and a potential value in reflecting the prevalence of HF in the general population (AUC = 0.873, P = 0.008). Our conclusions are consistent with those of the previous study. However, we extended our analysis to examine the relationship between eGDR and AF, HF, and cardiovascular mortality using polygenic risk scores (PRS), Boruta’s algorithm, and mediation analysis, conducting a precise and systematic evaluation of the predictive value of eGDR for these diseases. We found that high eGDR could reduce the risk of AF, HF, and cardiovascular mortality in individuals with higher genetic risk among diabetic patients. However, these associations were not significant for AF in individuals with low genetic risk. This may result from a synergistic interaction between genes and the metabolic environment, and the causal relationship between eGDR and AF requires further in-depth studies. Integration of eGDR and PRS may optimize cardiovascular risk stratification. In individuals with high PRS, early monitoring of eGDR and intervention of IR may hold significant value in the prevention of CVD. The PRS data originated from the UK Biobank (UKB), and 31,375 cases were included. Therefore, we believe that the application of eGDR in predicting the risk of AF, HF, and cardiovascular mortality in patients with diabetes has high credibility.
Strengths and limitations
There were some limitations to this study. First, although the sample size reflects the research question to some extent, it was still relatively limited and may not cover all possible clinical situations and population characteristics, potentially introducing bias into the study results. Larger multi-centre studies are needed in the future to further validate and refine our findings, improving the reliability and universality of the findings. Second, this study was a observational prospective cohort study, and although we attempted to control for confounding factors, there may still be unmeasured or incompletely corrected factors that could affect the relationship between eGDR and CVD outcomes. Additionally, the calculation of eGDR in this study was based on specific formulas and laboratory indices, and different testing methods may have certain effects on eGDR values. Finally, the participants were predominantly from European populations, limiting the consistency and comparability with other populations. Nevertheless, it retains a certain degree of reference value.
Conclusions
In conclusion, despite certain limitations in this study, the identification of the negative correlation between eGDR and the risks of AF, HF, and cardiovascular mortality among diabetic participants in the UKB holds great significance. eGDR has shown remarkable potential in predicting these critical cardiovascular outcomes in diabetic patients. In the future, it will be necessary to further investigate its underlying molecular mechanisms and conduct large-scale, multi-centre, prospective clinical studies to comprehensively explore the value of eGDR in the diagnosis, treatment, and prognosis of CVD. This will provide stronger evidence for the precise prevention and management of CVD in patients with diabetes.
Data availability statement
The datasets presented in this study can be found in online repositories. The names of the repository/repositories and accession number(s) can be found below: https://www.ukbiobank.ac.uk/, 106027.
Ethics statement
The studies involving humans were approved by UKB has approval from the North West Multi-centre Research Ethics Committee (MREC) as a Research Tissue Bank (RTB) approval. Therefore, researchers do not require separate ethical clearance and can operate under the RTB approval. The studies were conducted in accordance with the local legislation and institutional requirements. Written informed consent for participation in this study was provided by the participants’ legal guardians/next of kin.
Author contributions
ZT: Data curation, Formal Analysis, Writing – original draft. YL: Investigation, Methodology, Supervision, Writing – review & editing. LL: Data curation, Formal Analysis, Writing – original draft. SL: Investigation, Supervision, Validation, Writing – review & editing. XX: Investigation, Supervision, Validation, Writing – review & editing. XL: Conceptualization, Project administration, Resources, Supervision, Writing – review & editing. HR: Conceptualization, Project administration, Supervision, Writing – review & editing, Resources.
Funding
The author(s) declare that no financial support was received for the research and/or publication of this article.
Acknowledgments
The authors express their gratitude to the participants and staff of the UK Biobank for their invaluable contributions to this study. This research has been conducted using the UK Biobank Resource under Application Number 106027.
Conflict of interest
The authors declare that the research was conducted in the absence of any commercial or financial relationships that could be construed as a potential conflict of interest.
Generative AI statement
The author(s) declare that no Generative AI was used in the creation of this manuscript.
Publisher’s note
All claims expressed in this article are solely those of the authors and do not necessarily represent those of their affiliated organizations, or those of the publisher, the editors and the reviewers. Any product that may be evaluated in this article, or claim that may be made by its manufacturer, is not guaranteed or endorsed by the publisher.
Supplementary material
The Supplementary Material for this article can be found online at: https://www.frontiersin.org/articles/10.3389/fendo.2025.1579836/full#supplementary-material
References
1. Global regional, national burden of diabetes. From 1990 to 2021, with projections of prevalence to 2050: a systematic analysis for the global burden of Disease Study 2021. Lancet. (2023) 402:203–34. doi: 10.1016/S0140-6736(23)01301-6
2. Gyldenkerne C, Mortensen MB, Kahlert J, Thrane PG, Warnakula Olesen KK, Sørensen HT, et al. 10-year cardiovascular risk in patients with newly diagnosed type 2 diabetes mellitus. J Am Coll Cardiol. (2023) 82:1583–94. doi: 10.1016/j.jacc.2023.08.015
3. Wong ND and Sattar N. Cardiovascular risk in diabetes mellitus: epidemiology, assessment and prevention. Nat Rev Cardiol. (2023) 20:685–95. doi: 10.1038/s41569-023-00877-z
4. Azarpazhooh MR, Najafi F, Darbandi M, Kiarasi S, Oduyemi T, and Spence JD. Triglyceride/high-density lipoprotein cholesterol ratio: A clue to metabolic syndrome, insulin resistance, and severe atherosclerosis. Lipids. (2021) 56:405–12. doi: 10.1002/lipd.12302
5. Khalili D, Khayamzadeh M, Kohansal K, Ahanchi NS, Hasheminia M, Hadaegh F, et al. Are HOMA-IR and HOMA-B good predictors for diabetes and pre-diabetes subtypes? BMC Endocr Disord. (2023) 23:39. doi: 10.1186/s12902-023-01291-9
6. Flood D, Brant LCC, and Sussman JB. The triglyceride glucose index and cardiovascular disease outcomes. Lancet Healthy Longev. (2023) 4:e2–3. doi: 10.1016/S2666-7568(22)00269-0
7. Zhou Y, Xie Y, Du L, Dong J, and He K. Metabolic score for insulin resistance as a predictor of mortality in heart failure with preserved ejection fraction: results from a multicenter cohort study. Diabetol Metab Syndr. (2024) 16:220. doi: 10.1186/s13098-024-01463-0
8. Karamanakos G, Barmpagianni A, Kapelios CJ, Kountouri A, Bonou M, Makrilakis K, et al. The association of insulin resistance measured through the estimated glucose disposal rate with predictors of micro-and macrovascular complications in patients with type 1 diabetes. Prim Care Diabetes. (2022) 16:837–43. doi: 10.1016/j.pcd.2022.10.003
9. Liao J, Wang L, Duan L, Gong F, Zhu H, Pan H, et al. Association between estimated glucose disposal rate and cardiovascular diseases in patients with diabetes or prediabetes: a cross-sectional study. Cardiovasc Diabetol. (2025) 24:13. doi: 10.1186/s12933-024-02570-y
10. Zhang Q, Xiao S, Jiao X, and Shen Y. The triglyceride-glucose index is a predictor for cardiovascular and all-cause mortality in CVD patients with diabetes or pre-diabetes: evidence from NHANES 2001-2018. Cardiovasc Diabetol. (2023) 22:279. doi: 10.1186/s12933-023-02030-z
11. Lam-Chung CE, Martínez Zavala N, Ibarra-Salce R, Pozos Varela FJ, Mena Ureta TS, Berumen Hermosillo F, et al. Association of estimated glucose disposal rate and chronic diabetic complications in patients with type 1 diabetes. Endocrinol Diabetes Metab. (2021) 4:e00288. doi: 10.1002/edm2.288
12. Nyström T, Holzmann MJ, Eliasson B, Svensson AM, and Sartipy U. Estimated glucose disposal rate predicts mortality in adults with type 1 diabetes. Diabetes Obes Metab. (2018) 20:556–63. doi: 10.1111/dom.13110
13. Zhang Z, Zhao L, Lu Y, Xiao Y, and Zhou X. Insulin resistance assessed by estimated glucose disposal rate and risk of incident cardiovascular diseases among individuals without diabetes: findings from a nationwide, population based, prospective cohort study. Cardiovasc Diabetol. (2024) 23:194. doi: 10.1186/s12933-024-02256-5
14. Domingues-Hajj PMS, Gomes PM, Magalhães PKR, and Maciel LMZ. Assessment of cardiometabolic risk factors and insulin sensitivity by hyperinsulinemic-euglycemic clamp in resistance to thyroid hormone β Syndrome. Thyroid. (2024) 34:1038–46. doi: 10.1089/thy.2024.0132
15. Chen X, Li A, and Ma Q. Association of estimated glucose disposal rate with metabolic syndrome prevalence and mortality risks: a population-based study. Cardiovasc Diabetol. (2025) 24:38. doi: 10.1186/s12933-025-02599-7
16. Antuna-Puente B, Disse E, Rabasa-Lhoret R, Laville M, Capeau J, and Bastard JP. How can we measure insulin sensitivity/resistance? Diabetes Metab. (2011) 37:179–88. doi: 10.1016/j.diabet.2011.01.002
17. Feng X, Liu Y, Yang J, Zhou Z, Yang S, Zhou Y, et al. Evaluation of estimated glucose disposal rate with neutrophil-to-lymphocyte ratio integrated for prognosticating adverse cardiovascular and cerebrovascular events and risk stratification among acute coronary syndrome with type 2 diabetes mellitus following percutaneous coronary intervention. J Inflammation Res. (2024) 17:9193–214. doi: 10.2147/JIR.S490790
18. Peng J, Zhang Y, Zhu Y, Chen W, Chen L, Ma F, et al. Estimated glucose disposal rate for predicting cardiovascular events and mortality in patients with non-diabetic chronic kidney disease: a prospective cohort study. BMC Med. (2024) 22:411. doi: 10.1186/s12916-024-03582-x
19. Song J, Ma R, and Yin L. Associations between estimated glucose disposal rate and arterial stiffness and mortality among US adults with non-alcoholic fatty liver disease. Front Endocrinol (Lausanne). (2024) 15:1398265. doi: 10.3389/fendo.2024.1398265
20. Albiñana C, Grove J, McGrath JJ, Agerbo E, Wray NR, Nordentoft M, et al. Leveraging both individual-level genetic data and GWAS summary statistics increases polygenic prediction. Am J Hum Genet. (2021) 108:1001–11. doi: 10.1016/j.ajhg.2021.04.014
21. Olefsky JM and Glass CK. Macrophages, inflammation, and insulin resistance. Annu Rev Physiol. (2010) 72:219–46. doi: 10.1146/annurev-physiol-021909-135846
22. Wu H. Ballantyne cardiovascular mortality. Metabolic Inflammation and Insulin Resistance in Obesity. Circ Res. (2020) 126:1549–64. doi: 10.1161/CIRCRESAHA.119.315896
23. Rosen ED and Kajimura S. Is it time to rethink the relationship between adipose inflammation and insulin resistance? J Clin Invest. (2024) 134:e184663. doi: 10.1172/JCI184663
24. Lee BC and Lee J. Cellular and molecular players in adipose tissue inflammation in the development of obesity-induced insulin resistance. Biochim Biophys Acta. (2014) 1842:446–62. doi: 10.1016/j.bbadis.2013.05.017
25. Wolf D and Ley K. Immunity and inflammation in atherosclerosis. Circ Res. (2019) 124:315–27. doi: 10.1161/CIRCRESAHA.118.313591
26. Cyr AR, Huckaby LV, Shiva SS, and Zuckerbraun BS. Nitric oxide and endothelial dysfunction. Crit Care Clin. (2020) 36:307–21. doi: 10.1016/j.ccc.2019.12.009
27. Hu X, Han P, and Liu Y. Metabolic status and hypertension: the impact of insulin resistance-related indices on blood pressure regulation and hypertension risk. J Am Nutr Assoc. (2025) 10:1–11. doi: 10.1080/27697061.2025.2450711
28. Usui I. Hypertension and insulin resistance in adipose tissue. Hypertens Res. (2023) 46:1478–81. doi: 10.1038/s41440-023-01263-5
29. Das UN. Renin-angiotensin-aldosterone system in insulin resistance and metabolic syndrome. J Transl Int Med. (2016) 4:66–72. doi: 10.1515/jtim-2016-0022
30. Hill MA, Yang Y, Zhang L, Sun Z, Jia G, Parrish AR, et al. Insulin resistance, cardiovascular stiffening and cardiovascular disease. Metabolism. (2021) 119:154766. doi: 10.1016/j.metabol.2021.154766
31. Ormazabal V, Nair S, Elfeky O, Aguayo C, Salomon C, and Zuñiga FA. Association between insulin resistance and the development of cardiovascular disease. Cardiovasc Diabetol. (2018) 17:122. doi: 10.1186/s12933-018-0762-4
32. Takeuchi T, Kubota T, Nakanishi Y, Tsugawa H, Suda W, Kwon AT, et al. Gut microbial carbohydrate metabolism contributes to insulin resistance. Nature. (2023) 621:389–95. doi: 10.1038/s41586-023-06466-x
33. Honzawa N, Fujimoto K, and Kitamura T. Cell autonomous dysfunction and insulin resistance in pancreatic α Cells. Int J Mol Sci. (2019) 20:3699. doi: 10.3390/ijms20153699
34. Gesualdo M, Scicchitano P, Carbonara S, Ricci G, Principi M, Ierardi E, et al. The association between cardiac and gastrointestinal disorders: causal or casual link? J Cardiovasc Med (Hagerstown). (2016) 17:330–8. doi: 10.2459/JCM.0000000000000351
35. D’Ascenzi F, Cameli M, Ciccone MM, Maiello M, Modesti PA, Mondillo S, et al. The controversial relationship between exercise and atrial fibrillation: clinical studies and pathophysiological mechanisms. J Cardiovasc Med (Hagerstown). (2015) 16(12):802–10. doi: 10.2459/JCM.0000000000000211
36. Aymond JD, Sanchez AM, Castine MR, Bernard ML, Khatib S, Hiltbold AE, et al. Dual vs single cardioversion of atrial fibrillation in patients with obesity: A randomized clinical trial. JAMA Cardiol. (2024) 9:641–8. doi: 10.1001/jamacardio
37. Lee Y, Cha SJ, Park JH, Shin JH, Lim YH, Park HC, et al. Association between insulin resistance and risk of atrial fibrillation in non-diabetics. Eur J Prev Cardiol. (2020) 27:1934–41. doi: 10.1177/2047487320908706
38. Bello-Chavolla OY, Almeda-Valdes P, Gomez-Velasco D, Viveros-Ruiz T, Cruz-Bautista I, Romo-Romo A, et al. METS-IR, a novel score to evaluate insulin sensitivity, is predictive of visceral adiposity and incident type 2 diabetes. Eur J Endocrinol. (2018) 178:533–44. doi: 10.1530/EJE-17-0883
39. Khan S, Ahmad S, Khan M, Aqil F, Khan MY, and Khan MS. Artificial intelligence derived categorizations significantly improve HOMA IR/β indicators: Combating diabetes through cross-interacting drugs. Comput Biol Med. (2024) :179:108848. doi: 10.1016/j.compbiomed.2024.108848
40. Lee YC, Lee JW, and Kwon YJ. Comparison of the triglyceride glucose (TyG) index, triglyceride to high-density lipoprotein cholesterol (TG/HDL-C) ratio, and metabolic score for insulin resistance (METS-IR) associated with periodontitis in Korean adults. Ther Adv Chronic Dis. (2022) 13:20406223221122671. doi: 10.1177/20406223221122671
41. Tohidi M, Baghbani-Oskouei A, Ahanchi NS, Azizi F, and Hadaegh F. Fasting plasma glucose is a stronger predictor of diabetes than triglyceride-glucose index, triglycerides/high-density lipoprotein cholesterol, and homeostasis model assessment of insulin resistance: Tehran Lipid and Glucose Study. Acta Diabetol. (2018) 55:1067–74. doi: 10.1007/s00592-018-1195-y
42. He HM, Xie YY, Chen Q, Li YK, Li XX, Mu YK, et al. The additive effect of the triglyceride-glucose index and estimated glucose disposal rate on long-term mortality among individuals with and without diabetes: a population-based study. Cardiovasc Diabetol. (2024) 23:307. doi: 10.1186/s12933-024-02396-8
43. Duan M, Zhao X, Li S, Miao G, Bai L, Zhang Q, et al. Metabolic score for insulin resistance (METS-IR) predicts all-cause and cardiovascular mortality in the general population: evidence from NHANES 2001-2018. Cardiovasc Diabetol. (2024) 23:243. doi: 10.1186/s12933-024-02334-8
44. Tahapary DL, Pratisthita LB, Fitri NA, Marcella C, Wafa S, Kurniawan F, et al. Challenges in the diagnosis of insulin resistance: Focusing on the role of HOMA-IR and Tryglyceride/glucose index. Diabetes Metab Syndr. (2022) 16(8):102581. doi: 10.1016/j.dsx.2022.102581
45. Zhu B, Cao C, Liu W, Liu Y, Luo Y, and Peng D. The predictive value of estimated glucose disposal rate for all-cause and cardiovascular mortality in the US non-diabetic population aged ≥60 years: A population-based cohort study. Diabetes Metab Syndr. (2024) 19:103182. doi: 10.1016/j.dsx.2024.103182
46. Wang H, Zhou Z, Liu X, and Chen Y. Gender differences in the association between insulin resistance assessed by estimated glucose disposal rate and the risk of all-cause and cardiovascular deaths in adults without diabetes. Diabetes Res Clin Pract. (2025) 219:111966. doi: 10.1016/j.diabres.2024.111966
47. Kim MJ, Cho YK, Kim EH, Lee MJ, Lee WJ, Kim HK, et al. Association between estimated glucose disposal rate and subclinical coronary atherosclerosis. Nutr Metab Cardiovasc Dis. (2025) 35:103686. doi: 10.1016/j.numecd.2024.07.004
48. Xing D, Xu J, Weng X, and Weng X. Correlation between estimated glucose disposal rate, insulin resistance, and cardiovascular mortality among individuals with metabolic syndrome: a population-based analysis, evidence from NHANES 1999-2018. DiabetolMetab Syndr. (2025) 17:11. doi: 10.1186/s13098-024-01574-8
49. Yan L, Zhou Z, Wu X, Qiu Y, Liu Z, Luo L, et al. Association between the changes in the estimated glucose disposal rate and new-onset cardiovascular disease in middle-aged and elderly individuals: A nationwide prospective cohort study in China. Diabetes Obes Metab. (2025) 27(4):1859–67. doi: 10.1111/dom.16179
50. Zabala A, Darsalia V, Lind M, Svensson AM, Franzén S, Eliasson B, et al. Estimated glucose disposal rate and risk of stroke and mortality in type 2 diabetes: a nationwide cohort study. Cardiovasc Diabetol. (2021) 20:202. doi: 10.1186/s12933-021-01394-4
51. Li X, Zhou Z, Xia Z, Dong Y, Chen S, Zhan F, et al. Association between estimated glucose disposal rate and atrial fibrillation recurrence in patients undergoing radiofrequency catheter ablation: a retrospective study. Eur J Med Res. (2024) 29:325. doi: 10.1186/s40001-024-01911-7
52. Rossing P, Hansen TW, and Kümler T. Cardiovascular and non-renal complications of chronic kidney disease: Managing risk. Diabetes Obes Metab. (2024) 26 Suppl 6:13–21. doi: 10.1111/dom.15747
53. Kotwal SS and Perkovic V. Kidney disease as a cardiovascular disease priority. Circulation. (2024) 150:975–7. doi: 10.1161/CIRCULATIONAHA.124.068242
54. Bansal N, Xie D, Tao K, Chen J, Deo R, Horwitz E, et al. Atrial fibrillation and risk of ESRD in adults with CKD. Clin J Am Soc Nephrol. (2016) 11:1189–96. doi: 10.2215/CJN.10921015
55. Lytvyn Y, Burns KD, Testani JM, Lytvyn A, Ambinathan JPN, Osuntokun O, et al. Renal hemodynamics and renin-angiotensin-aldosterone system profiles in patients with heart failure. J Card Fail. (2022) 28:385–93. doi: 10.1016/j.cardfail.2021.08.015
56. Maryam, Varghese TP, and B T. Unraveling the complex pathophysiology of heart failure: insights into the role of renin-angiotensin-aldosterone system (RAAS) and sympathetic nervous system (SNS). Curr Probl Cardiol. (2024) 49:102411. doi: 10.1016/j.cpcardiol.2024.102411
57. Huang H, Xiong Y, Zhou J, Tang Y, Chen F, Li G, et al. The predictive value of estimated glucose disposal rate and its association with myocardial infarction, heart failure, atrial fibrillation and ischemic stroke. Diabetes Obes Metab. (2025) 27(3):1359–68. doi: 10.1111/dom.16132
Keywords: estimated glucose disposal rate, cardiovascular disease, atrial fibrillation, heart failure, cardiovascular mortality, patients with diabetes, UK Biobank
Citation: Tan Z, Liu Y, Liu L, Li S, Xue X, Li X and Ren H (2025) Association of estimated glucose disposal rate with atrial fibrillation, heart failure and cardiovascular mortality in patients with diabetes: a prospective cohort study from the UK Biobank. Front. Endocrinol. 16:1579836. doi: 10.3389/fendo.2025.1579836
Received: 19 February 2025; Accepted: 26 June 2025;
Published: 18 July 2025.
Edited by:
Gaetano Santulli, Albert Einstein College of Medicine, United StatesReviewed by:
Luis Del Carpio-Orantes, Mexican Social Security Institute, MexicoPietro Scicchitano, ASLBari - Azienda Sanitaria Localedella provincia di Bari (ASL BA), Italy
Copyright © 2025 Tan, Liu, Liu, Li, Xue, Li and Ren. This is an open-access article distributed under the terms of the Creative Commons Attribution License (CC BY). The use, distribution or reproduction in other forums is permitted, provided the original author(s) and the copyright owner(s) are credited and that the original publication in this journal is cited, in accordance with accepted academic practice. No use, distribution or reproduction is permitted which does not comply with these terms.
*Correspondence: Hongqiang Ren, cmhxMTk4MEAxNjMuY29t
†These authors have contributed equally to this work