 Yongyan Song
 Youjin Zhang1†
 Xinyu Liu
 Yinquan Ai
 Binger Shen
- 1Central Laboratory, Clinical Medical College & Affiliated Hospital of Chengdu University, Chengdu, Sichuan, China
- 2Clinical Medical College of Chengdu University, Chengdu, Sichuan, China
- 3Department of Cardiology, Clinical Medical College & Affiliated Hospital of Chengdu University, Chengdu, Sichuan, China
Background: The associations between the rs7799039 variant in the promoter region of the leptin gene (LEP) and the rs1137100, rs1137101, and rs1805094 variants in the exons of the leptin receptor gene (LEPR) with leptin levels and glucose-lipid metabolism markers have been examined across various populations. However, the findings have been inconsistent and, at times, contradictory.
Methods: Eligible studies were identified through a search of PubMed, Google Scholar, Embase, Cochrane Library, Web of Science, CNKI, Wanfang, and VIP databases. A random-effects model was employed, and the standardized mean difference (SMD) with 95% confidence interval (95% CI) was calculated to assess the differences in leptin levels and glucose-lipid metabolism markers between subjects with different genotypes of the rs7799039, rs1137100, rs1137101, or rs1805094 variants. Heterogeneity among studies was evaluated using Cochran’s Q-test, based on the χ² statistic. Publication bias was assessed using Begg’s test.
Results: A total of 33 studies (10,471 subjects) for the rs7799039 variant, 12 studies (6,595 subjects) for the rs1137100 variant, 48 studies (18,890 subjects) for the rs1137101 variant, and 20 studies (5,051 subjects) for the rs1805094 variant were included in the pooled analyses. A significant association was found for A-allele carriers of LEP rs7799039 variant, who exhibited lower levels of leptin (SMD = -0.18 ng/mL, 95% CI = -0.31 to -0.04 ng/mL, p = 0.01), and higher levels of insulin (SMD = 0.22 μmol/μL, 95% CI = 0.07 to 0.37 μmol/μL, p < 0.01), and HOMA-IR (SMD = 0.26, 95% CI = 0.08 to 0.43, p < 0.01) compared to GG homozygotes. For LEPR rs1137100, rs1137101, and rs1805094 variants, no significant associations with leptin or glucose-lipid metabolism markers were observed in the pooled meta-analyses of the total population. However, significant associations were detected between the rs1137101 and rs1805094 variants and leptin or glucose-lipid metabolism markers in subgroup analyses stratified by sex, ethnicity, and health status.
Conclusions: The meta-analysis suggests that the A allele of LEP rs7799039 variant is associated with an increased risk of insulin resistance, potentially through its effect on reducing leptin levels. LEPR rs1137101 and rs1805094 variants show weak associations with leptin levels and glucose-lipid metabolism markers.
Systematic review registration: , identifier CRD42025373543.
Introduction
Glycolipid metabolic disorders, including abnormalities in lipid and glucose metabolism, represent a significant risk factor for the development of diabetes and cardiovascular disease (CVD) (1, 2). These disorders are responsible for at least 50% of the population-attributable risk for CVD, making them a key focus in cardiovascular health research (2). Gene variants, which refer to variations in DNA sequences, play a crucial role in the onset, progression, and severity of glycolipid metabolic disorders (3–10). These genetic variations can affect the expression of the genes implicated in lipid and glucose metabolism, influencing individual susceptibility to conditions such as hyperglycemia, hyperlipidemia, and metabolic syndrome (5, 9). Among the most widely studied variants in relation to glycolipid metabolic disorders are those located in the genes of adipokines and their receptors.
Leptin is an important member of adipokines. It is often referred to as the “satiety hormone” because it helps signal the brain to reduce appetite and increase energy expenditure when fat stores are sufficient (11). The gene encoding leptin is called LEP and is located on chromosome 7 in humans. The rs7799039 variant, situated in the 5’ promoter region of the LEP gene, is formed by a single-nucleotide variation from guanine (G) to adenine (A). The A allele of rs7799039 has been associated with an increased risk of glycolipid metabolic disorders (12, 13). Leptin exerts its physiological function by combining with the leptin receptor (LEPR), which is primarily located in the hypothalamus of the brain but is also found in other tissues throughout the body. The LEPR gene is located on chromosome 1 at position 1p31. Three missense mutations in the LEPR gene—rs1137100 (Lys109Arg), rs1137101 (Gln223Arg), and rs1805094 (Lys656Asn)—have been linked to a higher risk of glycolipid metabolic disorders (14–16).
However, there are numerous inconsistencies and contradictions in the published data regarding these four polymorphic loci and glucose-lipid metabolism markers. Some studies have shown that the A allele of the rs7799039 variant is associated with significantly higher levels of glucose (17), insulin (18), homeostasis model assessment of insulin resistance (HOMA-IR) (18), triglycerides (19), total cholesterol (TC) (20), low-density lipoprotein cholesterol (LDL-C) (21), and a lower level of high-density lipoprotein cholesterol (HDL-C) (22), whereas other studies have not supported these findings (23, 24). Additionally, there is significant inconsistency in the published data concerning the relationships between the rs1137100, rs1137101, and rs1805094 variants and glucose-lipid metabolism markers. Some studies have indicated that the A allele of rs1137100, G allele of rs1137101, and C allele of rs1805094 are linked to significantly higher levels of glucose (25–27), insulin (25, 26, 28), HOMA-IR (14, 26, 29), triglycerides (30–32), TC (26, 29, 30), LDL-C (29, 30, 33), and lower levels of HDL-C (26, 28, 34), while other studies have found no significant associations between these variants and glucose-lipid metabolism markers (35–37).
In this study, a systematic review and meta-analysis was conducted using previous publications to explore the relationships between the rs7799039, rs1137100, rs1137101, or rs1805094 variants and leptin and glucose-lipid metabolism markers. The results offer an opportunity to unveil the interrelationships among these variants, leptin, glycolipid metabolic disorders, and CVD.
Methods
Literature search strategy
This meta-analysis was registered in PROSPERO (CRD42025373543) and was carried out in accordance with the Preferred Reporting Items for Systematic Reviews and Meta-Analyses (PRISMA) guidelines. A thorough search was conducted across multiple databases, including PubMed, Google Scholar, Embase, Cochrane Library, Web of Science, CNKI, Wanfang, and VIP, from their inception up until February 2025. The search utilized the following keywords: (“leptin” or “LEP”) and (“leptin receptor” or “LEPR”) and (“glucose” or “insulin” or “homeostasis model assessment of insulin resistance” or “HOMA-IR”) and (“triglycerides” or “total cholesterol” or “low-density lipoprotein cholesterol” or “high-density lipoprotein cholesterol” or “TC” or “LDL-C” or “HDL-C”). The variables considered in this meta-analysis include leptin, glucose metabolism markers (glucose, insulin, and HOMA-IR) and lipid metabolism markers (triglycerides, TC, LDL-C, and HDL-C). All studies that reported on the associations between the rs7799039, rs1137100, rs1137101, or rs1805094 variants and any of the eight indexes were reviewed and assessed.
Inclusion and exclusion criteria
Inclusion criteria: 1) The sample size and genotype distribution were clearly and accurately reported; 2) At least one of the eight variables (leptin, glucose, insulin, HOMA-IR, triglycerides, TC, LDL-C, and HDL-C) was provided; 3) Data were presented as mean ± standard deviation or mean ± standard error. Exclusion criteria: 1) Articles published more than once; 2) Incomplete data; 3) Case reports; 4) Conference abstracts; 5) Animal studies.
Data extraction
Data were independently extracted by two reviewers. The information collected from each study included the first author’s name, year of publication, ethnicity, age, gender, health status, sample size, and mean ± standard deviation/standard error by genotype. If standard error was provided, standard deviation was calculated. The units for the indexes were ng/mL (leptin), μmol/μL (insulin), and mg/dL (glucose, triglycerides, TC, LDL-C, and HDL-C), with unit conversions made where other units were used. The data were thoroughly checked for accuracy, and any discrepancies were resolved through group discussion.
Meta-analysis
The meta-analysis was conducted using the STATA software package version 10.1 (STATA, College Station, TX, USA). A dominant model was applied since most of the studies included in the analysis presented results in a dominant fashion (i.e., [AA + AG] vs. GG for rs7739039, [GG + AG] vs. AA for rs1137100, [GG + AG] vs. AA for rs1137101, and [CC + CG] vs. GG for rs1805094). If a study contained multiple subgroups (e.g., based on gender, age, ethnicity, or health condition), each subgroup was treated as an independent comparison in the meta-analysis. Subgroup analyses were performed with at least three comparisons to ensure sufficient statistical power. The standardized mean difference (SMD) and 95% confidence interval (95% CI) were used to evaluate differences in leptin and glucose-lipid metabolism markers between the genotypes of the rs7799039, rs1137100, rs1137101, or rs1805094 variants. A random-effects model was chosen for the meta-analysis as it tends to provide more conservative results than the fixed-effects model. Heterogeneity among studies was assessed using Cochran’s x2-based Q-statistic test, and Galbraith plots were employed to identify potential sources of heterogeneity. Subgroup analyses were carried out, with subgroups categorized by gender (males and females), age (adults and children/adolescents), ethnicity (Caucasians, Latin Americans, Asians, and Africans), and health condition (overweight/obesity, type 2 diabetes mellitus [T2DM], hypertension, and general/control subjects). Publication bias was evaluated using Begg’s test and visualized through Begg’s funnel plot. If publication bias was detected, the trim-and-fill method was applied to adjust the results. All p-values were two-tailed, with p ≤ 0.05 considered statistically significant.
Results
Characteristics of the enrolled studies
The flow diagram of the literature search is shown in Figure 1. Thirty-three studies, 12 studies, 48 studies and 20 studies were respectively enrolled for the rs7799039, rs1137100, rs1137101 and rs1805094 variants, and the reference list of the included studies is presented in Supplementary Table S1.
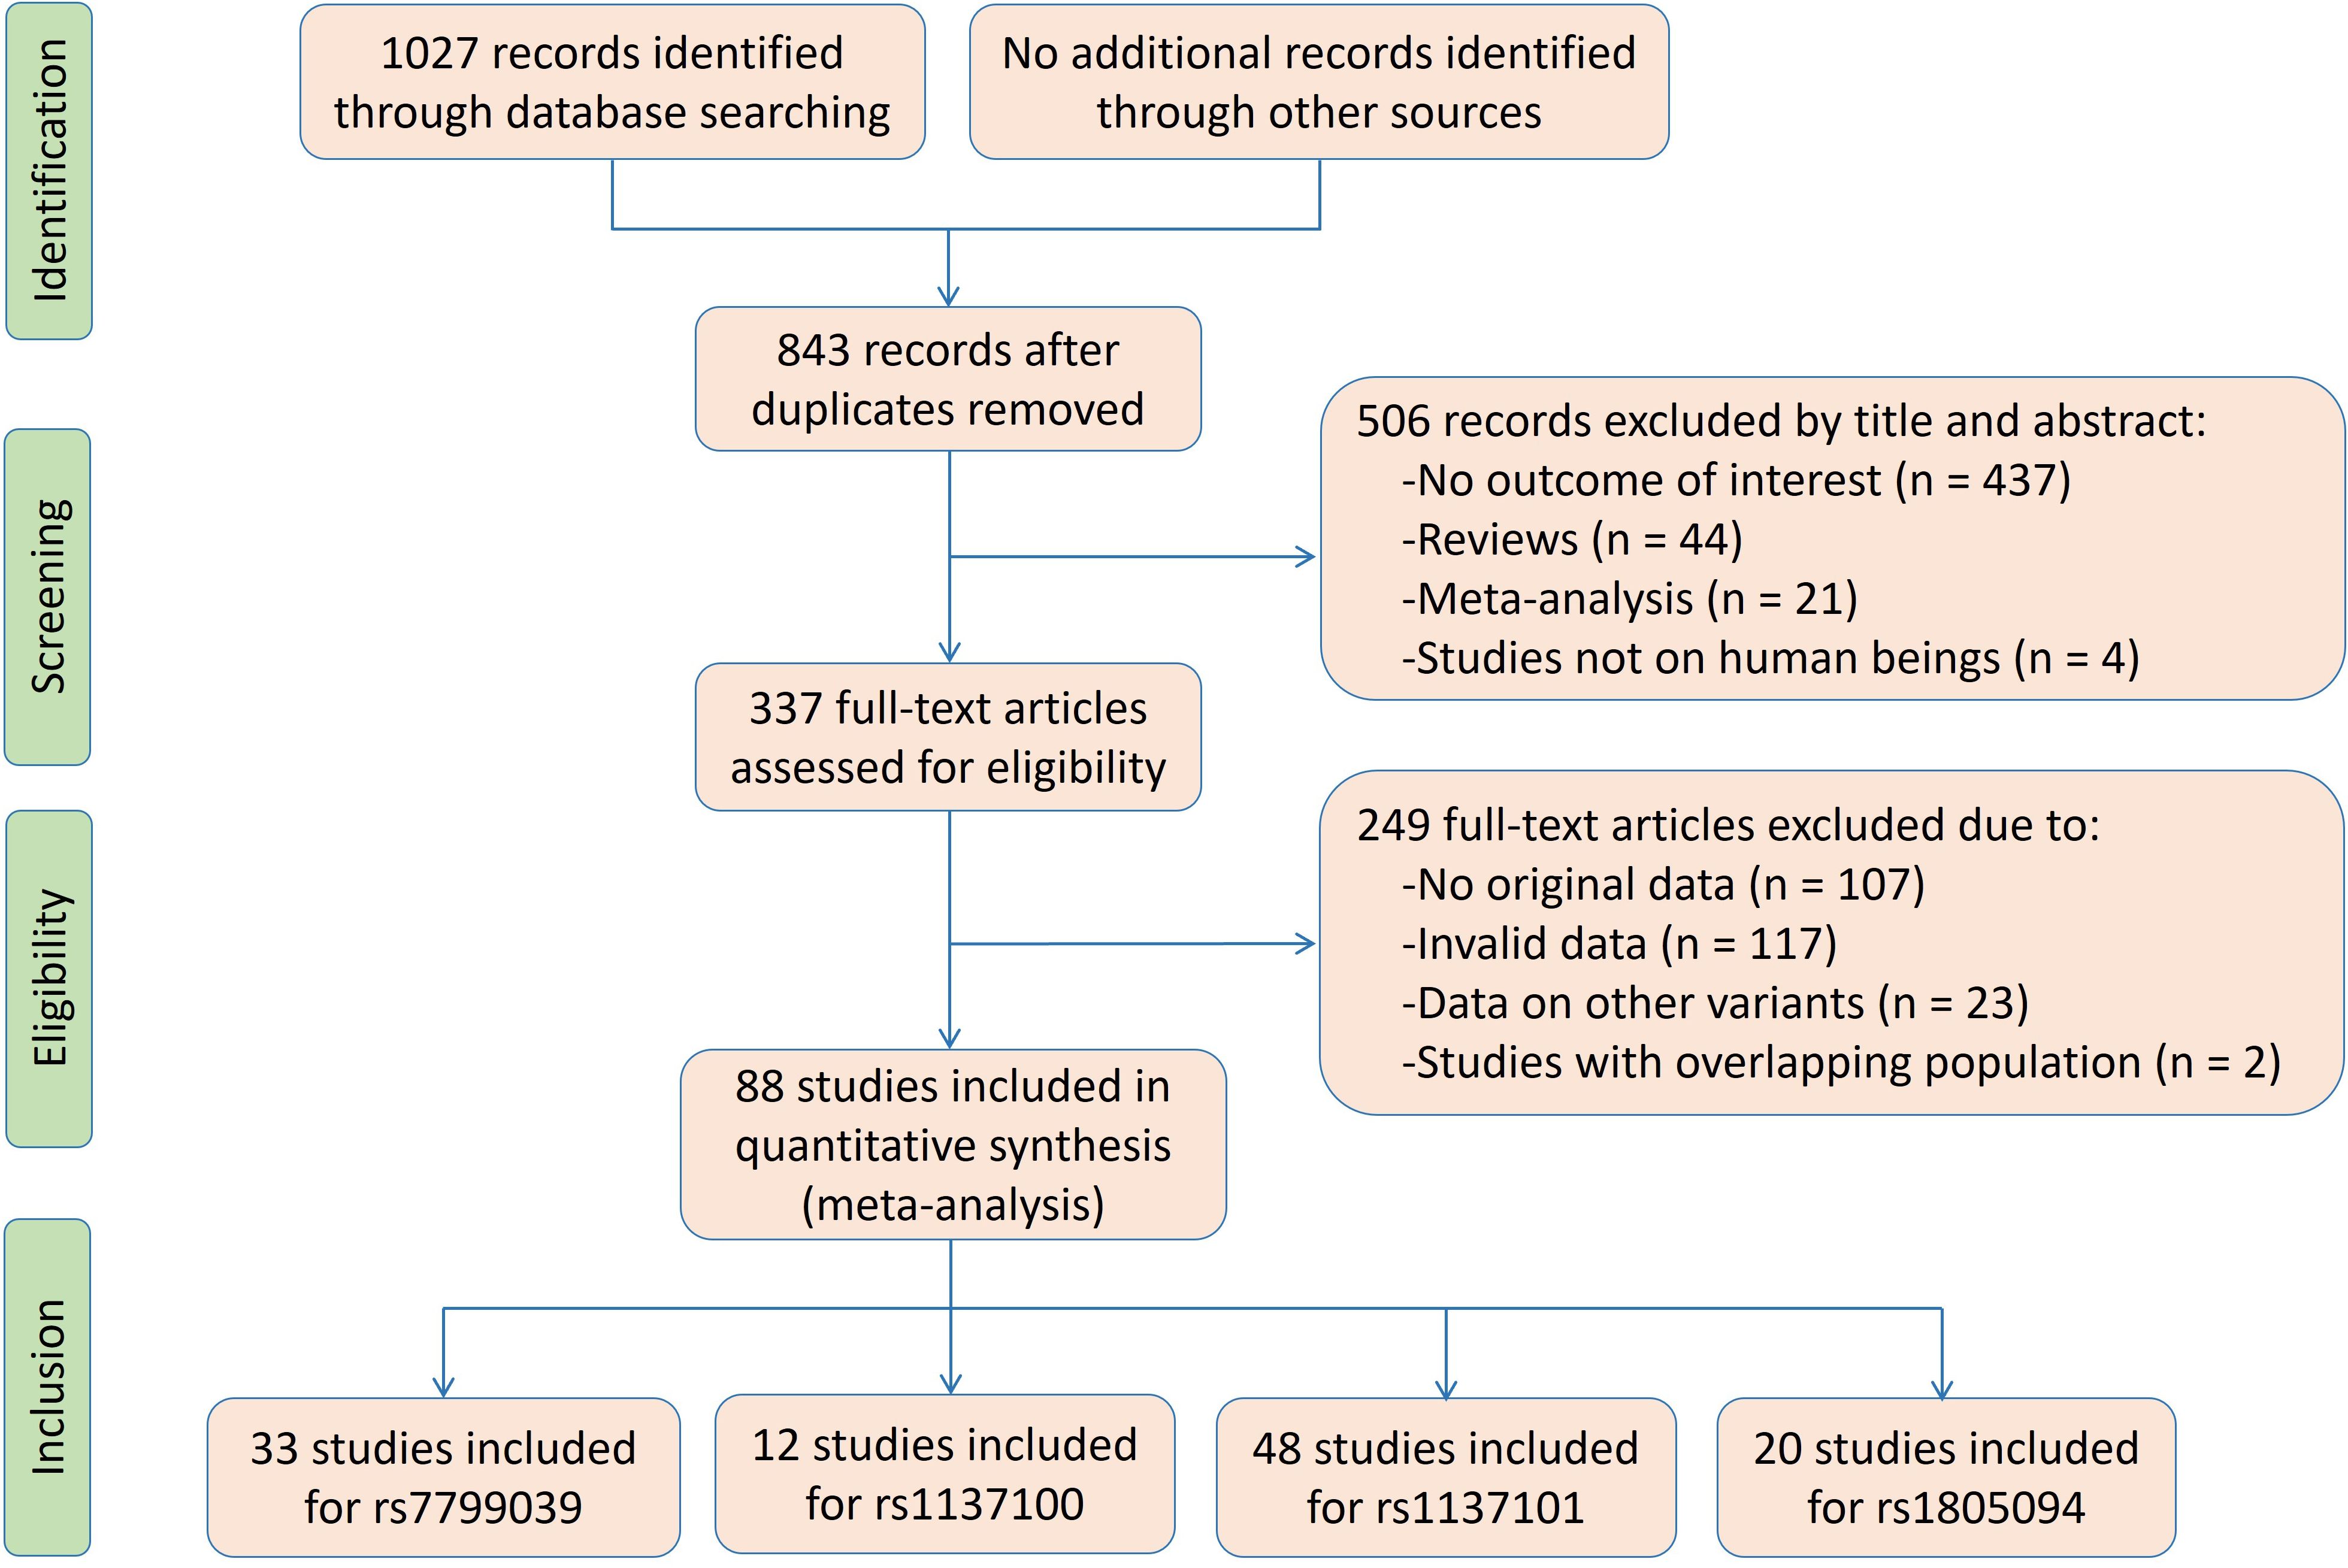
Figure 1. The flow diagram of the literature search.
Characteristics of the enrolled studies for LEP rs7799039 variant are shown in Supplementary Table S2. The enrolled articles were published between 2007 and 2022, and written either in English (28 articles) or in Chinese (5 articles). Five studies, 4 studies, 18 studies and 6 studies involved Caucasians, Latin Americans, Asians and Africans, respectively. Eleven studies and 6 studies involved overweight/obesity, and T2DM, respectively. Four study only involved males, 2 studies only involved females, and the rest studies involved both genders. The subjects from 9 studies were divided into subgroups according to gender, age, ethnicity, and health condition, and each subgroup was treated as an independent comparison. Original data for leptin and glucose-lipid metabolism markers by genotypes of the rs7799039 variant are shown in Supplementary Tables S3 and S4. Seventeen studies, 17 studies, 13 studies, 13 studies, 19 studies, 19 studies, 19 studies and 20 studies presented the data for leptin, glucose, insulin, HOMA-IR, triglycerides, TC, LDL-C and HDL-C, respectively. A total of 43 comparisons were distinguished among the 33 studies included for the rs7799039 variant, and 21 comparisons, 24 comparisons, 20 comparisons, 18 comparisons, 26 comparisons, 26 comparisons, 26 comparisons and 27 comparisons were enrolled to compare the differences in leptin, glucose, insulin, HOMA-IR, triglycerides, TC, LDL-C and HDL-C, respectively. Ten thousand four hundred and seventy-one subjects were included in the meta-analysis for the rs7799039 variant. Among these subjects, 2,914 subjects (27.83%) had the GG genotype, and 7,557 subjects (72.17%) had the AA or AG genotype.
Characteristics of the enrolled studies for LEPR rs1137100 variant are shown in Supplementary Table S5. The enrolled articles were published between 2000 and 2016, and written either in English (9 articles) or in Chinese (3 articles). Eight studies and 4 studies involved Caucasians and Asians, respectively. Four studies, and 2 studies involved overweight/obesity, impaired glucose tolerance, respectively. One study only involved males, 2 studies only involved females, and the rest studies involved both genders. The subjects from 2 studies were divided into subgroups according to gender, age, ethnicity, and health condition, and each subgroup was treated as an independent comparison. Original data for leptin and glucose-lipid metabolism markers by genotypes of the rs1137100 variant are shown in Supplementary Tables S6 and S7. Seven studies, 7 studies, 6 studies, 4 studies, 6 studies, 7 studies, 7 studies and 6 studies presented the data for leptin, glucose, insulin, HOMA-IR, triglycerides, TC, LDL-C and HDL-C, respectively. A total of 14 comparisons were distinguished among the 12 studies included for the rs1137100 variant, and 8 comparisons, 8 comparisons, 7 comparisons, 4 comparisons, 6 comparisons, 7 comparisons, 7 comparisons and 6 comparisons were enrolled to compare the differences in leptin, glucose, insulin, HOMA-IR, triglycerides, TC, LDL-C and HDL-C, respectively. Six thousand five hundred and ninety-five subjects were included in the meta-analysis for the rs1137100 variant. Among these subjects, 1,956 subjects (29.66%) had the AA genotype, and 4,639 subjects (70.34%) had the GG or AG genotype.
Characteristics of the enrolled studies for LEPR rs1137101 variant are shown in Supplementary Table S8. The enrolled articles were published between 1997 and 2022, and written either in English (40 articles) or in Chinese (8 articles). Nineteen studies, 7 studies, 18 studies and 4 studies involved Caucasians, Latin Americans, Asians and Africans, respectively. Nineteen studies, 4 studies, and 4 studies involved overweight/obesity, T2DM and hypertension, respectively. Ten studies only involved males, 12 studies only involved females, and the rest studies involved both genders. The subjects from 18 studies were divided into subgroups according to gender, age, ethnicity, and health condition, and each subgroup was treated as an independent comparison. Original data for leptin and glucose-lipid metabolism markers by genotypes of the rs1137101 variant are shown in Supplementary Tables S9 and S10. Thirty studies, 26 studies, 18 studies, 13 studies, 25 studies, 27 studies, 24 studies and 27 studies presented the data for leptin, glucose, insulin, HOMA-IR, triglycerides, TC, LDL-C and HDL-C, respectively. A total of 69 comparisons were distinguished among the 48 studies included for the rs1137101 variant, and 43 comparisons, 33 comparisons, 23 comparisons, 17 comparisons, 33 comparisons, 35 comparisons, 33 comparisons and 36 comparisons were enrolled to compare the differences in leptin, glucose, insulin, HOMA-IR, triglycerides, TC, LDL-C and HDL-C, respectively. Eighteen thousand eight hundred and ninety subjects were included in the meta-analysis for the rs1137101 variant. Among these subjects, 5,587 subjects (29.58%) had the AA genotype, and 13,303 subjects (70.42%) had the GG or AG genotype.
Characteristics of the enrolled studies for the rs1805094 variant are shown in Supplementary Table S11. The enrolled articles were published between 2000 and 2020, and all of them were written in English. Fifteen studies, 2 studies and 3 studies involved Caucasians, Latin Americans and Asians, respectively. Eleven studies and 3 studies involved overweight/obesity and T2DM, respectively. Six studies only involved males, 6 studies only involved females, and the rest studies involved both genders. The subjects from 9 studies were divided into subgroups according to gender, age, ethnicity, and health condition, and each subgroup was treated as an independent comparison. Original data for leptin and glucose-lipid metabolism markers by genotypes of the rs1805094 variant are shown in Supplementary Tables S12 and S13. Fifteen studies, 11 studies, 11 studies, 7 studies, 12 studies, 11 studies, 11 studies and 11 studies presented the data for leptin, glucose, insulin, HOMA-IR, triglycerides, TC, LDL-C and HDL-C, respectively. A total of 29 comparisons were distinguished among the 20 studies included for the rs1137101 variant, and 21 comparisons, 15 comparisons, 16 comparisons, 9 comparisons, 16 comparisons, 14 comparisons, 15 comparisons and 15 comparisons were enrolled to compare the differences in leptin, glucose, insulin, HOMA-IR, triglycerides, TC, LDL-C and HDL-C, respectively. Five thousand fifty-one subjects were included in the meta-analysis for the rs1137101 variant. Among these subjects, 3,430 subjects (67.91%) had the GG genotype, and 1,621 subjects (32.09%) had the CC or CG genotype.
Associations of LEP rs7739039 variant with leptin and glucose-lipid metabolism markers
The relationships between the rs7739039 variant and leptin and glucose-lipid metabolism markers are presented in Tables 1 and 2. The pooled meta-analyses across the entire population revealed that carriers of the A-allele for the rs7739039 variant had lower fasting leptin levels (SMD = -0.18 ng/mL, 95% CI = -0.31 to -0.04 ng/mL, p = 0.01) (Table 1; Figure 2), and higher fasting insulin levels (SMD = 0.22 μmol/μL, 95% CI = 0.07 to 0.37 μmol/μL, p < 0.01) (Table 1; Figure 3), as well as higher HOMA-IR (SMD = 0.26, 95% CI = 0.08 to 0.43, p < 0.01) (Table 1; Figure 4), compared to the GG homozygotes. No significant associations were found between the rs7739039 variant and fasting levels of glucose, triglycerides, TC, LDL-C, or HDL-C in the overall population (Supplementary Figures S1-S5).
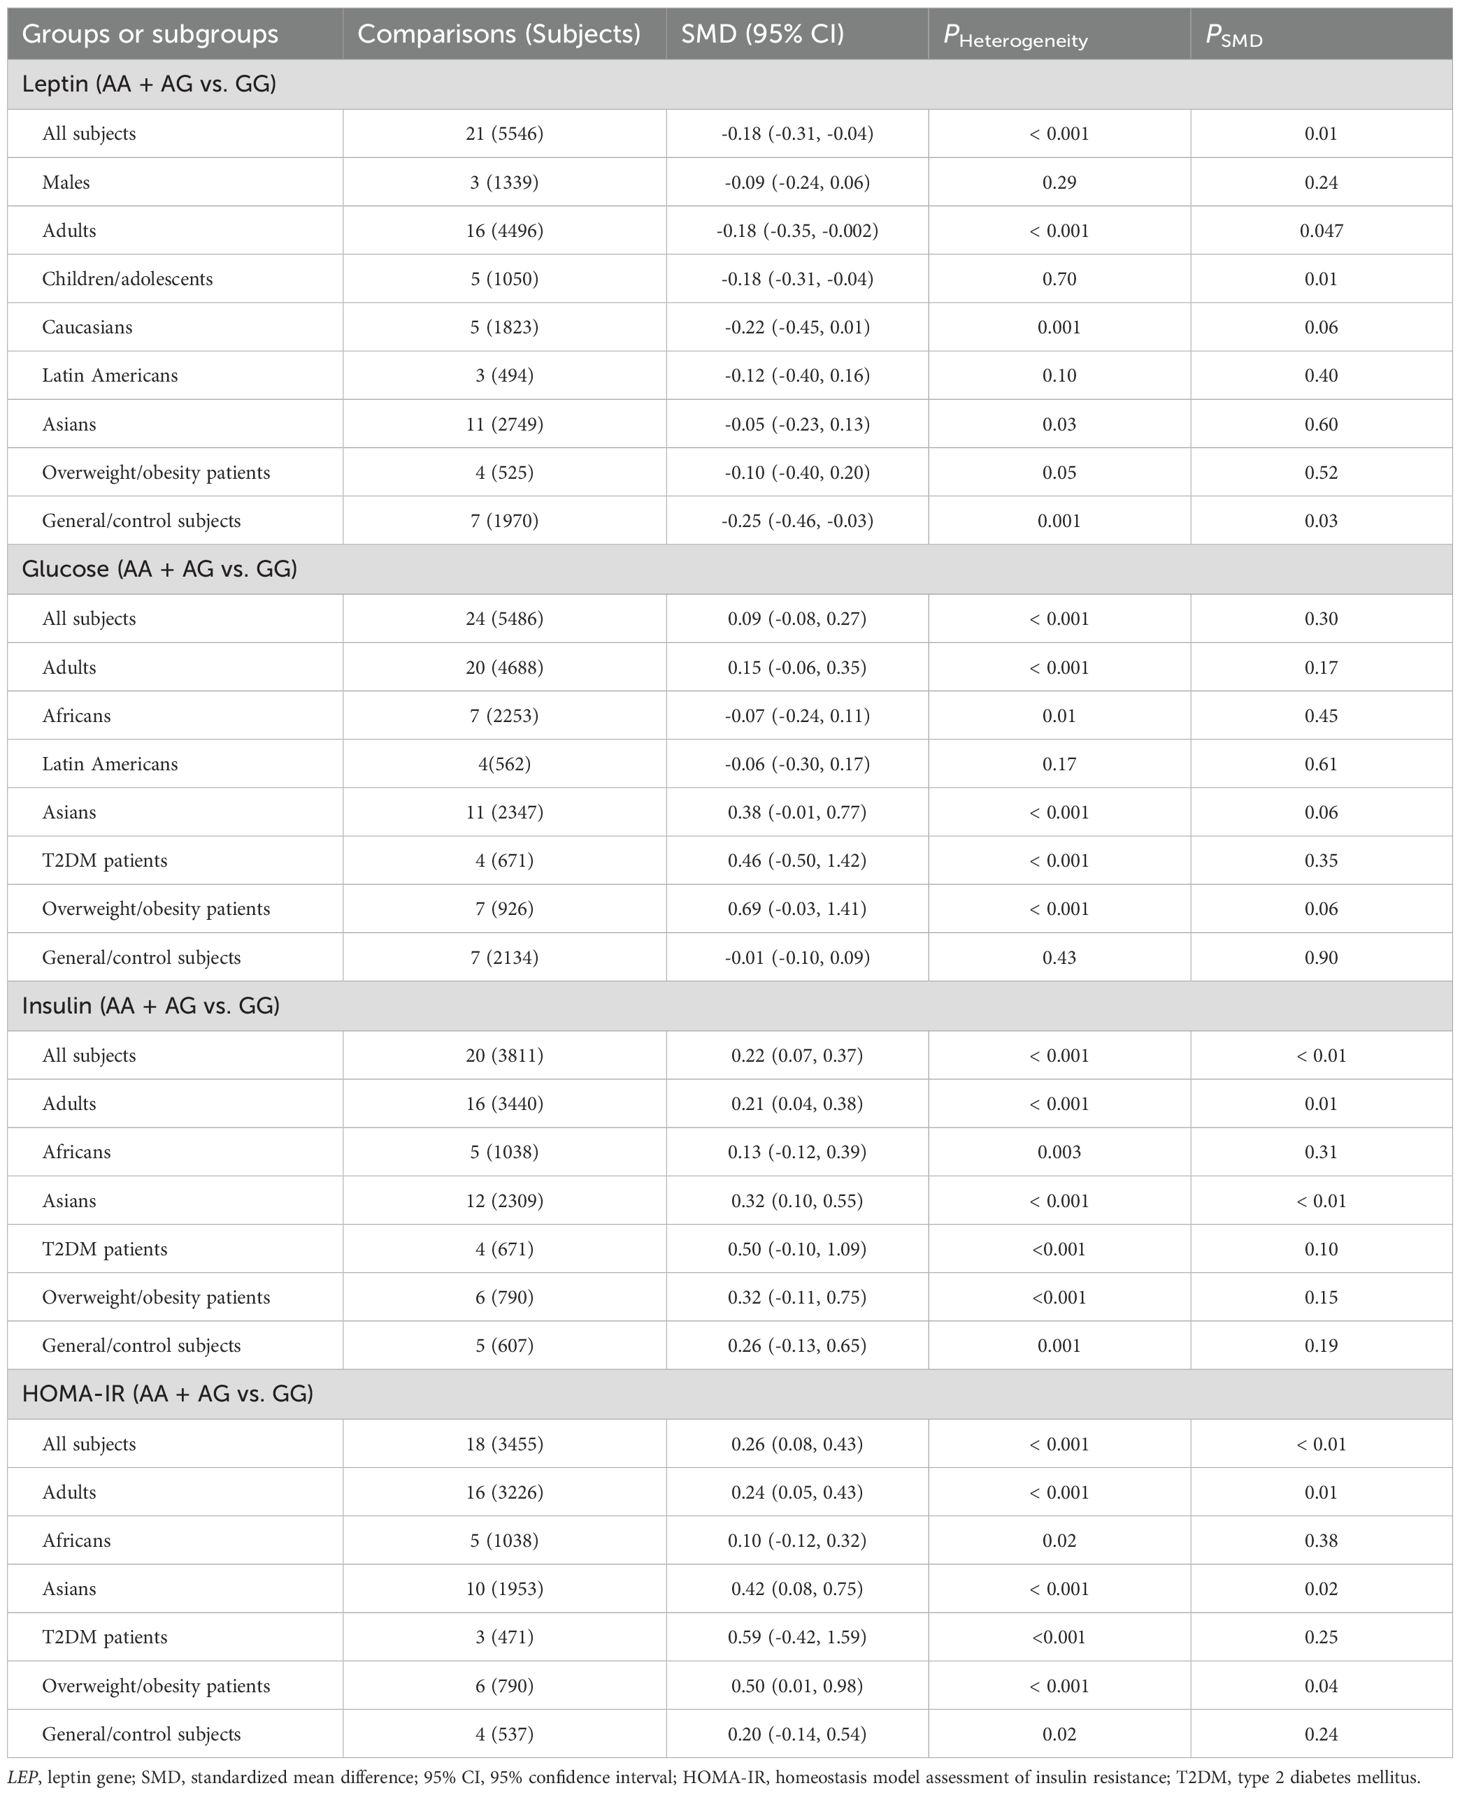
Table 1. Meta-analyses between LEP rs7799039 variant and leptin and glucose metabolism markers.
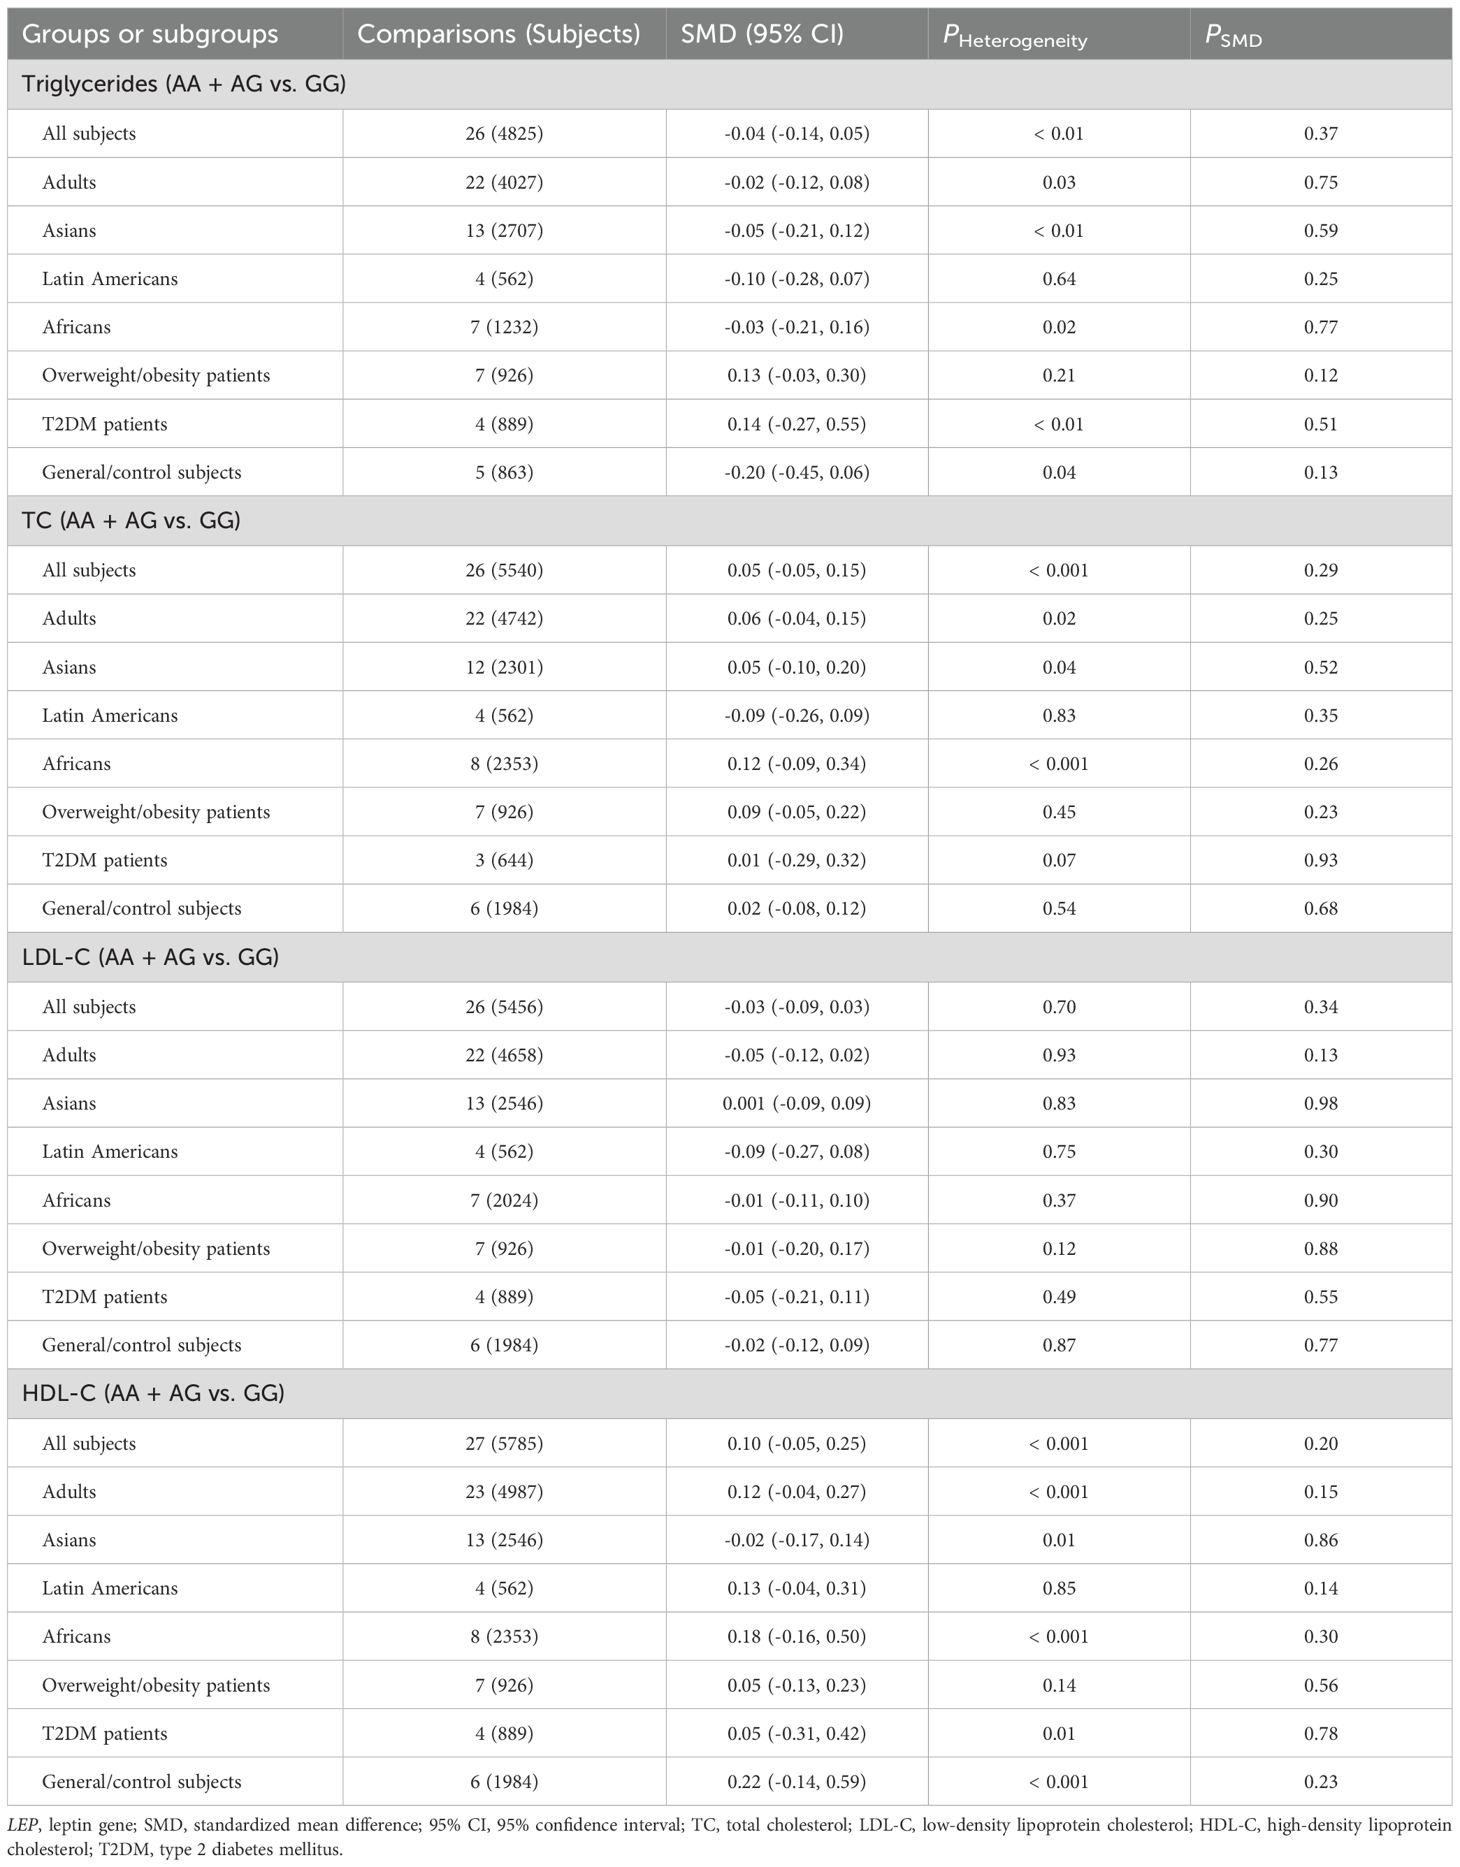
Table 2. Meta-analyses between LEP rs7799039 variant and lipid metabolism markers.
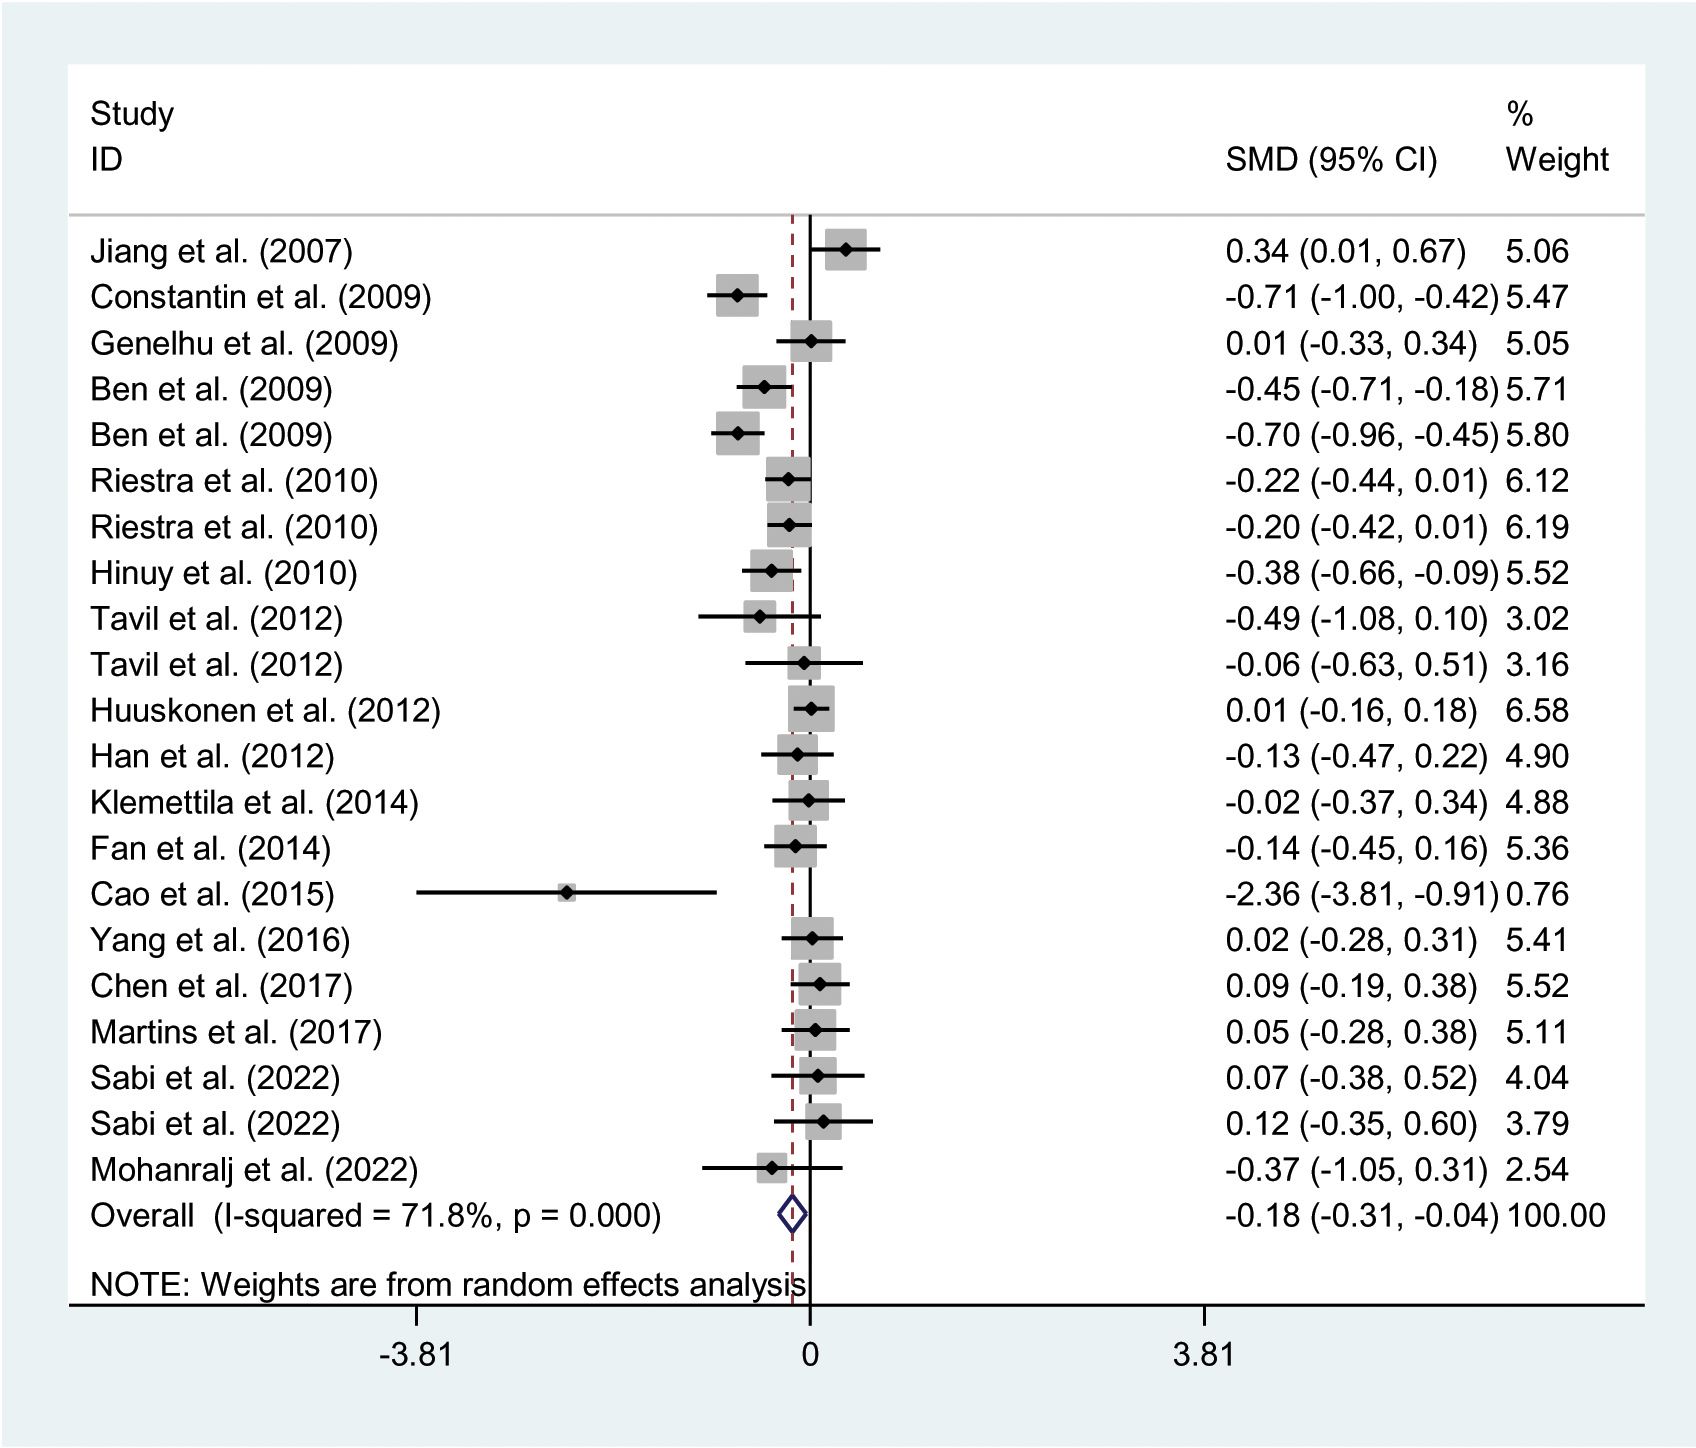
Figure 2. Forest plot of the association between LEP rs7799039 variant and leptin. LEP, leptin gene; SMD, standardized mean difference; 95% CI, 95% confidence interval.
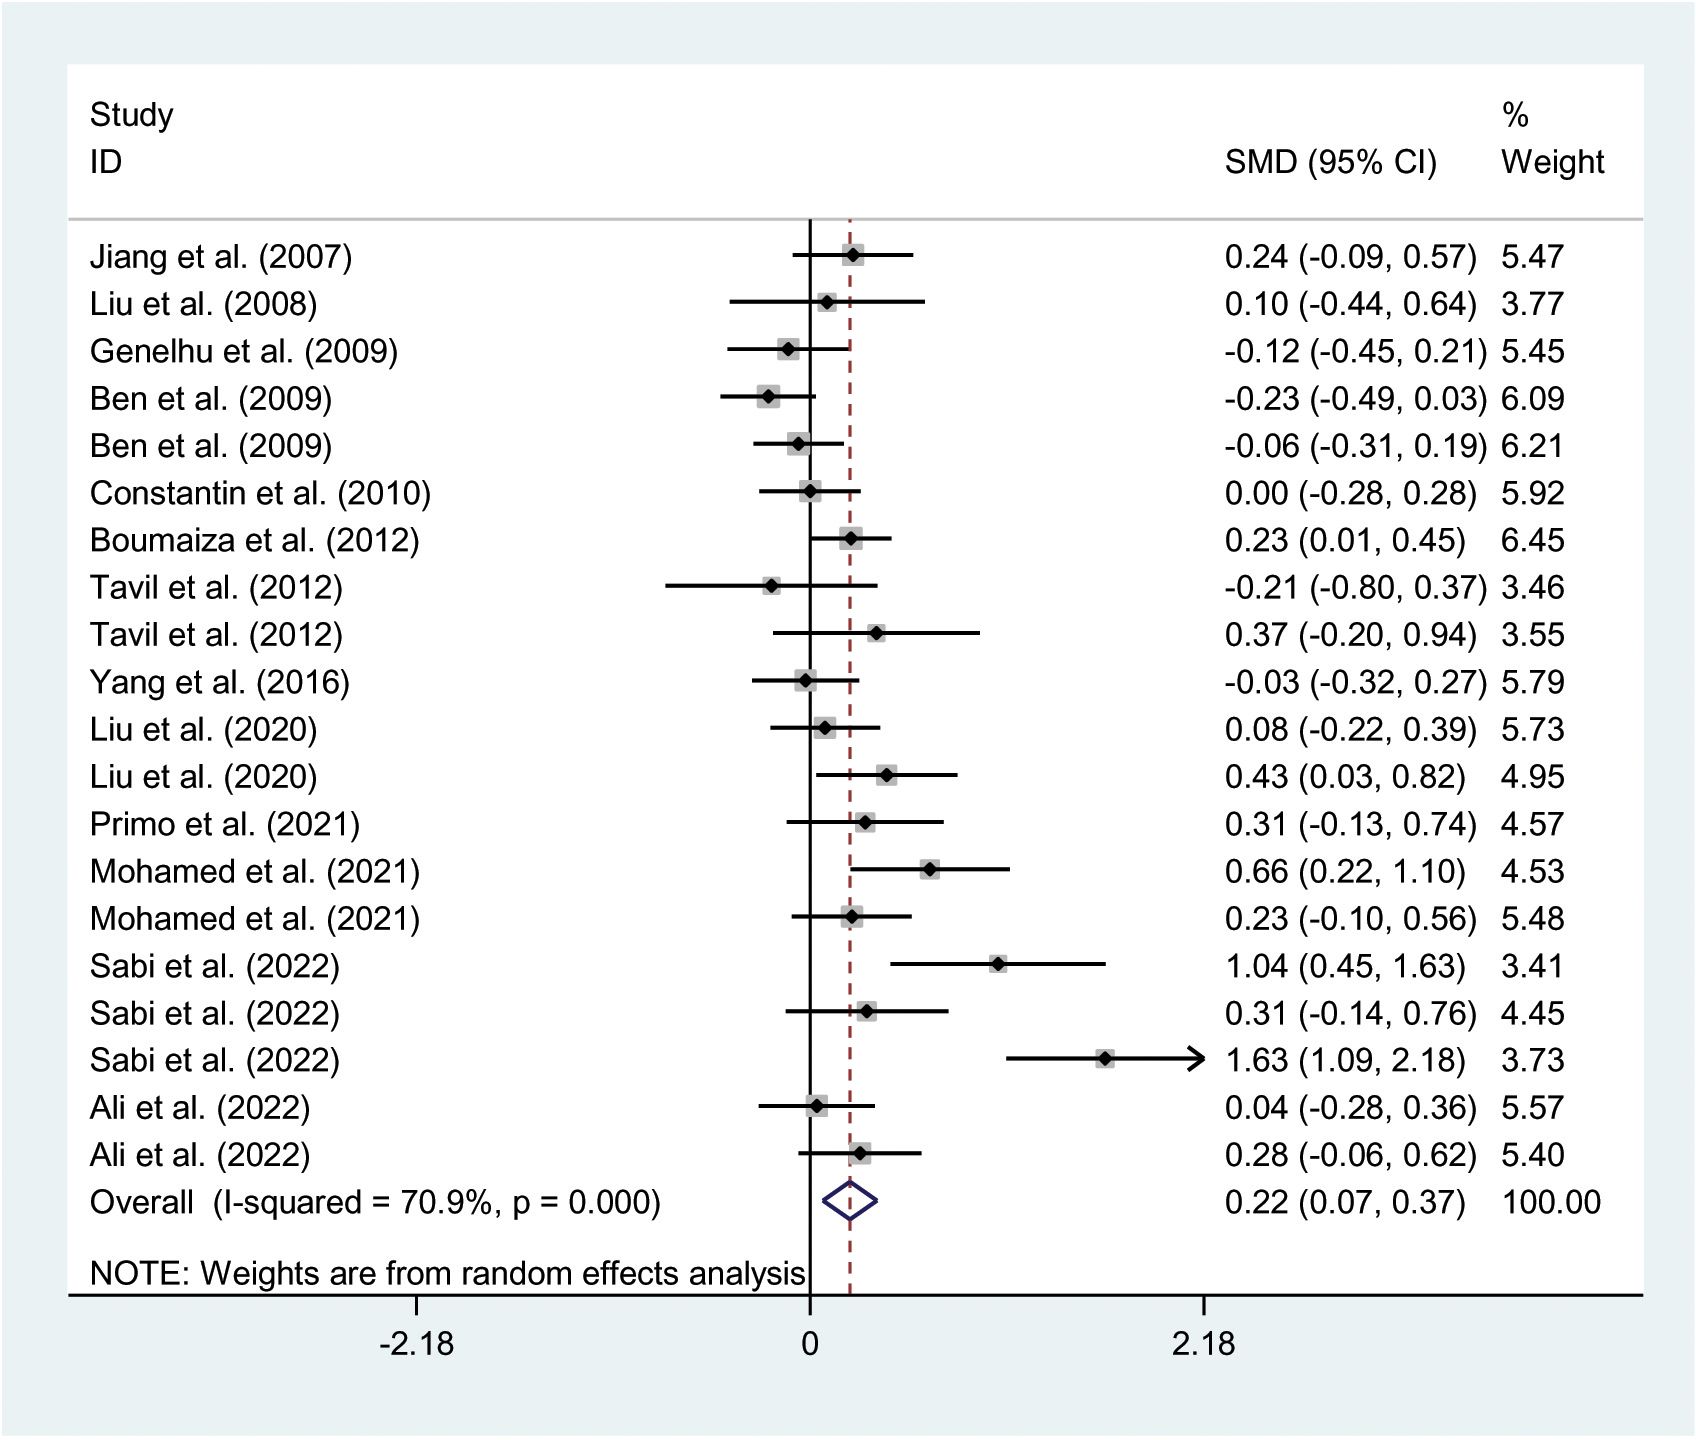
Figure 3. Forest plot of the association between LEP rs7799039 variant and insulin levels. LEP, leptin gene; SMD, standardized mean difference; 95% CI, 95% confidence interval.
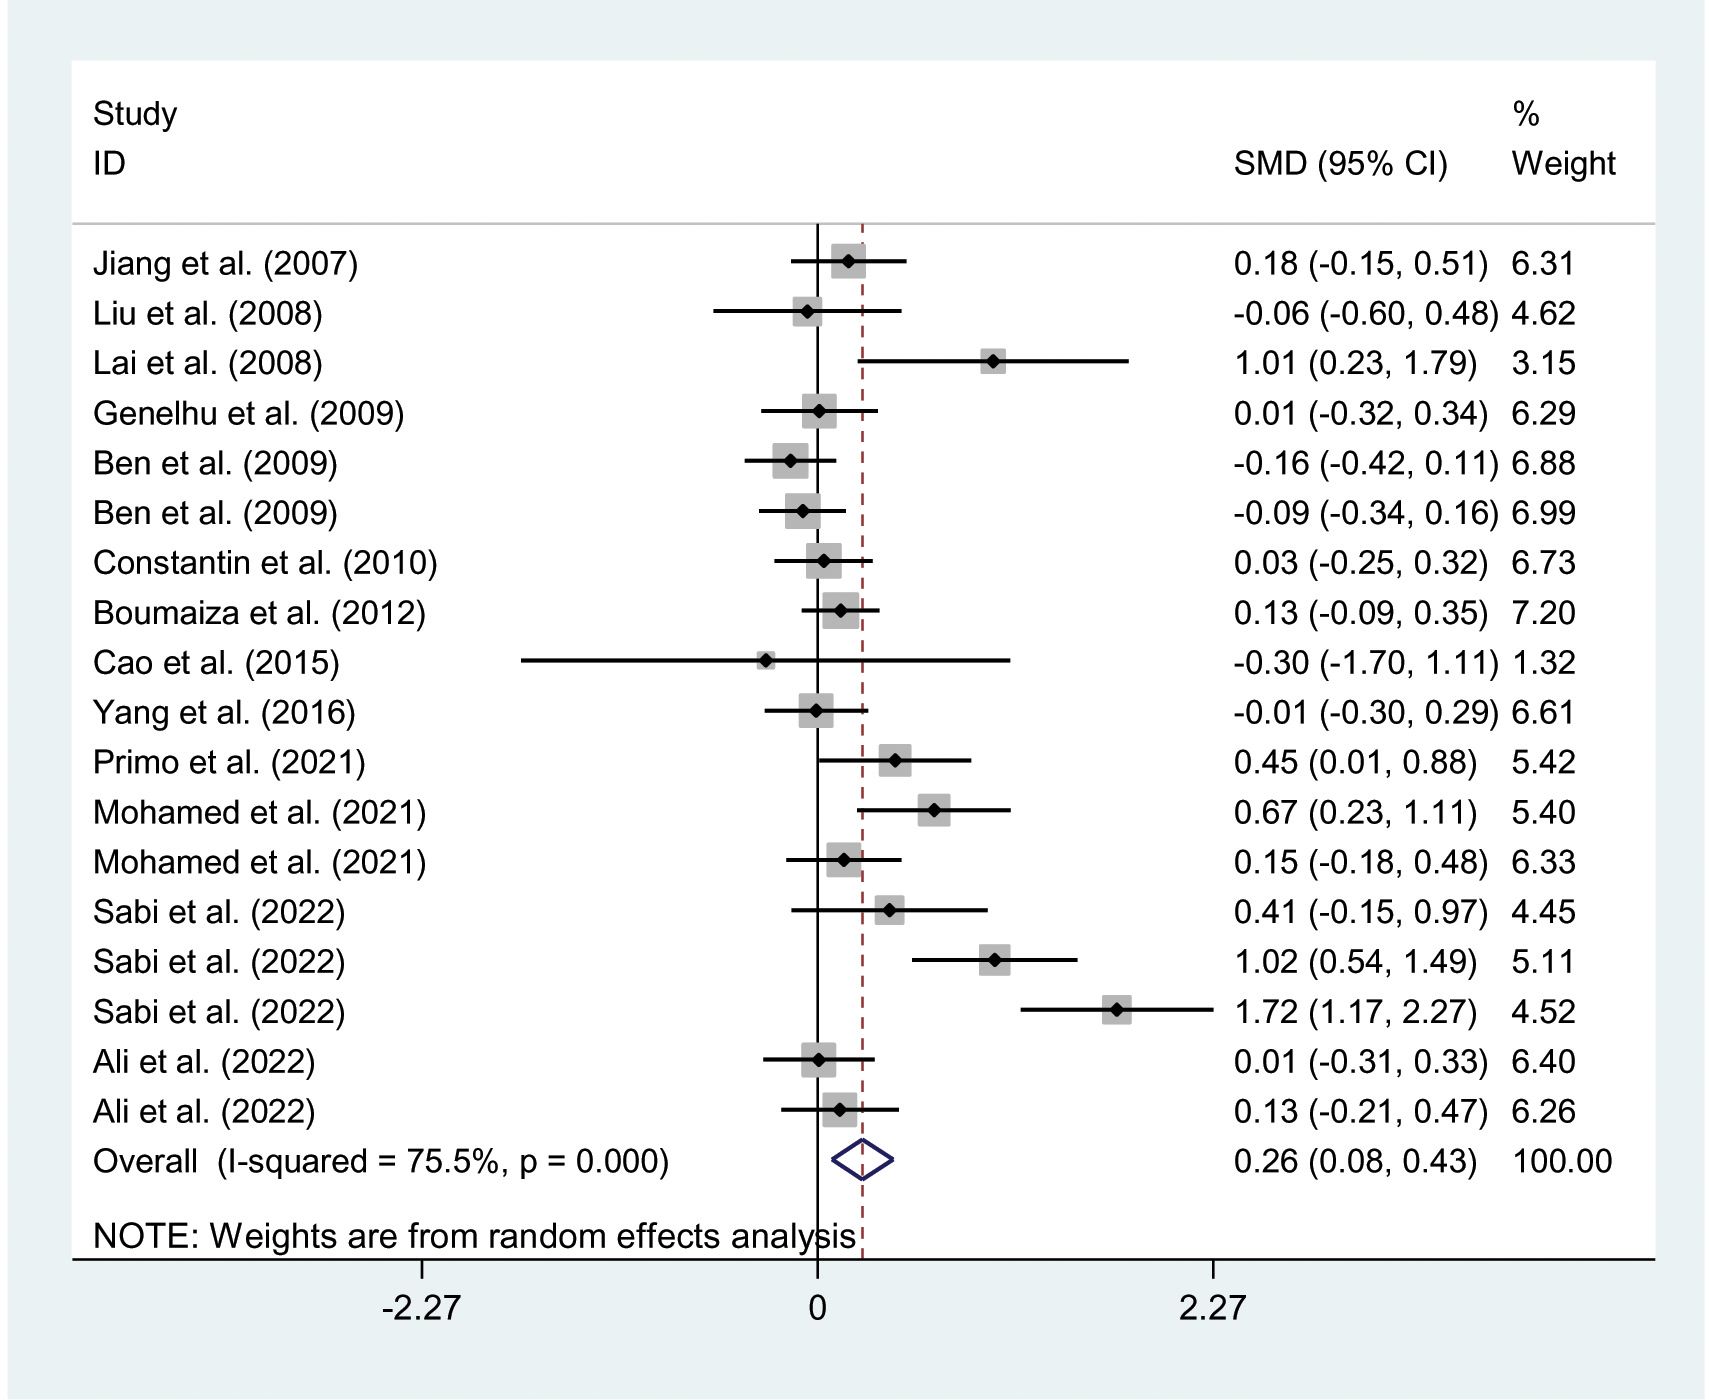
Figure 4. Forest plot of the association between LEP rs7799039 variant and HOMA-IR. LEP, leptin gene; SMD, standardized mean difference; 95% CI, 95% confidence; HOMA-IR, interval homeostasis model assessment of insulin resistance.
The interactions between the rs7739039 variant and ethnicity and health condition on leptin and glucose metabolism markers were observed (Table 1). The A allele of the rs7739039 variant is linked to increased insulin (SMD = 0.32 μmol/μL, 95% CI = 0.10 to 0.55 μmol/μL, p < 0.01) and HOMA-IR (SMD = 0.42, 95% CI = 0.08 to 0.75, p = 0.02) levels in Asians, but not in Africans. The A allele carriers have a greater HOMA-IR (SMD = 0.50, 95% CI = 0.01 to 0.98, p = 0.04) than the GG homozygotes in overweight/obesity patients, but not in individuals with T2DM. Additionally, the A allele of the rs7739039 variant is associated with reduced leptin levels in general/control subjects (SMD = -0.25 ng/mL, 95% CI = -0.46 to -0.03 ng/mL, p = 0.03), but not in overweight/obesity patients. No significant associations between the rs7739039 variant and any of the lipid metabolism markers were detected in the pooled meta-analyses of the whole population (Table 2).
Associations of LEPR rs1137100, rs1137101 and rs1805094 variants with leptin and glucose-lipid metabolism markers
No significant associations were found between LEPR rs1137100 (Supplementary Tables S14, S15; Supplementary Figures S6-S13), rs1137101 (Tables 3, 4; Supplementary Figures S14-S21), and rs1805094 (Supplementary Tables S16, S17; Supplementary Figures S22-S29) variants and leptin levels or any markers of glucose-lipid metabolism across the entire population. However, subgroup analyses revealed significant associations between the G allele of the rs1137101 variant and lower leptin levels (SMD = -0.16 ng/mL, 95% CI = -0.33 to -0.001 ng/mL, p = 0.049) in Africans, as well as higher glucose levels (SMD = 0.17 mg/dL, 95% CI = 0.001 to 0.33 mg/dL, p = 0.049) in individuals with overweight/obesity (Table 3). Carriers of the G allele of rs1137101 also exhibited higher TC levels (SMD = 0.15 mg/dL, 95% CI = 0.01 to 0.29 mg/dL, p = 0.03) in the general/control subjects, but lower LDL-C levels (SMD = -0.34 mg/dL, 95% CI = -0.65 to -0.02 mg/dL, p = 0.04) in Asians compared to those with the AA genotype (Table 4). Furthermore, C-allele carriers of the rs1805094 variant showed elevated leptin levels in males (SMD = 0.29 ng/mL, 95% CI = 0.07 to 0.51 ng/mL, p < 0.01), children/adolescents (SMD = 0.17 ng/mL, 95% CI = 0.06 to 0.28 ng/mL, p < 0.01), and Caucasians (SMD = 0.20 ng/mL, 95% CI = 0.06 to 0.33 ng/mL, p < 0.01) than the GG homozygotes (Supplementary Table S16). Somehow, they had lower leptin levels than the GG homozygotes in Asians (Supplementary Table S16). C-allele carriers of the rs1805094 variant also had lower triglyceride levels (SMD = -0.17 mg/dL, 95% CI = -0.31 to -0.03 mg/dL, p = 0.02) in overweight/obesity patients, lower LDL-C levels in Asians (SMD = -0.43 mg/dL, 95% CI = -0.81 to -0.06 mg/dL, p = 0.03), and lower HDL-C levels in males (SMD = -0.33 mg/dL, 95% CI = -0.56 to -0.09 mg/dL, p < 0.01) and in Caucasians (SMD = -0.14 mg/dL, 95% CI = -0.28 to -0.01 mg/dL, p = 0.04) compared to those with the GG genotype (Supplementary Tables S16, S17). No significant relationships were observed between the rs1137100 variant and leptin or glucose-lipid metabolism markers in both the overall and subgroup analyses (Supplementary Tables S14, S15).
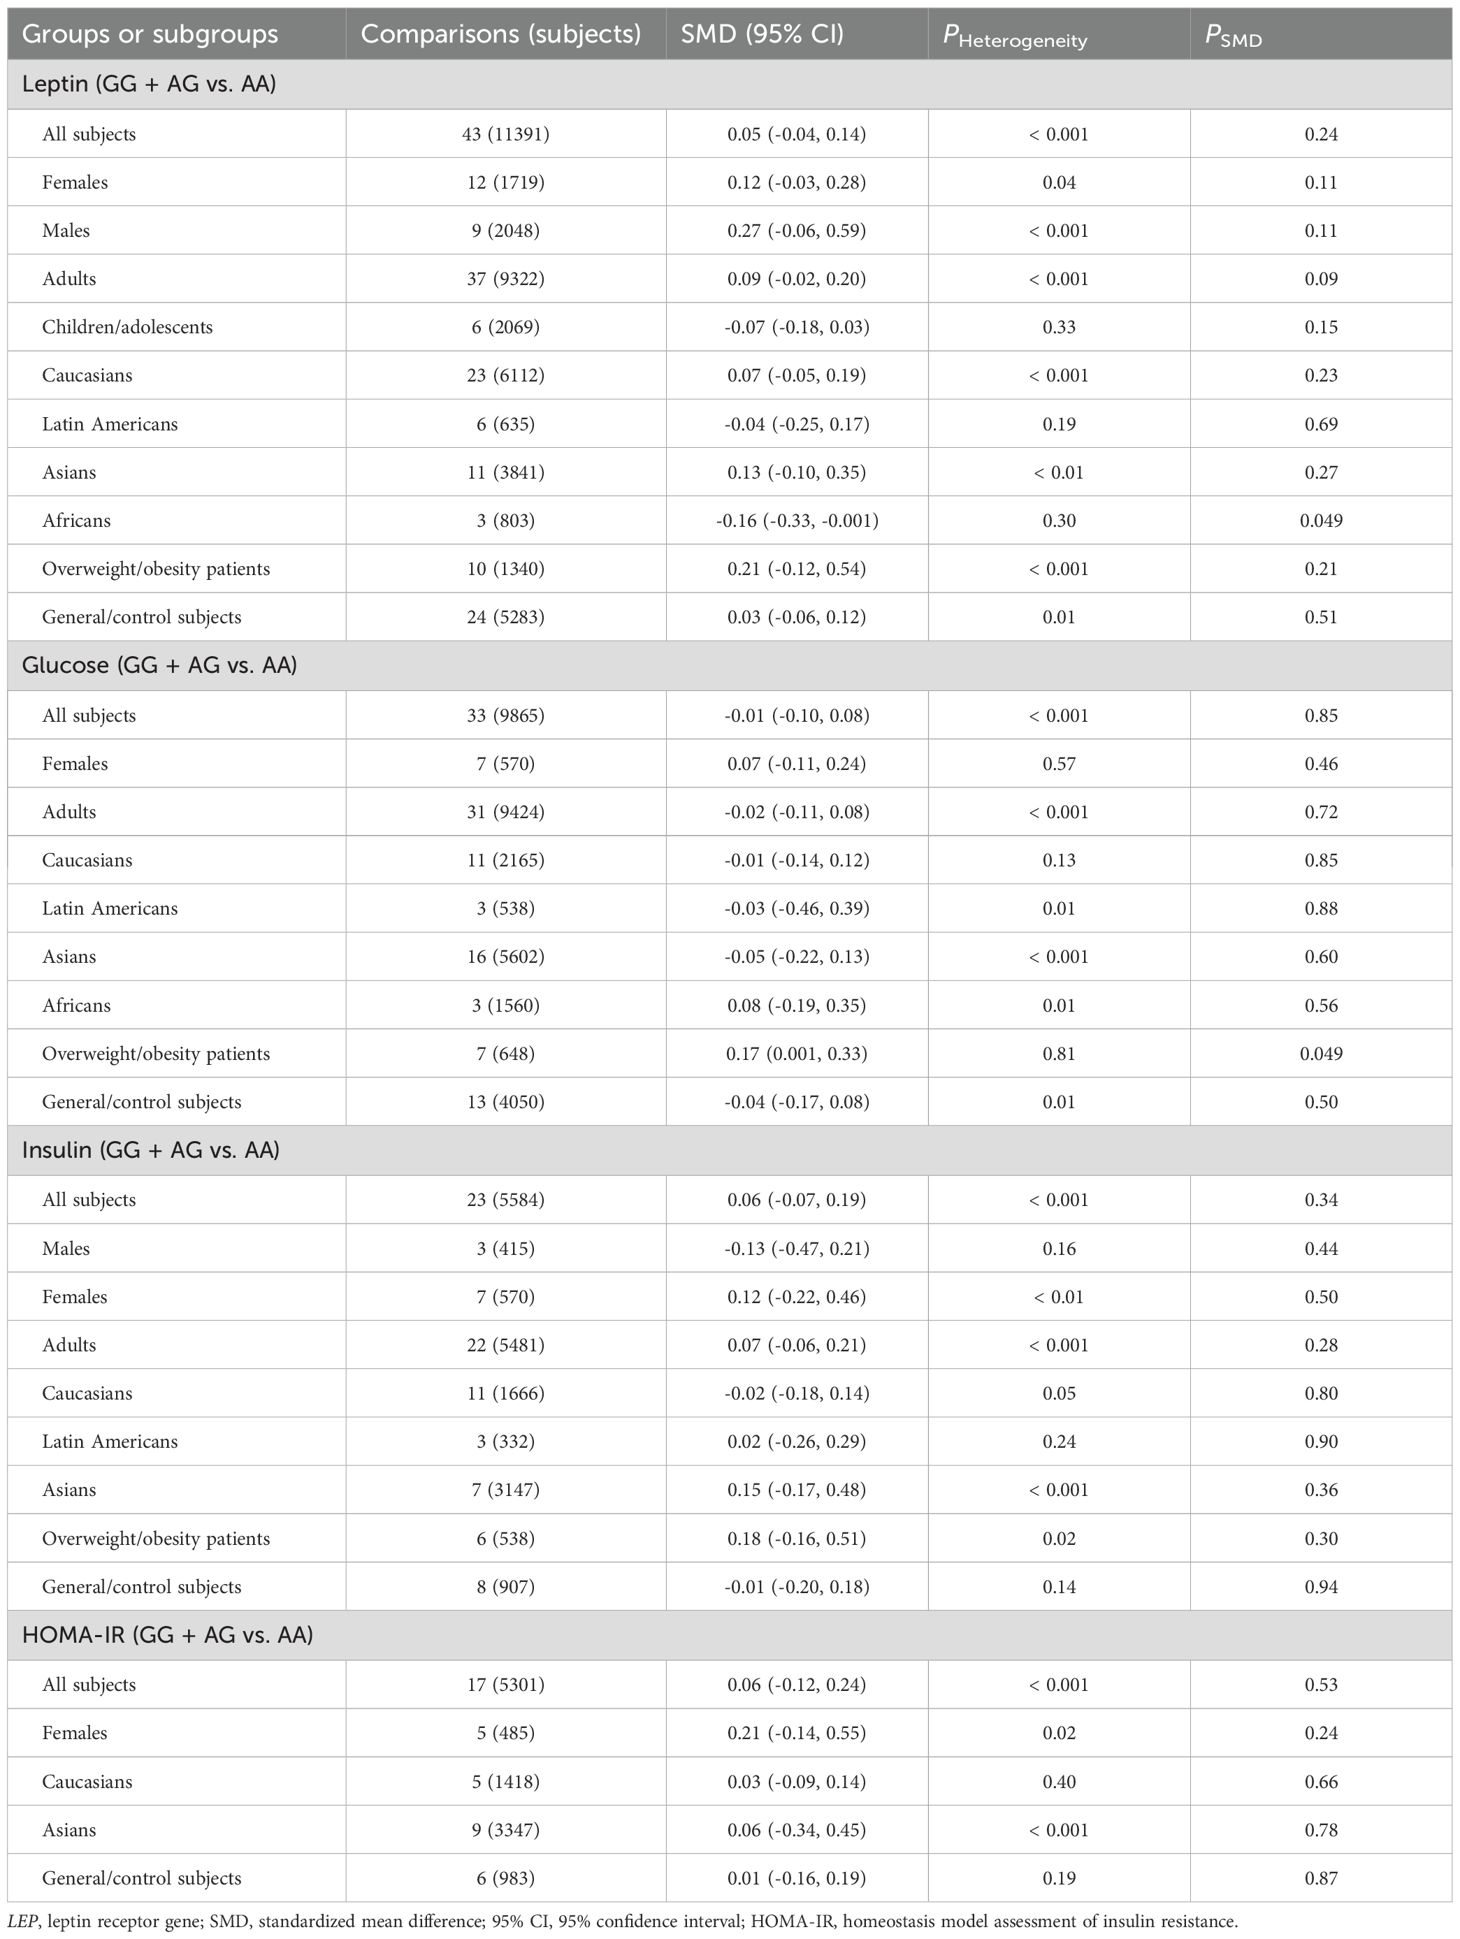
Table 3. Meta-analyses between LEPR rs1137101 variant and leptin and glucose metabolism markers.
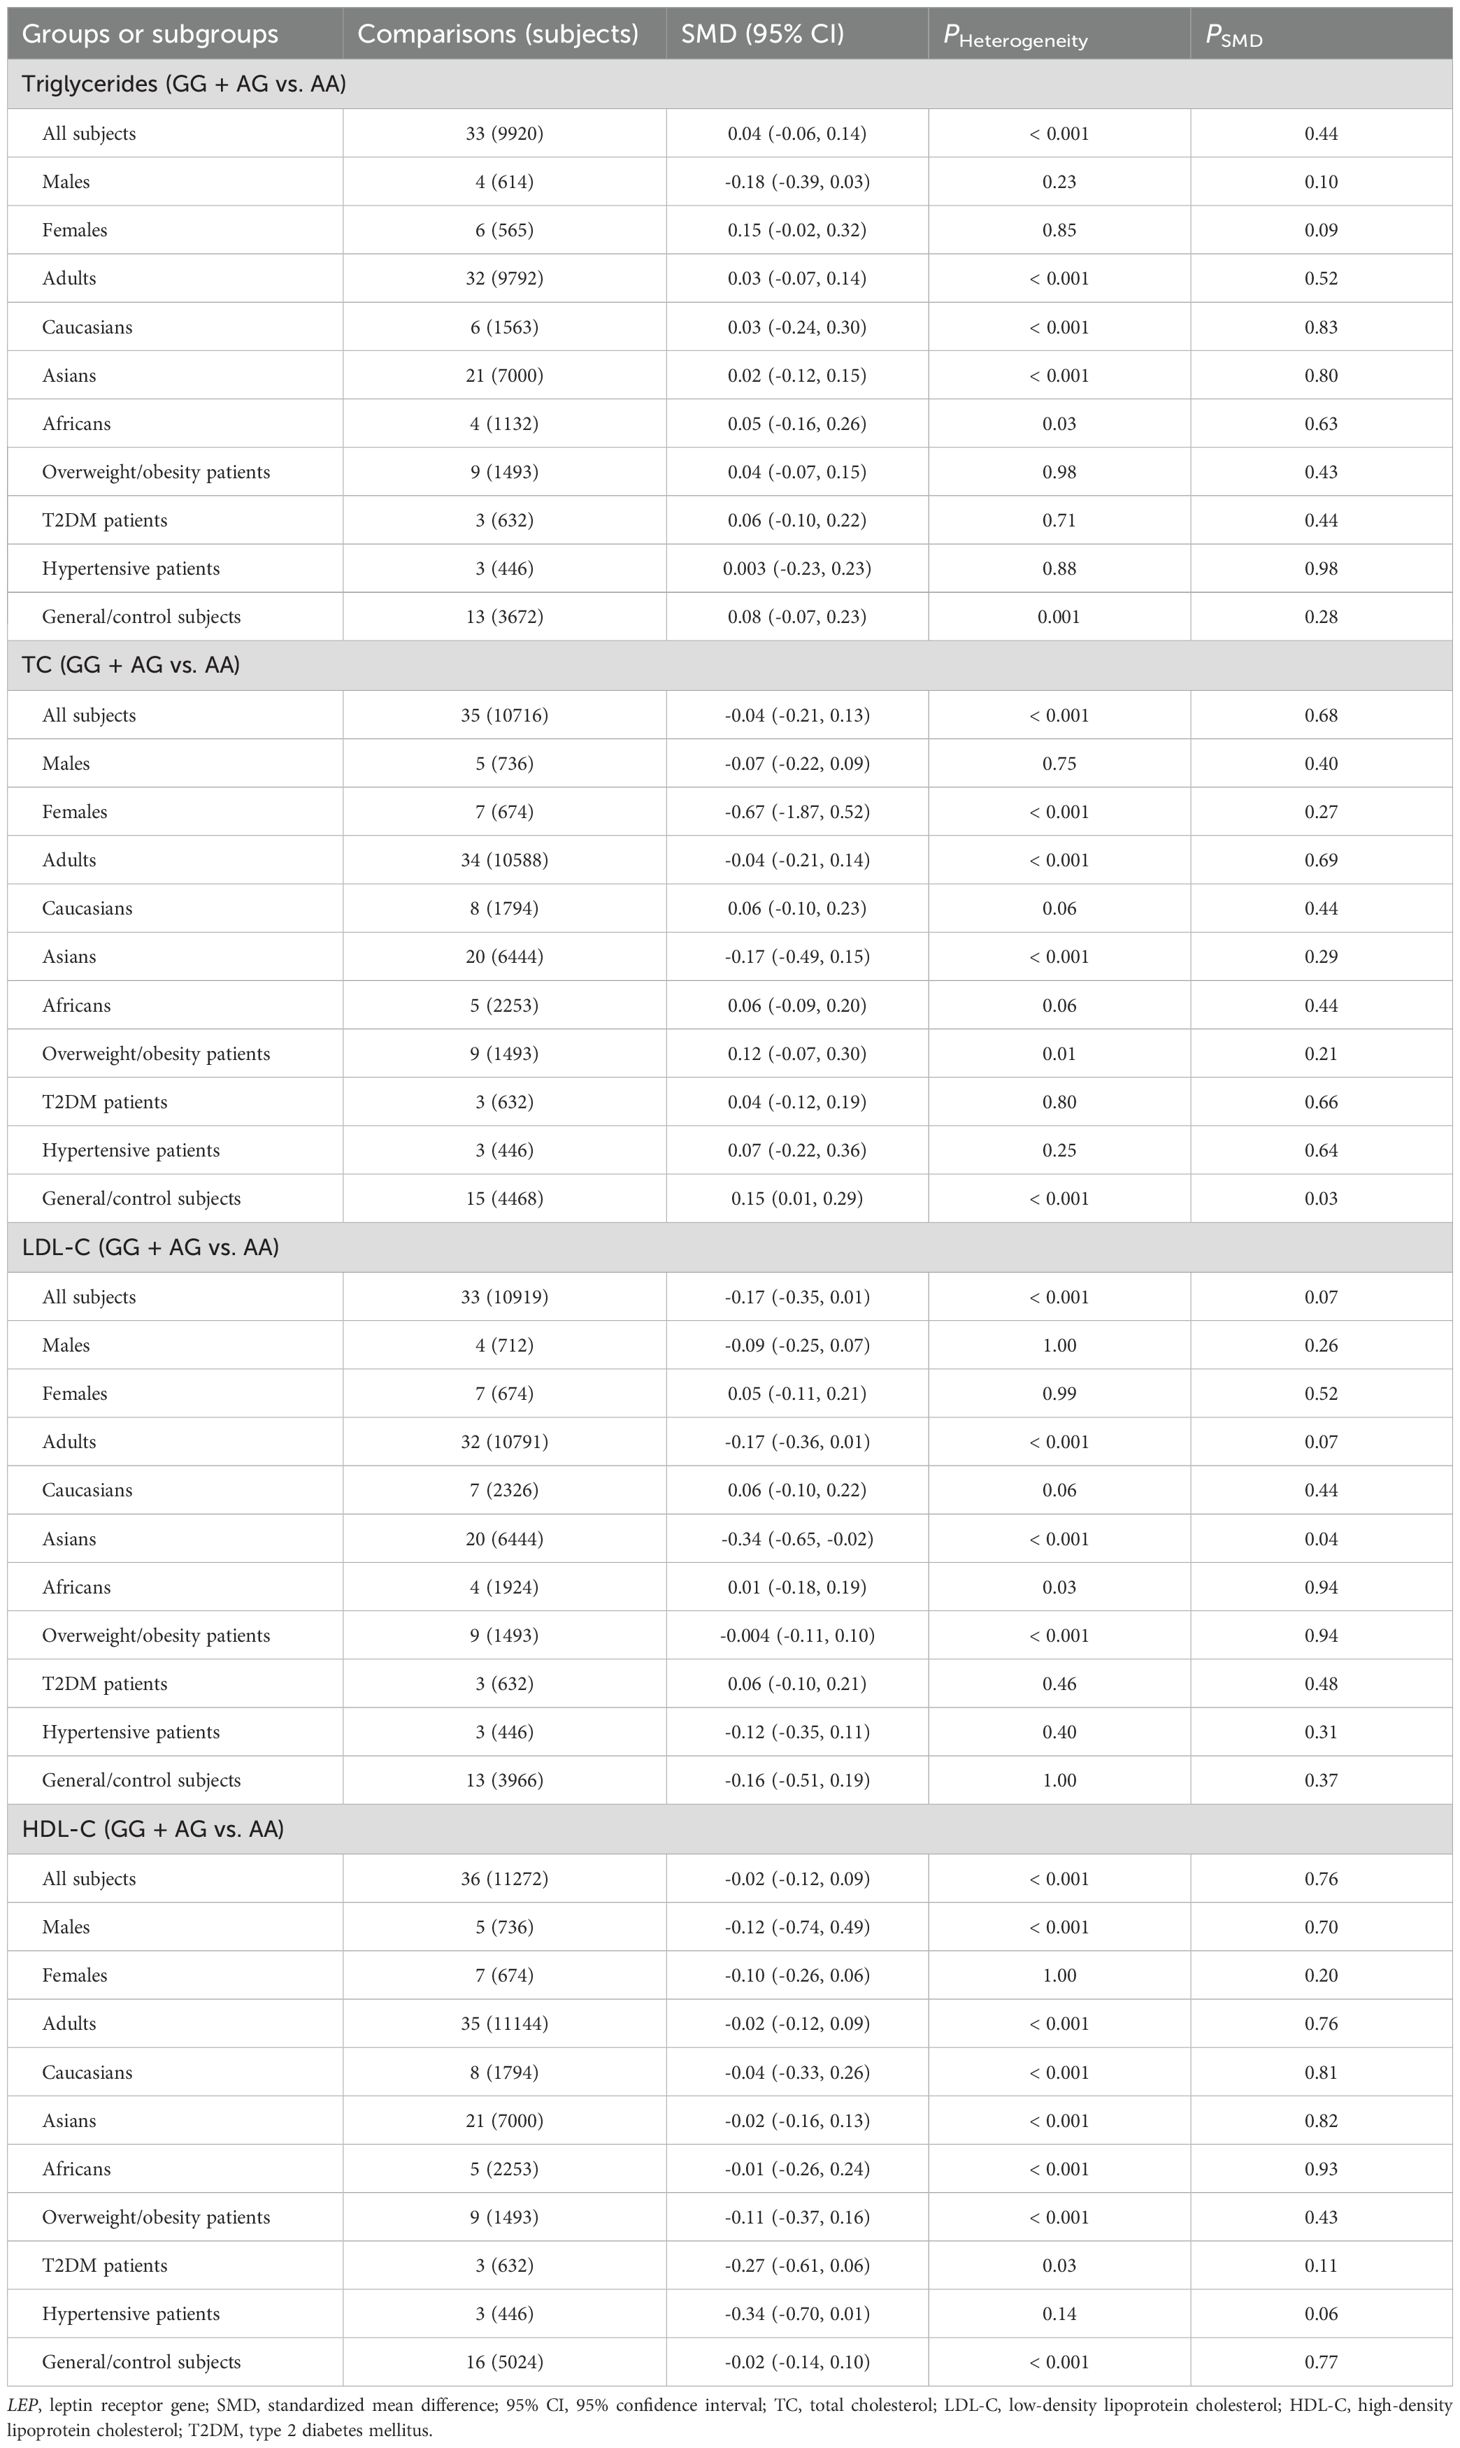
Table 4. Meta-analyses between LEP rs1137101 variant and lipid-metabolism markers.
Heterogeneity analysis
Significant heterogeneity was observed in the pooled meta-analyses for leptin, glucose, insulin, HOMA-IR, triglycerides, TC, and HDL-C for the rs7799039 variant in the entire population (Tables 1, 2). Similarly, significant heterogeneity was found in the pooled meta-analyses for leptin, glucose, insulin, HOMA-IR, triglycerides, TC, LDL-C, and HDL-C for the rs1137101 variant across the whole population (Tables 3, 4). For the rs1805094 variant, significant heterogeneity was noted in the pooled meta-analyses for leptin, glucose, insulin, HOMA-IR, and HDL-C in the entire population (Supplementary Tables S16, S17). Additionally, significant heterogeneity was present for leptin, TC, LDL-C, and HDL-C in the pooled meta-analyses for the rs1137100 variant in the whole population (Supplementary Tables S14, S15). The sources of heterogeneity were effectively identified using Galbraith plots. Excluding outlier studies resulted in a significant reduction or elimination of the heterogeneity, while the results of the pooled meta-analyses remained largely unchanged for all indexes.
Publication bias
Publication bias was detected in the association analyses between the rs7799039 variant and insulin levels as well as HOMA-IR. To correct for this bias, the trim-and-fill method was applied, and the adjusted pooled results showed no significant changes for either marker after the adjustment.
Discussion
Leptin and its receptor are key components in regulating energy homeostasis, and any disruption in their signaling pathway can lead to the development or exacerbation of the metabolic diseases such as obesity, T2DM, metabolic syndrome, non-alcoholic fatty liver disease, and CVD (38–40). Several studies have suggested that the rs7799039 variant in LEP, as well as the rs1137100, rs1137101, and rs1805094 variants in LEPR, is linked to the onset of T2DM and CVD (41–43). This led us to conduct the present meta-analysis to clarify the relationships between these four polymorphic loci and glucose-lipid metabolism markers including glucose, insulin, HOMA-IR, triglycerides, TC, LDL-C and HDL-C. Our meta-analysis reveals that the A allele of the rs7799039 variant in the LEP promoter is associated with lower leptin levels but higher insulin and HOMA-IR levels. This aligns with previous studies indicating that the A allele of rs7799039 is strongly linked to an increased risk of T2DM (41, 43). Furthermore, we found that LEPR rs1137101 and rs1805094 variants are significantly associated with leptin, glucose, and cholesterol levels in specific populations, such as Africans and individuals with overweight/obesity, although these variants were not associated with glucose-lipid metabolism markers in the pooled meta-analyses in the overall population.
The mechanisms behind the associations of the rs7799039 variant with leptin and glucose metabolism markers could be attributed to the A allele of this variant, which leads to reduced LEP mRNA expression due to its location in the gene’s promoter region. However, Kolić et al. (44) examined the levels of LEP mRNA in peripheral blood mononuclear cells of patients with relapsing-remitting multiple sclerosis who carried different rs7799039 polymorphic genotypes. They found that LEP mRNA levels in the A allele carriers were significantly higher than in patients with the GG genotype. We utilized GTEx Analysis Release V8 (dbGaP Accession phs000424.v8.p2) to examine the effect of the rs7799039 variant on LEP mRNA expression. The analysis displayed that the A allele of the rs7799039 variant is significantly associated with higher levels of LEP mRNA in both cultured fibroblasts and tibial arteries (p < 0.00001 for both). We speculate that the impact of rs7799039 on leptin gene expression is tissue-specific, with its regulatory effect on leptin gene expression varying across different tissues. Of course, this remains merely a hypothesis, as there is currently no further evidence to support this. However, when we examined the influence of the rs1137101 variant on LEP mRNA levels using GTEx Analysis Release V8 (dbGaP Accession phs000424.v8.p2), we found that the G allele was significantly negatively correlated with LEP mRNA levels in cultured fibroblasts and the tibial artery, while it showed a significant positive correlation in tissues such as subcutaneous adipose, brain, and thyroid. This indirectly supports the possibility that the effect of rs7799039 variant on leptin gene expression could be tissue-specific.
In this study, LEPR variants rs1137101 and rs1805094 exhibited a weak association with glucose-lipid metabolic markers, while the rs1137100 variant showed no significant association with any of these markers. This disparity may be attributed to the distinct properties of the substituted amino acids. The rs1137100, rs1137101, and rs1805094 variants are all missense mutations, and the functional impact of these mutations on LEPR depends on the differences in properties between the substituted and original amino acids. The greater the differences in properties, the more pronounced the effect on the structure, stability, and function of the protein. An example of a missense mutation with significant clinical implications is the mutation responsible for sickle cell anemia, which occurs in the hemoglobin β-globin gene (45). In this condition, the sixth glutamic acid in the β-chain is substituted by valine. Glutamic acid is a polar acidic amino acid typically located on the surface of the protein, while valine is a nonpolar, neutral amino acid that is generally found in the protein’s interior. This substitution alters hemoglobin’s structure, transforming it from a soluble globular form to an insoluble, tubular, or fibrous polymer. As a result, red blood cells assume a rigid sickle shape, impairing their ability to carry oxygen. In contrast, the rs1137100 variant involves the substitution of lysine with arginine. Both amino acids are polar basic residues, which suggests that this substitution has minimal effect on the molecular structure and function of LEPR, and thus no significant impact on glucose and lipid metabolism. The rs1137101 variant involves the substitution of glutamine with arginine, and the rs1805094 variant involves the substitution of lysine with asparagine. Although all of these amino acids are polar, arginine and lysine are polar basic amino acids, while glutamine and asparagine are polar neutral amino acids, indicating some difference in their properties. Therefore, the rs1137101 and rs1805094 variants may modestly affect the structure and function of LEPR, leading to a weak association with glucose-lipid metabolism markers observed in this study.
Significant heterogeneity was observed in the pooled meta-analyses for the total population regarding the associations between the rs7799039 variant and leptin, insulin, or HOMA-IR. Outlier studies were identified using Galbraith plots, and exclusion of these studies did not result in significant changes to SMDs or 95% CIs. This suggests that the associations between the rs7799039 variant and these markers are robust. Similarly, significant heterogeneity was detected in the association meta-analyses for the rs1137100, rs1137101, and rs1805094 variants with glucose-lipid metabolism markers in the total population. After identifying and excluding outlier studies, no significant correlations remained, indicating that the associations between these variants and glucose-lipid metabolic markers are weak.
This study has several limitations. First, only studies published in English and Chinese were included in this meta-analysis due to challenges in accessing full-text articles from studies published in other languages. Second, subgroup analyses were limited to age, gender, ethnicity, and health condition. The interactions between the rs7799039, rs1137100, rs1137101, and rs1805094 variants and other genetic or non-genetic factors influencing glucose-lipid metabolism markers were not explored due to the lack of original data from the included studies. It is well established that numerous factors, such as additional genetic variations, diet, physical activity, and environmental influences, contribute to glycolipid metabolic disorders (46–48). More comprehensive insights could be gained if gene-gene interactions were examined or if stratification analyses incorporating factors like diet, physical activity, and environmental exposures were performed.
In conclusion, the A allele of the rs7799039 variant in the promoter of LEP is associated with lower levels of leptin, and confers a higher risk of insulin resistance. LEPR rs1137101, and rs1805094 variants are weakly correlated with glucose-lipid metabolism markers, while LEPR rs1137100 variant is not associated with any of the glucose-lipid metabolism markers. These findings may partially help explain the interrelationships among these genetic variants, leptin levels, metabolic disorders and the development of diabetes and cardiovascular diseases.
Data availability statement
The original contributions presented in the study are included in the article/Supplementary Material. Further inquiries can be directed to the corresponding author.
Author contributions
YS: Investigation, Writing – original draft. YZ: Methodology, Writing – review & editing. XL: Validation, Writing – review & editing. WG: Formal Analysis, Writing – review & editing. YA: Methodology, Writing – review & editing. BS: Supervision, Writing – review & editing. JL: Data curation, Writing – review & editing. CH: Conceptualization, Writing – review & editing.
Funding
The author(s) declare financial support was received for the research and/or publication of this article. The project was supported by the Natural Science Foundation of Sichuan, China (2022NSFSC0740), Chengdu Medical Research Project (2025609), and Research Project of Clinical Medical College & Affiliated Hospital of Chengdu University, China (Y202416).
Conflict of interest
The authors declare that the research was conducted in the absence of any commercial or financial relationships that could be construed as a potential conflict of interest.
Generative AI statement
The author(s) declare that no Generative AI was used in the creation of this manuscript.
Any alternative text (alt text) provided alongside figures in this article has been generated by Frontiers with the support of artificial intelligence and reasonable efforts have been made to ensure accuracy, including review by the authors wherever possible. If you identify any issues, please contact us.
Publisher’s note
All claims expressed in this article are solely those of the authors and do not necessarily represent those of their affiliated organizations, or those of the publisher, the editors and the reviewers. Any product that may be evaluated in this article, or claim that may be made by its manufacturer, is not guaranteed or endorsed by the publisher.
Supplementary material
The Supplementary Material for this article can be found online at: https://www.frontiersin.org/articles/10.3389/fendo.2025.1589575/full#supplementary-material
References
1. de Lima EP, Moretti RC, Torres Pomini K, Laurindo LF, Sloan KP, Sloan LA, et al. Glycolipid metabolic disorders, metainflammation, oxidative stress, and cardiovascular diseases: unraveling pathways. Biol (Basel). (2024) 13:519. doi: 10.3390/biology13070519
2. Yusuf S, Hawken S, Ounpuu S, Dans T, Avezum A, Lanas F, et al. Effect of potentially modifiable risk factors associated with myocardial infarction in 52 countries (the INTERHEART study): case-control study. Lancet. (2004) 364:937–52. doi: 10.1016/S0140-6736(04)17018-9
3. Zhang Y, Chen L, Zhu J, Liu H, Xu L, Wu Y, et al. Minor alleles of FTO rs9939609 and rs17817449 polymorphisms confer a higher risk of type 2 diabetes mellitus and dyslipidemia, but not coronary artery disease in a Chinese Han population. Front Endocrinol (Lausanne). (2023) 14:1249070. doi: 10.3389/fendo.2023.1249070
4. Zhang Y, Li S, Nie H, Wang X, Li X, Wen J, et al. The rs17782313 polymorphism near MC4R gene confers a high risk of obesity and hyperglycemia, while PGC1α rs8192678 polymorphism is weakly correlated with glucometabolic disorder: a systematic review and meta-analysis. Front Endocrinol (Lausanne). (2023) 14:1210455. doi: 10.3389/fendo.2023.1210455
5. Song Y, Wade H, Zhang B, Xu W, Wu R, Li S, et al. Polymorphisms of fat mass and obesity-associated gene in the pathogenesis of child and adolescent metabolic syndrome. Nutrients. (2023) 15:2643. doi: 10.3390/nu15122643
6. Song Y, Raheel TM, Jia A, Dai G, Liu L, Long X, et al. rs10865710 polymorphism in PPARG promoter is associated with the severity of type 2 diabetes mellitus and coronary artery disease in a Chinese population. Postgrad Med J. (2022) 98:778–87. doi: 10.1136/postgradmedj-2021-140354
7. Li S, Zhang Y, Xu W, Lv Z, Xu L, Zhao Z, et al. C Allele of the PPARδ+294T>C Polymorphism Confers a Higher Risk of Hypercholesterolemia, but not Obesity and Insulin Resistance: A Systematic Review and Meta-Analysis. Horm Metab Res. (2023) 55:355–66. doi: 10.1055/a-2043-7707
8. Li S, He C, Nie H, Pang Q, Wang R, Zeng Z, et al. G Allele of the rs1801282 Polymorphism in PPARγ Gene Confers an Increased Risk of Obesity and Hypercholesterolemia, While T Allele of the rs3856806 Polymorphism Displays a Protective Role Against Dyslipidemia: A Systematic Review and Meta-Analysis. Front Endocrinol (Lausanne). (2022) 13:919087. doi: 10.3389/fendo.2022.919087
9. Song Y, Li S, and He C. PPARγ Gene polymorphisms, metabolic disorders, and coronary artery disease. Front Cardiovasc Med. (2022) 9:808929. doi: 10.3389/fcvm.2022.808929
10. Su M, Jia A, He Y, and Song Y. Associations of the polymorphisms in ADIPOQ with circulating levels of adiponectin and lipids: A meta-analysis. Horm Metab Res. (2021) 53:541–61. doi: 10.1055/a-1543-6362
11. Seoane-Collazo P, Martínez-Sánchez N, Milbank E, and Contreras C. Incendiary leptin. Nutrients. (2020) 12:472. doi: 10.3390/nu12020472
12. Sabi EM, Bin Dahman LS, Mohammed AK, Sumaily KM, and Al-Daghri NM. -2548G>A LEP polymorphism is positively associated with increased leptin and glucose levels in obese saudi patients irrespective of blood pressure status. Med (Kaunas). (2022) 58:346. doi: 10.3390/medicina58030346
13. Primo D, Izaola O, and de Luis D. Leptin gene polymorphism (rs 7799039;G2548A) is associated with changes in lipid profile during a partial meal-replacement hypocaloric diet. J Hum Nutr Diet. (2021) 34:456–63. doi: 10.1111/jhn.12809
14. Wu J, Zhuo Q, Chen X, Tian Y, Piao J, and Yang X. Association of leptin receptor gene polymorphrism with metabolic syndrome in older Han adults from major cities in China. Wei Sheng Yan Jiu. (2016) 45:376–82.
15. Jang K, Shin G, Yoo HJ, Lee JH, and Kim M. Risk associated with the LEPR rs8179183 GG genotype in a female korean population with obesity. Antioxid (Basel). (2020) 9:497. doi: 10.3390/antiox9060497
16. Chen HL, Wang JF, and Deng LL. Influence of leptin receptor gene Gln223Arg variation on ambulatory blood pressure in patients with metabolism syndrome. Chong Qing Yi Xue. (2016) 45:1201–5. doi: 10.3969/j.issn.1671-8348
17. Genelhu VA, Celoria BM, Pimentel MM, Duarte SF, Cabello PH, and Francischetti EA. Association of a common variant of the leptin gene with blood pressure in an obese Brazilian population. Am J Hypertens. (2009) 22:577–80. doi: 10.1038/ajh.2009.7
18. Mohamed AA, Ahmed HH, ElSadek SM, Mohamed RS, El-Amir RY, Salah W, et al. A study of leptin and its gene 2548 G/A Rs7799039 single-nucleotide polymorphisms in Egyptian children: A single-center experience. Clin Res Hepatol Gastroenterol. (2021) 45:101724. doi: 10.1016/j.clinre.2021.101724
19. Liu HL, Lin YG, Wu J, Sun H, Gong ZC, Hu PC, et al. Impact of genetic polymorphisms of leptin and TNF-alpha on rosiglitazone response in Chinese patients with type 2 diabetes. Eur J Clin Pharmacol. (2008) 64:663–71. doi: 10.1007/s00228-008-0483-9
20. Mohamed AA, Hassnine A, Elsayed A, Montaser M, Ismail Y, El-Demery A, et al. Isotretinoin induced hyperlipidemia and impact of leptin gene rs 7799039 polymorphism in safety of acne patients. Pharmgenom Pers Med. (2021) 14:1679–87. doi: 10.2147/PGPM.S341723
21. Li K, Liu Y, Venners SA, Hsu YH, Jiang S, Weinstock J, et al. Effects of LEP G2548A and LEPR Q223R polymorphisms on serum lipids and response to simvastatin treatment in chinese patients with primary hyperlipidemia. Clin Appl Thromb Hemost. (2017) 23:336–44. doi: 10.1177/1076029616638504
22. Shabana and S. Hasnain, Leptin promoter variant G2548A is associated with serum leptin and HDL-C levels in a case control observational study in association with obesity in a Pakistani cohort. J Biosci. (2016) 41:251–5. doi: 10.1007/s12038-016-9612-2
23. Abdel Hay RM and Rashed LA. Association between the leptin gene 2548G/A polymorphism, the plasma leptin and the metabolic syndrome with psoriasis. Exp Dermatol. (2011) 20:715–9. doi: 10.1111/j.1600-0625.2011.01299.x
24. Yang M, Peng S, Li W, Wan Z, Fan L, and Du Y. Relationships between plasma leptin levels, leptin G2548A, leptin receptor Gln223Arg polymorphisms and gestational diabetes mellitus in Chinese population. Sci Rep. (2016) 6:23948. doi: 10.1038/srep23948
25. Wauters M, Mertens I, Rankinen T, Chagnon M, Bouchard C, and Van Gaal L. Leptin receptor gene polymorphisms are associated with insulin in obese women with impaired glucose tolerance. J Clin Endocrinol Metab. (2001) 86:3227–32. doi: 10.1210/jcem.86.7.7682
26. Boumaiza I, Omezzine A, Rejeb J, Rebhi L, Ouedrani A, Ben Rejeb N, et al. Relationship between leptin G2548A and leptin receptor Q223R gene polymorphisms and obesity and metabolic syndrome risk in Tunisian volunteers. Genet Test Mol Biomarkers. (2012) 16:726–33. doi: 10.1089/gtmb.2011.0324
27. de Luis DA, Aller R, Sagrado MG, Izaola O, Terroba MC, Cuellar L, et al. Influence of lys656asn polymorphism of leptin receptor gene on surgical results of biliopancreatic diversion. J Gastrointest Surg. (2010) 14:899–903. doi: 10.1007/s11605-010-1181-3
28. Abete I, Goyenechea E, Crujeiras AB, and Martínez JA. Inflammatory state and stress condition in weight-lowering Lys109Arg LEPR gene polymorphism carriers. Arch Med Res. (2009) 40:306–10. doi: 10.1016/j.arcmed.2009.03.005
29. de Luis DA, Gonzalez Sagrado M, Aller R, Izaola O, and Conde R. Influence of Lys656Asn polymorphism of the leptin receptor gene on insulin resistance in nondiabetic obese patients. J Diabetes Complications. (2008) 22:199–204. doi: 10.1016/j.jdiacomp.2006.10.006
30. Okada T, Ohzeki T, Nakagawa Y, Sugihara S, and Arisaka O. Impact of leptin and leptin-receptor gene polymorphisms on serum lipids in Japanese obese children. Acta Paediatr. (2010) 99:1213–7. doi: 10.1111/j.1651-2227.2010.01778.x
31. Constantin A, Costache G, Sima AV, Glavce CS, Vladica M, and Popov DL. Leptin G-2548A and leptin receptor Q223R gene polymorphisms are not associated with obesity in Romanian subjects. Biochem Biophys Res Commun. (2010) 391:282–6. doi: 10.1016/j.bbrc.2009.11.050
32. Pérez-Castrillón JL, Vega G, Abad L, Sanz-Cantalapiedra A, Sagredo MG, De Luis D, et al. Atorvastatin and BMD in coronary syndrome. Role of Lys656Asn polymorphism of leptin receptor gene. Endocr J. (2009) 56:221–5. doi: 10.1507/endocrj.K08E-269
33. Becer E, Mehmetçik G, Bareke H, and Serakıncı N. Association of leptin receptor gene Q223R polymorphism on lipid profiles in comparison study between obese and non-obese subjects. Gene. (2013) 529:16–20. doi: 10.1016/j.gene.2013.08.003
34. de Luis Roman D, de la Fuente RA, Sagrado MG, Izaola O, and Vicente RC. Leptin receptor Lys656Asn polymorphism is associated with decreased leptin response and weight loss secondary to a lifestyle modification in obese patients. Arch Med Res. (2006) 37:854–9. doi: 10.1016/j.arcmed.2006.03.009
35. Rosmond R, Chagnon YC, Holm G, Chagnon M, Pérusse L, Lindell K, et al. Hypertension in obesity and the leptin receptor gene locus. J Clin Endocrinol Metab. (2000) 85:3126–31. doi: 10.1210/jcem.85.9.6781
36. Wu J, Zhuo Q, Tian Y, Piao J, and Yang X. Relationship of diabetes mellitus in older Han adults in China with leptin receptor gene rs1137100 and rs1137101 polymorphrism. Wei Sheng Yan Jiu. (2017) 46:384–8.
37. Daghestani M, Purohit R, Daghestani M, Daghistani M, and Warsy A. Molecular dynamic (MD) studies on Gln233Arg (rs1137101) polymorphism of leptin receptor gene and associated variations in the anthropometric and metabolic profiles of Saudi women. PloS One. (2019) 14:e0211381. doi: 10.1371/journal.pone.0211381
38. Liu M, Li S, Guan M, Bai S, Bai W, and Jiang X. Leptin pathway is a crucial target for anthocyanins to protect against metabolic syndrome. Crit Rev Food Sci Nutr. (2024) p:1–16. doi: 10.1080/10408398.2024.2323093
39. Fan X, Yuan W, Huang W, and Lin Z. Recent progress in leptin signaling from a structural perspective and its implications for diseases. Biochimie. (2023) 212:60–75. doi: 10.1016/j.biochi.2023.04.011
40. Genchi VA, D'Oria R, Palma G, Caccioppoli C, Cignarelli A, Natalicchio A, et al. Impaired leptin signalling in obesity: is leptin a new thermolipokine? Int J Mol Sci. (2021) 22:6445. doi: 10.3390/ijms22126445
41. Mohamed AA, Abo-Elmatty DM, Wahba AS, Esmail OE, Salim HSM, Hegab WSM, et al. Leptin Rs7799039 polymorphism is associated with type 2 diabetes mellitus Egyptian patients. Arch Physiol Biochem. (2024) 130:742–54. doi: 10.1080/13813455.2023.2265078
42. Wang H, Wang C, Han W, Geng C, Chen D, and Wu B. Association of leptin and leptin receptor polymorphisms with coronary artery disease in a North Chinese Han population. Rev Soc Bras Med Trop. (2020) 53:e20190388. doi: 10.1590/0037-8682-0388-2019
43. Bains V, Kaur H, and Badaruddoza B. Association analysis of polymorphisms in LEP (rs7799039 and rs2167270) and LEPR (rs1137101) gene towards the development of type 2 diabetes in North Indian Punjabi population. Gene. (2020) 754:144846. doi: 10.1016/j.gene.2020.144846
44. Kolić I, Stojković L, Stankovic A, Stefanović M, Dinčić E, and Zivkovic M. Association study of rs7799039, rs1137101 and rs8192678 gene variants with disease susceptibility/severity and corresponding LEP, LEPR and PGC1A gene expression in multiple sclerosis. Gene. (2021) 774:145422. doi: 10.1016/j.gene.2021.145422
45. Gonçalves E, Smaoui S, Brito M, Oliveira JM, Arez AP, and Tavares L. Sickle cell disease: current drug treatments and functional foods with therapeutic potential. Curr Issues Mol Biol. (2024) 46:5845–65. doi: 10.3390/cimb46060349
46. Zhang Y, Yang J, Pang Q, Lv Z, Zhu D, Wang Y, et al. Lipid-lowering effect of danshen, fufang danshen, shuxuening and shuxuetong injections: A systematic review and meta-analysis of controlled clinical trials. Tohoku J Exp Med. (2024) 266:47–58. doi: 10.1620/tjem.2024.J079
47. Zhang Z and Song Y. Causal relationship between depression and hypercholesterolemia: A bidirectional 2-sample Mendelian randomization study. Med (Baltimore). (2024) 103:e38234. doi: 10.1097/MD.0000000000038234
Keywords: leptin, rs7799039, rs1137101, rs1805094, glucose-lipid metabolism, variant
Citation: Song Y, Zhang Y, Liu X, Gong W, Ai Y, Shen B, Li J and He C (2025) The rs7799039 variant in the leptin gene promoter drives insulin resistance through reduced serum leptin levels. Front. Endocrinol. 16:1589575. doi: 10.3389/fendo.2025.1589575
Received: 07 March 2025; Accepted: 19 September 2025;
Published: 13 October 2025.
Edited by:
Tadashi Nakagawa, Tohoku University, JapanReviewed by:
Ali Sazci, Okan University, TürkiyeStephen Opoku, University of Alabama at Birmingham, United States
Copyright © 2025 Song, Zhang, Liu, Gong, Ai, Shen, Li and He. This is an open-access article distributed under the terms of the Creative Commons Attribution License (CC BY). The use, distribution or reproduction in other forums is permitted, provided the original author(s) and the copyright owner(s) are credited and that the original publication in this journal is cited, in accordance with accepted academic practice. No use, distribution or reproduction is permitted which does not comply with these terms.
*Correspondence: Chuan He, aGVjaHVhbmNkdUBxcS5jb20=
†These authors have contributed equally to this work and share first authorship