 Shuangqing Liu1†
 Juan Li2†
 Yang Fang3,4Xiujuan Wu5
 Yang Cao1Keke Cai6,7
 Jing Yu3,4Yan Zhao8*Yitao Duan3,4*
- 1Department of Clinical Laboratory, The Second Hospital of Tianjin Medical University, Tianjin, China
- 2Department of Respiratory, Characteristic Medical Center Of Chinese People’s Armed Police Force, Tianjin, China
- 3Department of Laboratory Medicine, the Third Affiliated Hospital of Zhengzhou University, Zhengzhou, China
- 4Zhengzhou Key Laboratory for In Vitro Diagnosis of Hypertensive Disorders of Pregnancy, Department of Laboratory Medicine, the Third Affiliated Hospital of Zhengzhou University, Zhengzhou, China
- 5People’s Hospital of Zhengzhou University, Heart Center of Henan Provincial People’s Hospital, Central China Fuwai Hospital, Central China Fuwai Hospital of Zhengzhou University, Zhengzhou, China
- 6Department of Urology, Tianjin Medical University Nankai Hospital, Tianjin, China
- 7Department of Urology, Tianjin Nankai Hospital, Tianjin, China
- 8Department of Endocrinology, the Second Hospital of Tianjin Medical University, Tianjin, China
Background: Patients with type 2 diabetes mellitus (T2DM) have an increased susceptibility to urinary tract infections (UTIs), caused by uropathogenic Escherichia coli (UPEC). Asymptomatic bacteriuria (ASB) is a significant contributor, but lots of patients are difficult to distinguish. Distinguishing between ASB and symptomatic UTIs can greatly assist clinicians in rational use of antimicrobials.
Methods: Patients with T2DM and UTIs caused exclusively by UPEC were recruited from the Second Hospital of Tianjin Medical University between 2018 and 2023. Demographic and clinical data were systematically collected for these patients through a retrospective electronic chart review, in accordance with the inclusion and exclusion criteria. We utilized this dataset as training set to develop an ASB predictive model called ASBPredictor.
Results: A total of 337 cases were collected, comprising 158 cases (46.9%) of ASB and 179 cases (53.1%) of symptomatic UTIs. Based on the optimal predictive model, ASBPredictor exhibited a remarkable level of precision, achieving an area under the curve score of 0.82. The identification of ASB is influenced by several crucial factors, including urinary bacteria, urinary white blood cell clusters, C-reactive protein, alanine aminotransferase, glucose, gamma-glutamyl transpeptidase, sodium ions (Na+), and eosinophils.
Conclusion: The ASBPredictor is an accurate, efficient, and reliable tool that helps doctors differentiate between ASB and symptomatic UTIs. This precise differential diagnosis has the potential to enhance the quality of antimicrobial prescribing.
Introduction
Type 2 diabetes mellitus (T2DM) is a significant global health issue. According to a survey conducted by the International Diabetes Federation (IDF) in 2021, there are approximately 537 million DM patients worldwide, and this number is predicted to rise to 783 million by 2045 (1). T2DM accounts for the vast majority (> 90%) of diabetes worldwide (2, 3). Urinary tract infections (UTIs) are the second most common infection among hospitalized patients (4, 5), which are commonly caused by uropathogenic Escherichia coli (UPEC) (6–8). UTIs in patients with T2DM are more than 4 times as common as in normal people (9), and the increased risk of UTIs in individuals with T2DM can be attributed to various factors, including hyperglycemia, impaired immune function, and structural changes in the urinary tract (10).
The term ‘UTIs’ typically includes both symptomatic UTIs and asymptomatic bacteriuria (ASB). In patients with T2DM, ASB typically has a higher prevalence compared to symptomatic UTIs (11). Multiple guidelines (12, 13) typically recommend against intervening in cases of ASB, except for pregnant individuals (14) and patients requiring urological surgery, compared to symptomatic UTIs. Instead, treating ASB may expose patients to the risks associated with antimicrobials, including adverse drug reactions and antimicrobials resistance, potentially leading to prolonged hospital stays for those who are hospitalized (15–17). Despite the existence of guidelines (12, 13) and measures (15, 18–20) aimed at improving the management of ASB, up to 80% hospitalized patients with ASB are still treated with antimicrobials (4). In addition to doctors having limited clinical experience (21) and not following guidelines, another significant factors is the difficulty in distinguishing between UTIs and ASB based on clinical symptoms in some patients, such as those with vague consciousness or unclear expression (22, 23), elderly patients with decreased sensitivity (24, 25), and patients with prostatitis (26) or prostatic hyperplasia (27). Several biomarkers have been researched to assist clinicians in identifying ASB, but their effectiveness is limited (28, 29).
Machine learning (ML) algorithms can identify patterns and risk factors, leading to earlier and more accurate diagnoses and personalized treatment plans. In case of UTIs, ML has been used to predict UTI presence (30) and antimicrobial susceptibility test (AST) results (31). For instance, Xiong et al. achieved a remarkable area under the curve (AUC) score of 0.979 in predicting UTIs in T2DM by employing a gradient boosting algorithm (32). Nevruz et al. found that a random forest algorithm had the highest accuracy in predicting uropathogen antimicrobial resistance, with AUCs ranging from 0.777 to 0.884 for different antimicrobials (33). Other models like XGBoost (34), PittUDT (35), and NoMicro models (36) have also been trained. However, there is currently no research on ML for differentiating ASB from symptomatic UTIs. The objective of this study is to develop a personalized ASBPredictor model that can accurately distinguish between ASB and symptomatic UTIs by using a comprehensive clinical variables dataset. The implementation of this model has the potential to improve clinical decision-making, reduce unnecessary antimicrobial usage, and lower healthcare costs.
Materials and methods
Data collection and preprocessing
In this study, T2DM UTI patients infected only by UPEC were recruited from the Second Hospital of Tianjin Medical University (Tianjin, China) between 2018 and 2023. Patients with positive urine cultures for UPEC were diagnosed with either symptomatic UTIs or ASB, depending on whether they had signs or symptoms meeting UTI diagnostic criteria (12, 13). Specifically, ASB patients could not have any of the following documented signs or symptoms: dysuria, urinary frequency/urgency, suprapubic pain, fever (temperature ≥ 38°C), costovertebral pain/tenderness, hematuria, autonomic dysreflexia, or increased spasticity in patients with spinal cord injury. Patients with acute alterations in mental status often cannot communicate symptoms and were categorized as suffering ASB if they had none of the aforementioned signs or symptoms and no systemic signs of possible infection. Otherwise, the patients would be assigned to the symptomatic UTIs group. Meanwhile, patients were not eligible for inclusion if they met any of the following criteria: (1) pregnant; (2) urinary stent, nephrostomy, altered urinary tract anatomy, or urologic surgery before UC; (3) intensive care unit (ICU) admission within 3 days before or after UC; (4) concomitant infection that results in unclear UTIs symptoms; (5) active treatment and/or prophylaxis for UTIs on admission (4).
Demographic and clinical data were systematically collected for the two groups of patients by retrospective electronic chart review. The following clinical data were recorded: (1) the diabetes control condition and complications; (2) the presence of typical urinary tract symptoms (dysuria, increased urinary frequency, urgency, etc.); (3) all laboratory results obtained on the day (± 1 day) of the first urine sample testing positive for UPEC; (4) antimicrobial sensitivity results for the first urine culture-positive UPEC isolate, which were interpreted using the breakpoints outlined in the 2023 Clinical & Laboratory Standards Institute guidelines.
The data were preprocessed to ensure accuracy and consistency. First, missing values were identified and imputed using the mean values separately calculated for the ASB and symptomatic UTI groups. Next, outliers were detected and removed using statistical methods. Finally, the data were standardized to eliminate the influence of measurement units and enhance comparability between variables. To address missing values in the dataset, we evaluated two imputation strategies: mean imputation and K-nearest neighbors (KNN) imputation. Mean imputation involved replacing missing values with the mean values calculated separately for the ASB and symptomatic UTI groups. KNN imputation utilized the k-nearest neighbors algorithm to estimate missing values based on similar patients’ data patterns. A comparative analysis was performed to determine the optimal imputation method for our dataset (Supplementary Figure 1). Mean imputation demonstrated superior performance with an area under the ROC curve of 0.82 and precision-recall AUC of 0.78, compared to KNN imputation which achieved ROC AUC of 0.70 and PR AUC of 0.65. Based on these results, mean imputation was selected as the primary imputation strategy for the ASBPredictor model development. The processed dataset used for machine learning training is provided in Supplementary Table 1.
To ensure data quality, differential diagnosis of ASB, data entry, and cleaning were performed by two independent researchers. In cases of discrepancies, a third researcher was consulted to resolve differences. All data were stored securely and analyzed using appropriate statistical software.
External validation dataset
To assess the temporal generalizability of the ASBPredictor model, we collected an independent validation dataset from the same institution covering the period from January 1, 2024, to June 25, 2025. This validation cohort included 103 patients, applying identical inclusion and exclusion criteria as the training dataset. The same data collection procedures, laboratory measurement protocols, and clinical assessment methods were employed to ensure consistency. Detailed characteristics of the validation dataset are provided in Supplementary Table 2.
Feature selection
Feature selection was meticulously carried out to identify the most significant predictors of ASB versus symptomatic UTIs. We employed a variety of methods for this purpose, including correlation analysis, univariate logistic regression, and recursive feature elimination (RFE). Antibacterial drug sensitivity and laboratory features demonstrating strong correlations with the outcome variable were preserved, whereas those exhibiting minimal correlations were excluded from further analysis. In addition to these techniques, advanced methods such as Shapley Additive exPlanations (SHAP) (37) and Uniform Manifold Approximation and Projection for Dimension Reduction (UMAP) (38) were utilized to further elucidate the relationships and importance of the selected features.
Machine learning methods
In this investigation, we utilized an array of machine learning algorithms to accurately predict the diagnosis based on the extracted features. The algorithms tested included Support Vector Machine (SVM), Decision Trees, Random Forest, K-Nearest Neighbors (KNN), Neural Networks, XGBoost, LightGBM. These models were implemented using the SciKit-learn library in Python (39).
We systematically evaluated seven state-of-the-art machine learning algorithms to identify the optimal approach for ASB prediction (Table 1). The algorithm selection encompassed traditional machine learning methods (SVM, Decision Trees, KNN), ensemble methods (Random Forest), deep learning approaches (Neural Networks), and advanced gradient boosting frameworks (XGBoost, LightGBM).
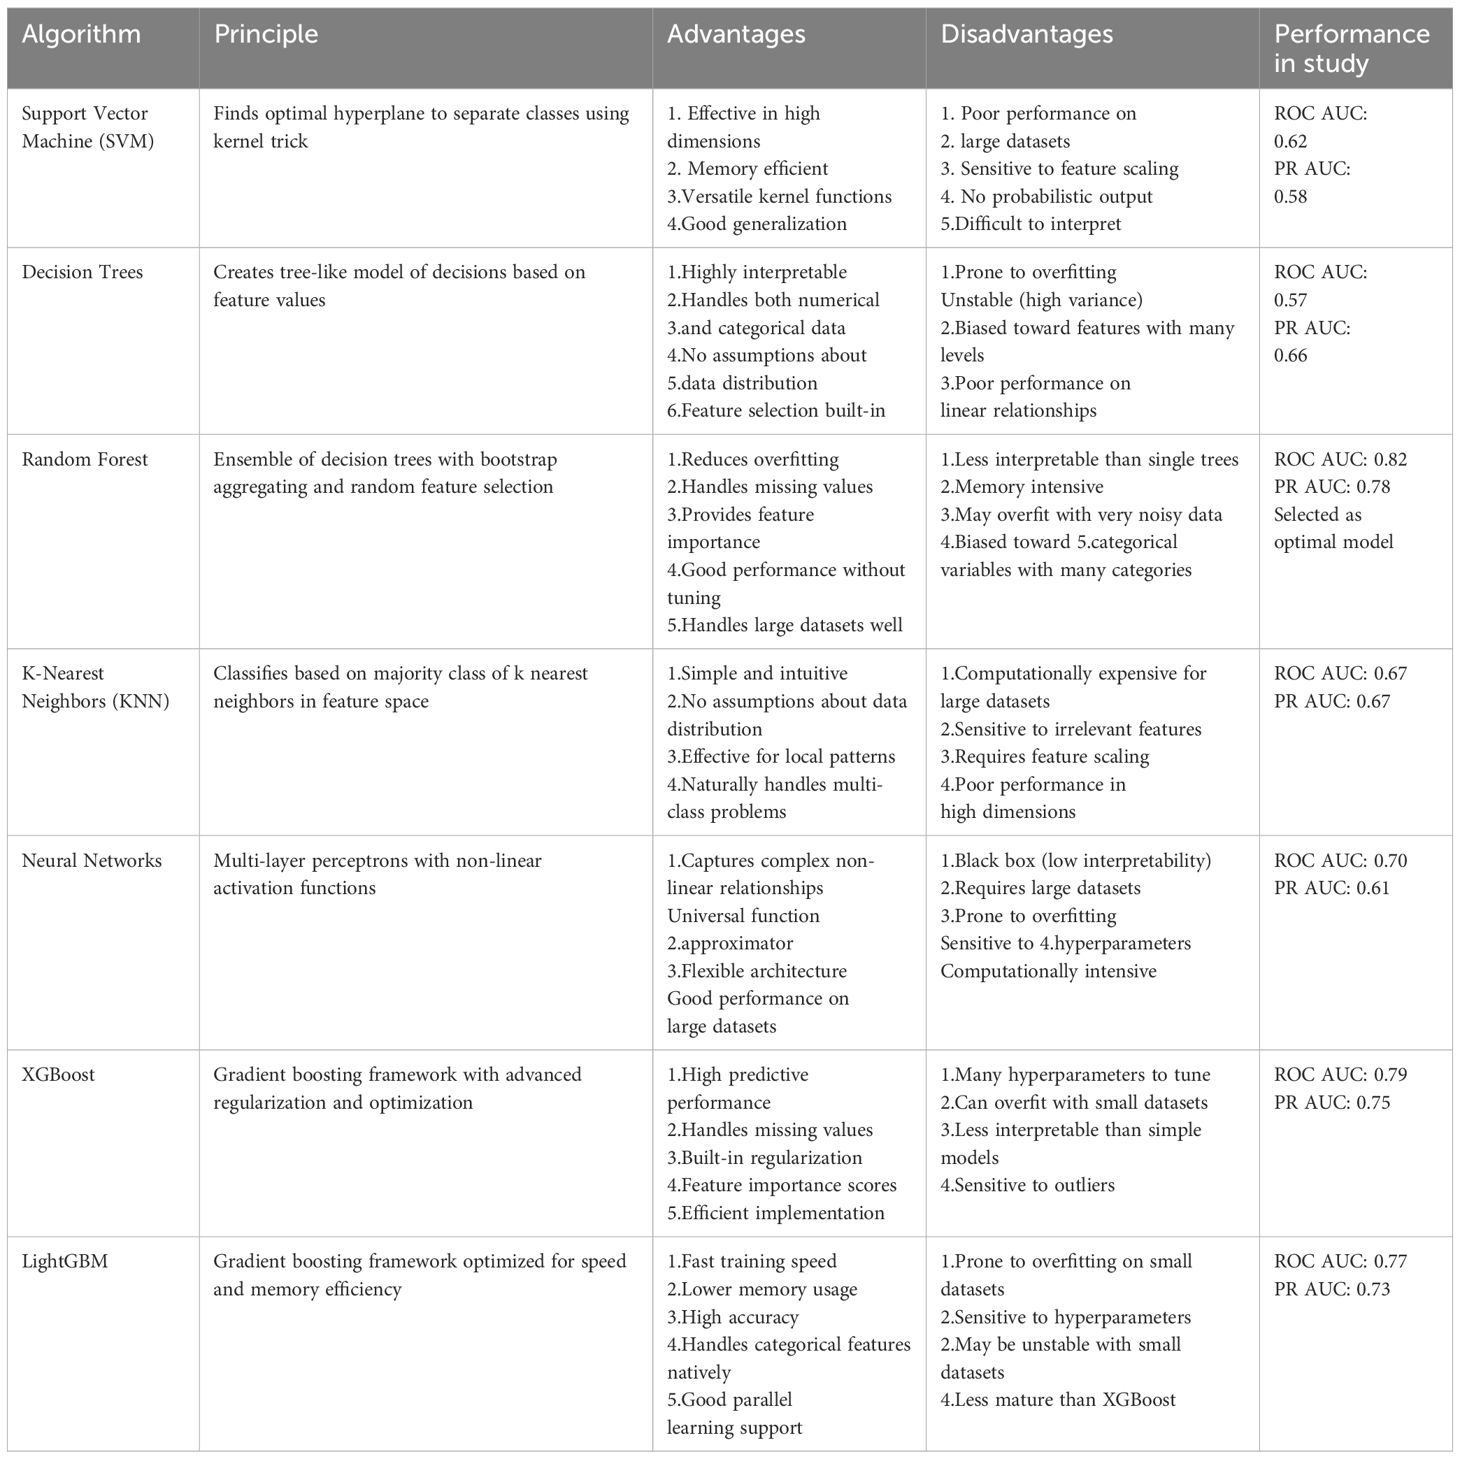
Table 1. Machine learning algorithms evaluated in ASBPredictor development.
Each algorithm was chosen based on its specific strengths and applicability to clinical data. Traditional methods provided interpretability and baseline performance, ensemble methods offered improved robustness and reduced overfitting, while gradient boosting frameworks provided state-of-the-art predictive performance. The comprehensive evaluation ensured that the selected model (Random Forest, ROC AUC = 0.82) represented the optimal balance between predictive accuracy, interpretability, and clinical applicability for the ASBPredictor system.
Each model was meticulously trained utilizing a subset of selected features enhanced through hyperparameter optimization. Their performance was assessed using a suite of evaluation metrics, including accuracy, precision, recall, F1 score, and the AUC. By analyzing the performance outcomes across these diverse algorithms, we were able to ascertain the most efficacious model for discriminating ASB from symptomatic UTIs. To address potential class imbalance concerns and ensure model robustness, we evaluated the Synthetic Minority Oversampling Technique (SMOTE) for data augmentation. Although our dataset showed relatively balanced distribution between ASB (46.9%) and symptomatic UTI (53.1%) cases, we performed comparative analysis using SMOTE to generate synthetic samples and assess potential performance improvements. The SMOTE analysis (Supplementary Figure 2) demonstrated nearly identical performance between the original Random Forest model (ROC AUC = 0.86, PR AUC = 0.83) and the SMOTE-augmented model (ROC AUC = 0.86, PR AUC = 0.85), indicating that our original model was not significantly affected by class imbalance.
Evaluation metrics
In our research, the primary objective was to predict the likelihood of either ASB or symptomatic UTIs using a robust machine learning framework. We implemented a tenfold cross-validation technique to ensure the model’s reliability and generalizability. The effectiveness of our predictive model was quantitatively measured using several key evaluation metrics: the true positive rate (TPR, recall) (1), false positive rate (FPR) (2), and positive predictive value (PPV, precision) (3) calculate as follows:
Results
Overview of ASBPredictor performance and selection criteria
In the study, a total of 337 cases were collected, comprising 158 cases (46.9%) of ASB and 179 (53.1%) cases of symptomatic UTIs. Extensive feature engineering was conducted utilizing laboratory data, and the ML models mentioned above were evaluated. These models underwent a rigorous 10-fold cross-validation process to ascertain their performance. The evaluation metrics focused on the area under the precision-recall curve (auPRC) and receiver operating characteristic (ROC) curve to select the best performing model. The selected model demonstrated promising capabilities in distinguishing between ASB and symptomatic UTIs effectively (Figure 1).
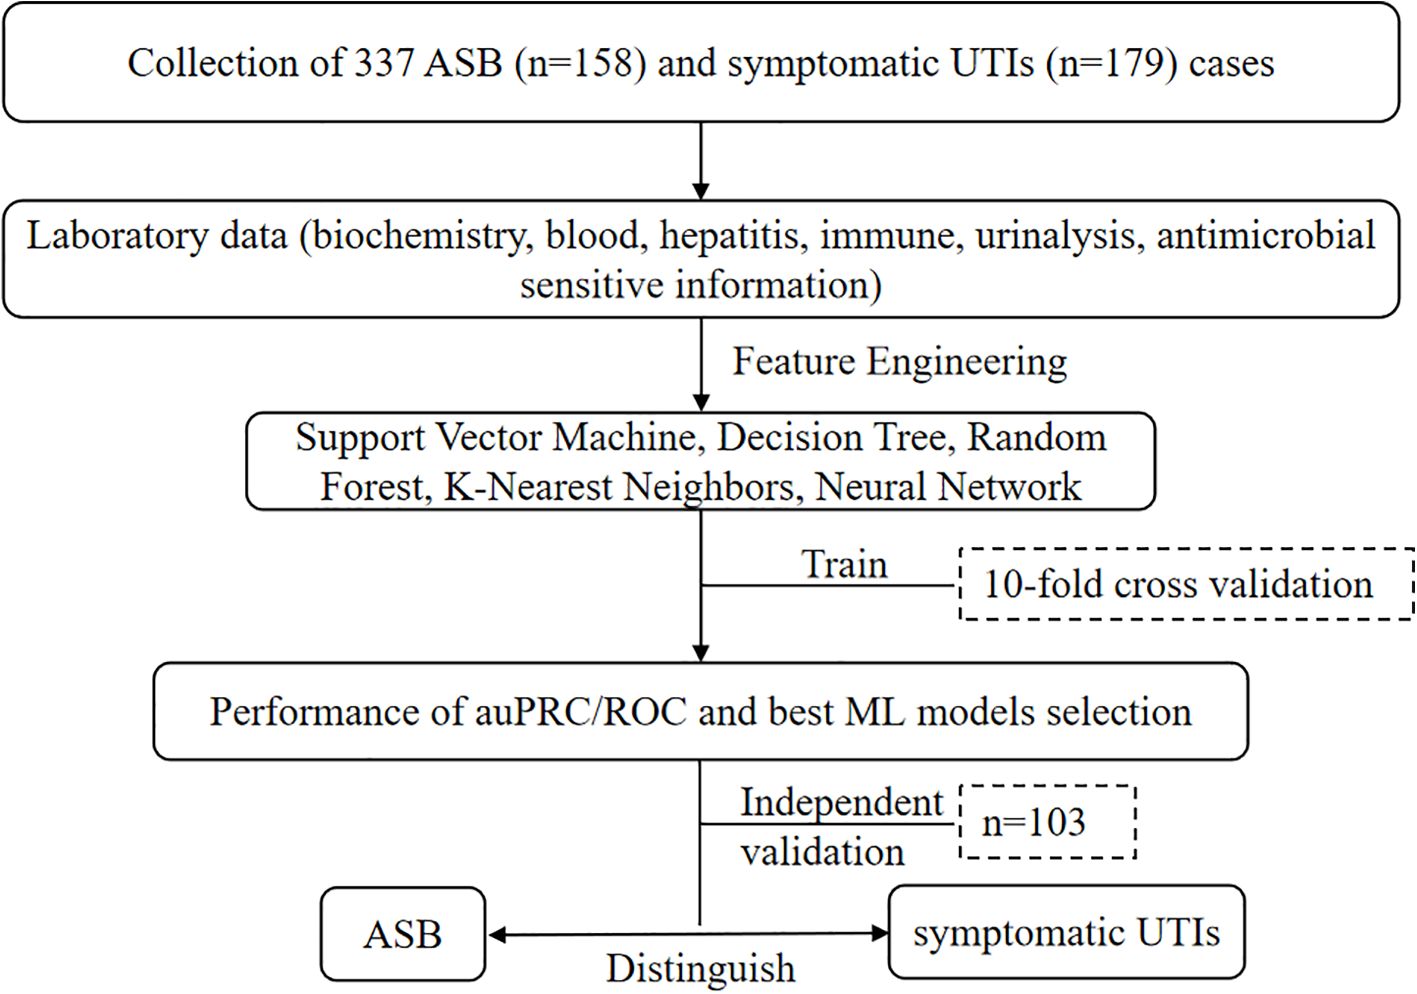
Figure 1. Performance metrics and machine learning model selection flowchart for distinguishing ASB and symptomatic UTIs using various classification techniques and comprehensive laboratory datasets.
Clinical and laboratory features
The Shapley values (SHAP) and UMAP were utilized to explain the feature selected. The SHAP summary plot provides insights into the contribution of each feature towards the prediction of ASB presence. Features such as C-reactive protein (CRP), bacterial particle of automated urine flow cytometry (BACT), urine white blood cell clusters (UWBCC), alanine aminotransferase (ALT) and blood glucose (GLU) show higher SHAP values, suggesting a significant impact on the model’s output (Figure 2A). Figure 2B illustrates the correlation between various features and ASB based on SHAP values, offering deeper insights into the relationships between the variables and ASB. Upon analysis, certain features, such as BACT, sodium ions (Na+), and eosinophil percentage (EOS%), displayed a strong positive correlation with ASB, while negative correlations were observed for CRP and GLU. These findings suggest that these variables may collectively contribute to the predictive capabilities of the model ASBPredictor. This UMAP scatter plot visualizes the multidimensional data used to predict the presence ASB of developing (Figure 2C). The plot reveals distinct clusters, indicating potential subgroups among patients based on their laboratory profiles.
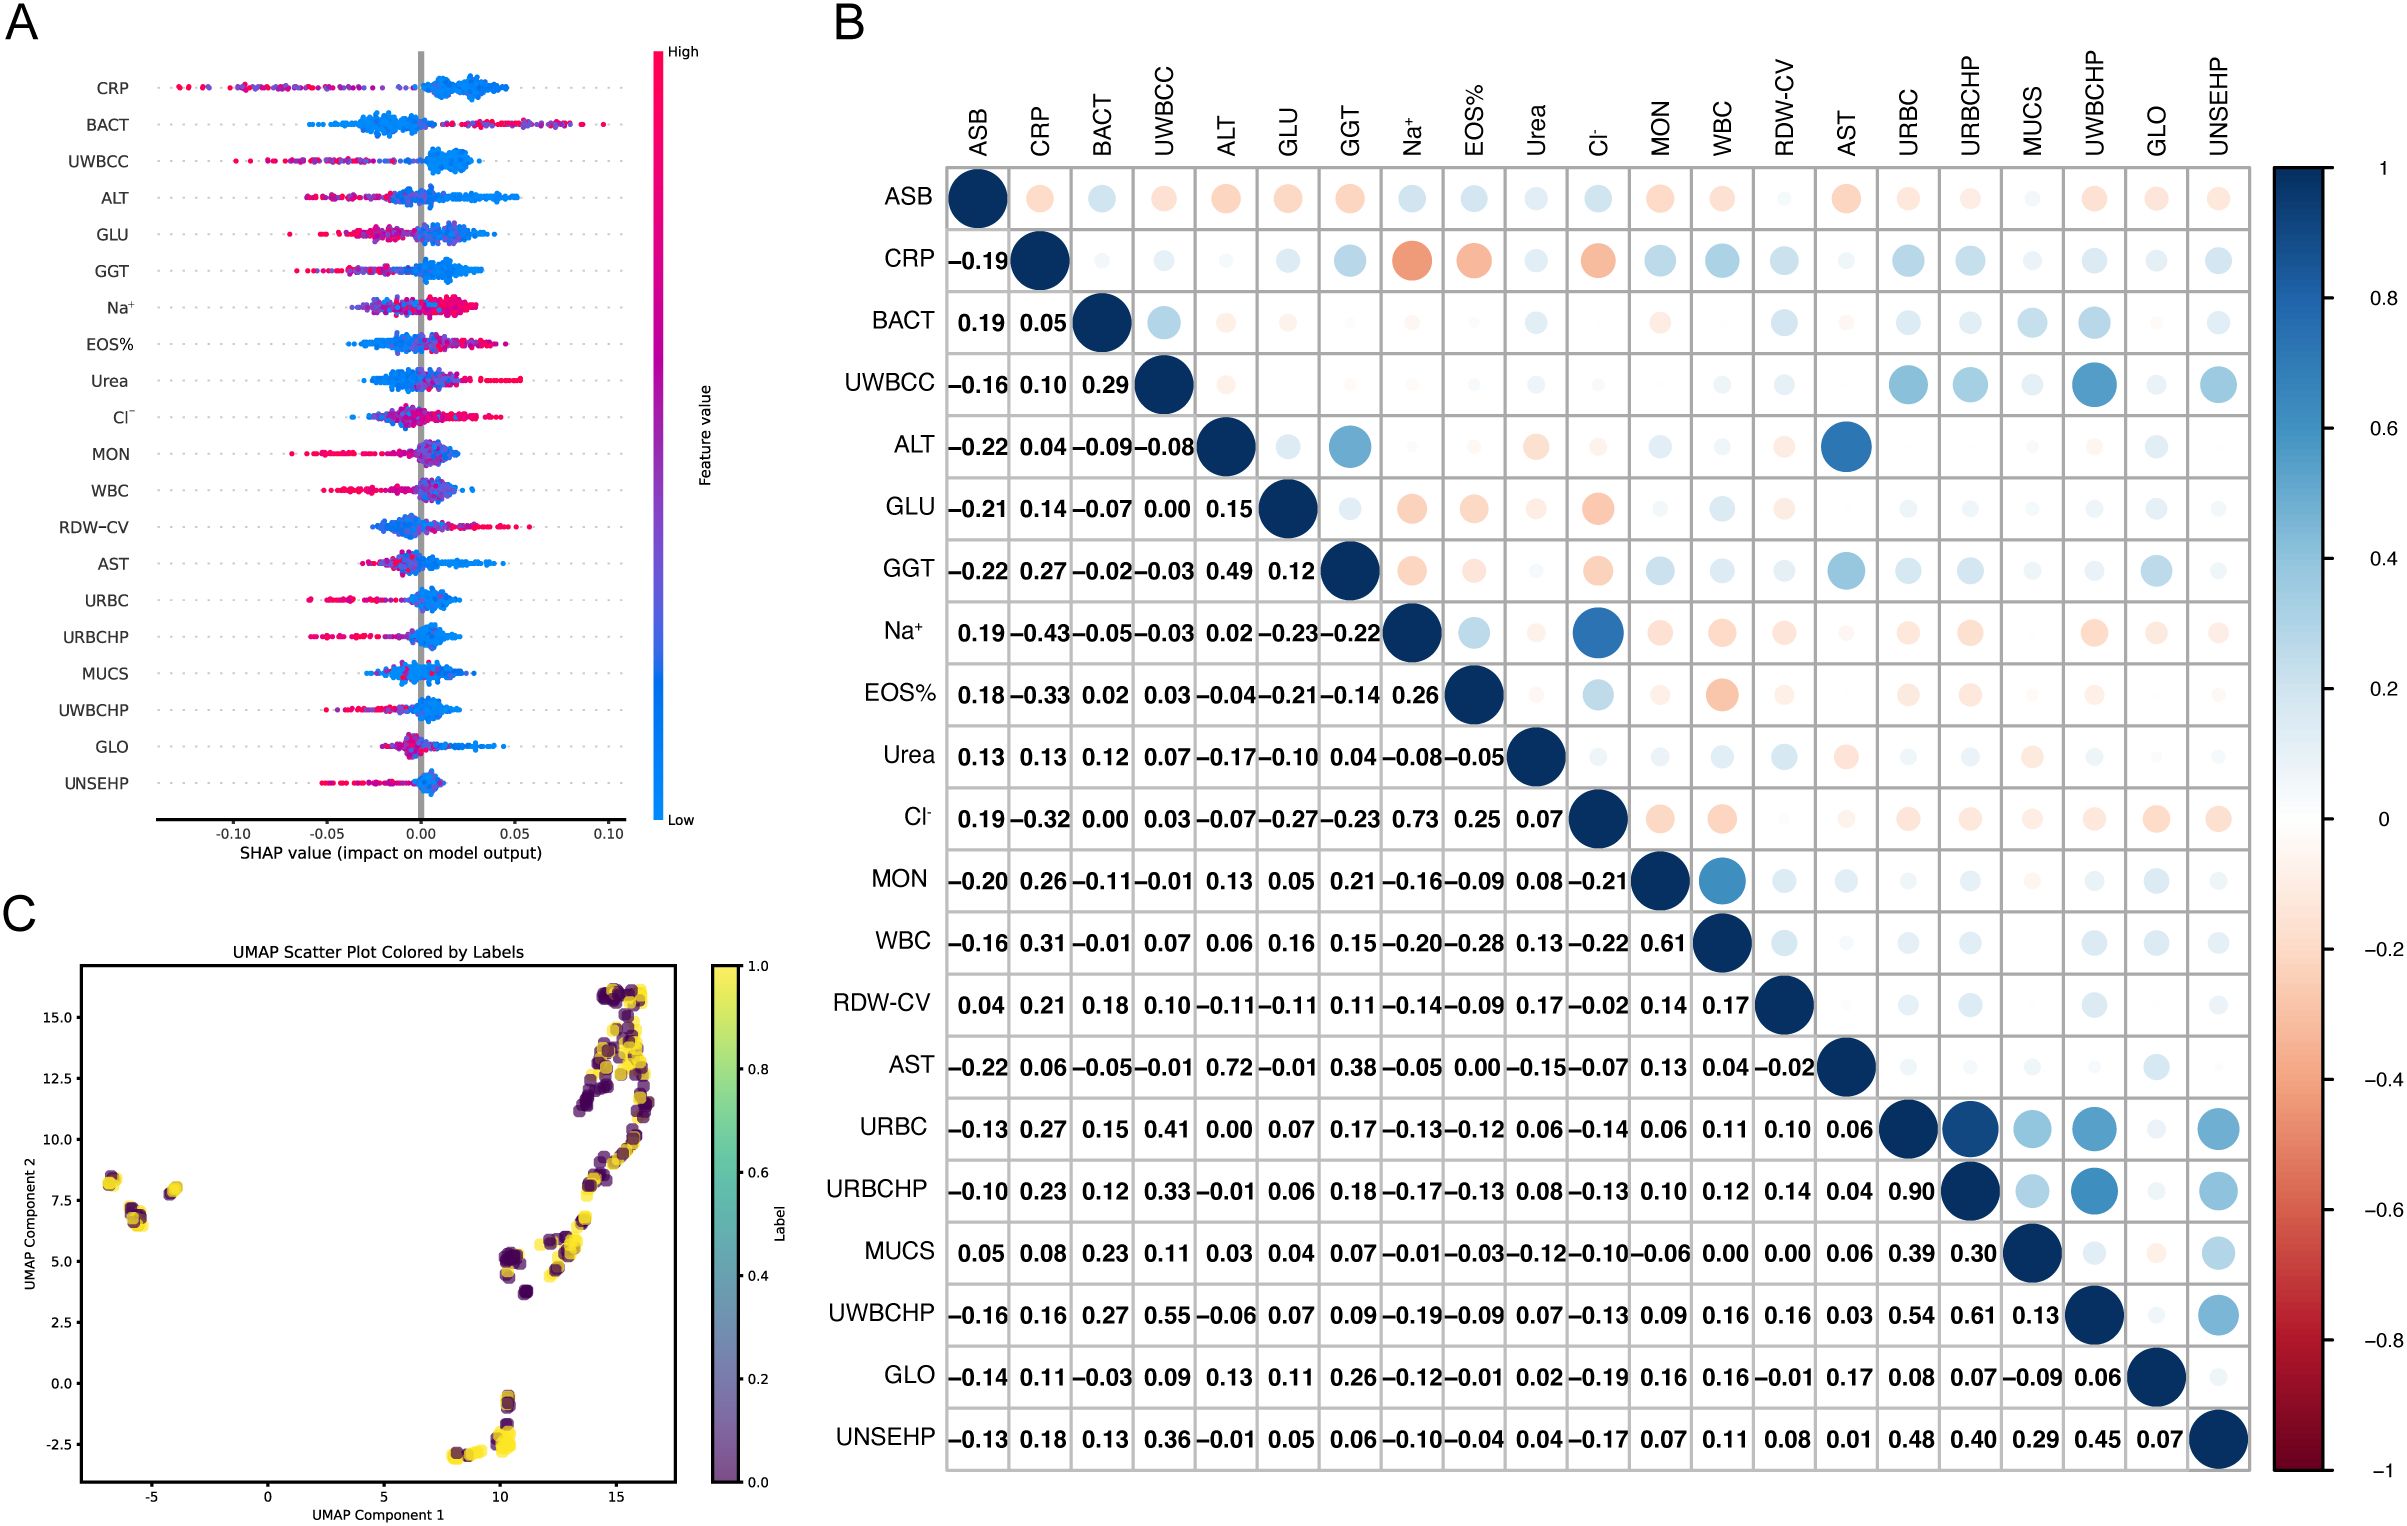
Figure 2. Visualization of Machine Learning Analysis Predicting the Presence of ASB. (A) SHAP summary plot demonstrating the impact of individual features on the prediction model. The color gradient from blue to red indicates the value magnitude of each feature. (B) Correlation heatmap showing Pearson correlation coefficients between SHAP values of features. The color scale transitions from red (negative correlation) to blue (positive correlation), illustrating both synergistic and antagonistic relationships among features influencing model predictions. (C) UMAP scatter plot showcasing the clustering of patient data based on drug sensitivity and laboratory markers.
Performance of machine learning models
The AUC values from the ROC analysis are 0.82, 0.52, and 0.59 for data1_test (laboratory dataset), data2_clinical (clinical dataset), and data3_sensitivity (antimicrobial sensitivity dataset), respectively (Figure 3A). These values demonstrate that the laboratory dataset exhibits the highest capability in cases evaluation, as evidenced by its superior true positive rate against an increasing false positive rate. For the precision-recall curves (PR curves), the AUC scores are 0.78 for data1_test, 0.56 for data2_clinical, and 0.60 for data3_sensitivity (Figure 3B). These results highlight that the ASBPredictor using data1 not only predicts more true positives but also maintains a commendable precision across the predicted positives, which is vital in clinical applications where avoiding false negatives is critical. Interestingly, the joint detection did not show significant superiority. This portion underscores the efficacy of integrating specific sensitivity features into the predictive models, enhancing their diagnostic precision for identifying patients likely to develop ASB.
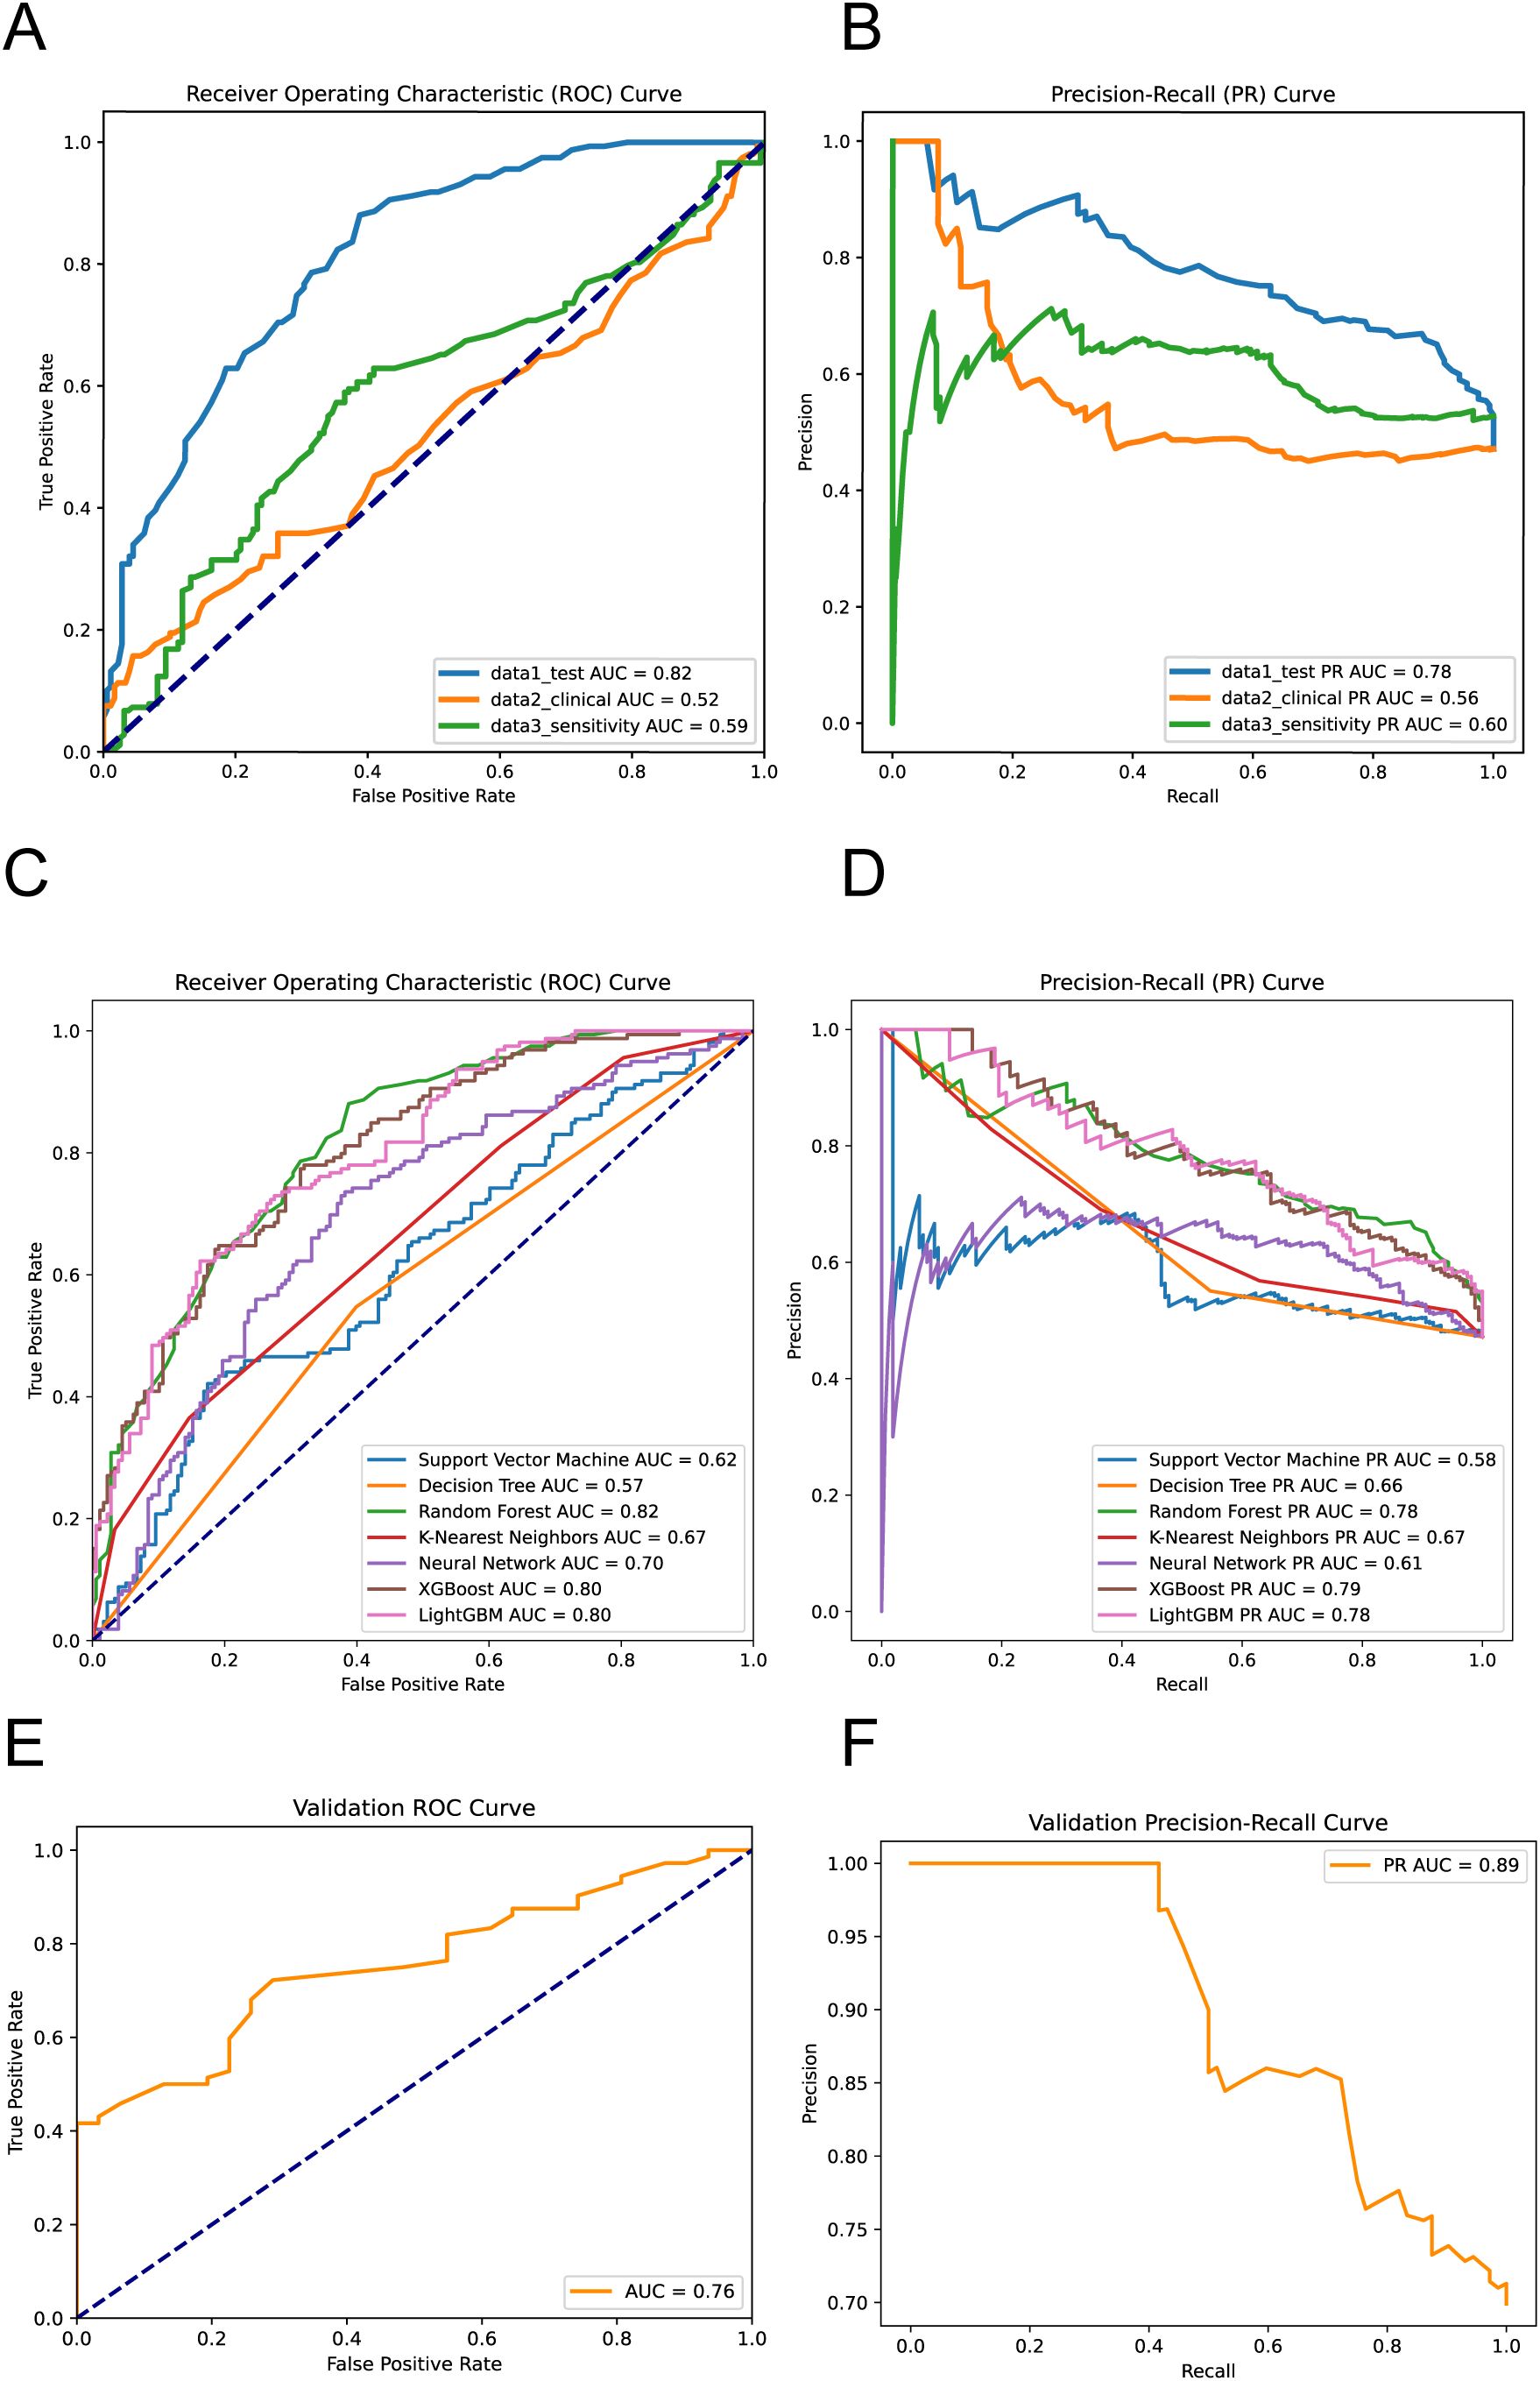
Figure 3. Performance evaluation of the machine learning models. ROC Curves (A) and PR Curves (B) for virous dataset performance. ROC Curves (C) and PR Curves (D) for different machine learning models predicting ASB. External validation results showing ROC Curve (E) and PR Curve (F) on the independent temporal validation dataset (n=103, January 2024 - June 2025) (Equations 1–3).
The ROC analysis reveals the following AUC values: SVM at 0.62, Decision Tree at 0.57, Random Forest at 0.82 (Supplementary Figure 3), KNN at 0.67, and Neural Network at 0.70, XGBoost at 0.80 and LightGBM at 0.80. Notably, the Random Forest model demonstrates the highest capability in differentiating between ASB and symptomatic UTIs cases, indicative of its robustness in handling this predictive task (Figure 3C). The PR curve analysis further supports these findings with AUC values as follows: SVM at 0.58, Decision Tree at 0.66, Random Forest at 0.78, KNN at 0.67, Neural Network at 0.61, XGBoost at 0.79 and LightGBM at 0.78 (Figure 3D). These results suggest that the Random Forest model not only predicts a higher proportion of true positives but also maintains higher precision across its predictions, which is particularly crucial for clinical settings where the consequences of false negatives can be significant. This segment of the analysis highlights the superior performance of the Random Forest algorithm over others, confirming its effectiveness in leveraging complex patterns and interactions within the data to improve diagnostic accuracy for ASB.
To evaluate the temporal generalizability of ASBPredictor, we tested the trained model on an independent validation dataset of 103 patients collected from January 2024 to June 2025. The validation results demonstrated robust model performance with an ROC AUC of 0.76 and PR AUC of 0.89 (Figures 3E, F). These validation metrics, while slightly lower than the training performance (ROC AUC: 0.82, PR AUC: 0.78), remain within an acceptable range and suggest good temporal stability of the model’s predictive capabilities.
Important features in ASB and symptomatic UTIs
Figure 4 presents the comparative distribution of biomarker concentrations between patients with ASB and those diagnosed with symptomatic UTIs. The Y-axis has been carefully scaled to effectively highlight the broad spectrum of biomarker concentrations, clearly delineating the distinctions between the ASB group and the symptomatic UTI group. Notably, BACT, Na+, and EOS% show significantly higher levels in ASB cases compared to symptomatic UTIs, whereas the remaining five biomarkers (CRP, UWBCC, ALT, GLU, and GGT) exhibit markedly elevated concentrations in symptomatic UTIs than in ASB. These findings highlight the substantial variability in biomarker levels between ASB and symptomatic UTIs, further reinforcing their diagnostic relevance.
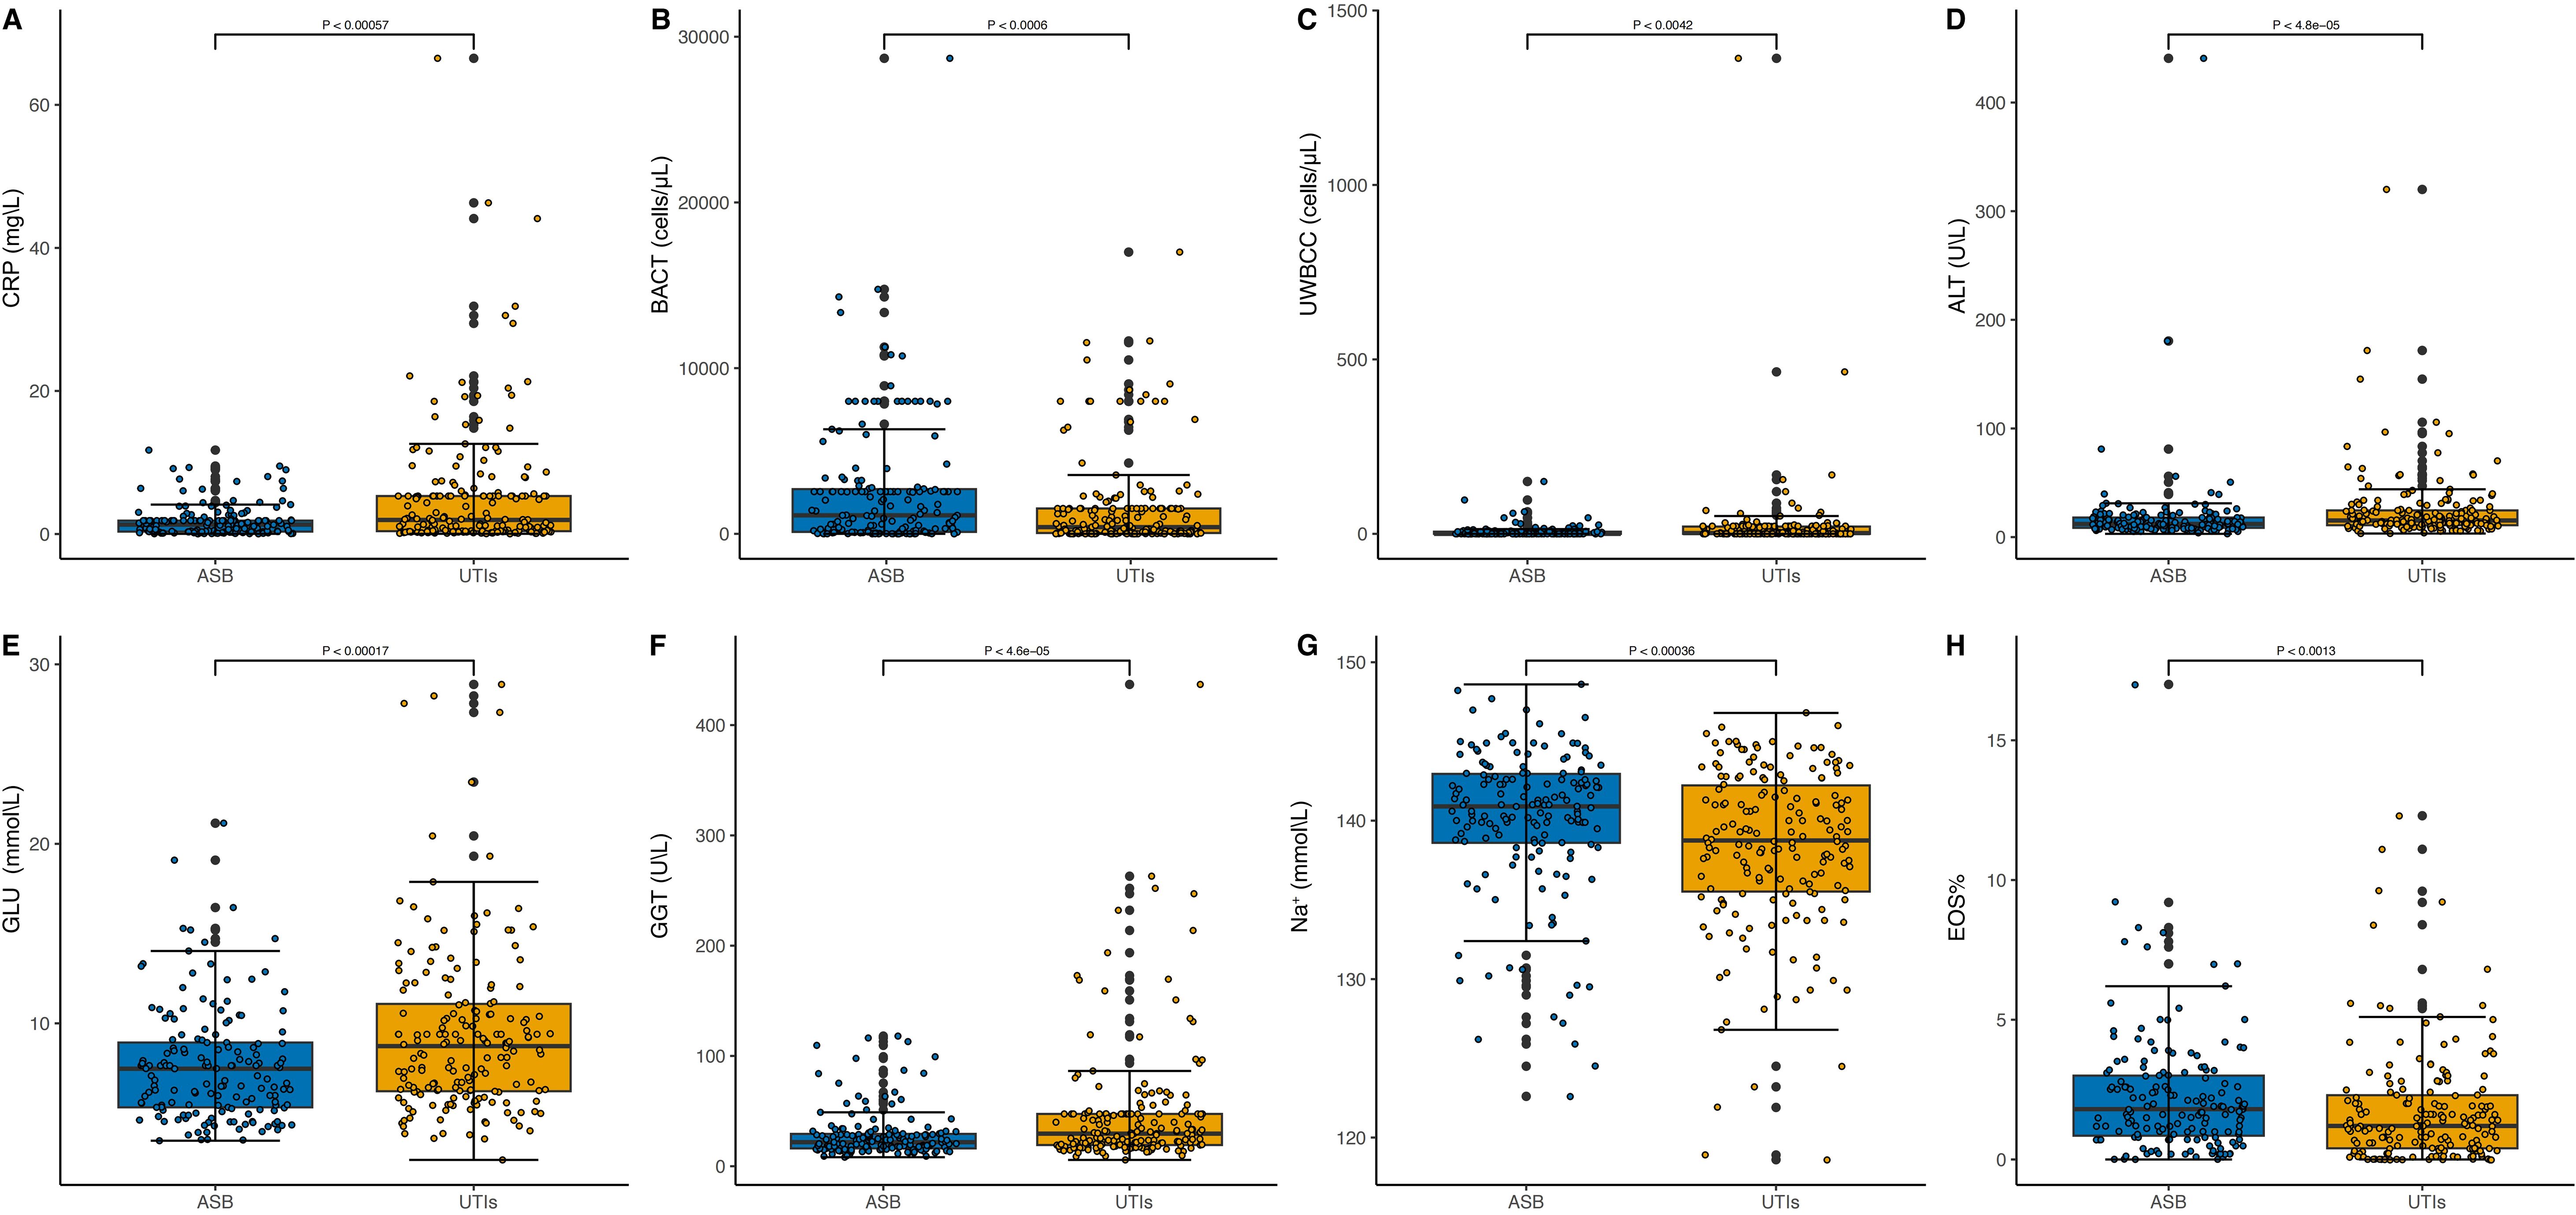
Figure 4. Distribution of Biomarker Concentrations in ASB and symptomatic UTI Cases. In panels labeled (A–H), the Y-axis represents biomarker concentrations while the X-axis categorizes the conditions, distinguishing between ASB and symptomatic UTIs. The median concentrations of the biomarkers are annotated in each plot, highlighting the significant differences in biomarker levels between the two patient groups. CRP (A), BACT (B), UWBCC (C), ALT (D), GLU (E), GGT (F), Na+ (G) and EOS% (H).
Clinical case examples demonstrating ASBPredictor decision-making
To enhance clinical interpretability of the ASBPredictor model, Figure 5 presents four representative patient cases with individual SHAP waterfall plots illustrating how specific laboratory parameters contribute to the differentiation between ASB and symptomatic UTIs. Two ASB cases (Index ID 4 and 10) demonstrate prediction scores of 0.06 and 0.14 respectively, characterized by high bacterial counts (BACT = 3966.0 and 319.09) combined with minimal inflammatory responses (low CRP and UWBCC values), supporting asymptomatic bacteriuria diagnosis. In contrast, two symptomatic UTI cases (Index ID 4 and 7) show prediction scores of 0.79 and 0.86, driven by elevated inflammatory markers including high CRP (29.448), poor glycemic control (GLU = 14.26-15.99), and liver enzyme elevation (ALT = 171.8-8.2, AST = 109.1), indicating active systemic infection. The SHAP waterfall plots provide clinicians with transparent, feature-by-feature explanations of model predictions, where red bars indicate factors favoring symptomatic UTI diagnosis and blue bars support ASB classification. This interpretable approach enables healthcare providers to understand the underlying clinical reasoning behind each prediction, validate model decisions against clinical judgment, and confidently apply the ASBPredictor in routine practice for optimizing antimicrobial stewardship decisions.
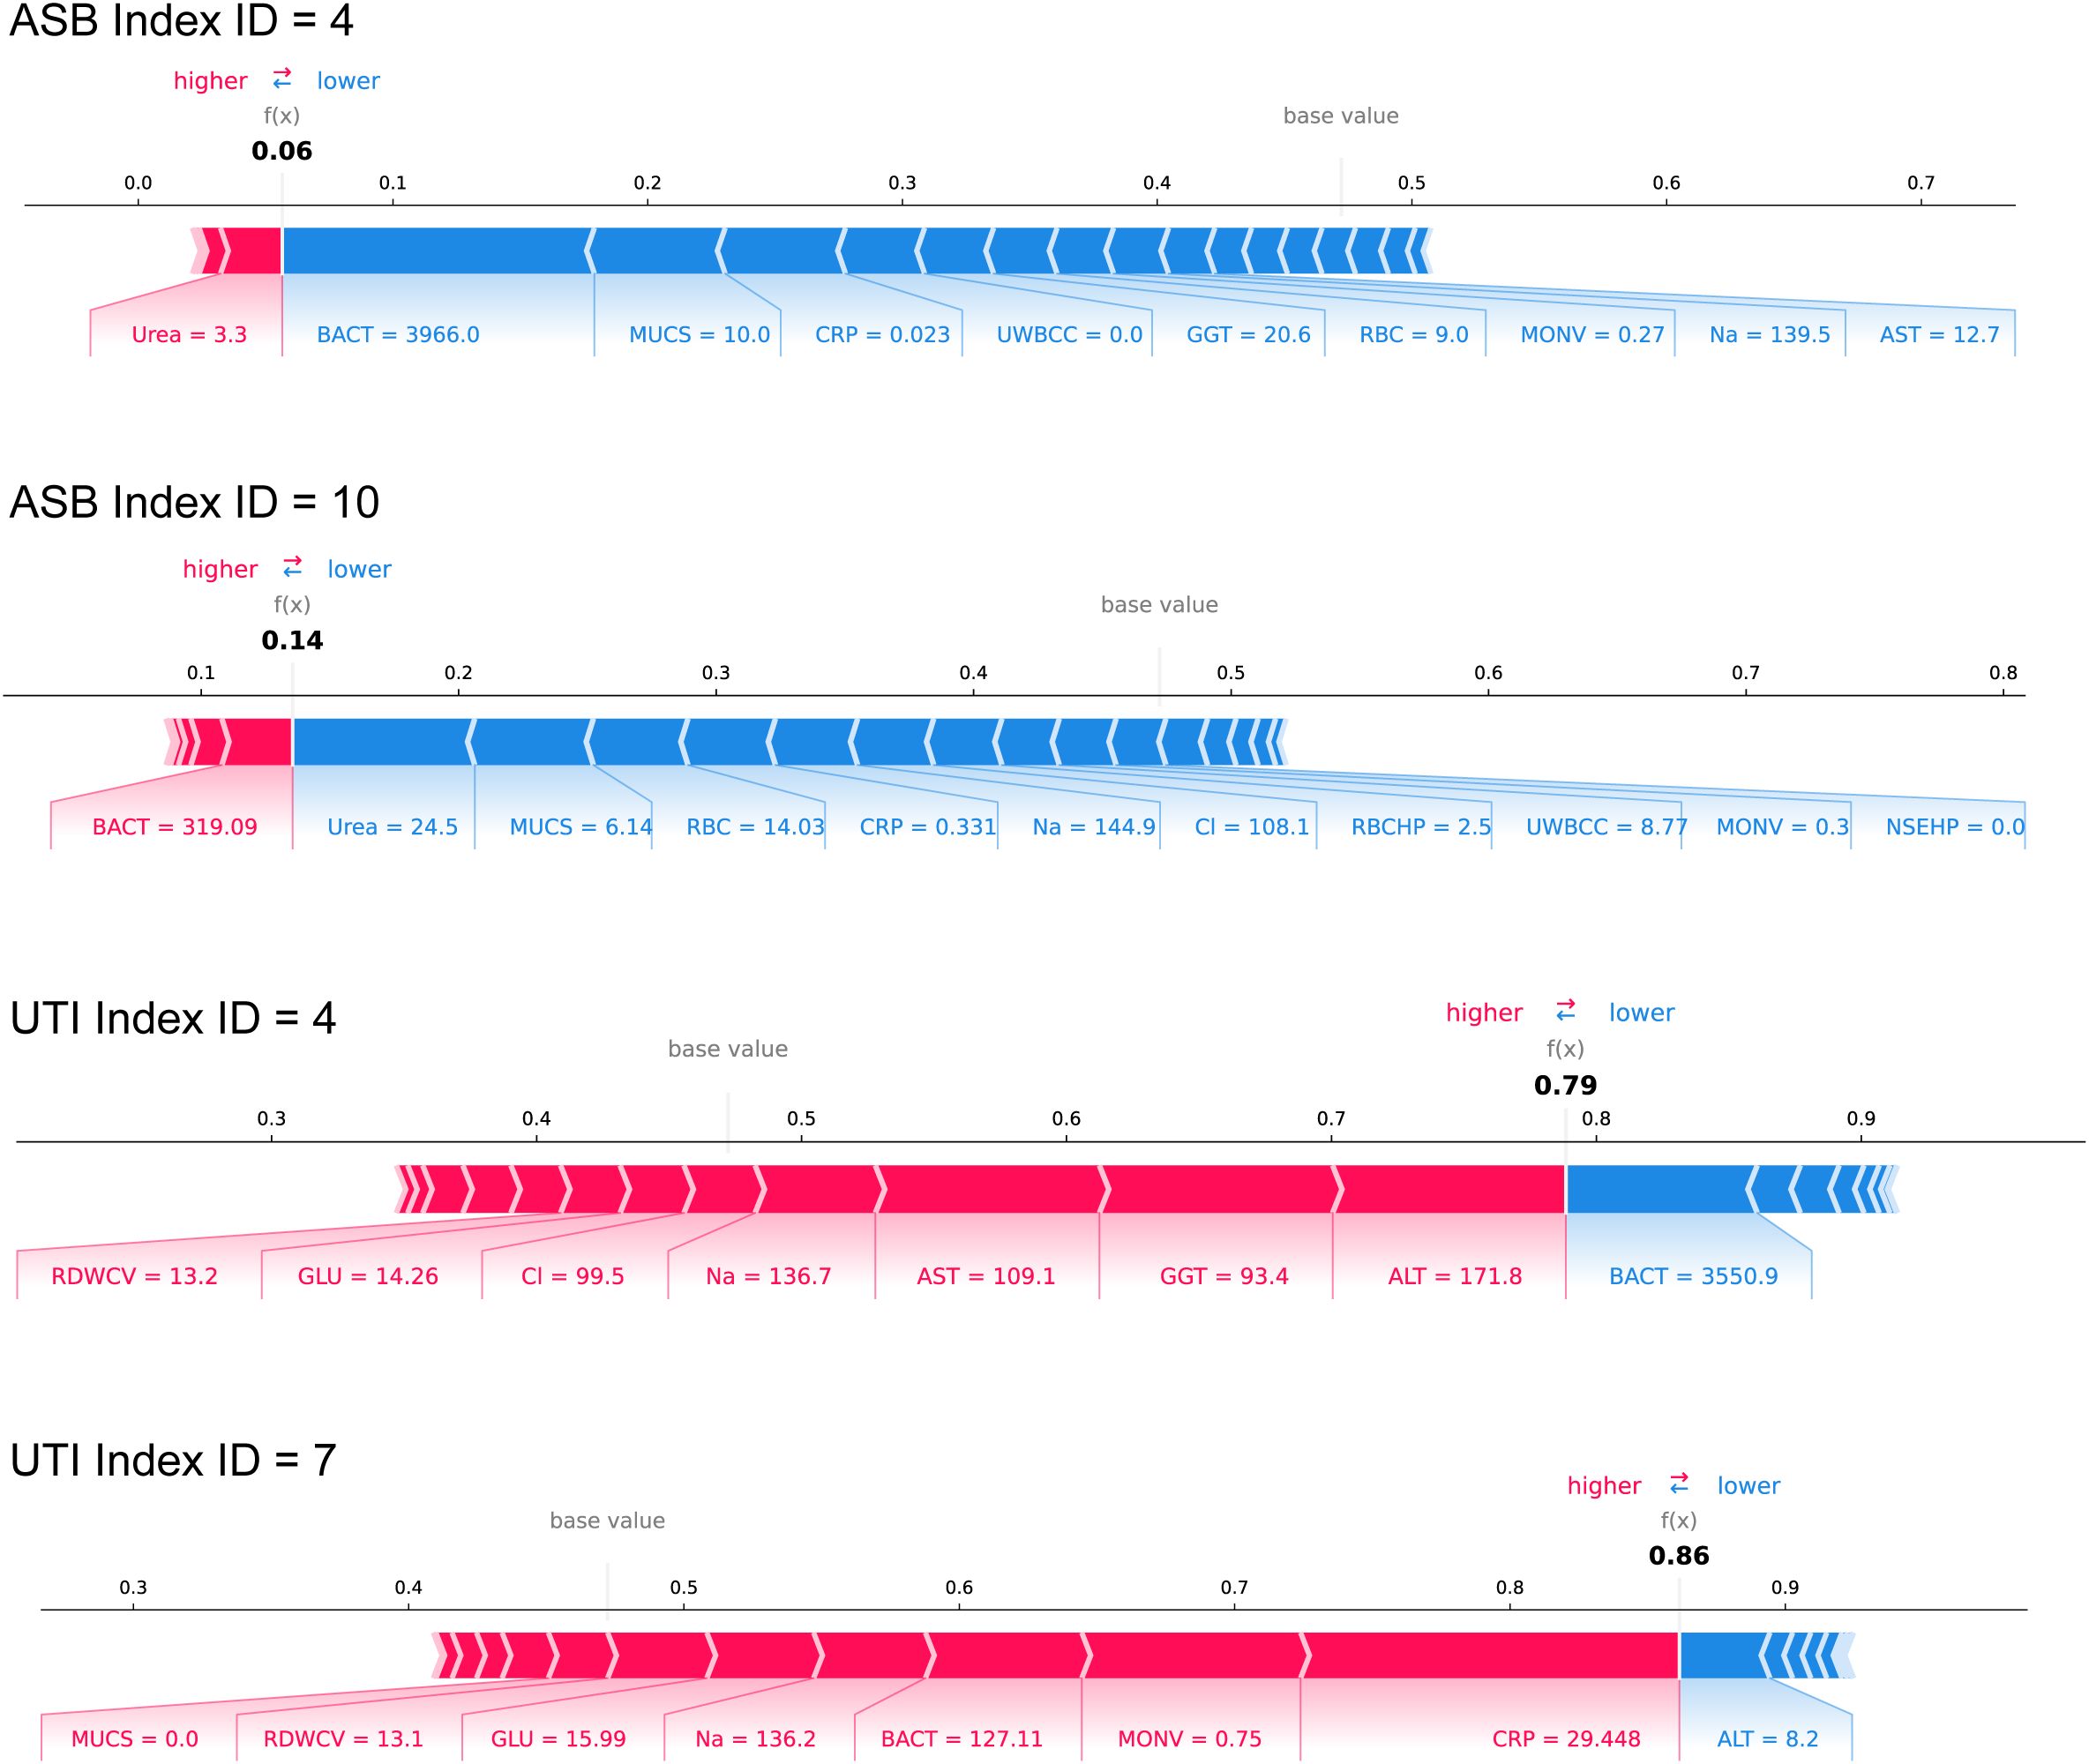
Figure 5. Clinical case examples demonstrating ASBPredictor decision-making process using SHAP waterfall plots. Four representative patient cases are shown: two ASB cases (Index ID 4 and 10) and two symptomatic UTI cases (Index ID 4 and 7).
Discussion
To the best of our knowledge, there is currently no utilization of machine learning algorithms for predicting ASB. The ASBPredictor utilizes a few laboratory indicators to accurately predict the likelihood of ASB by a simple and convenient script. It can assist doctors in making more accurate judgments about ASB, avoiding the uncertainty caused by symptom descriptions. With the intuitiveness and interpretability, ASBPredictor can monitor the changes of laboratory data to predict the progression of ASB, thereby prompting clinical doctors to take intervention measures timely. It can also increase the efficiency of hospital managers in ASB management.
The ASBPredictor model in T2DM incorporates several important features, including inflammatory indicators (CRP), urinary indicators (BACT and UWBCC), biochemical indicators [ALT, GLU, (gamma-glutamyl transpeptidase, GGT), Na+], and blood routine indicators (EOS%). In patients with T2DM, the majority of UTIs, including ASB, are characterized by increased levels of infection markers in urinalysis (40). This study further suggests that BACT could be a promising indicator for ASB, while UWBCC appears to be more closely associated with symptomatic UTIs (Figures 4B, C). Bacterial virulence genes show no significant differences between the two groups (data not shown); the bacterial load disparity between ASB and UTIs may instead stem from variations in human immune status, resulting in higher tolerance of colonization in ASB but greater sensitivity to active infection in UTIs. Additionally, patients with symptomatic UTIs tend to have elevated blood sugar levels compared to individuals with ASB (Figure 4E). Inadequate blood glucose control can lead to increased glucose levels in the urine, creating a more conducive environment for bacterial growth in the urinary tract, thereby raising the risk of UTIs (41, 42). Furthermore, symptomatic UTIs show a stronger correlation with low sodium levels and elevated CRP levels (Figures 4A, E). Consistent with previous findings, significant associations between CRP levels and hyponatremia (Na+ < 135 mmol/L) have been identified (43, 44), and CRP’s diagnostic utility for UTIs has been confirmed by multiple studies (45, 46). It could be understood that CRP (and WBC count as mentioned above), traditionally associated with inflammation, is particularly relevant to symptomatic UTIs which involve a robust host inflammatory response, unlike ASB. Moreover, ALT and GGT exhibit higher concentrations in symptomatic UTIs (Figures 4D, F). However, there are limited reports suggesting that UTIs themselves (47) as well as the use of antimicrobials such as nitrofurantoin (48), cephalosporins (49), quinolones (50), can lead to liver damage and elevate enzymes such as ALT and GGT. Further observation and validation are still needed to determine the impact of these two indicators on ASB and symptomatic UTIs. Lastly, patients with symptomatic UTIs generally have lower EOS% compared to individuals with ASB (Figure 4H). However, there is currently no research examining the correlation between EOS% and UTIs, which necessitates further investigation.
This study has several inherent limitations. First, the stringent data filtering process limits the generalizability of our model. Additionally, missing data for inflammatory factors may affect the accuracy of the predictions. Finally, the predictive model has not yet been externally validated, which is a crucial step in assessing its generalizability and reliability.
Overall, the ASBPredictor effectively predicts the likelihood of ASB using various clinical and laboratory indicators, leveraging machine learning algorithms. This approach has the potential to reduce unnecessary antimicrobial use and lower healthcare costs.
Data availability statement
The datasets presented in this study can be found in online repositories. The names of the repository/repositories and accession number(s) can be found in the article/Supplementary Material.
Ethics statement
The studies involving humans were approved by Ethic committee of the Second Hospital of Tianjin Medical University. The studies were conducted in accordance with the local legislation and institutional requirements. Written informed consent for participation was not required from the participants or the participants’ legal guardians/next of kin in accordance with the national legislation and institutional requirements.
Author contributions
SL: Methodology, Funding acquisition, Writing – original draft, Writing – review & editing. JL: Validation, Writing – original draft, Investigation, Conceptualization. YF: Conceptualization, Writing – original draft, Software, Visualization. XW: Writing – original draft, Data curation, Investigation. YC: Data curation, Resources, Writing – review & editing. KC: Methodology, Writing – review & editing, Investigation. JY: Writing – review & editing, Software, Formal Analysis. YZ: Funding acquisition, Resources, Writing – review & editing, Investigation. YD: Writing – original draft, Writing – review & editing, Funding acquisition, Supervision, Validation, Conceptualization.
Funding
The author(s) declare that financial support was received for the research and/or publication of this article. This research was funded by the Research Plan Project of Tianjin Education Commission (grant no. 2022KJ247), the National Natural Science Foundation of China (grant no. 82202578), PhD research startup foundation of the Third Affiliated Hospital of Zhengzhou University (grant no. 2021077), and Tianjin Technology Innovation Guidance Special Fund (grant no. 23YDTPJC00990).
Conflict of interest
The authors declare that the research was conducted in the absence of any commercial or financial relationships that could be construed as a potential conflict of interest.
Generative AI statement
The author(s) declare that no Generative AI was used in the creation of this manuscript.
Publisher’s note
All claims expressed in this article are solely those of the authors and do not necessarily represent those of their affiliated organizations, or those of the publisher, the editors and the reviewers. Any product that may be evaluated in this article, or claim that may be made by its manufacturer, is not guaranteed or endorsed by the publisher.
Supplementary material
The Supplementary Material for this article can be found online at: https://www.frontiersin.org/articles/10.3389/fendo.2025.1593735/full#supplementary-material.
Supplementary Figure 1 | Comparison of imputation methods for missing data handling in the ASBPredictor model. ROC curves (left panel) and Precision-Recall curves (right panel) comparing the performance of mean imputation versus K-nearest neighbors (KNN) imputation strategies (Equations 1–3).
Supplementary Figure 2 | Performance comparison between original Random Forest model and SMOTE-augmented Random Forest model for ASB prediction (Equations 1–3).
Supplementary Figure 3 | The Random Forest method 10-fold cross-validation methodology process (Equations 1, 2).
Supplementary Table 1 | The trained data of laboratory features.
Supplementary Table 2 | The Validation data of laboratory features.
References
1. International Diabetes Federation. IDF diabetes atlas (2021). Available online at: https://diabetesatlas.org/ (Accessed Dec 11, 2024).
2. Katsarou A, Gudbjörnsdottir S, Rawshani A, Dabelea D, Bonifacio E, Anderson BJ, et al. Type 1 diabetes mellitus. Nat Rev Dis Primers. (2017) 3:17016. doi: 10.1038/nrdp.2017.16
3. Green A, Hede SM, Patterson CC, Wild SH, Imperatore G, Roglic G, et al. Type 1 diabetes in 2017: global estimates of incident and prevalent cases in children and adults. Diabetologia. (2021) 64:2741–50. doi: 10.1007/s00125-021-05571-8
4. Petty LA, Vaughn VM, Flanders SA, Malani AN, Conlon A, Kaye KS, et al. Risk factors and outcomes associated with treatment of asymptomatic bacteriuria in hospitalized patients. JAMA Intern Med. (2019) 179:1519–27. doi: 10.1001/jamainternmed.2019.2871
5. Wang J, Liu F, Tartari E, Huang J, Harbarth S, Pittet D, et al. The prevalence of healthcare-associated infections in mainland China: a systematic review and meta-analysis. Infect Control Hosp Epidemiol. (2018) 39:701–9. doi: 10.1017/ice.2018.60
6. Schwartz L, de Dios Ruiz-Rosado J, Stonebrook E, Becknell B, and Spencer JD. Uropathogen and host responses in pyelonephritis. Nat Rev Nephrol. (2023) 19:658671. doi: 10.1038/s41581-023-00737-6
7. Frick-Cheng AE, Sintsova A, Smith SN, Pirani A, Snitkin ES, and Mobley HLT. Ferric citrate uptake is a virulence factor in uropathogenic Escherichia coli. mBio. (2022) 13:e0103522. doi: 10.1128/mbio.01035-22
8. Chan CCY and Lewis IA. Role of metabolism in uropathogenic Escherichia coli. Trends Microbiol. (2022) 30:1174–204. doi: 10.1016/j.tim.2022.06.003
9. López-de-Andrés A, Albaladejo-Vicente R, Palacios-Ceña D, Carabantes-Alarcon D, Zamorano-Leon JJ, de Miguel-Diez J, et al. Time trends in Spain from 2001 to 2018 in the incidence and outcomes of hospitalization for urinary tract infections in patients with type 2 diabetes mellitus. Int J Environ Res Public Health. (2020) 17:9427. doi: 10.3390/ijerph17249427
10. Geerlings SE. Urinary tract infections in patients with diabetes mellitus: epidemiology, pathogenesis and treatment. Int J Antimicrob Agents. (2008) 31 Suppl 1:S54–7. doi: 10.1016/j.ijantimicag.2007.07.042
11. He K, Hu Y, Shi JC, Zhu YQ, and Mao XM. Prevalence, risk factors and microorganisms of urinary tract infections in patients with type 2 diabetes mellitus: a retrospective study in China. Ther Clin Risk Manage. (2018) 14:403–8. doi: 10.2147/tcrm.S147078
12. Nicolle LE, Gupta K, Bradley SF, Colgan R, DeMuri GP, Drekonja D, et al. Clinical practice guideline for the management of asymptomatic bacteriuria: 2019 update by the Infectious Diseases Society of America. Clin Infect Dis. (2019) 68:1611–5. doi: 10.1093/cid/ciz021
13. National Healthcare Safety Network (NHSN). Long-term care facility component: tracking infections in long-term care facilities (2019). Available online at: https://www.cdc.gov/nhsn/pdfs/validation/2019/2019-ltcf-manual-508.pdf (Accessed July 25, 2019).
14. Ansaldi Y and Martinez de Tejada Weber B. Urinary tract infections in pregnancy. Clin Microbiol Infect. (2023) 29:1249–53. doi: 10.1016/j.cmi.2022.08.015
15. Vaughn VM, Gupta A, Petty LA, Malani AN, Osterholzer D, Patel PK, et al. A statewide quality initiative to reduce unnecessary antibiotic treatment of asymptomatic bacteriuria. JAMA Intern Med. (2023) 183:933–41. doi: 10.1001/jamainternmed.2023.2749
16. Advani SD, Ratz D, Horowitz JK, Petty LA, Fakih MG, Schmader K, et al. Bacteremia from a presumed urinary source in hospitalized adults with asymptomatic bacteriuria. JAMA Netw Open. (2024) 7:e242283. doi: 10.1001/jamanetworkopen.2024.2283
17. Antonio MEE, Cassandra BGC, Emiliano RJD, Guadalupe OLM, Lilian REA, Teresa TGM, et al. Treatment of asymptomatic bacteriuria in the first two months after kidney transplant: a controlled clinical trial. Transpl Infect Dis. (2022) 24:e13934. doi: 10.1111/tid.13934
18. Rosenberg K. Fewer unnecessary urine cultures is key to reducing antibiotic treatment for asymptomatic bacteriuria. Am J Nurs. (2023) 123:61. doi: 10.1097/01.NAJ.0000995376.98015.5e
19. Coffey KC, Claeys K, and Morgan DJ. Diagnostic stewardship for urine cultures. Infect Dis Clin North Am. (2024) 38:255–66. doi: 10.1016/j.idc.2024.03.004
20. Nicolle LE. Reducing treatment of asymptomatic bacteriuria: what works? Infect Dis Clin North Am. (2024) 38:267–76. doi: 10.1016/j.idc.2024.03.005
21. Murillo A, Su S, Zyczynski H, and Bradley M. Management of urinary tract infection symptoms in older women: a survey of practitioners. Urogynecology (Phila). (2024) 30:452–6. doi: 10.1097/spv.0000000000001416
22. Chae JH and Miller BJ. Beyond urinary tract infections (UTIs) and delirium: a systematic review of UTIs and neuropsychiatric disorders. J Psychiatr Pract. (2015) 21:402–11. doi: 10.1097/pra.0000000000000105
23. Zonsius MC, Cothran FA, and Miller JM. CE: acute care for patients with dementia. Am J Nurs. (2020) 120:34–42. doi: 10.1097/01.NAJ.0000660024.45260.1a
24. MacRae V, Holland S, and MacLeod R. Diagnosing, managing and preventing urinary tract infections in older people with dementia in hospital. Nurs Older People. (2022) 34:28–33. doi: 10.7748/nop.2022.e1392
25. Tingström P, Karlsson N, Grodzinsky E, and Sund Levander M. The value of fever assessment in addition to the Early Detection Infection Scale (EDIS). A validation study in nursing home residents in Sweden. BMC Geriatr. (2023) 23:585. doi: 10.1186/s12877-023-04266-6
26. Beland L, Martin C, and Han JS. Lower urinary tract symptoms in young men-causes and management. Curr Urol Rep. (2022) 23:29–37. doi: 10.1007/s11934-022-01087-9
27. Chughtai B, Forde JC, Thomas DD, Laor L, Hossack T, Woo HH, et al. Benign prostatic hyperplasia. Nat Rev Dis Primers. (2016) 2:16031. doi: 10.1038/nrdp.2016.31
28. Yu Y, Zielinski MD, Rolfe MA, Kuntz MM, Nelson H, Nelson KE, et al. Similar neutrophil-driven inflammatory and antibacterial responses in elderly patients with symptomatic and asymptomatic bacteriuria. Infect Immun. (2015) 83:4142–53. doi: 10.1128/IAI.00745-15
29. Edwards G, Seeley A, Carter A, Patrick Smith M, Cross E, Hughes K, et al. What is the diagnostic accuracy of novel urine biomarkers for urinary tract infection? biomark Insights. (2023) 18:11772719221144459. doi: 10.1177/11772719221144459
30. Goździkiewicz N, Zwolińska D, and Polak-Jonkisz D. The Use of artificial intelligence algorithms in the diagnosis of urinary tract infections-a literature review. J Clin Med. (2022) 11:2734. doi: 10.3390/jcm11102734
31. Stracy M, Snitser O, Yelin I, Amer Y, Parizade M, Katz R, et al. Minimizing treatment-induced emergence of antibiotic resistance in bacterial infections. Science. (2022) 375:889–94. doi: 10.1126/science.abg9868
32. Xiong Y, Liu YM, Hu JQ, Zhu BQ, Wei YK, Yang Y, et al. A personalized prediction model for urinary tract infections in type 2 diabetes mellitus using machine learning. Front Pharmacol. (2023) 14:1259596. doi: 10.3389/fphar.2023.1259596
33. İlhanlı N, Park SY, Kim J, Ryu JA, Yardımcı A, and Yoon D. Prediction of antibiotic resistance in patients with a urinary tract infection: algorithm development and validation. JMIR Med Inform. (2024) 12:e51326. doi: 10.2196/51326
34. Choi MH, Kim D, Park Y, and Jeong SH. Development and validation of artificial intelligence models to predict urinary tract infections and secondary bloodstream infections in adult patients. J Infect Public Health. (2024) 17:10–7. doi: 10.1016/j.jiph.2023.10.021
35. Seheult JN, Stram MN, Contis L, Pontzer RE, Hardy S, Wertz W, et al. Development, evaluation, and multisite deployment of a machine learning decision tree algorithm to optimize urinalysis parameters for predicting urine culture positivity. J Clin Microbiol. (2023) 61:e0029123. doi: 10.1128/jcm.00291-23
36. Parente D, Shanks D, Yedlinksy N, Hake J, and Dhanda G. Machine learning prediction of urine cultures in primary care. Ann Fam Med. (2023) 21:4141. doi: 10.1370/afm.21.s1.4141
37. Lundberg S and Lee SI. A unified approach to interpreting model predictions. In: Proceedings of the 31st conference on neural information processing systems (NIPS). Computer Science University of Washington, Long Beach, California, USA. Seattle (2017).
38. Mcinnes L, Healy J, Nathaniel S, and Lukas G. UMAP: uniform manifold approximation and projection for dimension reduction. J Open Source Software. (2018) 3:861. doi: 10.21105/joss.00861
39. Pedregosa F, Varoquaux G, Gramfort A, Michel V, Thirion B, Grisel O, et al. Scikit-learn: machine learning in python. J Mach Learn Res. (2011) 12:2825–30. doi: 10.5555/1953048.2078195
40. Sharma S, Govind B, Naidu SK, Kinjarapu S, and Rasool M. Clinical and laboratory profile of urinary tract infections in type 2 diabetics aged over 60 years. J Clin Diagn Res. (2017) 11:OC25–8. doi: 10.7860/jcdr/2017/25019.9662
41. Geerlings S, Fonseca V, Castro-Diaz D, List J, and Parikh S. Genital and urinary tract infections in diabetes: impact of pharmacologically-induced glucosuria. Diabetes Res Clin Pract. (2014) 103:373–81. doi: 10.1016/j.diabres.2013.12.052
42. Chen PC, Ho CH, Fan CK, Liu SP, and Cheng PC. Antimicrobial peptide LCN2 inhibited uropathogenic Escherichia coli infection in bladder cells in a high-glucose environment through JAK/STAT signaling pathway. Int J Mol Sci. (2022) 23:15763. doi: 10.3390/ijms232415763
43. Marzuillo P, Guarino S, Annicchiarico Petruzzelli L, Brugnara M, Corrado C, Di Sessa A, et al. Prevalence of and factors associated with Na+/K+ imbalances in a population of children hospitalized with febrile urinary tract infection. Eur J Pediatr. (2024) 183:5223–32. doi: 10.1007/s00431-024-05784-0
44. Pappo A, Gavish R, Goldberg O, Bilavsky E, Bar-Sever Z, and Krause I. Hyponatremia in childhood urinary tract infection. Eur J Pediatr. (2021) 180:861–7. doi: 10.1007/s00431-020-03808-z
45. Shi J, Zhan ZS, Zheng ZS, Zhu XX, Zhou XY, and Zhang SY. Correlation of procalcitonin and c-reactive protein levels with pathogen distribution and infection localization in urinary tract infections. Sci Rep. (2023) 13:17164. doi: 10.1038/s41598-023-44451-6
46. Elgormus Y, Okuyan O, Dumur S, Sayili U, and Uzun H. Evaluation of new generation systemic immune-inflammation markers to predict urine culture growth in urinary tract infection in children. Front Pediatr. (2023) 11:1201368. doi: 10.3389/fped.2023.1201368
47. Sonkoue Lambou JC, Noubom M, Djoumsie Gomseu BE, Takougoum Marbou WJ, Tamokou JD, and Gatsing D. Multidrug-resistant Escherichia coli causing urinary tract infections among controlled and uncontrolled type 2 diabetic patients at laquintinie hospital in douala, Cameroon. Can J Infect Dis Med Microbiol. (2022) 2022:1250264. doi: 10.1155/2022/1250264
48. Milić R, Plavec G, Tufegdzić I, Tomić I, Sarac S, and Loncarević O. Nitrofurantoin-induced immune-mediated lung and liver disease. Vojnosanit Pregl. (2012) 69:536–40. doi: 10.2298/VSP1206536M
49. Arakawa S, Kawahara K, Kawahara M, Yasuda M, Fujimoto G, Sato A, et al. The efficacy and safety of tazobactam/ceftolozane in Japanese patients with uncomplicated pyelonephritis and complicated urinary tract infection. J Infect Chemother. (2019) 25:104–10. doi: 10.1016/j.jiac.2018.10.009
50. Zhang YY, Huang HH, Ren ZY, Zheng HG, Yu YS, Lü XJ, et al. Clinical evaluation of oral levofloxacin 500 mg once-daily dosage for treatment of lower respiratory tract infections and urinary tract infections: a prospective multicenter study in China. J Infect Chemother. (2009) 15:301–11. doi: 10.1007/s10156-009-0713-9
Keywords: asymptomatic bacteriuria, type 2 diabetes mellitus, urinary tract infections, uropathogenic Escherichia coli, machine learning
Citation: Liu S, Li J, Fang Y, Wu X, Cao Y, Cai K, Yu J, Zhao Y and Duan Y (2025) A personalized prediction model for distinguishing between asymptomatic bacteriuria and symptomatic urinary tract infections in patients with type 2 diabetes mellitus using machine learning. Front. Endocrinol. 16:1593735. doi: 10.3389/fendo.2025.1593735
Received: 14 March 2025; Accepted: 17 July 2025;
Published: 05 August 2025.
Edited by:
Xiaoyan Xing, Chinese Academy of Medical Sciences and Peking Union Medical College, ChinaReviewed by:
Ashwin Dhakal, The University of Missouri, United StatesYikun Guo, Beijing University of Chinese Medicine, China
Copyright © 2025 Liu, Li, Fang, Wu, Cao, Cai, Yu, Zhao and Duan. This is an open-access article distributed under the terms of the Creative Commons Attribution License (CC BY). The use, distribution or reproduction in other forums is permitted, provided the original author(s) and the copyright owner(s) are credited and that the original publication in this journal is cited, in accordance with accepted academic practice. No use, distribution or reproduction is permitted which does not comply with these terms.
*Correspondence: Yitao Duan, ZHVhbnlpdGFvQHp6dS5lZHUuY24=; Yan Zhao, emhhb3lhbkB0bXUuZWR1LmNu
†These authors have contributed equally to this work