 Qianqian Du
 Kun Liu
 Yanling Li†
 Xinyan Wang
 Xuemei Wang
- School of Public Health, Inner Mongolia Medical University, Huhhot, China
Type 2 diabetes (T2DM) and tuberculosis (TB) both regulate inflammation and may exert synergistic or antagonistic effects through shared immune pathways. Previous studies have demonstrated that T2DM is a risk factor for TB. However, at the level of gene regulatory networks, it remains unclear whether there are key interaction nodes linking these two diseases. In this study, we integrated bioinformatic analysis from the Gene Expression Omnibus (GEO) database and performed differential gene expression analysis and weighted gene co-expression network analysis (WGCNA). Furthermore, we applied machine learning techniques to identify key genes among the commonly differentially expressed genes (DEGs). In addition, this study employed siRNA in THP-1 cells to validate the cross-talk genes selected through bioinformatic analysis. The THP-1 cells were treated with high-concentration glucose (15.5 μM, Glu), Mycobacterium tuberculosis ESAT-6, or Glu+ESAT-6. We identified a total of 23 common genes between TB and T2DM using DEGs and WGCNA. Furthermore, expression patterns from external datasets revealed three key cross-talk genes linking TB-T2DM: CYP1B1, SERPING1, and CHPT1. Notably, only CYP1B1 was significantly upregulated in the THP-1 detection test, compared to the unstimulated (control) group (P < 0.05). Moreover, CYP1B1 significantly reduced the expression of pro-inflammatory cytokines (TNF-α, IL-6, IL-1β, IL-10), M2 macrophage polarization markers (CD163, Arg-1), and chemokines (CXCL-10), and was associated with the NOD2 and TRAF6 signaling pathways (P < 0.05). These findings elucidate the regulatory mechanisms underlying the comorbidity of TB and T2DM, providing a theoretical basis for the development of precise combination therapies and novel therapeutic targets.
1 Introduction
Tuberculosis (TB) and Type 2 Diabetes Mellitus (T2DM) are chronic diseases with significant public health implications worldwide. The comorbidity of TB and T2DM (TB-T2DM) represents a growing concern for public health, particularly in countries with high disease prevalence, such as India, China, and Indonesia (1). According to the latest data from the World Health Organization (WHO), approximately 10.8 million new cases of TB were reported worldwide in 2023, marking an increase of 0.93% compared to 2022 (2). Simultaneously, the prevalence of T2DM is rising sharply, largely due to unhealthy dietary habits and increasing rates of obesity, particularly in developing countries (3). The co-occurrence of these diseases not only severely impairs patients’ quality of life but also imposes a considerable burden on healthcare systems (4).
Epidemiologically, the interaction between T2DM and TB results in a more severe clinical course for diabetic patients (5). Individuals diagnosed with T2DM are at a threefold increased risk of developing TB compared to those without diabetes. In high-burden regions, approximately 21% of TB patients are comorbid with T2DM (6). Studies have demonstrated that patients suffering from both TB and T2DM experience higher rates of treatment failure (RR=1.69, 95% CI 1.36–2.12), disease recurrence (RR=3.89, 95% CI 2.43–6.23), and all-cause mortality (RR=1.89, 95% CI 1.52–2.36) when compared to individuals with TB alone (6–8). These findings underscore the complex interplay between TB and T2DM and the significant impact of this comorbidity on clinical outcomes.
Although significant progress has been made in understanding the independent pathogenesis of TB and T2DM, research on their interactions, particularly at the immunological and inflammatory levels, remains limited. For instance, T2DM disrupts immune function, resulting in dysregulated inflammatory responses. Recent studies have shown that oxidative stress in patients with T1DM leads to significant DNA damage and a concurrent reduction in the efficacy of the antioxidant defense system (9). Furthermore, it has been observed that individuals with diabetes exhibit increased levels of pro-inflammatory cytokines, such as interleukin-6 (IL-6) and tumor necrosis factor-α (TNF-α), which contribute to chronic inflammation, exacerbating pancreatic β-cell damage and insulin resistance (10, 11). T2DM impairs the immune response to TB, reducing the ability to clear Mycobacterium tuberculosis. These complications may be exacerbated by altered inflammatory responses, as elevated levels of inflammatory cytokines in T2DM can influence TB pathogenesis and hinder effective treatment outcomes (12). Macrophages, which play a crucial role in initiating immune responses by phagocytosing TB bacteria and secreting key cytokines such as TNF-α and IL-6, demonstrate impaired functionality in individuals with diabetes due to the presence of chronic, low-grade inflammation (13, 14). Restrepo et al. demonstrated that patients with TB-T2DM exhibit more intense immune responses compared to patients with TB alone, with elevated levels of interferon-γ (IFN-γ), interleukin-2 (IL-2), TNF-α, and granulocyte-macrophage colony-stimulating factor (GM-CSF) (15). Conversely, TB, caused by M. tuberculosis, elicits a strong immune response marked by the activation of immune cells and increased production of pro-inflammatory cytokines such as TNF-α, IL-1β, and IL-6. These cytokines are pivotal in immune evasion and the chronicity of TB (16). Excessive inflammatory responses can exacerbate TB lesions and compromise overall immune function (17). Conversely, persistent TB-driven inflammation and immune activation may exacerbate metabolic dysregulation in T2DM, thereby worsening insulin resistance and glycemic control. This bidirectional mechanism creates a vicious cycle: T2DM-induced immunosuppression provides an ideal environment for M. tuberculosis survival, while TB-related chronic inflammation exacerbates diabetic metabolic disturbances (18–23). Systems biology analyses have revealed significant dysregulation of key immune pathways, including the Jak-STAT and NF-κB pathways, in patients with comorbid diabetes and tuberculosis (24). However, the interaction mechanisms between these two diseases at the level of gene regulatory networks remain unclear.
In summary, both T2DM and TB induce systemic inflammatory responses, exhibiting either synergistic or antagonistic interactions in their inflammatory pathways. However, whether cross-talk genes within their gene expression networks that may regulate TB-T2DM-associated inflammatory and metabolic dysfunctions remains unexplored.
To address these questions, this study integrates bioinformatics analysis with experimental validation to identify core genes involved in inflammatory dysregulation and elucidate the molecular mechanisms underlying the TB-T2DM. By utilizing publicly available transcriptomic data from the GEO database, WGCNA, and machine learning algorithms, we identify common candidate genes associated with TB-T2DM. Functional enrichment and immune infiltration analyses are employed to validate the functions of these genes in inflammation and immune regulation, supported by qPCR and Western blot experiments.
The novelty of this study lies in its integrative approach, which combines bioinformatics analysis, machine learning techniques, and experimental validation to systematically identify cross-talk genes and pathways associated with inflammation in TB-T2DM. These findings offer new scientific insights into the inflammatory mechanisms underlying TB-T2DM comorbidity, laying the groundwork for the development of novel diagnostic biomarkers and targeted therapeutic strategies.
2 Materials and methods
2.1 Data collection and preparation
Transcriptomic datasets related to T2DM and TB were downloaded from the Gene Expression Omnibus (GEO) database (https://www.ncbi.nlm.nih.gov/geo/). The TB dataset (GSE28623), based on the GPL4133 platform, included blood samples from 46 TB patients and 37 control samples. The T2DM dataset (GSE166502), based on the GPL10558 platform, comprised myocyte samples from 13 T2DM patients and 13 controls. These datasets served as the training set. Additionally, GSE34608, comprising 8 TB blood samples and 18 control samples, was utilized as an independent validation cohort to evaluate the reliability and accuracy of the findings.
2.2 Identification of DEGs
Raw expression matrices were normalized, and DEGs between the TB and control groups in the GSE28623 dataset were identified using the limma package in R (25). Genes were selected based on an adjusted P < 0.05 and |logFC| ≥ 1. The “pheatmap” and “ggplot2” packages in R were used to generate clustering heatmaps and volcano plots of DEGs.
2.3 Weighted gene co-expression network analysis and identification of key modules
WGCNA is a bioinformatics method used to characterize gene co-expression patterns across different samples. This method clusters genes with similar expression profiles and explores the associations between identified modules and specific traits or phenotypes (26). To identify gene clusters associated with T2DM in the GSE166502 dataset, hierarchical clustering was performed using the “Hclust” function in R to detect outliers. Subsequently, the “pickSoftThreshold” function from the WGCNA package was used to calculate the soft threshold and adjacency matrix, with a criterion of R² > 0.8. The adjacency matrix was further converted into a topological overlap matrix (TOM) to measure gene associations by incorporating both direct and indirect interactions. The TOM matrix was converted into a dissimilarity matrix to generate a hierarchical clustering tree. Gene modules showing a statistically significant correlation with T2DM (P < 0.05, correlation coefficient > 0.6) were selected as key modules for further analysis.
2.4 Identification of shared genes and pathway enrichment
Venn diagrams were employed to identify overlapping genes between key T2DM modules and TB DEGs. Functional enrichment analysis of these shared genes was performed using the “ClusterProfiler” package in R for Gene Ontology (GO) and Kyoto Encyclopedia of Genes and Genomes (KEGG) pathway analysis (27). The results were visualized using the Sangerbox biomedical platform (28), with a P < 0.05 considered statistically significant.
2.5 Machine learning for key gene screening
The study comprehensively employed four machine learning algorithms—LASSO regression, random forest (RF), support vector machine (SVM), and Gaussian mixture model (GMM)—to screen for pivotal genes. LASSO Regression: The glmnet package was used with 10-fold cross-validation to determine the penalty parameter λ and identify significant genes (29). RF: The RF package was used to rank genes based on feature importance scores (30). SVM Recursive Feature Elimination (SVM-RFE): 5-fold cross-validation was used to identify the optimal feature gene set (31). GMM: Core key genes were identified through intersection analysis of the gene sets selected by the aforementioned methods (32).
2.6 Receiver operating characteristic curve and nomogram construction
The diagnostic performance of key genes was evaluated using RNA microarray data from the training set (46 TB patients and 44 controls). ROC curves were plotted for each gene, and the area under the curve (AUC) was calculated to evaluate diagnostic accuracy. The GSE34608 dataset was used for validation. Key genes exhibiting consistent expression profiles and an AUC greater than 0.7 in both the training and validation datasets were selected as characteristic biomarkers. Nomograms were constructed using the “RMS” package to predict TB occurrence by summing scores from cross-talk genes (33). The stability and predictive performance of the model were further evaluated through ROC analysis.
2.7 Single-sample gene set enrichment analysis
ssGSEA was performed using the “GSEA” R package to investigate functional and signaling pathways associated with diagnostic biomarkers. Significant pathways were selected based on normalized enrichment scores (NES), NOM p-value < 0.05, and FDR q-value < 0.05.
2.8 Immune infiltration analysis
The CIBERSORT algorithm was employed to estimate the proportions of immune cells from RNA expression data (34). GSE28623 datasets used whole-blood transcriptomes, meeting CIBERSORT’s requirement for total cellular RNA. A Spearman correlation analysis was conducted between the 22 immune cell types and cross-talk genes using the “corrplot” package. The correlation results were visualized through bar plots generated with the “ggplot2” package.
2.9 Cell culture and construction of an in vitro high-glucose TB infection model
The human monocytic leukemia cells (THP-1) were cultured in DMEM (Gibco, China) supplemented with 10% fetal bovine serum (FBS, Gibco, China) and 1% penicillin-streptomycin (Gibco, China) at 37°C under 5% CO2. The culture medium was replaced after 24 h. Based on previous studies by Baker and Alebel et al. (35, 36), THP-1 cells were stimulated with glucose at concentrations of 15.5 μM and 5.5 μM, ESAT-6 (an important pathogenic protein of M. tuberculosis, Gene Optimal, China), and 15.5 μM glucose combined with ESAT-6, as well as 5.5 μM glucose combined with ESAT-6, respectively.
2.10 siRNA transfection
THP-1 cells were placed in 6-well plates and differentiated into macrophages using PMA (MedChemExpress, USA). Cells were transfected with CYP1B1-siRNA or si-NC (MedChemExpress, USA) using Lipofectamine 2000 (Thermo Fisher, USA) in Opti-MEM medium (Gibco, China). The transfected cells were incubated for 24 hours before proceeding to further analysis.
2.11 qPCR for mRNA expression analysis
RNA extraction was carried out from cells after 8 hours of cell treatment, following the protocol provided by the Axygen RNA kit manufacturer (Axygen Scientific, USA). RNA (with an A260/A280 ratio between 1.8 and 2.1) was reverse transcribed into cDNA using the Primer Script™ RT Master Mix Kit (Takara, China). qPCR was performed using the ABI 7500 real-time PCR system (Bio-Rad, USA). The reaction conditions were as follows: an initial denaturation at 95°C for 10 minutes, followed by 40 cycles consisting of denaturation at 95°C for 15 seconds and annealing/extension at 60°C for 30 seconds (37). The 2−ΔΔCt method was used to calculate relative gene expression levels. ΔCt1 was calculated as the difference between the β-actin CT value in the sample and the β-actin CT value in the control. Similarly, ΔCt2 was determined by subtracting the CT value of the target gene in the control from that in the sample. ΔΔCt was then calculated as ΔCt1 minus ΔCt2. (The RNA sequence fragments are presented in Table 1).
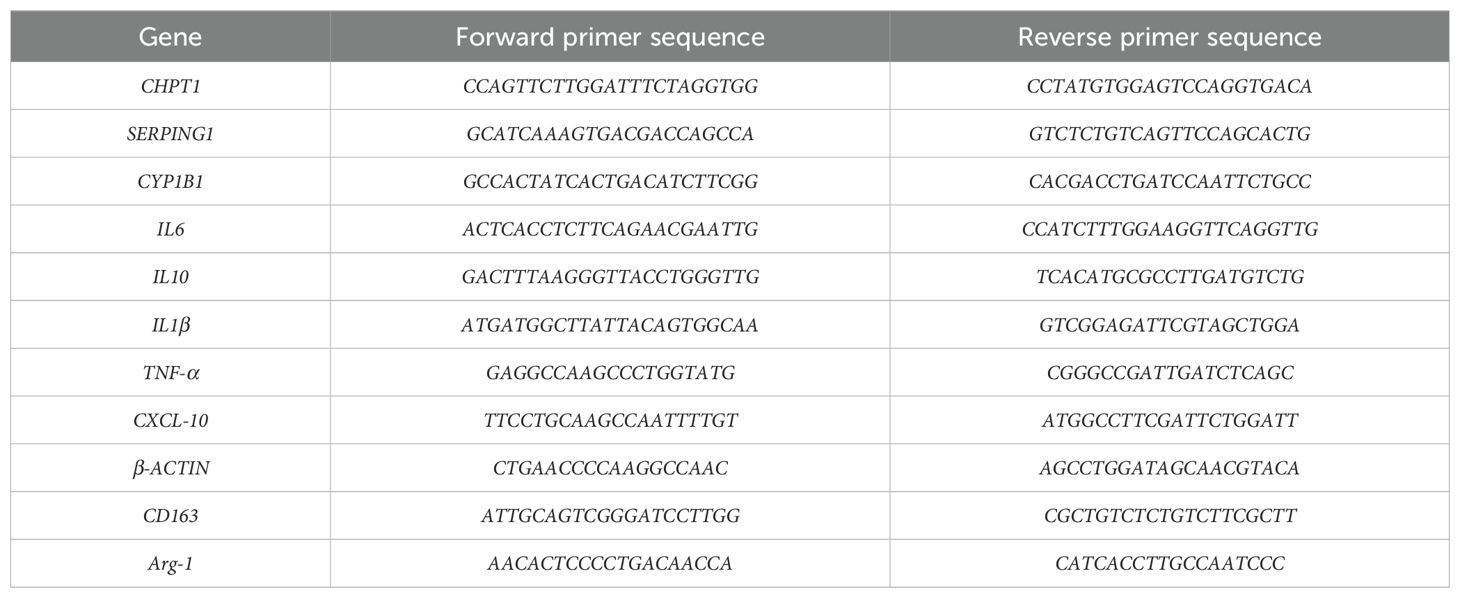
Table 1. PCR primers.
2.12 Western blot for protein expression analysis
Proteins were collected after 12 hours for Western blot. Western blot was performed as previously described (38). Protein lysates (30 μg) were quantified using the Enhanced BCA Protein Assay Kit (Beyotime, China) and subsequently separated by SDS-PAGE (Solarbio, China) using a Mini-PROTEAN Tetra electrophoresis system (Bio-Rad, USA). The 30 μg protein lysates were standardized using the Enhanced BCA Protein Assay Kit (Beyotime, China) and separated by SDS-PAGE (Solarbio, China). Proteins were then transferred onto PVDF membranes (Immobilon, Germany) and probed with antibodies against CYP1B1, NOD2, TRAF-6, and β-actin (Proteintech, China). The CYP1B1 and β-actin primary antibodies were diluted to 1:3000, NOD2 primary antibodies to 1:1000, and the TRAF-6 primary antibodies were diluted to 1:500 using the primary antibody dilution reagent (Beyotime, China). The samples were left to incubate overnight at 4°C. Afterward, the membranes underwent three washes with TBST (Solarbio, China), each lasting 10 minutes. Subsequently, the membranes were incubated with secondary antibodies (Cell Signaling Technology, USA) at a dilution of 1:3000 for 1 hour at room temperature, followed by four additional washes with TBST, each lasting 5 minutes. Finally, the immune-reactive proteins were visualized using an enhanced chemiluminescence reagent (ECL Western Blotting, Affinity Biosciences, USA) according to the manufacturer’s instructions.
2.13 ELISA for cytokine quantification
Cell culture supernatants were collected after 12 hours of cell treatment, and the concentrations of IL-6, IL-1β, and TNF-α were measured using ELISA kits (Lunchangshuo, China).
2.14 Statistical analysis
Bioinformatics analyses were performed using R version 4.3.3. Experimental data were analyzed using GraphPad Prism 6.1. Multiple group comparisons were conducted using one-way ANOVA with Tukey’s HSD test. For comparisons between two groups, either an independent samples t-test (for normally distributed data) or the Wilcoxon rank-sum test (for non-normally distributed data) was applied. A two-tailed P < 0.05 was considered statistically significant. The flow chart of this research is shown in Supplementary Figure S1.
3 Results
3.1 Identification of DEGs
In the TB dataset GSE28623, a total of 192 DEGs were identified, including 131 upregulated DEGs and 61 downregulated DEGs. The heatmap (Figure 1A) displays the top 60 DEGs in TB, and the volcano plot (Figure 1B) illustrates the expression patterns of DEGs in TB.

Figure 1. Identification and Pathway Enrichment of Shared Genes in TB and T2DM: (A) Heatmap of the top 60 DEGs in GSE28623. Pink grids represent upregulated genes, purple grids represent downregulated genes, and the color intensity indicates expression levels. (B) Volcano plot of DEGs in GSE28623. The x-axis represents log2 fold change (TB/Con), and the y-axis represents -log10(P-value). Pink and purple points represent significantly differentially expressed genes (pink: upregulated, purple: downregulated), while gray points represent non-significant genes. Con, control; TB, tuberculosis. (C) Soft-thresholding power plot for WGCNA analysis of key T2DM modules, showing scale-free topology. (D) Hierarchical clustering dendrogram of modules. (E) Correlation matrix between modules and traits. (F) Venn diagram showing the intersection of TB DEGs and T2DM key module genes. (G) GO enrichment analysis of shared genes. (H) KEGG pathway enrichment analysis of shared genes.
3.2 Identification of key modules using WGCNA
Sample clustering was performed to detect outliers, and no samples were removed from the GSE166502 dataset. As shown in Figure 1C, the optimal soft-thresholding power value, which yields an R² value of approximately 0.9, indicates that the network closely approximates a scale-free topology. The mean connectivity plateaued as the adjacency function gradually approached zero. According to the dynamic tree cut algorithm, nine modules were identified in the co-expression network constructed from the T2DM samples (Figure 1D). The correlation between modules and sample traits was calculated, and the resulting correlation matrix is shown in Figure 1E. In the matrix, the vertical axis represents different modules, and the horizontal axis represents various traits. Each square indicates the correlation coefficient and statistical significance (P-value) between a module and a trait. Correlation analysis revealed that the brown module (cor = 0.89, P < 0.05), turquoise module (cor = -0.61, P < 0.05), and blue module (cor = -0.61, P < 0.05) exhibited the most significant correlations with T2DM.
3.3 Identification of shared genes and pathway enrichment
A total of 23 genes (GAS6, SERPING1, PLSCR1, CYP1B1, CTNNAL1, ATF3, TNFSF10, ADM, S100A8, C1QB, BPGM, GADD45G, FGF13, MYOM2, JAK2, SOCS3, KCNJ2, CLEC2B, C1QA, CHPT1, KREMEN1, C1QC, CMBL) were identified as Shared cross-talk genes between TB and T2DM based on the intersection of WGCNA modules and DEGs (Figure 1F). These 23 genes were further subjected to GO and KEGG enrichment analyses to explore shared regulatory pathways. The biological processes and cellular components are illustrated in Figure 1G; Supplementary Table S1. The biological processes encompass classical complement activation, humoral immune response mediated by immunoglobulin, synaptic pruning, complement activation, adaptive immune response based on somatic recombination of immune receptors built from immunoglobulin superfamily domains, cell junction disassembly, regulation of endopeptidase activity, positive regulation of apoptotic signaling pathway, regulation of peptidase activity, and regulation of cysteine-type endopeptidase activity involved in apoptotic processes. Cellular components include collagen-containing extracellular matrix, collagen trimer, blood microparticles, intercalated discs, platelet alpha granule lumen, cell-cell contact zone, platelet alpha granule, secretory granule lumen, cytoplasmic vesicle lumen, and vesicular lumen. The shared genes were primarily associated with the following pathways: pertussis, complement and coagulation cascades, prion diseases, Staphylococcus aureus infection, Chagas disease (American trypanosomiasis), systemic lupus erythematosus, influenza A, adipocytokine signaling pathway, prolactin signaling pathway, and EGFR tyrosine kinase inhibitor resistance (Figure 1H).
3.4 Machine learning for key gene identification
Four machine learning algorithms—LASSO regression, RF, SVM, and GMM—were employed to screen the 23 shared genes and identify potential key genes related to the mechanisms by which T2DM impacts TB.
LASSO regression identified 10 non-zero coefficients when the minimal mean squared error was selected at log (λ). These 10 genes were MYOM2, GADD45G, ATF3, CMBL, CLEC2B, GAS6, CHPT1, C1QC, SERPING1, and CYP1B1 (Supplementary Figures S2A, B). The RF model achieved the highest accuracy when the number of selected genes was set to N=17 (Supplementary Figure S2C), identifying the following 17 genes: GADD45G, KREMEN1, SERPING1, CHPT1, GAS6, CYP1B1, SOCS3, ATF3, JAK2, C1QC, CMBL, TNFSF10, BPGM, C1QB, KCNJ2, C1QA, and CTNNAL1. Using the SVM-RFE method, the model reached the highest accuracy of 0.878 with the lowest cross-validation error of 0.122 when selecting 22 genes (Supplementary Figures S2D, E). The 22 selected genes were GAS6c, SERPING1, PLSCR1, CYP1B1, CTNNAL1, ATF3, TNFSF10, ADM, S100A8, C1QB, GADD45G, FGF13, MYOM2, JAK2, SOCS3, KCNJ2, CLEC2B, C1QA, CHPT1, KREMEN1, C1QC, and CMBL.
The intersection of the genes selected by the three algorithms resulted in 8 genes: GADD45G, ATF3, CMBL, GAS6, CHPT1, C1QC, SERPING1, and CYP1B1 (Supplementary Figure S2F). Finally, the GMM model was employed to classify and refine the set of shared key genes, ultimately identifying the subset with the highest AUC combination: GADD45G, GAS6, CHPT1, SERPING1, and CYP1B1 (Supplementary Figure S2G).
3.5 Expression levels of key genes and construction of predictive models
The relative expression levels of the five key genes in the training and validation sets are shown in Figures 2A, B. Among these, CHPT1, SERPING1, and CYP1B1 exhibited consistent expression patterns in both the training and validation sets. To assess the predictive ability of these five key genes for TB progression, ROC curves were constructed based on individual characteristics and gene expression levels. The AUC and corresponding 95% confidence intervals (CIs) for each gene were determined in both the test and validation datasets.

Figure 2. Relative expression levels, predictive performance, and nomogram construction of five key genes in the training and validation cohorts: (A) Relative expression levels of the five key genes in the test dataset GSE28623. (B) Relative expression levels of the five key genes in the validation dataset GSE34608. (C) ROC curves of the five key genes (CHPT1, CYP1B1, GADD45G, GAS6, and SERPING1) in the test dataset GSE28623. (D) ROC curves of the five key genes in the validation dataset GSE34608. (E) Nomogram model constructed based on cross-talk genes (CYP1B1, SERPING1, and CHPT1). (F) ROC curve of the nomogram. Statistical significance was denoted as follows: ns (not significant, P > 0.05), *P < 0.05, **P < 0.01, ***P < 0.001, and ****P < 0.0001.
In the test dataset, the AUC values were as follows: CHPT1 (AUC = 0.786, 95% CI: 0.682-0.890), CYP1B1 (AUC = 0.784, 95% CI: 0.688-0.881), GADD45G (AUC = 0.874, 95% CI: 0.802-0.946), GAS6 (AUC = 0.845, 95% CI: 0.758-0.931), SERPING1 (AUC = 0.856, 95% CI: 0.775-0.937) (Figure 2C). For the GSE34608 validation dataset, the results were: CHPT1 (AUC = 0.924, 95% CI: 0.818-1), CYP1B1 (AUC = 0.868, 95% CI: 0.713-1), GADD45G (AUC = 0.66, 95% CI: 0.426-0.893), GAS6 (AUC = 0.854, 95% CI: 0.707-1), SERPING1 (AUC = 0.868, 95% CI: 0.724-1) (Figure 2D).
Based on the expression patterns and AUC values, three genes—CHPT1, SERPING1, and CYP1B1—were selected as cross-talk genes critical for TB progression in T2DM patients and used to construct a nomogram model. In the nomogram (Figure 2E), the relative expression levels of each gene were quantitatively marked, enabling the calculation of a total score to evaluate the risk of TB progression in individuals with T2DM. Moreover, the AUC for the nomogram was 0.938 (95% CI 0.885–0.990), highlighting the superior performance of the model (Figure 2F).
3.6 Immune infiltration analysis
CIBERSORT was used to evaluate the proportion of 22 immune cell types in the TB dataset (Figure 3A). In the TB samples, significant upregulation was observed in the abundance of memory B cells, plasma cells, monocytes, macrophages (M0), and neutrophils. In contrast, downregulation was observed in naive B cells, CD8 T cells, naive CD4 T cells, activated memory CD4 T cells, resting NK cells, resting dendritic cells, and eosinophils (Figure 3B).

Figure 3. Immune Cell Infiltration Analysis: (A) Stacked plot showing the relative proportions of 24 immune cell types in different samples from the TB and control groups. (B–D) Correlation between the three key genes (CYP1B1, SERPING1, and CHPT1) and immune cells. (E) Boxplot comparing immune cell expression between the TB and control groups. Statistical significance was denoted as follows: ns (not significant, P > 0.05), *P < 0.05, **P < 0.01, ***P < 0.001, and ****P < 0.0001.
Further correlation analysis between the three key genes and the proportions of immune cells in the TB samples revealed interesting associations. CYP1B1 demonstrated positive correlations with neutrophils, monocytes, macrophages (M0), and T cells gamma delta, while showing negative correlations with T cells follicular helper, CD8+ T cells, and resting NK cells. SERPING1 was positively correlated with monocytes, neutrophils, macrophages (M0), T cells gamma delta, and B cells memory, while negatively correlated with B cells naive, CD4 T cells naive, dendritic cells resting, T cells CD4 memory activated, eosinophils, NK cells resting, and T cells CD8. CHPT1 exhibited positive correlations with neutrophils, B cells memory, and T cells CD4 memory resting, and negative correlations with T cells CD4 memory activated, B cells naive, T cells CD8, NK cells resting, and T cells CD4 naive (Figures 3C–E).
3.7 qPCR detection of cross-talk genes expression levels
Given the pivotal role of macrophages in the immune responses to both T2DM and TB, we employed a human acute monocytic leukemia cell (THP-1) model to investigate the regulatory effects of the cross-talk genes CHPT1, SERPING1, and CYP1B1 in inflammatory responses. To simulate the distinct pathological conditions of T2DM and TB, cells were subjected to six treatment regimens: Control (unstimulated), 15.5 μM glucose (Glu-15.5), 5.5 μM glucose (Glu-5.5), ESAT-6, 15.5 μM glucose + ESAT-6 (Glu-15.5+ ESAT-6), and 5.5 μM glucose + ESAT-6 (Glu-5.5+ ESAT-6). The results revealed significant differences in CYP1B1 expression across the treatment groups, as detailed below:
Compared to the control group, CYP1B1 mRNA expression in the Glu-5.5 group showed no significant change, indicating that physiological glucose concentrations do not significantly modulate CYP1B1 expression. In contrast, CYP1B1 mRNA expression was significantly upregulated in the Glu-15.5 group (P < 0.05), suggesting that a high glucose state activates CYP1B1 expression. Under ESAT-6 treatment, CYP1B1 expression also significantly increased (P < 0.01). The combination of 5.5 μM glucose and ESAT-6 further upregulated CYP1B1 expression (P < 0.05). The highest expression of CYP1B1 was observed under the combined treatment of 15.5 μM glucose and ESAT-6 (P < 0.001) (Figure 4A). This significant upregulation suggests that CYP1B1 may serve vital functions in the co-existing pathological conditions of T2DM and TB. No significant differences in gene expression were observed for SERPING1 and CHPT1 under the aforementioned treatment conditions (Figures 4B, C).

Figure 4. (A) Expression of CYP1B1 in THP-1 cells under different treatments with various glucose levels and ESAT-6 stimulation. (B) Expression of CHPT1 in THP-1 cells under different treatments. (C) Expression of SERPING1 in THP-1 cells under different treatments. (D–F) ELISA analysis of pro-inflammatory cytokines TNF-α, IL-6, and IL-1β protein levels following CYP1B1 siRNA transfection under different treatments. (G) ELISA analysis of IL-10 protein levels after CYP1B1 knockdown. (H–J) qPCR analysis of mRNA expression levels of pro-inflammatory cytokines TNF-α, IL-6, and IL-1β after CYP1B1 siRNA transfection. (K) qPCR analysis of IL-10 mRNA expression following CYP1B1 knockdown. (L, M) qPCR assay of the expression of M2 macrophage markers CD163 and Arg-1 after CYP1B1 knockdown. (N) qPCR analysis of CXCL10 expression following CYP1B1 siRNA transfection. Control: Untreated control group; Glu-transfer positive plasmid: Positive plasmid transfection control + 15.5 μM glucose stimulation; Glu-transfer CYP1B1 siRNA: CYP1B1 siRNA transfection + 15.5 μM glucose stimulation; ESAT6-transfer positive plasmid: Positive plasmid transfection control + ESAT6 stimulation; ESAT6-transfer CYP1B1 siRNA: CYP1B1 siRNA transfection + ESAT6 stimulation; GE-transfer positive plasmid: Positive plasmid transfection control + 15.5 μM glucose + ESAT6 co-stimulation; GE-transfer CYP1B1 siRNA: CYP1B1 siRNA transfection + 15.5 μM glucose + ESAT6 co-stimulation. Statistical significance is denoted as follows: ns, non-significant (P > 0.05); #P < 0.05, ##P < 0.01, ###P < 0.001, ####P < 0.0001 (vs. control); *P < 0.05, **P < 0.01, ***P < 0.001, ****P < 0.0001 (vs. transfer positive plasmid).
3.8 Transfection of CYP1B1 siRNA reduced CYP1B1 expression
The function of CYP1B1 in the comorbidity of T2DM and TB was further investigated by knocking down its expression in macrophages through siRNA transfection and observing the changes in cytokines and key pathway molecules before and after transfection.
The qPCR results demonstrated that compared to the negative control and the plasmid transfection group (Si-NC), the CYP1B1 siRNA transfection group exhibited significantly reduced mRNA expression levels (P < 0.05). No statistically significant difference was observed between the CYP1B1 siRNA group and the GAPDH plasmid transfection group (Si-GAPDH) (P > 0.05) (Supplementary Figure S3A). Thus, the siRNA, along with its transfection concentration and duration in this experiment, effectively silenced CYP1B1 expression, highlighting its suitability for subsequent experiments.
Western blot analysis further confirmed a significant decrease in CYP1B1 protein levels. Compared with the Si-NC group, CYP1B1 siRNA transfection markedly suppressed CYP1B1 protein expression (P < 0.05). These results demonstrated that the reduced mRNA levels directly led to decreased protein expression. No significant difference was detected in the protein expression levels between the CYP1B1 siRNA and Si-GAPDH groups (P > 0.05) (Supplementary Figures S3B, C). The WB results were consistent with qPCR data, confirming transfection efficacy.
3.9 CYP1B1 expression is associated with inflammatory responses and immune regulation
Following CYP1B1 siRNA transfection, we further evaluated the impact of CYP1B1 knockdown on various inflammatory and immune regulatory factors. The protein and mRNA levels of pro-inflammatory cytokines, e.g., TNF-α, IL-6, and IL-1β, and the anti-inflammatory cytokine IL-10 were analyzed using ELISA and qPCR. Additionally, the mRNA expression levels of characteristic macrophage polarization markers, e.g., CD163 and Arg-1, and the chemokine CXCL10 were assessed.
After CYP1B1 siRNA transfection, the protein and mRNA expression levels of key inflammatory mediators decreased significantly. According to the ELISA and qPCR measurements, the pro-inflammatory cytokines TNF-α, IL-6, and IL-1β showed decreased expression across the treatment groups with 15.5 μM glucose, ESAT-6, and their combination, with the most notable suppression observed under combined stimulation (P < 0.01, Figures 4D–F, H–J). Similarly, the anti-inflammatory cytokine IL-10 demonstrated reduced expression at both protein and transcript levels (Figures 4G, K). These results demonstrate a significant positive correlation between the expression levels of the above inflammatory factors and CYP1B1 expression.
As detailed in Figures 4L–N, the expression of macrophage polarization markers CD163 and Arg-1 paralleled these findings, showing significant downregulation following CYP1B1 knockdown (P < 0.05). The chemokine CXCL10 also exhibited comparable reductions (P < 0.05).
3.10 Single-sample gene set enrichment analysis
M. tuberculosis infection triggers complex immune responses, particularly in the context of T2DM, and the altered immune responses may influence the clinical manifestation of TB. We performed ssGSEA to further investigate the potential KEGG pathways involved in TB progression, with a focus on the role of CYP1B1. The ten most significant pathways are presented in Figures 5A, B. The results revealed that CYP1B1 is involved in multiple pathways, such as autophagy, NOD-like receptor signaling, phagosome formation, TNF signaling, and Toll-like receptor signaling.

Figure 5. CYP1B1 regulation of NOD2 and TRAF6 signaling in macrophages under various treatments: (A, B) KEGG pathway enrichment analysis showing the top ten pathways associated with TB progression. (C, D) Western blot analysis of NOD2 protein expression under different treatments. (E–G) Western blot analysis of NOD2 and TRAF6 expression following CYP1B1 knockdown using siRNA transfection under various treatments. Statistical significance is denoted as follows: ns, not significant (P > 0.05), *P < 0.05, **P < 0.01, ***P < 0.001, and ****P < 0.0001. The control lane shown in panel (E) was derived from the same experimental blot. Reusing this control data allows for direct comparison across experiments under identical conditions. The polyclonal anti-NOD2 antibody may produce non-specific bands due to its broad reactivity. The band of interest (indicated by the arrow) was selected based on its expected molecular weight (~110 kDa).
3.11 Western blot validation of NOD2 and TRAF-6 signaling pathways
The ssGSEA results indicated that CYP1B1 is significantly associated with the NOD-like receptor signaling pathway and the TNF signaling pathway. Preliminary experiments on the expression of NOD2 in macrophages found that the upregulation of CYP1B1 might be related to NOD2 activation. Western blot analysis of NOD2 protein expression levels across different treatment groups revealed the following results. Compared to the control group, NOD2 protein expression was significantly upregulated in the 5.5 μM glucose + ESAT-6 and 15.5 μM glucose + ESAT-6 treatment groups (P < 0.05, Figures 5C, D). In the 15.5 μM glucose + ESAT-6 treatment group, the synergistic effects of a high glucose level and TB infection significantly activated NOD2 expression, resulting in the highest level of NOD2 protein expression.
TRAF6, a downstream adapter protein of NOD2, is critical in initiating downstream immune responses. Considering the enrichment results of the TNF signaling pathway and the close relationship between the NOD2 signaling pathway and TRAF6, we further investigated the changes in NOD2 and TRAF6 expression after CYP1B1 siRNA transfection. Compared to the control group with siRNA transfection, the protein expression levels of both NOD2 and TRAF6 were elevated in the CYP1B1 siRNA transfection group (P < 0.05). In the treatment group with 15.5 μM glucose, the expression of NOD2 and TRAF6 was significantly reduced compared to the group with CYP1B1 siRNA transfection (P < 0.05). In the ESAT-6 treatment group, knocking down CYP1B1 led to a significant reduction in the expression of both NOD2 and TRAF6 (P < 0.05). Under the combined treatment of 15.5 μM glucose + ESAT-6, the expression of NOD2 and TRAF6 was markedly decreased (P < 0.0001) (Figures 5E–G). These findings suggest that CYP1B1 regulates the expression of NOD2 and TRAF6 in response to the dual stress of high glucose and M. tuberculosis infection.
4 Discussion
This study systematically unveils the potential molecular mechanisms underlying the TB-T2DM comorbidity, particularly the key regulator CYP1B1 in the inflammatory response of this comorbidity.
Bioinformatics methods like DEGs and WGCNA were employed to identify multiple potential key genes and their associated modules. Further refinement using machine learning methods revealed the cross-talk genes CYP1B1, SERPING1, and CHPT1, which are closely related to the inflammatory response in TB-T2DM comorbidity.
Differential gene expression analysis identified 192 DEGs in TB patients. WGCNA revealed three modules significantly associated with T2DM. A comparison between the DEGs in TB patients and the key module genes associated with T2DM identified 23 shared genes. Functional enrichment analysis provided the biological context for these shared genes. GO analysis indicated that the shared genes were enriched in biological processes like complement activation and immunoglobulin-mediated humoral immune responses. KEGG pathway analysis highlighted key pathways like the complement and coagulation cascades and circulating immunoglobulin-mediated humoral immune responses.
The significant enrichment of complement activation, immunoglobulin-mediated humoral immune responses, and the complement-coagulation cascade in TB-T2DM comorbidity demonstrated their key functions in inflammatory imbalance and immune dysfunction. Excessive complement activation may serve as a key driver of TB and T2DM progression. The high-glucose environment of T2DM may induce abnormal expression of coagulation factors and complement components, potentially amplifying inflammatory responses and exacerbating microvascular complications (39). The activation of the coagulation system in TB patients is closely associated with the formation of tuberculous granulomas and tissue necrosis. Excessive activation of the complement system may exacerbate pulmonary damage by inducing localized coagulation (40). Declined immunoglobulin function may further weaken the host’s immune clearance capacity. Immunoglobulins serve as essential effector molecules in B cell-mediated humoral immunity, facilitating infection combating by binding to pathogen surface antigens, activating the complement system, and promoting pathogen clearance. In diabetic patients, the high-glucose environment may impair B cell function and alter the glycosylation of immunoglobulins, thereby reducing their effector functions (41). Specific immunoglobulins, such as IgM, are vital in the early clearance of M. tuberculosis and the regulation of late-stage disease progression (42). In TB-T2DM comorbidity, dysregulation of humoral immunity may further impair the host’s ability to clear M. tuberculosis, thus prolonging the infection and increasing the disease burden.
The four machine learning methods, expression pattern analysis, and ROC curve evaluation across multiple dimensions identified three key genes from the 23 shared genes: CYP1B1, SERPING1, and CHPT1. Pathway enrichment analysis of the three genes revealed their potential roles in immune responses, inflammation, lipid metabolism, cell growth, and immune evasion in both T2DM and TB. Immune infiltration analysis revealed the cellular-level immunopathological characteristics of TB-T2DM comorbidity. In TB patients, the neutrophils, monocytes, and M0 macrophages increase significantly, while the CD8+ T cells and natural killer (NK) cells decrease markedly. Neutrophils protect the host via the oxidative killing of mycobacteria and serve as critical innate immune cells for combating TB infection (43), and elevated absolute neutrophil counts are a hallmark of TB-T2DM (44). Following initial M. tuberculosis infection, monocytes rapidly migrate to the lungs and differentiate into macrophages and dendritic cells for antigen presentation and cytokine secretion (45). The significant increase in M0 macrophages may result from the M. tuberculosis infection-induced shift toward the M0 phenotype, enabling the bacteria to evade host immune clearance (46). CD8+ T cells also produce pro-inflammatory cytokines, including type 1 and type 17 cytokines in TB (47). Upon stimulation by M. tuberculosis antigens, CD8+ T cells exhibit increased expression of type 1 (IFN-γ and IL-2) and type 17 (IL-17F) cytokines, but their expression of cytotoxic markers such as perforin, granzyme B, and CD107a is significantly reduced. These findings suggest a critical link between CD8+ T cells and the pathogenesis of TB-T2DM comorbidity (48). NK cells are effector cells of innate immunity, serving vital functions in early infection by activating phagocytes at the infection site. The production of IFN-γ, IL-17, and IL-22 by NK cells is crucial for the host’s defense against M. tuberculosis. Studies indicated that M. tuberculosis suppresses NK cell activation receptors and reduces cytokine production, leading to decreased NK cells or impaired function during TB infection (49). Interestingly, CYP1B1 expression positively correlated with the infiltration levels of neutrophils, monocytes, and M0 macrophages, while negatively correlating with CD8+ T cells and NK cells. Thus, CYP1B1 may regulate the activity of monocytes and neutrophils, thereby enhancing innate immune responses while suppressing adaptive immune functions. This dual regulatory function of CYP1B1 in immune modulation may explain the heightened inflammatory responses and reduced anti-infective capacity in diabetic patients with TB infection.
The experimental validation focused on the expression of the cross-talk genes CYP1B1, CHPT1, and SERPING1 in in vitro models of T2DM-TB comorbidity as well as their impact on inflammatory responses and immune regulation. The results showed that CYP1B1 was significantly upregulated in response to the combined stimulation of high glucose and ESAT-6. Further siRNA transfection successfully knocked down CYP1B1 expression, leading to a significant reduction in inflammatory cytokines. Thus, CYP1B1 may influence the intensity of inflammatory responses by regulating the activity of immune cells. Silencing CYP1B1 also resulted in decreased expression of M2 macrophage markers CD163 and Arg-1, indicating its potential involvement in the anti-inflammatory polarization of macrophages. Further studies revealed that knocking down CYP1B1 significantly affected the expression of NOD2 and TRAF-6. Stimulated by high glucose levels and ESAT-6, the protein levels of NOD2 and TRAF-6 were markedly reduced, suggesting the crucial function of CYP1B1 in regulating the inflammatory response of the TB-T2DM comorbidity via the modulation of NOD2 and TRAF-6.
CYP1B1 is a member of the cytochrome P450 superfamily and is primarily involved in the metabolism of fat-soluble substances such as fatty acids and steroids (50, 51), particularly omega-3 and omega-6 fatty acids (52). Such fatty acids are fundamental for constructing cell membranes and regulating lipid signaling pathways. As a result, CYP1B1 may influence cell membrane fluidity, immune cell function, and the intensity of immune responses by modulating lipid metabolism (53). In T2DM-TB comorbidity, the dysregulation of lipid metabolism is often accompanied by heightened inflammatory responses (54). In T2DM, lipid metabolism imbalance is a key manifestation of insulin resistance and chronic low-grade inflammation (55). High-fat diets and obesity can trigger inflammatory responses in adipose tissue, which affect the systemic immune environment through the secretion of adipokines (e.g., adipocytokines and pro-inflammatory cytokines), thereby exacerbating immune dysregulation in diabetic patients (56). Studies have reported that with high-fat diet-induced obesity, mice lacking CYP1B1 were leaner and more resistant to obesity than the control (57). Meanwhile, studies have linked CYP121, CYP125, and CYP128 closely to the growth and survival of M. tuberculosis. High-throughput screening and fragment-based drug discovery methods have identified selective CYP inhibitors, thus providing a foundation for developing novel anti-tuberculosis drugs (58). The lipid metabolism disorders in TB patients also impair the immune function of macrophages, which typically clear pathogens through phagocytosis after M. tuberculosis infection (59). In T2DM patients, the metabolic reprogramming of fatty acids may lead to macrophage dysfunction, reducing their ability to clear M. tuberculosis (60). CYP1B1 may exacerbate immune dysregulation by affecting the lipid metabolism pathways, further delaying the immune response to TB in diabetic patients (61).
SERPING1, in particular, is important in the complement system (62). The complement system is a vital component of the immune system, protecting against infections by lysing bacteria, clearing immune complexes, and regulating immune responses (63). Research reported that the impaired monocyte function in diabetic patients may weaken their role in M. tuberculosis infection. The reduced binding capacity of monocytes to M. tuberculosis in diabetic individuals may be linked to the altered complement system. SERPING1 overexpression could lead to abnormal complement system activation, triggering excessive inflammation and immune responses, thereby promoting immune evasion by M. tuberculosis (64). However, research on its specific function in the shared pathological mechanisms of T2DM and TB remains insufficient, warranting further exploration. CHPT1 is a member of the choline phosphotransferase family and primarily catalyzes the synthesis of phosphatidylcholine, which is crucial for maintaining the structure and function of cell membranes. By promoting phosphatidylcholine production, CHPT1 contributes to cell membrane renewal and stability (65). Blocking choline uptake with pharmacological inhibitors and CTL1-specific antibodies was found to alter cytokine secretion patterns, with increased levels of TNF-α and IL-6 but decreased levels of IL-10 (66). In TB-T2DM comorbidity, phosphatidylcholine synthesis may be important in processes such as cell interactions and cytokine release during inflammatory responses (67). The in vitro models in this study exhibited no statistically significant differences in the expression levels of CHPT1 and SERPING1 across treatments compared to controls. CHPT1 is primarily associated with lipid metabolism and cell membrane modifications, which may be upregulated in adipocytes. SERPING1 is mainly involved in complement system activation, likely requiring complement participation or a more complex in vivo immune microenvironment to fully manifest its regulatory effects. However, this does not imply their irrelevance in the pathogenesis of T2DM and TB. On the contrary, they may play indirect or synergistic roles in complex biological systems. Thus, future studies may modify the experimental conditions or construct more sophisticated animal models to reach definitive conclusions.
siRNA transfection effectively suppressed CYP1B1 expression, leading to significant downregulation of both pro-inflammatory and anti-inflammatory cytokines. These results establish a positive correlation between CYP1B1 expression and the production of inflammation-related factors. Silencing CYP1B1 also affected the expression of M2 macrophage markers (CD163 and Arg-1). CD163 is a prominent marker of M2 macrophages, typically associated with anti-inflammatory and tissue repair functions. It reduces oxidative stress and inflammatory responses by clearing hemoglobin-haptoglobin complexes (68). Arg-1 is another key marker of M2 macrophages, which converts arginine into ornithine and polyamines to promote cell proliferation and tissue repair (69). Knocking down CYP1B1 significantly reduced the expression of CD163 and Arg-1 in TB-T2DM comorbidity. Thus, CYP1B1 may influence the anti-inflammatory polarization of macrophages by regulating the expression of CD163 and Arg-1, thereby exacerbating inflammatory responses. CXCL10 is a chemokine that, upon binding to the CXCR3 receptor, participates in immune cell recruitment and inflammatory response regulation. Its recruitment of Th1 cells and NK cells to sites of inflammation enhances immune reactions (70). The experimental results also showed significantly decreased mRNA expression of CXCL10 after CYP1B1 knockdown, indicating that the absence of CYP1B1 in TB-T2DM comorbidity suppresses immune cell recruitment. In summary, CYP1B1 knockdown reduced both M1 and M2 macrophage polarization. Bioinformatics analysis of immune infiltration revealed that TB patients exhibited upregulated M0 macrophages, while their M1/M2 polarization remained unchanged compared to healthy controls. Therefore, while M. tuberculosis alters host metabolism, the metabolic reprogramming is not affected. Likewise, our experimental results demonstrated that although CYP1B1 influences the metabolism, it does not affect the reprogramming in macrophages.
The above research found that silencing CYP1B1 reduces the polarization of both M1 and M2 macrophages, indicating the significant involvement of CYP1B1 in the immune function of macrophages. The underlying mechanisms are explored based mainly on the ssGSEA results of CYP1B1 in bioinformatics analysis, particularly the NOD-like receptor and TNF signaling pathways. NOD2 is a crucial pattern recognition receptor involved in sensing pathogens and activating immune responses (71). RIP2-mediated ubiquitination of NOD2 interacts with TRAF6, thus activating the NF-κB signaling pathway and initiating downstream immune responses (72). This pathway is key to immune cell activation, inflammatory response regulation, and immune evasion in TB (73). Additionally, TRAF6, as an E3 ubiquitin ligase, mediates the polyubiquitination of itself and downstream signaling molecules, further enhancing inflammatory responses (74). Our experimental results showed significantly downregulated expression of NOD2 and TRAF6 after silencing CYP1B1, suggesting that they may be regulated by CYP1B1, which is consistent with the ssGSEA results from bioinformatics analysis. However, in the control group with CYP1B1 siRNA transfection, the protein expression levels of NOD2 and TRAF6 showed an increasing trend relative to the control group with siRNA transfection. A possible explanation is that with CYP1B1 knockdown, cells may activate other inflammatory pathways to compensate for the resultant metabolic stress. As CYP1B1 knockdown leads to intracellular metabolic disturbances, NOD2, as an important pattern recognition receptor, may be upregulated to enhance immune responses. Similarly, the basal expression level of TRAF6 significantly increased after CYP1B1 knockdown. TRAF6 is vital in inflammatory signaling, and its upregulation may be related to the activation of the NOD2 pathway, further indicating that cells maintain downstream signaling and inflammatory responses by increasing TRAF6 expression after CYP1B1 knockdown.
Based on the above findings, we reasonably speculate that CYP1B1 may be a key regulator in the inflammatory response of TB-T2DM comorbidity through the following mechanisms. The reasoning process is illustrated in Figure 6.

Figure 6. Discussion diagram: (A) The left portion (green section) summarizes the experimental results of this study: Transcriptome data from T2DM and TB patients were analyzed using WGCNA and machine learning methods, identifying CYP1B1, SERPING1, and CHPT1 through enrichment analysis. As immune infiltration results exhibited an association with M0 macrophages, this study employed THP-1 M0 macrophages for experiments. However, only CYP1B1 mRNA levels were upregulated in THP-1 macrophages (highlighted in red), while the other two genes remained unchanged (highlighted in yellow). Further experiments using CYP1B1 siRNA demonstrated downregulation of inflammation-related factors and receptors (highlighted in green). (B) The right portion (blue section) presents hypotheses based on experimental findings: High glucose concentrations and M. tuberculosis-secreted ESAT-6 stimulate TNF and Toll-like receptors (TLRs). The resulting cascade signals are regulated by CYP1B1, subsequently transmitting to NOD2 receptors and TRAF6, ultimately affecting macrophage autophagy. Additionally, these signals induce polarization of M0 macrophages, which differentiate into M1 macrophages that secrete TNF-α, IL-6, and IL-1β while activating CD163 and Arg-1 to polarize into M2 macrophages that secrete IL-10 and CXCL-10.
1. CYP1B1 enhances inflammatory responses via the NOD2-TRAF6-NF-κB pathway: CYP1B1 may regulate NOD2 and TRAF6, promoting NF-κB activation and amplifying immune responses triggered by TB infection. The high-glucose environment may further induce CYP1B1 expression, exacerbating NF-κB activation and causing excessive inflammatory responses and tissue damage.
2. CYP1B1 disrupts the dynamic balance between pro-inflammatory and anti-inflammatory responses: Silencing CYP1B1 reduces the expression of both pro-inflammatory cytokines (TNF-α, IL-6, and IL-1β) and anti-inflammatory cytokines (IL-10). Meanwhile, the expression of M2 macrophage markers (CD163, Arg-1) and the chemokine CXCL-10 is suppressed. This imbalanced immune regulation may increase the susceptibility of diabetic patients to TB infection and exacerbate the severity of inflammatory responses.
3. Metabolic dysregulation affects immune function modulation: CYP1B1 participates in lipid metabolism, influencing fatty acid metabolism and cell membrane fluidity and, in turn, regulating immune cell function. In TB-T2DM comorbidity, CYP1B1-induced lipid metabolism dysregulation may impair the ability of macrophages to clear M. tuberculosis, creating a vicious cycle of inflammation and metabolic abnormalities.
A limitation of this study is that in vitro models may not fully reflect the complex inflammatory and immune regulatory mechanisms in vivo. T2DM is a chronic process, and which is a risk factor for Mycobacterium tuberculosis infection (6). Although ESAT-6/glucose disease models were used in the researches, however, treated glucose or ESAT-6 in macrophage does not fully reflect the inflammation entire process of for T2DM or Mycobacterium tuberculosis infection. Nevertheless, the mechanism found in this study may reflect an early response via macrophage. In the future study, we will utilize diabetes model mouse and live Mycobacterium tuberculosis, e.g. Ra or Rv strain to explore the further mechanism following this research results.
5 Conclusion
This study identified CYP1B1, SERPING1, and CHPT1 as cross-talk genes between TB and T2DM. Experimental results showed that CYP1B1 was significantly upregulated in response to the combined stimulation of high glucose concentration and ESAT-6. CYP1B1 knockdown markedly reduced the expression of inflammatory cytokines (TNF-α, IL-6, IL-1β, and IL-10), M2 macrophage polarization markers (CD163 and Arg-1), and chemokine CXCL-10 and suppressed the expression of NOD2 and TRAF6. These findings demonstrate that in the macrophage inflammatory responses mediated by ESAT-6, high glucose, or combined stimulation, the expression of NOD2, TRAF6, and cytokines positively correlates with CYP1B1 levels, indicating CYP1B1 as a crucial regulator in TB-T2DM inflammation by modulating inflammatory factors and NOD2/TRAF6 expression.
Data availability statement
Publicly available datasets were analyzed in this study. This data can be found here: https://www.ncbi.nlm.nih.gov/geo/.
Ethics statement
Ethical approval was not required for the studies on animals in accordance with the local legislation and institutional requirements because only commercially available established cell lines were used.
Author contributions
QD: Writing – original draft, Software, Resources. KL: Supervision, Funding acquisition, Writing – review & editing, Methodology. YL: Methodology, Writing – review & editing, Software. XYW: Visualization, Writing – review & editing. XL: Validation, Writing – review & editing. JZ: Validation, Writing – review & editing. XMW: Funding acquisition, Methodology, Writing – review & editing, Supervision.
Funding
The author(s) declare financial support was received for the research and/or publication of this article. This research was supported by the National Natural Science Foundation of China (No. 81960603), National Natural Science Foundation of Inner Mongolia (No. 2023QN08051), and Inner Mongolia Medical University general project (No. YKD2023MS026).
Acknowledgments
The authors would like to express their gratitude to EssentialsLink (https://www.essentialslink.cn/) for the expert linguistic services provided.
Conflict of interest
The authors declare that the research was conducted in the absence of any commercial or financial relationships that could be construed as a potential conflict of interest.
Generative AI statement
The author(s) declare that no Generative AI was used in the creation of this manuscript.
Any alternative text (alt text) provided alongside figures in this article has been generated by Frontiers with the support of artificial intelligence and reasonable efforts have been made to ensure accuracy, including review by the authors wherever possible. If you identify any issues, please contact us.
Publisher’s note
All claims expressed in this article are solely those of the authors and do not necessarily represent those of their affiliated organizations, or those of the publisher, the editors and the reviewers. Any product that may be evaluated in this article, or claim that may be made by its manufacturer, is not guaranteed or endorsed by the publisher.
Supplementary material
The Supplementary Material for this article can be found online at: https://www.frontiersin.org/articles/10.3389/fendo.2025.1617292/full#supplementary-material
Supplementary Figure 1 | Flow chart of this research.
Supplementary Figure 2 | Machine learning algorithms identifying key genes related to the mechanisms by which T2DM affects TB. (A) LASSO coefficient distribution plot. (B) LASSO coefficient profile plot, where the vertical dashed lines indicate the log(λ) values corresponding to the minimum mean squared error and one standard error away from the minimum mean squared error. The plot also shows the number of variables with non-zero coefficients in LASSO regression. (C) RF model achieving the highest accuracy at N=17. (D, E) SVM-RFE feature: 5-fold cross-validation accuracy plot and error plot. (F) Venn diagram showing the intersection of genes selected by LASSO, RF, and SVM-RFE. (G) Gaussian mixture model determining the logistic regression model pattern related to AUC values.
Supplementary Figure 3 | (A) qPCR analysis of CYP1B1 mRNA expression following transfection with CYP1B1 SiRNA. (B, C) Western blot analysis showing the reduction of CYP1B1 protein expression after SiRNA-mediated knockdown. Note: Statistical significance is denoted as follows: ns, not significant (P > 0.05), *P < 0.05, **P < 0.01, and ***P < 0.001. The polyclonal anti-CYP1B1 antibody may produce non-specific bands due to its broad reactivity. The band of interest (indicated by the arrow) was selected based on its expected molecular weight (52~61 kDa).
Supplementary Table 1 | Detailed results of GO enrichment analysis.
References
1. Workneh MH, Bjune GA, and Yimer SA. Prevalence and associated factors of tuberculosis and diabetes mellitus comorbidity: A systematic review. PLoS One. (2017) 12:e0175925. doi: 10.1371/journal.pone.0175925
3. Richards SE, Wijeweera C, and Wijeweera A. Lifestyle and socioeconomic determinants of diabetes: Evidence from country-level data. PLoS One. (2022) 17:e0270476. doi: 10.1371/journal.pone.0270476
4. Pan SC, Ku CC, Kao D, Ezzati M, Fang CT, and Lin HH. Effect of diabetes on tuberculosis control in 13 countries with high tuberculosis: a modelling study. Lancet Diabetes Endocrinol. (2015) 3:323–30. doi: 10.1016/S2213-8587(15)00042-X
5. Van Crevel R and Critchley JA. The interaction of diabetes and tuberculosis: translating research to policy and practice. Trop Med Infect Dis. (2021) 6:8. doi: 10.3390/tropicalmed6010008
6. Gautam S, Shrestha N, Mahato S, Nguyen TPA, Mishra SR, and Berg-Beckhoff G. Diabetes among tuberculosis patients and its impact on tuberculosis treatment in South Asia: a systematic review and meta-analysis. Sci Rep. (2021) 11:2113. doi: 10.1038/s41598-021-81057-2
7. Lee MR, Huang YP, Kuo YT, Luo CH, Shih YJ, Shu CC, et al. Diabetes mellitus and latent tuberculosis infection: A systematic review and metaanalysis. Clin Infect Dis. (2017) 64:719–27. doi: 10.1093/cid/ciw836
8. Martinez N and Kornfeld H. Diabetes and immunity to tuberculosis. Eur J Immunol. (2014) 44:617–26. doi: 10.1002/eji.201344301
9. Vishakh R, Suchetha KN, Bhandary A, Shetty SS, Bhandary P, and Tamizh SG. Evaluating the role of cytokinesis-block micronucleus assay as a biomarker for oxidative stress-inducing DNA damage in type 2 diabetes mellitus patients. Beni-Suef Univ J Basic Appl Sci. (2023) 2023:56. doi: 10.1186/s43088-023-00384-7
10. Akash MS, Rehman K, and Chen S. Role of inflammatory mechanisms in pathogenesis of type 2 diabetes mellitus. J Cell Biochem. (2013) 114:525–31. doi: 10.1002/jcb.24402
11. Velikova TV, Kabakchieva PP, Assyov YS, and Georgiev TА. Targeting inflammatory cytokines to improve type 2 diabetes control. BioMed Res Int. (2021) 2021:7297419. doi: 10.1155/2021/7297419
12. Abbas U, Masood KI, Khan A, Irfan M, Saifullah N, Jamil B, et al. Tuberculosis and diabetes mellitus: Relating immune impact of co-morbidity with challenges in disease management in high burden countries. J Clin Tuberc Other Mycobact Dis. (2022) 29:100343. doi: 10.1016/j.jctube.2022.100343
13. Kleynhans L, Kunsevi-Kilola C, Tshivhula H, Webber T, Keyser A, Prins N, et al. Human alveolar macrophage function is impaired in tuberculosis contacts with diabetes. Res Square. (2024) rs.3.rs-5489046. doi: 10.21203/rs.3.rs-5489046/v1
14. Valtierra-Alvarado MA, Lugo-Villarino G, Dueñas-Arteaga F, González-Contreras BE, Lugo-Sánchez A, Castañeda-Delgado JE, et al. Impact of type 2 diabetes on the capacity of human macrophages infected with Mycobacterium tuberculosis to modulate monocyte differentiation through a bystander effect. Immunol Cell Biol. (2021) 99:1026–39. doi: 10.1111/imcb.12497
15. Restrepo BI, Fisher-Hoch SP, Pino PA, Salinas A, Rahbar MH, Mora F, et al. Tuberculosis in poorly controlled type 2 diabetes: altered cytokine expression in peripheral white blood cells. Clin Infect Dis. (2008) 47:634–41. doi: 10.1086/590565
16. Saltiel AR and Kahn CR. Insulin signalling and the regulation of glucose and lipid metabolism. Nature. (2001) 414:799–806. doi: 10.1038/414799a
17. Zhuang L, Yang L, Li L, Ye Z, and Gong W. Mycobacterium tuberculosis: immune response, biomarkers, and therapeutic intervention. MedComm (2020). (2024) 5:e419. doi: 10.1002/mco2.419
18. Singh K, Hussain T, Gupta B, and Pati SA. A comparative investigation on cytokine expression in pulmonary tuberculosis and comorbidity with type 2 diabetes mellitus. Int J Mycobacteriol. (2024) 13:165–70. doi: 10.4103/ijmy.ijmy_40_24
19. Mayer Bridwell AE. mSphere of influence: the key role of neutrophils in tuberculosis and type 2 diabetes comorbidity. mSphere. (2021) 6:e0025121. doi: 10.1128/mSphere.00251-21
20. Vallerskog T, Martens GW, and Kornfeld H. Diabetic mice display a delayed adaptive immune response to Mycobacterium tuberculosis. J Immunol. (2010) 184:6275–82. doi: 10.4049/jimmunol.1000304
21. Martinez N, Ketheesan N, West K, Vallerskog T, and Kornfeld H. Impaired recognition of mycobacterium tuberculosis by alveolar macrophages from diabetic mice. J Infect Dis. (2016) 214:1629–37. doi: 10.1093/infdis/jiw436
22. Martinez N, Vallerskog T, West K, Nunes-Alves C, Lee J, Martens GW, et al. Chromatin decondensation && T cell hyperresponsiveness in diabetes-associated hyperglycemia. J Immunol. (2014) 193:4457–68. doi: 10.4049/jimmunol.1401125
23. Huangfu P, Ugarte-Gil C, Golub J, Pearson F, and Critchley J. The effects of diabetes on tuberculosis treatment outcomes: an updated systematic review && meta-analysis. Int J Tuberc Lung Dis. (2019) 23:783–96. doi: 10.5588/ijtld.18.0433
24. Selvan GT, Gollapalli P, Shetty P, and Kumari NS. Exploring key molecular signatures of immune responses && pathways associated with tuberculosis in comorbid diabetes mellitus: a systems biology approach. Beni-Suef Univ J Basic Appl Sci. (2022) 11:77. doi: 10.1186/s43088-022-00257-5
25. Xin Y, Kim J, Okamoto H, Ni M, Wei Y, Adler C, et al. RNA sequencing of single human islet cells reveals type 2 diabetes genes. Cell Metab. (2016) 24:608–15. doi: 10.1016/j.cmet.2016.08.018
26. Langfelder P and Horvath S. WGCNA: an R package for weighted correlation network analysis. BMC Bioinf. (2008) 9:559. doi: 10.1186/1471-2105-9-559
27. Yu G, Wang LG, Han Y, and He QY. clusterProfiler: an R package for comparing biological themes among gene clusters. Omics. (2012) 16:284–7. doi: 10.1089/omi.2011.0118
28. Shen W, Song Z, Zhong X, Huang M, Shen D, Gao P, et al. Sangerbox: A comprehensive, interaction-friendly clinical bioinformatics analysis platform. Imeta. (2022) 1:e36. doi: 10.1002/imt2.36
29. Friedman J, Hastie T, and Tibshirani R. Regularization paths for generalized linear models via coordinate descent. J Stat Softw. (2010) 33:1–22. doi: 10.18637/jss.v033.i01
30. Fabris F, Doherty A, Palmer D, de Magalhães JP, and Freitas AA. A new approach for interpreting Random Forest models && its application to the biology of ageing. Bioinformatics. (2018) 34:2449–56. doi: 10.1093/bioinformatics/bty087
31. Lin X, Li C, Zhang Y, Su B, Fan M, Wei H, et al. Selecting feature subsets based on SVM-RFE && the overlapping ratio with applications in bioinformatics. Molecules. (2017) 23:52. doi: 10.3390/molecules23010052
32. Ficklin SP, Dunwoodie LJ, Poehlman WL, Watson C, Roche KE, and Feltus FA. Discovering condition-specific gene co-expression patterns using gaussian mixture models: A cancer case study. Sci Rep. (2017) 7:8617. doi: 10.1038/s41598-017-09094-4
33. Fang K, Song X, and Bo J. A nomogram to predict mortality in patients with severe fever with thrombocytopenia syndrome. Sci Rep. (2024) 14:10627. doi: 10.1038/s41598-024-60923-9
34. Newman AM, Liu CL, Green MR, Gentles AJ, Feng W, Xu Y, et al. Robust enumeration of cell subsets from tissue expression profiles. Nat Methods. (2015) 12:453–7. doi: 10.1038/nmeth.3337
35. Gautam S, Shrestha N, Mahato S, Nguyen TPA, Mishra SR, and Berg-Beckhoff G. Diabetes among tuberculosis patients && its impact on tuberculosis treatment in South Asia: a systematic review && meta-analysis. Sci Rep. (2021) 11:2113. doi: 10.1038/s41598-021-81057-2
36. Baker MA, Harries AD, Jeon CY, Hart JE, Kapur A, Lönnroth K, et al. The impact of diabetes on tuberculosis treatment outcomes: a systematic review. BMC Med. (2011) 9:81. doi: 10.1186/1741-7015-9-81
37. Bustin SA, Benes V, Garson JA, Hellemans J, Huggett J, Kubista M, et al. The MIQE guidelines: minimum information for publication of quantitative real-time PCR experiments. Clin Chem. (2009) 55:611–22. doi: 10.1373/clinchem.2008.112797
38. Kurien BT and Scofield RH. Western blotting: an introduction. Methods Mol Biol. (2015) 1312:17–30. doi: 10.1007/978-1-4939-2694-7
39. Valencia I, Lumpuy-Castillo J, Magalhaes G, Sánchez-Ferrer CF, Lorenzo Ó, and Peiró C. Mechanisms of endothelial activation, hypercoagulation && thrombosis in COVID-19: a link with diabetes mellitus. Cardiovasc Diabetol. (2024) 23:75. doi: 10.1186/s12933-023-02097-8
40. Kothari H, Rao LV, Vankayalapati R, and Pendurthi UR. Mycobacterium tuberculosis infection && tissue factor expression in macrophages. PLoS One. (2012) 7:e45700. doi: 10.1371/journal.pone.0045700
41. Guo X, Meng G, Liu F, Zhang Q, Liu L, Wu H, et al. Serum levels of immunoglobulins in an adult population && their relationship with type 2 diabetes. Diabetes Res Clin Pract. (2016) 115:76–82. doi: 10.1016/j.diabres.2016.03.007
42. Krause R, Ogongo P, Tezera L, Ahmed M, Mbano I, Chambers M, et al. B cell heterogeneity in human tuberculosis highlights compartment-specific phenotype && functional roles. Commun Biol. (2024) 7:584. doi: 10.1038/s42003-024-06282-7
43. Lowe DM, Redford PS, Wilkinson RJ, O'Garra A, and Martineau AR. Neutrophils in tuberculosis: friend or foe? Trends Immunol. (2012) 33:14–25. doi: 10.1016/j.it.2011.10.003
44. Andrade BB, Kumar NP, Sridhar R, Banurekha VV, Jawahar MS, Nutman TB, et al. Heightened plasma levels of heme oxygenase-1 && tissue inhibitor of metalloproteinase-4 as well as elevated peripheral neutrophil counts are associated with TB-diabetes comorbidity. Chest. (2014) 145:1244–54. doi: 10.1378/chest.13-1799
45. Schlesinger LS, Bellinger-Kawahara CG, Payne NR, and Horwitz MA. Phagocytosis of Mycobacterium tuberculosis is mediated by human monocyte complement receptors && complement component C3. J Immunol. (1990) 144:2771–80. doi: 10.4049/jimmunol.144.7.2771
46. Kumar NP, Moideen K, Viswanathan V, Shruthi BS, Sivakumar S, Menon PA, et al. Elevated levels of matrix metalloproteinases reflect severity && extent of disease in tuberculosis-diabetes co-morbidity && are predominantly reversed following standard anti-tuberculosis or metformin treatment. BMC Infect Dis. (2018) 18:345. doi: 10.1186/s12879-018-3246-y
47. O'Garra A, Redford PS, McNab FW, Bloom CI, Wilkinson RJ, and Berry MP. The immune response in tuberculosis. Annu Rev Immunol. (2013) 31:475–527. doi: 10.1146/annurev-immunol-032712-095939
48. Kumar NP, Sridhar R, Nair D, Banurekha VV, Nutman TB, and Babu S. Type 2 diabetes mellitus is associated with altered CD8(+) T && natural killer cell function in pulmonary tuberculosis. Immunology. (2015) 144:677–86. doi: 10.1111/imm.12421
49. Vats D, Rani G, Arora A, Sharma V, Rathore I, Mubeen SA, et al. Tuberculosis && T cells: Impact of T cell diversity in tuberculosis infection. Tuberculosis. (2024) 149:102567. doi: 10.1016/j.tube.2024.102567
50. Li F, Zhu W, and Gonzalez FJ. Potential role of CYP1B1 in the development && treatment of metabolic diseases. Pharmacol Ther. (2017) 178:18–30. doi: 10.1016/j.pharmthera.2017.03.007
51. Yaghini FA, Song CY, Lavrentyev EN, Ghafoor HU, Fang XR, Estes AM, et al. Angiotensin II-induced vascular smooth muscle cell migration and growth are mediated by cytochrome P450 1B1-dependent superoxide generation. Hypertension. (2010) 55:1461–67. doi: 10.1161/HYPERTENSIONAHA.110.150029
52. Hossam Abdelmonem B, Abdelaal NM, Anwer EKE, Rashwan AA, Hussein MA, Ahmed YF, et al. Decoding the role of CYP450 enzymes in metabolism && Disease: A comprehensive review. Biomedicines. (2024) 12:1467. doi: 10.3390/biomedicines12071467
53. Li W, Ding Z, Zhang H, Shi Q, Wang D, Zhang S, et al. The roles of blood lipid-metabolism genes in immune infiltration could promote the development of IDD. Front Cell Dev Biol. (2022) 10:844395. doi: 10.3389/fcell.2022.844395
54. Abbas U, Masood KI, Khan A, Irfan M, Saifullah N, Jamil B, et al. Tuberculosis && diabetes mellitus: Relating immune impact of co-morbidity with challenges in disease management in high burden countries. J Clin Tuberculosis && Other Mycobacterial Dis. (2022) 29:100343. doi: 10.1016/j.jctube.2022.100343
55. Xu B, Wu Q, La R, Lu L, Abdu FA, Yin G, et al. Is systemic inflammation a missing link between cardiometabolic index with mortality? Evidence from a large population-based study. Cardiovasc Diabetol. (2024) 23:212. doi: 10.1186/s12933-024-02251-w
56. McArdle MA, Finucane OM, Connaughton RM, McMorrow AM, and Roche HM. Mechanisms of obesity-induced inflammation && insulin resistance: insights into the emerging role of nutritional strategies. Front Endocrinol (Lausanne). (2013) 4:52. doi: 10.3389/fendo.2013.00052
57. Li F, Jiang C, Larsen MC, Bushkofsky J, Krausz KW, Wang T, et al. Lipidomics reveals a link between CYP1B1 && SCD1 in promoting obesity. J Proteome Res. (2014) 13:2679–87. doi: 10.1021/pr500145n
58. Hudson SA, McLean KJ, Munro AW, and Abell C. Mycobacterium tuberculosis cytochrome P450 enzymes: a cohort of novel TB drug targets. Biochem Soc Trans. (2012) 40:573–9. doi: 10.1042/BST20120062
59. Chen Z, Kong X, Ma Q, Chen J, Zeng Y, Liu H, et al. The impact of Mycobacterium tuberculosis on the macrophage cholesterol metabolism pathway. Front Immunol. (2024) 15:1402024. doi: 10.3389/fimmu.2024.1402024
60. Witcoski Junior L, de Lima JD, Somensi AG, de Souza Santos LB, Paschoal GL, Uada TS, et al. Metabolic reprogramming of macrophages in the context of type 2 diabetes. Eur J Med Res. (2024) 29:497. doi: 10.1186/s40001-024-02069-y
61. Johnston JB, Kells PM, Podust LM, and Ortiz de Montellano PR. Biochemical && structural characterization of CYP124: a methyl-branched lipid omega-hydroxylase from Mycobacterium tuberculosis. Proc Natl Acad Sci U.S.A. (2009) 106:20687–92. doi: 10.1073/pnas.0907398106
62. Ricklin D, Hajishengallis G, Yang K, and Lambris JD. Complement: a key system for immune surveillance && homeostasis. Nat Immunol. (2010) 11:785–97. doi: 10.1038/ni.1923
63. Cedzyński M, Thielens NM, Mollnes TE, and Vorup-Jensen T. Editorial: the role of complement in health && Disease. Front Immunol. (2019) 10:1869. doi: 10.3389/fimmu.2019.01869
64. Lubbers R, Sutherland JS, Goletti D, de Paus RA, Dijkstra DJ, van Moorsel CHM, et al. Expression && production of the SERPING1-encoded endogenous complement regulator C1-inhibitor in multiple cohorts of tuberculosis patients. Mol Immunol. (2020) 120:187–95. doi: 10.1016/j.molimm.2020.02.006
65. Wang L and Zhou M. Structure of a eukaryotic cholinephosphotransferase-1 reveals mechanisms of substrate recognition && catalysis. Nat Commun. (2023) 14:2753. doi: 10.1038/s41467-023-38003-9
66. Snider SAMargison KDGhorbani PLeBlond NDO'Dwyer CNunes JRC. Choline transport links macrophage phospholipid metabolism && inflammation. J Biol Chem. (2018) 293:11600–11. doi: 10.1074/jbc.RA118.003180
67. Tan W, Zhang Q, Dong Z, Yan Y, Fu Y, Liu X, et al. Phosphatidylcholine ameliorates LPS-induced systemic inflammation && Cognitive impairments via mediating the gut–brain axis balance. J Agric && Food Chem. (2020) 68:14884–95. doi: 10.1021/acs.jafc.0c06383
68. Van Gorp H, Delputte PL, and Nauwynck HJ. Scavenger receptor CD163, a Jack-of-all-trades && potential target for cell-directed therapy. Mol Immunol. (2010) 47:1650–60. doi: 10.1016/j.molimm.2010.02.008
69. Rath M, Müller I, Kropf P, Closs EI, and Munder M. Metabolism via arginase or nitric oxide synthase: two competing arginine pathways in macrophages. Front Immunol. (2014) 5:532. doi: 10.3389/fimmu.2014.00532
70. Liu M, Guo S, Hibbert JM, Jain V, Singh N, Wilson NO, et al. CXCL10/IP-10 in infectious diseases pathogenesis && potential therapeutic implications. Cytokine Growth Factor Rev. (2011) 22:121–30. doi: 10.1016/j.cytogfr.2011.06.001
71. Trindade BC and Chen GY. NOD1 && NOD2 in inflammatory && infectious diseases. Immunol Rev. (2020) 297:139–61. doi: 10.1111/imr.12902
72. Gao P, Liu H, Huang H, Sun Y, Jia B, Hou B, et al. The Crohn Disease-associated ATG16L1(T300A) polymorphism regulates inflammatory responses by modulating TLR- && NLR-mediated signaling. Autophagy. (2022) 18:2561–75. doi: 10.1080/15548627.2022.2039991
73. Caruso R, Warner N, Inohara N, and Núñez G. NOD1 && NOD2: signaling, host defense, && inflammatory disease. Immunity. (2014) 41:898–908. doi: 10.1016/j.immuni.2014.12.010
Keywords: tuberculosis, type 2 diabetes, macrophages, CYP1B1, inflammatory response
Citation: Du Q, Liu K, Li Y, Wang X, Liu X, Zhao J and Wang X (2025) Inhibition of CYP450 family 1 subfamily B member 1 (CYP1B1) expression in macrophage reduces the inflammatory response in type 2 diabetes mellitus combined with tuberculosis. Front. Endocrinol. 16:1617292. doi: 10.3389/fendo.2025.1617292
Received: 02 May 2025; Accepted: 01 August 2025;
Published: 21 August 2025.
Edited by:
Konrad Andrzej Szychowski, University of Information Technology and Management, PolandReviewed by:
Hengyi Xu, The University of Texas at Austin, United StatesTamizh Selvan G, K S Hegde Medical Academy, India
Copyright © 2025 Du, Liu, Li, Wang, Liu, Zhao and Wang. This is an open-access article distributed under the terms of the Creative Commons Attribution License (CC BY). The use, distribution or reproduction in other forums is permitted, provided the original author(s) and the copyright owner(s) are credited and that the original publication in this journal is cited, in accordance with accepted academic practice. No use, distribution or reproduction is permitted which does not comply with these terms.
*Correspondence: Xuemei Wang, d2FuZ3htX3pzdUAxNjMuY29t
†These authors have contributed equally to this work and share first authorship