 Dou Tang
 Xi Gu†
- Department of Endocrinology, RuiJin Hospital Lu Wan Branch, Shanghai Jiaotong University School of Medicine, Shanghai, China
Background: The triglyceride-glucose (TyG) index has recently emerged as a simple surrogate marker of insulin resistance. However, the relationships among the TyG index, obesity, and hyperuricemia in individuals with T2DM remain unclear. This study investigates the associations of the TyG index and obesity with hyperuricemia in T2DM, and the possible role of obesity in these associations.
Methods: In this cross-sectional study, 1,159 adults with T2DM were enrolled. The TyG index was calculated as ln [fasting triglyceride (mg/dl) × fasting plasma glucose (mg/dl)/2]. Participants were stratified into hyperuricemia and non-hyperuricemia groups based on serum uric acid levels. Multivariable logistic regression and subgroup analyses were performed to assess the association between the TyG index and hyperuricemia. Mediation analysis quantified BMI’s contribution to this relationship.
Results: The prevalence of hyperuricemia was 30.7%. After adjustment for age, gender, HbA1c, diabetes duration, eGFR, HDL-C, LDL-C, hypertension, hyperlipidemia, coronary heart disease, smoking status, and alcohol consumption, each unit increase in the TyG index was independently associated with a 36% elevated risk of hyperuricemia (OR = 1.36, 95% CI: 1.10-1.68). Subgroup analyses showed consistent associations across different patient subgroups. Mediation analysis indicated that BMI accounted for 20.0% of the relationship.
Conclusions: The TyG index and BMI were both associated with hyperuricemia in Chinese patients with T2DM, with BMI potentially representing an indirect link.
1 Introduction
Hyperuricemia has emerged as a crucial public health challenge globally. Hyperuricemia is defined by elevated serum uric acid levels, primarily due to excessive production, impaired urinary excretion, or a combination of both (1). Recent meta-analyses have demonstrated a consistent rise in hyperuricemia prevalence across China over recent decades (2). A national survey conducted in 2018–19 found that about 14.0% of adults in China have hyperuricemia (3). Similarly, in the general U.S. population, approximately 20% had hyperuricemia according to the National Health and Nutrition Examination Survey from 1999 to 2018 (4). Numerous epidemiologic studies have shown that hyperuricemia correlates with type 2 diabetes mellitus (T2DM), insulin resistance, metabolic syndrome, renal disease, cardiovascular disease, and all-cause mortality (5–8). Notably, individuals with T2DM exhibit a significantly higher prevalence of hyperuricemia compared to the general population (9–11). Therefore, identifying modifiable risk factors for hyperuricemia is critical to enable targeted prevention and management approaches.
The TyG index is a simple, cost-effective, and reliable surrogate marker of insulin resistance (IR), avoiding the technical and financial constraints linked to the hyperinsulinemic-euglycemic clamp (HEC) or HOMA-IR in regular practice (12). Accumulating evidence underscores its strong predictive value for IR-related metabolic disturbances, with studies demonstrating significant correlations between elevated TyG index and incident T2DM, cardiovascular events, chronic kidney disease, and non-alcoholic fatty liver disease (13, 14). The TyG index, derived from fasting triglyceride and glucose levels, indicates lipid and glucose metabolism dysregulation, which is mechanistically linked to hyperuricemia pathogenesis (15, 16).
Some studies have consistently demonstrated a significant association between IR and hyperuricemia (12). In the Chinese general population, a linear positive association between the TyG index and hyperuricemia has been observed (17). In contrast, a cross-sectional study from the general population in the United States revealed a non-linear, reverse U-shaped relationship between the TyG index and hyperuricemia (4). Among hypertensive individuals, this relationship remains positively correlated (18, 19). Although insulin resistance is recognized as a central pathophysiological mechanism in T2DM, evidence investigating the specific interplay between the TyG index and hyperuricemia in diabetic populations remains limited.
BMI, an indicator of obesity, is strongly associated with hyperuricemia (20–22). Existing research also shows a positive correlation between the TyG index and BMI (23). However, the complex relationship among these three factors has not been thoroughly explored, particularly in individuals with type 2 diabetes, who represent a population characterized by high insulin resistance, high incidence of hyperuricemia, and a strong association with obesity. Therefore, this study aims to examine the association between the TyG index and hyperuricemia in individuals with T2DM and to assess the potential mediating role of obesity, measured by BMI, in this relationship.
2 Methods
2.1 Study participants
A total of 1,193 consecutive T2DM inpatients at the Department of Endocrinology, RuiJin Hospital Lu Wan Branch, from March 2020 to December 2024, were retrospectively selected as the research subjects. T2DM diagnosis was established according to the 2020 American Diabetes Association (ADA) criteria [23]. Participants were excluded based on the following criteria: missing data of uric acid (n=12), missing data of TyG index (n=32), or age < 18 years (n=1). In total, 34 individuals (2.9%) were excluded, leaving 1,159 participants in the final analysis. According to the Helsinki Declaration, the study protocol was approved by the Ethics Committee of RuiJin Hospital Lu Wan Branch, Shanghai Jiaotong University School of Medicine. All participants gave their written informed consent.
2.2 Clinical and biochemical analysis
All participants completed structured interviews by trained research staff, including sex, age, duration of diabetes mellitus, smoking status (never, former, or current), smoking (never or current), and medical history. BMI was calculated as body weight (kg)/height (m2). An electronic sphygmomanometer measured SBP and DBP after a 5-minute rest period. Blood samples were collected from subjects after an overnight fast of at least eight hours, typically in the morning, ensuring standardized fasting conditions. Fasting blood glucose (FBG), glycated hemoglobin A1c (HbA1c), triglycerides (TG), total cholesterol (TC), high-density lipoprotein cholesterol (HDL-C), low-density lipoprotein cholesterol (LDL-C), uric acid (UA), and renal function tests were measured using standard methods. The estimated glomerular filtration rate (eGFR) was calculated using the abbreviated Modification of Diet in Renal Disease (MDRD) formula (24).
2.3 Definitions of the exposure and outcome variables
The TyG index was calculated using the formula: TyG = ln [TG (mg/dL) × FBG (mg/dL) / 2] (25). Hyperuricemia was defined as a serum uric acid level ≥ 420 μmol/L in males or ≥ 360 μmol/L in females (26).
2.4 Statistical analysis
Continuous variables with normal distributions (assessed by Kolmogorov-Smirnov tests and Q-Q plots) were expressed as mean ± standard deviation, while non-normally distributed variables were reported as median (interquartile range). Categorical variables were presented as frequencies (percentages). Differences between the hyperuricemia and non-hyperuricemia groups were assessed using the Student’s t-test for normally distributed continuous variables, the Mann-Whitney U test for non-normally distributed continuous variables, and the chi-square test for categorical variables. P-values for baseline comparisons are presented for descriptive purposes only and were not adjusted for multiple comparisons.
The associations between the TyG index and hyperuricemia were assessed using univariate and multivariable logistic regression models across three different models. The results are presented as odds ratios (ORs) with corresponding 95% confidence intervals (CIs). Model 1 was unadjusted. Model 2 was adjusted for age and gender. Model 3 was additionally adjusted for HbA1c, diabetes duration, estimated glomerular filtration rate (eGFR), HDL-C, LDL-C, hypertension, hyperlipidemia, coronary heart disease, smoking status, and alcohol consumption. Covariate selection was based on clinical relevance, existing literature, or a ≥ 10% change in the effect estimate when added to the model (6). In addition, restricted cubic spline (RCS) regression was performed with 3 knots at the 10th, 50th, 90th percentiles to assess potential nonlinear relationship between the TyG index and hyperuricemia after adjusting variables in Model 3.
Stratified analyses were performed to investigate the relationship between the TyG index and hyperuricemia and their interaction in different subgroups, with adjustments for corresponding confounding factors. Mediation analysis was used to evaluate whether BMI is associated with the link between the TyG index and hyperuricemia. Three distinct statistical models were employed to evaluate the adjusted mediation effect. Mediation analysis was performed using the bootstrap method with 1,000 resamples to estimate total, direct, and indirect effects and to calculate the proportion mediated (PM). A mediation effect was considered statistically significant if the 95% CI of the β coefficient did not include zero (27). Given the cross-sectional design of this study, causal relationships inferred from the mediation analysis should be interpreted with caution. Statistical significance was defined as a two-tailed P-value <0.05. All analyses were performed using SPSS software (Version 25.0), EmpowerStats, and statistical package R (Version 4.2.0). Mediation analysis was conducted in R using the mediation package (28).
3 Results
3.1 Participants’ characteristics by hyperuricemia
The characteristics of the participants are presented in Table 1. A total of 1159 patients with T2DM (701 males and 458 females) were enrolled in the final study, among whom 356 patients (30.7%) were diagnosed with hyperuricemia. Compared to patients without hyperuricemia, those with hyperuricemia were more likely to be younger (P = 0.003). However, no significant gender difference was observed (P = 0.062). Patients with hyperuricemia exhibited higher weight, BMI, elevated triglyceride, total cholesterol levels, along with reduced high-density lipoprotein cholesterol (all P<0.001). Additionally, they had lower estimated glomerular filtration rates (eGFR), markedly elevated serum uric acid (457.76 ± 65.90 vs. 309.47 ± 57.86 μmol/L; P < 0.001), higher prevalence of hypertension and hyperlipidemia, and longer diabetes duration (all P < 0.05). The TyG index was also significantly higher in patients with hyperuricemia than in those without (9.37 ± 0.77 vs. 9.06 ± 0.75, P<0.001). However, no significant differences were found in height, systolic blood pressure, diastolic blood pressure, fasting blood glucose, HbA1c, LDL-C, coronary heart disease status, smoking status, or alcohol consumption between groups.
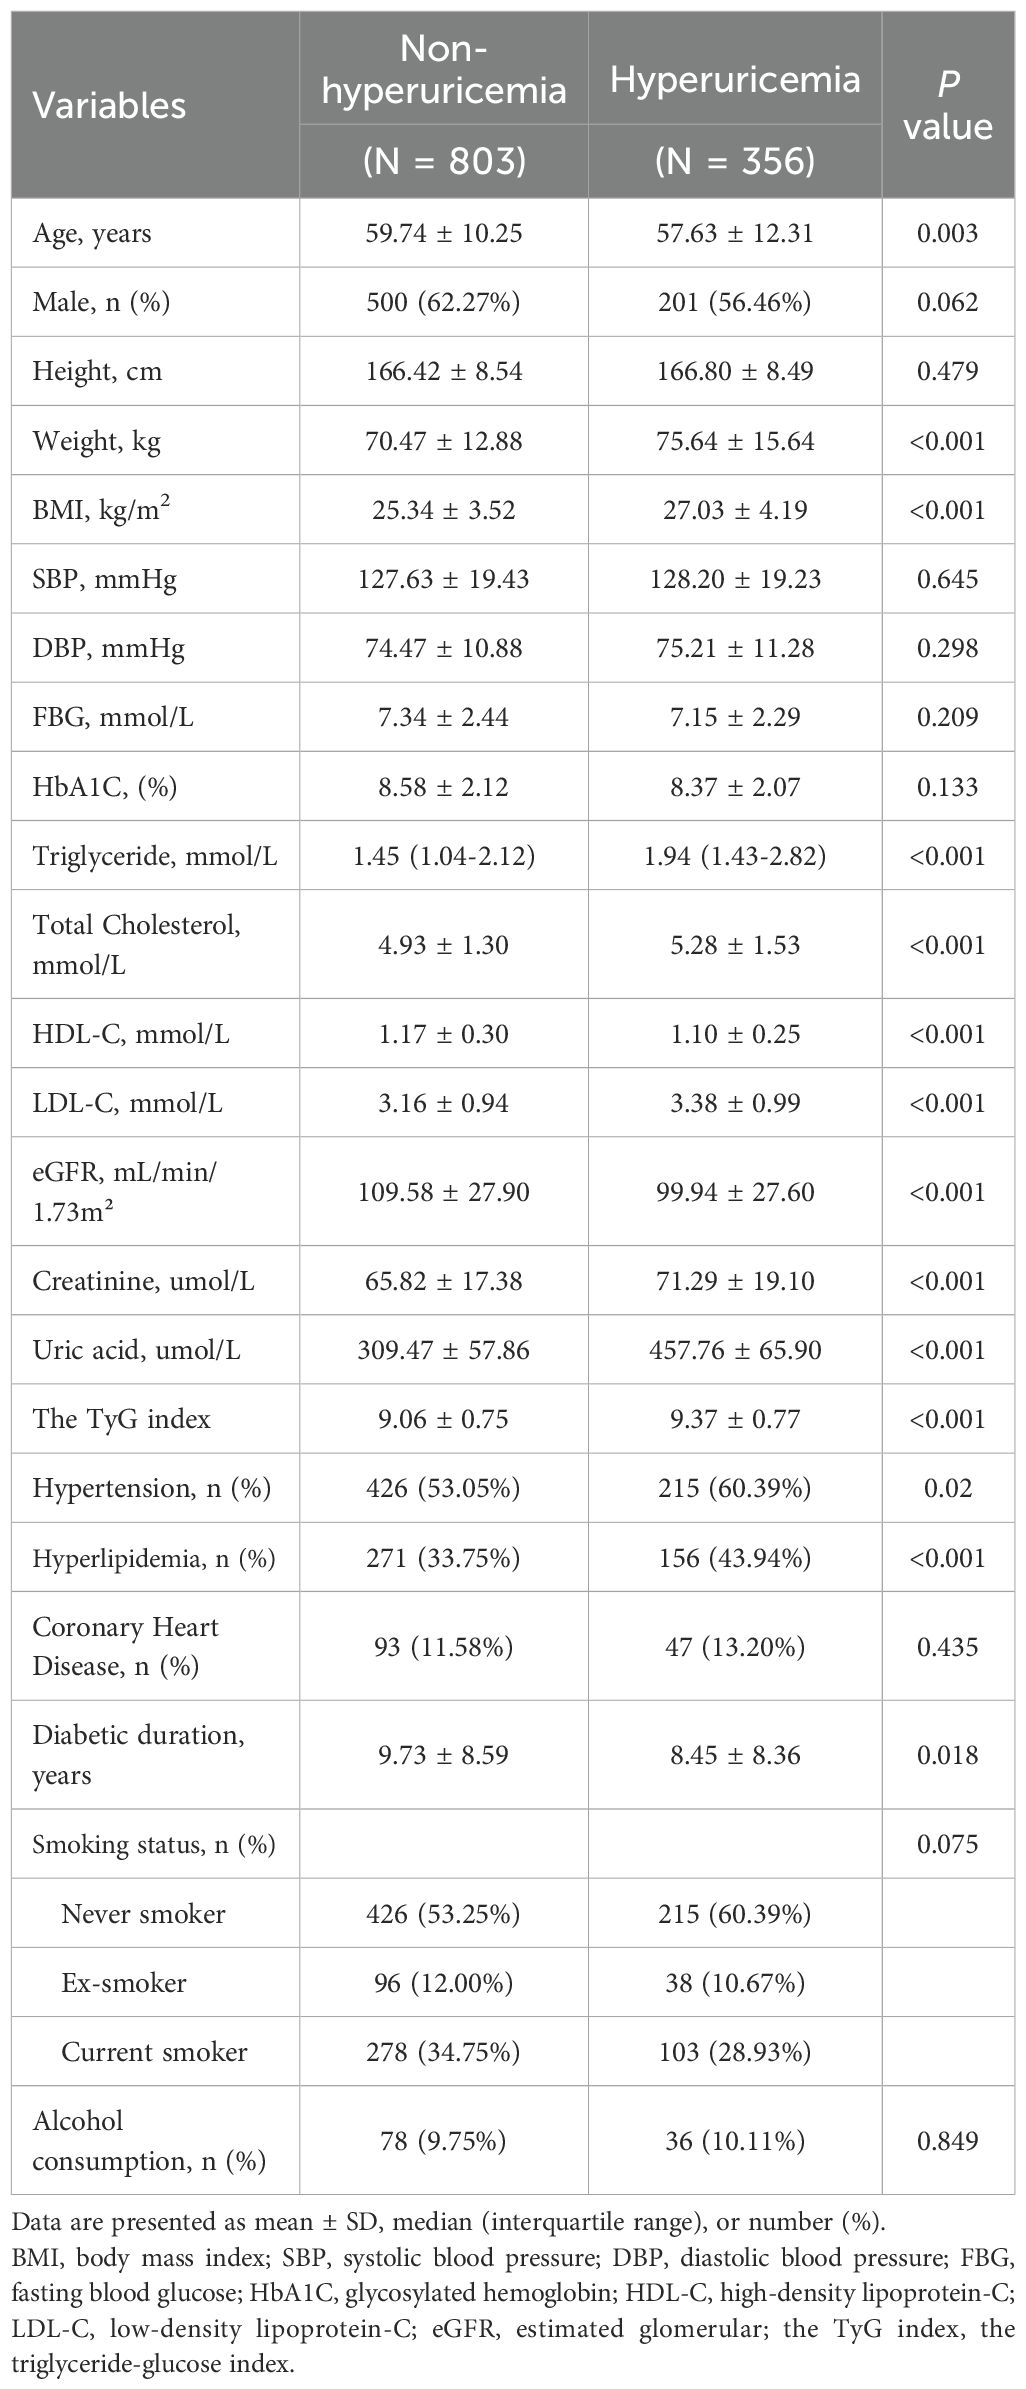
Table 1. Clinical characteristics of participants by hyperuricemia.
3.2 Association between TyG and BMI with hyperuricemia
The univariate and multivariable regression models are shown in Table 2. In the unadjusted model (Model 1), each unit increase in the TyG index was associated with a 1.67-fold increase of hyperuricemia (95% CI: 1.42-1.97; P < 0.001). When the TyG index was categorized into tertiles, the odds of hyperuricemia were significantly higher in the second (OR = 2.21, 95% CI: 1.59–3.08, P < 0.001) and third tertiles (OR = 2.67, 95% CI: 1.93–3.70, P < 0.001) compared with the first tertile. The association remained significant in multivariable logistic regression models after adjusting for potential confounders. After adjusting for age, gender, HbA1c, diabetes duration, eGFR, HDL-C, LDL-C, hypertension, hyperlipidemia, coronary heart disease, smoking status, and alcohol consumption in model 3, each one-unit increase in the TyG index was associated with an OR of 1.36 (95% CI: 1.10-1.68; P = 0.005) for hyperuricemia. Similarly, the adjusted ORs were 1.64 (95% CI: 1.15–2.35; P = 0.006) for the second TyG tertile and 1.75 (95% CI: 1.19–2.56; P = 0.004) for the third tertile, compared with the first tertile (P for trend <0.01).Accordingly, the relationship between the TyG index and hyperuricemia appeared to be approximately linear in RCS (P for nonlinearity = 0.123, Supplementary Figure S1).
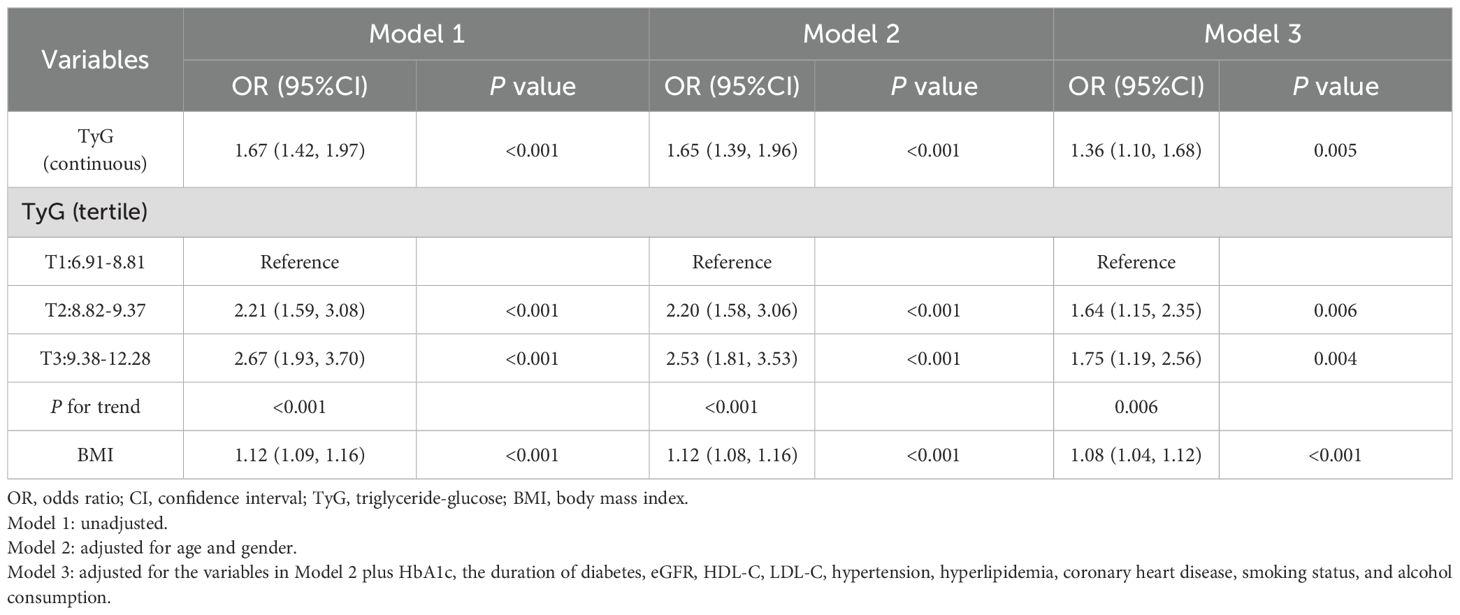
Table 2. Association between the triglyceride-glucose index and BMI with hyperuricemia.
The correlation between BMI and hyperuricemia was also rigorously analyzed (Table 2). In the crude model (Model 1), each one-unit increase in BMI was associated with a 12% increased risk of hyperuricemia (OR = 1.12, 95% CI: 1.09–1.16, P<0.001). After adjusting for age and gender, Model 2 confirmed similar findings (OR = 1.12, 95% CI: 1.08–1.16, P<0.001). With further adjustment for potential confounders in Model 3, the risk slightly declined but remained significant (OR = 1.08, 95% CI: 1.04–1.12, P<0.001).
3.3 Association between TyG and BMI
Table 3 presents the results of the multivariable linear regression analysis examining the association between the TyG index and BMI. In the unadjusted model (Model 1), the TyG index showed a positive association with BMI (β=1.62, 95% CI: 1.35–1.89, P < 0.001). After adjustment for age and sex in Model 2, the association remained significant (β=1.31, 95% CI: 1.03–1.58, P < 0.001). Further adjustment in model 3 for additional covariates, including HbA1c, diabetes duration, eGFR, HDL-C, LDL-C, hypertension, hyperlipidemia, coronary heart disease, smoking status, and alcohol consumption attenuated the strength of the association, but it remained statistically significant (β=0.95, 95% CI: 0.63–1.26, P < 0.001).
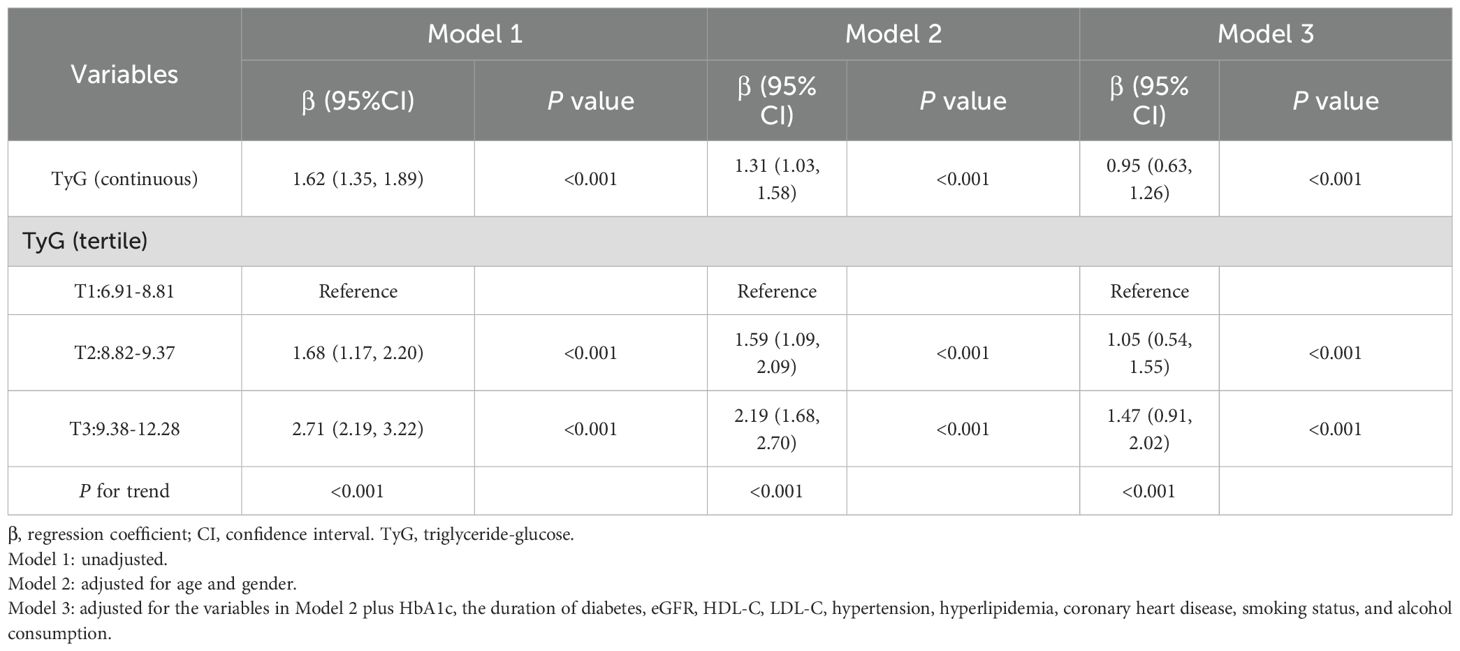
Table 3. The association between the triglyceride-glucose index and BMI.
To ensure the robustness of the results, we further categorized the TyG index into tertiles. Compared with the lowest tertile, the highest tertile of the TyG index was associated with a higher BMI (β=1.47, 95% CI: 0.91–2.02, P < 0.001). Moreover, a significant dose-response relationship was observed (P for trend <0.001).
3.4 Subgroup analyses
Stratified analyses were performed to explore the robustness of the association between the TyG index and hyperuricemia, as shown in Figure 1. We found a positive association between the TyG index and hyperuricemia across subgroups defined by age, gender, hypertension status, hyperlipidemia, smoking status and alcohol consumption.
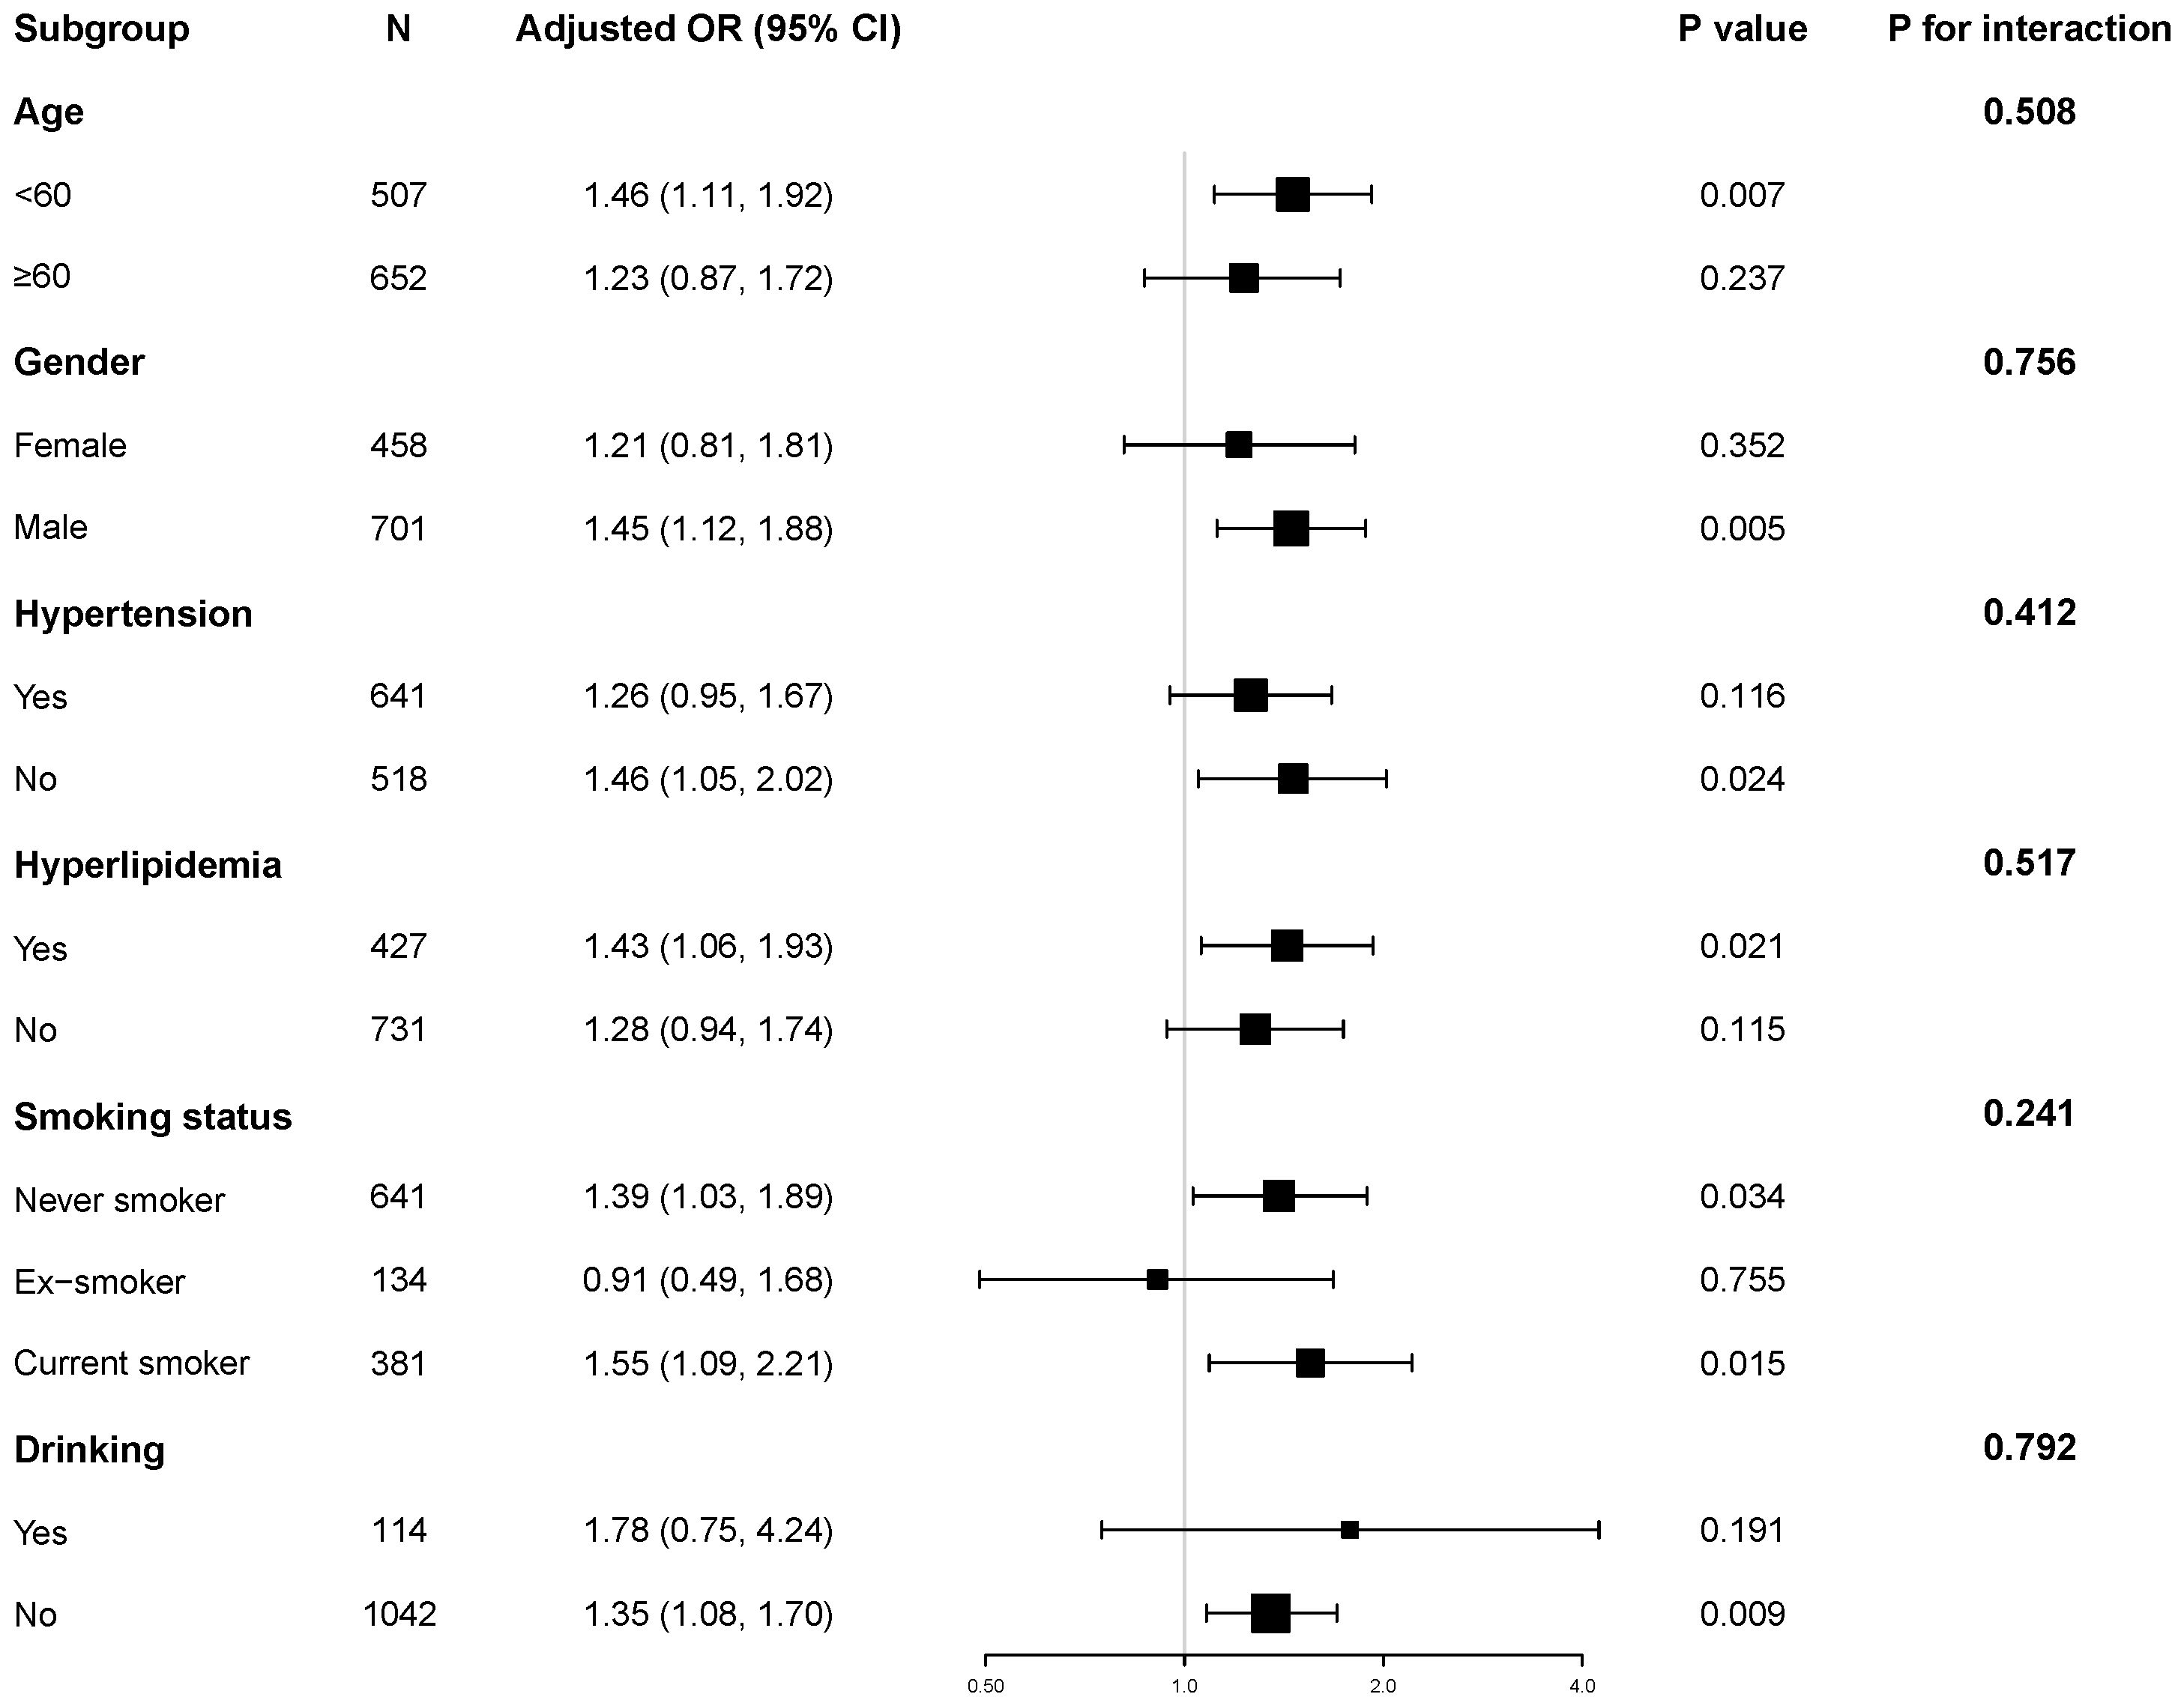
Figure 1. Subgroup and interaction analyses of the TyG index and hyperuricemia. Adjusted for age, gender, HbA1c, the duration of diabetes, eGFR, HDL-C, LDL-C, hypertension, hyperlipidemia, coronary heart disease, smoking status, and alcohol consumption.
Notably, we observed no significant interaction effects among these subgroups (all P for interaction > 0.05). These results support the independent and robust correlation between TyG and hyperuricemia across all subgroups.
3.5 Mediation analyses
Mediation analysis was conducted to assess the relationship of BMI with the TyG index and hyperuricemia (Table 4, Figure 2). The total effect of the TyG index on hyperuricemia was statistically significant across all three models. The indirect effect through BMI was also significant, accounting for approximately 20.0% to 27.9% of the total effect, indicating a meaningful mediation role of BMI. Even after adjusting for multiple potential confounders, including age, gender, HbA1c, diabetes duration, eGFR, HDL-C, LDL-C, hypertension, hyperlipidemia, coronary heart disease, smoking status, and alcohol consumption, both the direct and indirect effects remained statistically significant. These findings are consistent with a potential role of BMI in the relationship between the TyG index and hyperuricemia.
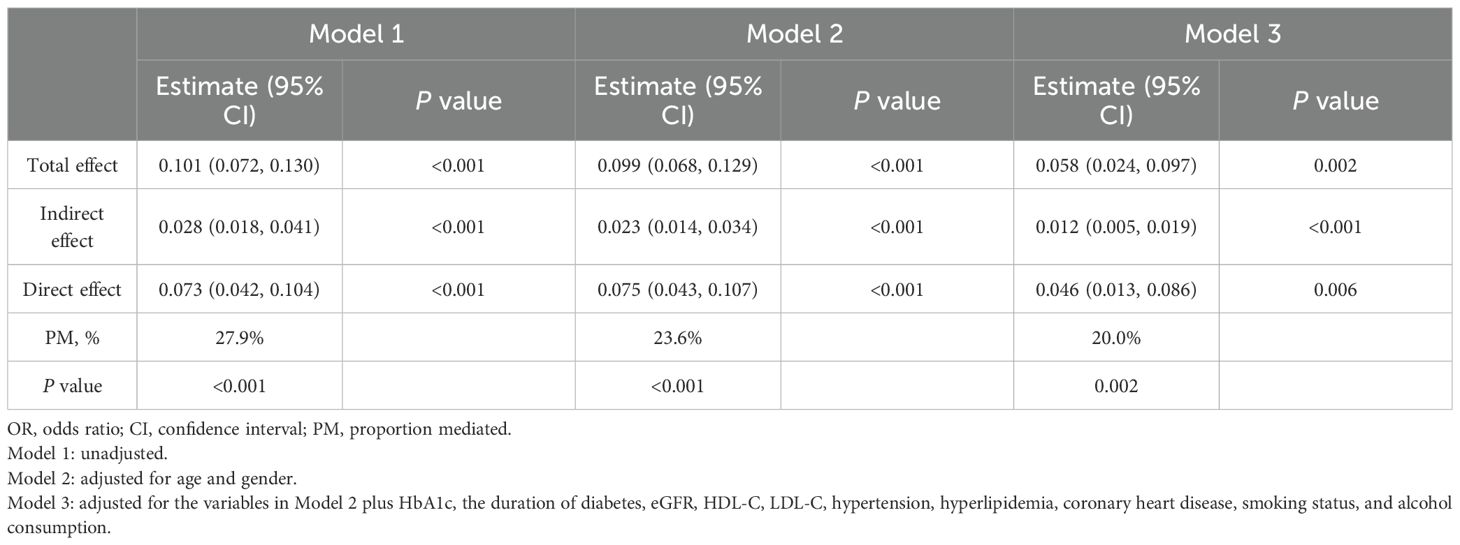
Table 4. Mediation analysis of the association between the triglyceride-glucose index and hyperuricemia mediated by BMI.
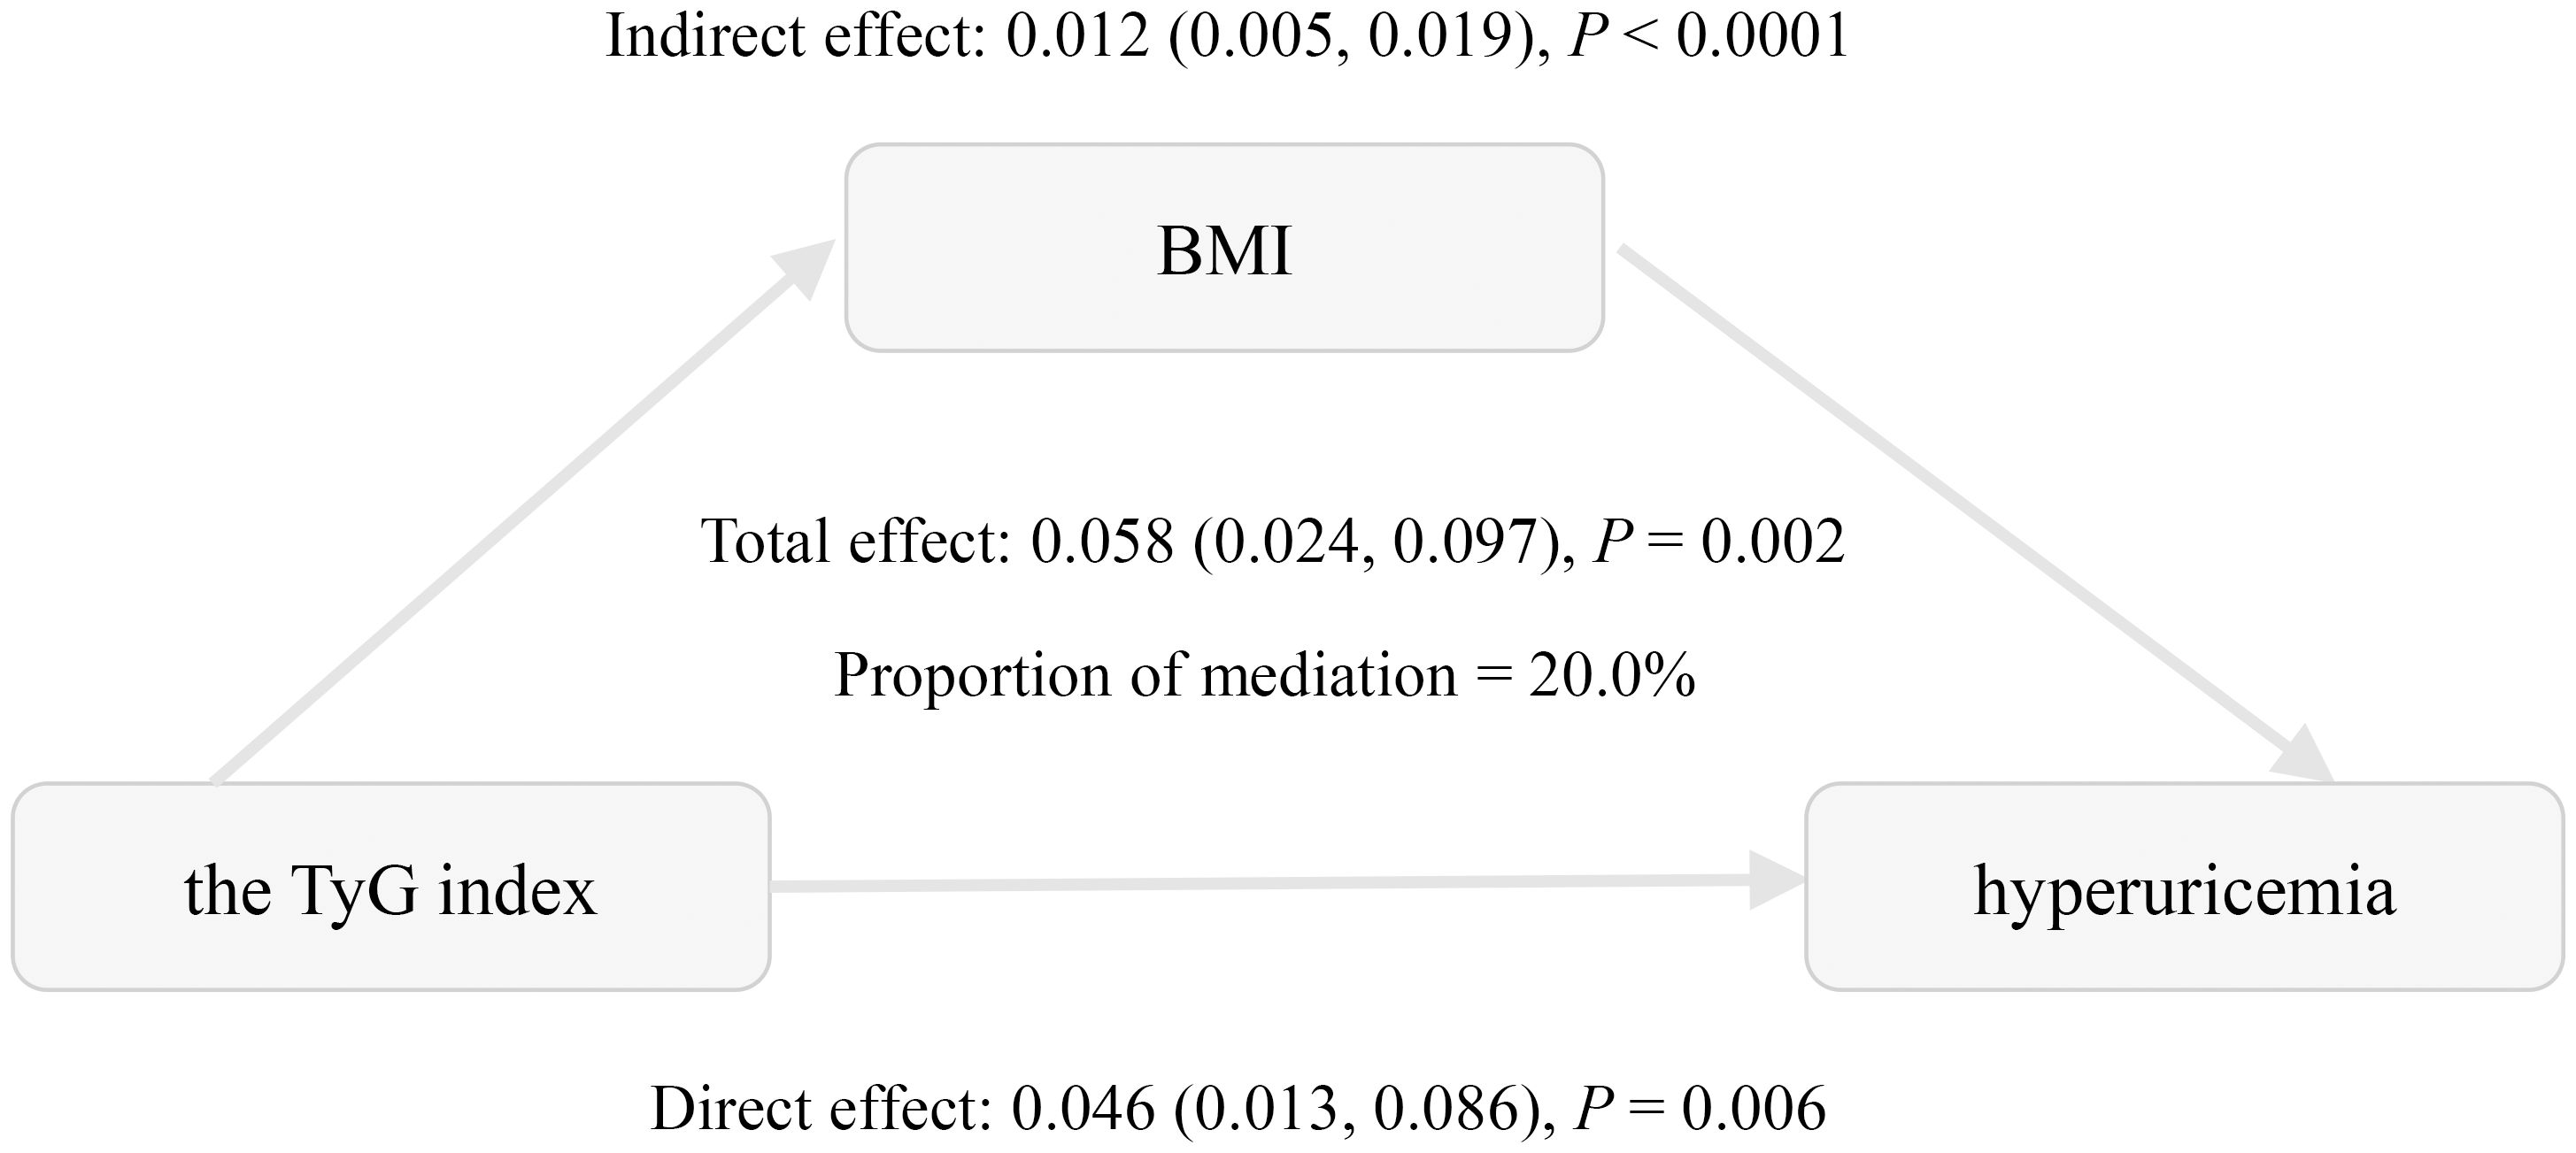
Figure 2. Mediation effect of BMI in the association between the triglyceride-glucose index and hyperuricemia. Adjusted for age, gender, HbA1c, the duration of diabetes, eGFR, HDL-C, LDL-C, hypertension, hyperlipidemia, coronary heart disease, smoking status, and alcohol consumption.
4 Discussion
This study explored the relationships between insulin resistance, obesity, and hyperuricemia in the context of T2DM. We demonstrated significant positive associations between the TyG index, BMI, and hyperuricemia in Chinese patients with T2DM. These associations remained significant after adjusting for confounding factors. Subgroup analyses further confirmed the consistent relationship between the TyG index and hyperuricemia. Notably, mediation analysis reveals that BMI accounts for 20.0% of this association, suggesting that obesity may be involved in this relationship.
A recent systematic review and meta-analysis reported a pooled hyperuricemia prevalence of 27.28% among African individuals with T2DM, with regional variations ranging from 24.72% in North Africa to 33.72% in Central Africa (10). Similar regional differences exist in China. A previous study in Southwest China revealed a prevalence rate of 21.24% in diabetic patients (11), whereas another research in Urumqi reported a notably lower prevalence of 12.6% (29). In our research, 30.7% of individuals with type 2 diabetes were found to have hyperuricemia. These variations may reflect differences in genetic profiles, dietary habits, lifestyle choices, and environmental exposures across regions. While most epidemiological studies report higher hyperuricemia prevalence in males, our findings showed no significant sex difference. This contradicts established phenomenon where premenopausal women typically exhibit lower uric acid levels due to estrogen’s protective effect. Notably, in our study, the female participants had a median age of 63 years (interquartile range [IQR]: 57-67), suggesting that the majority were likely postmenopausal and had lost the protective effect of estrogen. Consequently, their serum uric acid levels progressively elevated, approximating those observed in males (30–32).
Accumulating evidence establishes a significant association between the TyG index and hyperuricemia. Shi et al. revealed a linear relationship between TyG and hyperuricemia in the general Chinese population, with each SD increase in TyG corresponding to a 54.1% higher risk of hyperuricemia (17). Recently, Qiu et al. further demonstrated a positive, reverse U-shaped association in U.S. adults, suggesting a complex relationship that may be influenced by geographic and ethnic factors (4). Moreover, several studies have confirmed this association in hypertensive populations (18, 19). However, evidence specific to diabetic populations remains limited (12). Consistent with prior studies, our research confirmed a positive and linear association in the Chinese diabetic population. Subgroup analyses and interaction tests further demonstrated its consistency across diverse patient subgroups. So far, the role of obesity as a mediator between the TyG index and hyperuricemia has not been thoroughly investigated. A cross-sectional analysis of the National Health and Nutrition Examination Survey (NHANES) revealed that BMI mediated 46.8% of this association in the general U.S. population (33). In contrast, a study conducted among middle-aged and elderly hypertensive individuals in China found that BMI mediated only 8.9% of this association (34). Notably, our study revealed a mediation proportion of 20.0% for the association between the TyG index and hyperuricemia in patients with T2DM, a proportion intermediate between the 46.8% reported in the general U.S. population and the 8.9% observed in middle-aged and elderly Chinese hypertensive patients. These discrepancies may arise from metabolic characteristics in a specific population. Ethnic differences in susceptibility to insulin resistance may also contribute to the heterogeneity in the mediation effect of BMI across populations (35). Additionally, unmeasured confounders and methodological differences may also contribute to the observed heterogeneity. To the best of our knowledge, this is the first study to investigate the mediating effect of BMI on the association between the TyG index and hyperuricemia in a diabetic population.
The mechanisms behind this observation are not yet clearly established, but several potential biological mechanisms may account for this observation. The TyG index, derived from triglycerides and fasting blood glucose levels, reflects dysregulated lipid and glucose metabolism, both implicated in hyperuricemia pathogenesis (15, 16). Animal studies suggest IR exacerbates hyperuricemia primarily through enhancing urate reabsorption via increased expression of urate transporter 1 (URAT1) and glucose transporter 9 (GLUT9), elevating serum uric acid levels (36, 37). Obesity, as a key component of metabolic syndrome, promotes free fatty acid (FFA) release, further enhancing insulin resistance and urate transporters expression (33, 37, 38). Adipocytes secrete inflammatory factors such as TNF-α and IL-6, as well as adipokines like leptin, adiponectin, and resistin. These substances contribute to insulin resistance and induce a chronic low-grade inflammatory state, thereby damaging the kidneys (39, 40). This may ultimately impair uric acid excretion and elevate uric acid levels.
The study has several limitations. Firstly, because TyG, BMI, and SUA were measured simultaneously, temporality cannot be established and causal inference is not possible. Our mediation analysis revealed indirect associations consistent with a potential pathway from TyG through BMI to hyperuricemia, but alternative or reverse pathways, such as hyperuricemia leading to insulin resistance (41), are biologically plausible. These findings are exploratory and hypothesis-generating, and require confirmation in future longitudinal or interventional studies. Secondly, residual and unmeasured confounding may exist, including dietary intake, certain medications, and renal factors beyond eGFR, and potential bias from self-reported variables such as smoking, alcohol consumption, and medical history. Additionally, both TyG and hyperuricemia were measured from the same blood sample, introducing a shared-source bias that may inflate the observed association. Results should be interpreted with caution. Thirdly, consecutive inpatients may represent a population with more severe or poorly controlled diabetes, and as a single-center study of Chinese patients, caution is needed when generalizing these findings.
5 Conclusions
In this cross-sectional study of Chinese patients with T2DM, both the TyG index and BMI were independently associated with hyperuricemia. The observed associations were consistent with a possible indirect link through BMI, but causal mediation cannot be established due to the study design. These findings suggest that obesity may partly explain the relationship between insulin resistance reflected by the TyG index and hyperuricemia. Weight management and lifestyle interventions targeting both insulin resistance and obesity may therefore have potential clinical value in reducing hyperuricemia risk in this population. Future longitudinal studies with prospective follow-up and external validation are needed to clarify whether integrating insulin resistance and obesity into multivariable models can improve risk stratification for hyperuricemia in patients with type 2 diabetes.
Data availability statement
The raw data supporting the conclusions of this article will be made available by the authors, without undue reservation.
Ethics statement
The studies involving humans were approved by the Ethics Committee of RuiJin Hospital Lu Wan Branch, Shanghai Jiaotong University School of Medicine. The studies were conducted in accordance with the local legislation and institutional requirements. The participants provided their written informed consent to participate in this study.
Author contributions
DT: Writing – original draft, Methodology, Project administration, Conceptualization, Funding acquisition. XG: Methodology, Software, Writing – review & editing, Conceptualization, Funding acquisition. YX: Data curation, Supervision, Investigation, Methodology, Writing – review & editing. FZ: Formal Analysis, Software, Data curation, Writing – review & editing, Methodology. YS: Supervision, Conceptualization, Writing – review & editing, Project administration. LL: Conceptualization, Resources, Writing – review & editing, Supervision.
Funding
The author(s) declare financial support was received for the research and/or publication of this article. This work was supported by grants from the Shanghai Huangpu District Health Commission (Grant No. HLM202206, HLM202401, HLQ202205).
Acknowledgments
The authors thank all colleagues in the Department of Endocrinology of RuiJin Hospital Lu Wan Branch, Shanghai Jiaotong University School of Medicine for their contributions to this work.
Conflict of interest
The authors declare that the research was conducted in the absence of any commercial or financial relationships that could be construed as a potential conflict of interest.
Generative AI statement
The author(s) declare that no Generative AI was used in the creation of this manuscript.
Any alternative text (alt text) provided alongside figures in this article has been generated by Frontiers with the support of artificial intelligence and reasonable efforts have been made to ensure accuracy, including review by the authors wherever possible. If you identify any issues, please contact us.
Publisher’s note
All claims expressed in this article are solely those of the authors and do not necessarily represent those of their affiliated organizations, or those of the publisher, the editors and the reviewers. Any product that may be evaluated in this article, or claim that may be made by its manufacturer, is not guaranteed or endorsed by the publisher.
Supplementary material
The Supplementary Material for this article can be found online at: https://www.frontiersin.org/articles/10.3389/fendo.2025.1637543/full#supplementary-material
References
1. Crawley WT, Jungels CG, Stenmark KR, and Fini MA. U-shaped association of uric acid to overall-cause mortality and its impact on clinical management of hyperuricemia. Redox Biol. (2022) 51:102271. doi: 10.1016/j.redox.2022.102271
2. Li Y, Shen Z, Zhu B, Zhang H, Zhang X, and Ding X. Demographic, regional and temporal trends of hyperuricemia epidemics in mainland China from 2000 to 2019: a systematic review and meta-analysis. Glob Health Action. (2021) 14:1874652. doi: 10.1080/16549716.2021.1874652
3. Zhang M, Zhu X, Wu J, Huang Z, Zhao Z, Zhang X, et al. Prevalence of hyperuricemia among chinese adults: findings from two nationally representative cross-sectional surveys in 2015–16 and 2018–19. Front Immunol. (2022) 12:791983. doi: 10.3389/fimmu.2021.791983
4. Qiu L, Ren Y, Li J, Li M, Li W, Qin L, et al. Nonlinear association of triglyceride-glucose index with hyperuricemia in US adults: a cross-sectional study. Lipids Health Dis. (2024) 23:145. doi: 10.1186/s12944-024-02146-5
5. Chang J-B, Chen Y-L, Hung Y-J, Hsieh C-H, Lee C-H, Pei D, et al. The role of uric acid for predicting future metabolic syndrome and type 2 diabetes in older people. J Nutr Health Aging. (2017) 21:329–35. doi: 10.1007/s12603-016-0749-3
6. Kernan WN, Viscoli CM, Brass LM, Broderick JP, Brott T, Feldmann E, et al. Phenylpropanolamine and the risk of hemorrhagic stroke. N Engl J Med. (2000) 343:1826–32. doi: 10.1056/NEJM200012213432501
7. Du L, Zong Y, Li H, Wang Q, Xie L, Yang B, et al. Hyperuricemia and its related diseases: mechanisms and advances in therapy. Signal Transduct Target Ther. (2024) 9:212. doi: 10.1038/s41392-024-01916-y
8. Song S, Cai X, Hu J, Zhu Q, Shen D, Ma H, et al. Plasma aldosterone concentrations elevation in hypertensive patients: the dual impact on hyperuricemia and gout. Front Endocrinol. (2024) 15:1424207. doi: 10.3389/fendo.2024.1424207
9. Abujbara M, Al Hourani HM, Al-Raoush RI, Khader YS, and Ajlouni K. Prevalence of hyperuricemia and associated factors among type 2 diabetic patients in Jordan. Int J Gen Med. (2022) 15:6611–9. doi: 10.2147/IJGM.S376857
10. Alemayehu E, Fiseha T, Bambo GM, Sahile Kebede S, Bisetegn H, Tilahun M, et al. Prevalence of hyperuricemia among type 2 diabetes mellitus patients in Africa: a systematic review and meta-analysis. BMC Endocr Disord. (2023) 23:153. doi: 10.1186/s12902-023-01408-0
11. Sun S, Chen L, Chen D, Li Y, Liu G, Ma L, et al. Prevalence and associated factors of hyperuricemia among Chinese patients with diabetes: a cross-sectional study. Ther Adv Endocrinol Metab. (2023) 14:20420188231198620. doi: 10.1177/20420188231198620
12. Han R, Zhang Y, and Jiang X. Relationship between four non-insulin-based indexes of insulin resistance and serum uric acid in patients with type 2 diabetes: a cross-sectional study. Diabetes Metab Syndr Obes. (2022) 15:1461–71. doi: 10.2147/DMSO.S362248
13. Lee D-H, Park JE, Kim SY, Jeon HJ, and Park J-H. Association between the triglyceride-glucose (TyG) index and increased blood pressure in normotensive subjects: a population-based study. Diabetol Metab Syndrome. (2022) 14:161. doi: 10.1186/s13098-022-00927-5
14. Sun Y, Ji H, Sun W, An X, and Lian F. Triglyceride glucose (TyG) index: A promising biomarker for diagnosis and treatment of different diseases. Eur J Internal Med. (2025) 131:3–14. doi: 10.1016/j.ejim.2024.08.026
15. Cui N, Cui J, Sun J, Xu X, Aslam B, Bai L, et al. Triglycerides and total cholesterol concentrations in association with hyperuricemia in chinese adults in qingdao, China. Risk Manag Healthc Policy. (2020) 13:165–73. doi: 10.2147/RMHP.S243381
16. Li H, Zha X, Zhu Y, Liu M, Guo R, and Wen Y. An invert U-shaped curve: relationship between fasting plasma glucose and serum uric acid concentration in a large health check-up population in China. Med (Baltimore). (2016) 95:e3456. doi: 10.1097/MD.0000000000003456
17. Shi W, Xing L, Jing L, Tian Y, and Liu S. Usefulness of triglyceride-glucose index for estimating hyperuricemia risk: insights from a general population. Postgrad Med. (2019) 131:348–56. doi: 10.1080/00325481.2019.1624581
18. Yu C, Wang T, Zhou W, Zhu L, Huang X, Bao H, et al. Positive association between the triglyceride-glucose index and hyperuricemia in chinese adults with hypertension: an insight from the China H-type hypertension registry study. Int J Endocrinol. (2022) 2022:4272715. doi: 10.1155/2022/4272715
19. Liu S, Zhou Z, Wu M, Zhang H, and Xiao Y. Association between the triglyceride glucose index and hyperuricemia in patients with primary hypertension: a cross-sectional study. Int J Endocrinol. (2023) 2023:5582306. doi: 10.1155/2023/5582306
20. Bae J, Park K-Y, Son S, Huh Y, and Nam GE. Associations between obesity parameters and hyperuricemia by sex, age, and diabetes mellitus: A nationwide study in Korea. Obes Res Clin Pract. (2023) 17:405–10. doi: 10.1016/j.orcp.2023.09.007
21. Choi HK, McCormick N, Lu N, Rai SK, Yokose C, and Zhang Y. Population impact attributable to modifiable risk factors for hyperuricemia. Arthritis Rheumatol. (2020) 72:157–65. doi: 10.1002/art.41067
22. Mao T, He Q, Yang J, Jia L, and Xu G. Relationship between gout, hyperuricemia, and obesity-does central obesity play a significant role?-a study based on the NHANES database. Diabetol Metab Syndr. (2024) 16:24. doi: 10.1186/s13098-024-01268-1
23. Sergi D, Spaggiari R, Dalla Nora E, Angelini S, Castaldo F, Omenetto A, et al. HOMA-IR and TyG index differ for their relationship with dietary, anthropometric, inflammatory factors and capacity to predict cardiovascular risk. Diabetes Res Clin Pract. (2025) 222:112103. doi: 10.1016/j.diabres.2025.112103
24. Moazzeni SS, Arani RH, Hasheminia M, Tohidi M, Azizi F, and Hadaegh F. High incidence of chronic kidney disease among Iranian diabetic adults: using CKD-EPI and MDRD equations for estimated glomerular filtration rate. Diabetes Metab J. (2021) 45:684–97. doi: 10.4093/dmj.2020.0109
25. Huo R, Liao Q, Zhai L, You X, and Zuo Y. Interacting and joint effects of triglyceride-glucose index (TyG) and body mass index on stroke risk and the mediating role of TyG in middle-aged and older Chinese adults: a nationwide prospective cohort study. Cardiovasc Diabetol. (2024) 23:30. doi: 10.1186/s12933-024-02122-4
26. Zhang Y, Zhang M, Yu X, Wei F, Chen C, Zhang K, et al. Association of hypertension and hypertriglyceridemia on incident hyperuricemia: an 8-year prospective cohort study. J Transl Med. (2020) 18:409. doi: 10.1186/s12967-020-02590-8
27. Wang Y, Li Y, Liu K, Han X, Dong Y, Wang X, et al. Nonalcoholic fatty liver disease, serum cytokines, and dementia among rural-dwelling older adults in China: A population-based study. Eur J Neurol. (2022) 29:2612–21. doi: 10.1111/ene.15416
28. Imai K, Keele L, and Tingley D. A general approach to causal mediation analysis. psychol Methods. (2010) 15:309–34. doi: 10.1037/a0020761
29. Abudureyimu P, Pang Y, Huang L, Luo Q, Zhang X, Xu Y, et al. A predictive model for hyperuricemia among type 2 diabetes mellitus patients in Urumqi, China. BMC Public Health. (2023) 23:1740. doi: 10.1186/s12889-023-16669-6
30. Hak AE and Choi HK. Menopause, postmenopausal hormone use and serum uric acid levels in US women – The Third National Health and Nutrition Examination Survey. Arthritis Res Ther. (2008) 10:R116. doi: 10.1186/ar2519
31. Cho SK, Winkler CA, Lee S-J, Chang Y, and Ryu S. The prevalence of hyperuricemia sharply increases from the late menopausal transition stage in middle-aged women. J Clin Med. (2019) 8:296. doi: 10.3390/jcm8030296
32. Kuo C-F, Grainge MJ, Zhang W, and Doherty M. Global epidemiology of gout: prevalence, incidence and risk factors. Nat Rev Rheumatol. (2015) 11:649–62. doi: 10.1038/nrrheum.2015.91
33. Mazidi M, Katsiki N, Mikhailidis DP, and Banach M. The link between insulin resistance parameters and serum uric acid is mediated by adiposity. Atherosclerosis. (2018) 270:180–6. doi: 10.1016/j.atherosclerosis.2017.12.033
34. Sun J, Sun M, Su Y, Li M, Ma S, Zhang Y, et al. Mediation effect of obesity on the association between triglyceride-glucose index and hyperuricemia in Chinese hypertension adults. J Clin Hypertens (Greenwich). (2022) 24:47–57. doi: 10.1111/jch.14405
35. Tay J, Goss AM, Garvey WT, Lockhart ME, Bush NC, Quon MJ, et al. Race affects the association of obesity measures with insulin sensitivity. Am J Clin Nutr. (2020) 111:515–25. doi: 10.1093/ajcn/nqz309
36. Miao Z, Yan S, Wang J, Wang B, Li Y, Xing X, et al. Insulin resistance acts as an independent risk factor exacerbating high-purine diet induced renal injury and knee joint gouty lesions. Inflammation Res. (2009) 58:659–68. doi: 10.1007/s00011-009-0031-9
37. Yanai H, Adachi H, Hakoshima M, and Katsuyama H. Molecular biological and clinical understanding of the pathophysiology and treatments of hyperuricemia and its association with metabolic syndrome, cardiovascular diseases and chronic kidney disease. Int J Mol Sci. (2021) 22:9221. doi: 10.3390/ijms22179221
38. Boden G. Obesity, insulin resistance and free fatty acids. Curr Opin Endocrinol Diabetes Obes. (2011) 18:139–43. doi: 10.1097/MED.0b013e3283444b09
39. Lubawy M and Formanowicz D. Insulin resistance and urolithiasis as a challenge for a dietitian. Int J Environ Res Public Health. (2022) 19:7160. doi: 10.3390/ijerph19127160
40. Arabi T, Shafqat A, Sabbah BN, Fawzy NA, Shah H, Abdulkader H, et al. Obesity-related kidney disease: beyond hypertension and insulin-resistance. Front Endocrinol. (2023) 13:1095211. doi: 10.3389/fendo.2022.1095211
Keywords: the TyG index, hyperuricemia, BMI, mediation analysis, type 2 diabetes mellitus
Citation: Tang D, Gu X, Xuan Y, Zhu F, Shen Y and Lu L (2025) Association between the triglyceride-glucose index and hyperuricemia: potential role of obesity in patients with Type 2 diabetes mellitus. Front. Endocrinol. 16:1637543. doi: 10.3389/fendo.2025.1637543
Received: 29 May 2025; Accepted: 22 September 2025;
Published: 02 October 2025.
Edited by:
Caterina Pipino, University of Studies G. d’Annunzio Chieti and Pescara, ItalyReviewed by:
Mostafa Waly, Sultan Qaboos University, OmanXintian Cai, Sichuan Academy of Medical Sciences and Sichuan Provincial People’s Hospital, China
Copyright © 2025 Tang, Gu, Xuan, Zhu, Shen and Lu. This is an open-access article distributed under the terms of the Creative Commons Attribution License (CC BY). The use, distribution or reproduction in other forums is permitted, provided the original author(s) and the copyright owner(s) are credited and that the original publication in this journal is cited, in accordance with accepted academic practice. No use, distribution or reproduction is permitted which does not comply with these terms.
*Correspondence: Leiqun Lu, bGxxbHp5MUAxNjMuY29t
†These authors have contributed equally to this work