 Balys Remigijus Zaliunas1
 Enrika Pileckaite2*Monika Duseikaite2*Jurgita Makstiene3Lina Poskiene3
 Vita Rovite4Sheng-Nan Wu5Arimantas Tamasauskas6Rasa Liutkeviciene2
- 1Medical Academy, Lithuanian University of Health Sciences, Kaunas, Lithuania
- 2Laboratory of Ophthalmology, Institute of Neuroscience, Lithuanian University of Health Sciences, Kaunas, Lithuania
- 3Department of Pathology, Lithuanian University of Health Sciences, Kaunas, Lithuania
- 4Latvian Biomedical Research and Study Centre, Riga, Latvia
- 5Department of Neurology, National Cheng Kung University Hospital, Tainan, Taiwan
- 6Department of Neurosurgery, Hospital of Lithuanian University of Health Sciences, Kaunas Clinics, Kaunas, Lithuania
Aim: This study aimed to determine the associations of MEG3 rs7158663, rs4081134 gene variants, as well as the immunohistochemical markers Ki-67, p53, and CK18, with the clinical features of pituitary neuroendocrine tumors (PitNETs).
Methods: This case-control study included 340 individuals who were divided into two groups: a control group (n=220) and a PitNETgroup (n=120). DNA was isolated from the venous blood of study participants by the leukocyte salt precipitation method. Real-time polymerase chain reaction was used for the MEG3 rs7158663, rs4081134 single nucleotide variants genotyping. Immunohistochemical analysis of Ki-67 labeling index and p53 protein biomarkers was performed using the automated Ventana BenchMark ULTRA PLUS staining system, following the manufacturer’s recommendations. CK18 immunostaining was conducted with the Dako Omnis staining system, following the manufacturer’s recommendations. Monoclonal antibodies SP6, DO-7, and DC-10 were used to detect Ki-67 labeling index, p53, and CK18, respectively. Statistical data analysis was performed using the “IBM SPSS Statistics 30.0” program.
Results: Genotype and allele frequencies of MEG3 rs7158663 and rs4081134 variants showed no significant differences between healthy controls and PitNET patient groups. Additionally, no associations were found between either MEG3 variants and PitNET recurrence, size, invasiveness, and functional status. Ki-67 labeling index (>3% vs. ≤3%) showed no significant differences with any clinical feature of PitNETs (recurrence, size, invasiveness, functional status). In contrast, the p53 H-score was significantly higher in macroadenomas than in microadenomas (median 27 vs. 16; p=0.008). Additionally, invasive pituitary adenomas showed a higher p53 H-score compared with non-invasive tumors (median 27 vs. 20; p=0.018). Negative CK18 immunostaining was significantly more frequent in invasive than non-invasive PitNETs (44.4% vs. 13.3%; p < 0.001) and in non-functioning compared to functioning adenomas (42.0% vs. 18.4%; p=0.011). No significant associations were found between either MEG3 variant and Ki-67 LI, p53 H-score, or CK18 immunohistochemical reactions.
Conclusions: This study found that a higher p53 H-score was significantly associated with larger PitNET size and invasiveness. Negative CK18 staining was associated with non-functioning and invasive PitNETs. P53 expression and CK18 status may serve as useful prognostic markers in PitNETs.
1 Introduction
Pituitary neuroendocrine tumors (PitNETs) are the most common sellar-region tumors, classified as functioning or nonfunctioning depending on their hormonal activity. According to data from studies in the general population, the prevalence of clinically significant PitNETs is around 1 in 1100 people. Interestingly, prolactinomas account for approximately 53% of PitNETs, and occur about ten times more frequently in women than in men (1). Depending on their size, PitNETs are classified as microadenomas (<1 cm) or macrodenomas (>1 cm). Macroadenomas often cause the compression of the optic chiasm, leading to visual impairment (bitemporal hemianopsia) (2). In addition, macroadenomas can also present with headaches or hypopituitarism due to the mass effect (3). Based on their hormonal activity, functioning PitNETs are classified by lineage into gonadotroph, thyrotroph, corticotroph, lactotroph, and somatotroph tumors, which clinically present as hypogonadism, hyperthyroidism, Cushing’s disease, hyperprolactinemia, and acromegaly, respectively (4). On the other hand, clinically nonfunctioning PitNETs are usually associated with mass-effect symptoms and hypopituitarism (5).
Based on the 2022 World Health Organization (WHO) Classification of Endocrine and Neuroendocrine Tumors, PitNETs are grouped by cellular lineage, which is determined through targeted immunohistochemical reactions. PitNETs of PIT1 lineage includes somatotroph, lactotroph, and thyrotroph adenomas. Furthermore, corticotroph and gonadotroph adenomas and their variants comprise TPIT and SF1 lineages, whereas tumors that lack detectable hormone or transcription factor expression are defined as null-cell adenomas (6, 7). However, to date, no distinctive morphologic criteria and no single prognostic biomarker can predict the likelihood of tumor growth or malignant progression (4, 8, 9).
Maternally expressed gene 3 (MEG3) is a long non-coding RNA (lncRNA) located on chromosome 14q32.3. One of the main functions of MEG3 lncRNA is the regulation of the p53 tumor suppressor gene expression and the induction of p53-dependent transcription through multiple mechanisms (10). By interacting with the polycomb repressive complex 2 (PRC2) and its cofactor Jumonji, and AT-rich interaction domain-containing 2 (JARID2), MEG3 inhibits the expression of MDM2 and CDH1, which leads to p53 activation and a reduction in epithelial-mesenchymal transition (EMT), respectively. In addition, MEG3 can directly bind to p53 and activate the expression of growth differentiation factor 15 (GDF15). Through these interactions, MEG3 inhibits the proliferation and invasion of cancer cells (11–13). MEG3 has been found to be downregulated in a wide range of neoplasms, including squamous cell carcinoma of the head and neck, neuroblastoma, glioma, meningioma, retinoblastoma, and thyroid cancer. However, relatively few studies have investigated the relationship between MEG3 lncRNA and PitNETs (14).
Ki-67 is a nuclear protein associated with cellular proliferation and is detected in all active phases of the cell cycle (G1, S, G2, and M) except G0. Encoded by the human MKI67 gene, Ki-67 plays multiple roles during mitosis, including the assembly of the perichromosomal protein compartment, the organization of heterochromatin, the attachment of chromosomes to the mitotic spindle, and the exclusion of large cytoplasmic molecules from the nuclei at the end of mitosis (15). Numerous studies have demonstrated that a higher Ki-67 labeling index (LI) is associated with poorer survival, larger tumor size, lymphatic invasion, and metastasis (16). In the context of neuroendocrine tumors, several studies have evaluated the prognostic role of the Ki-67 LI. Combined with morphological and radiological evidence, Ki-67 LI shows promising signs for identifying PitNETs at higher risk of recurrence or local invasion (17, 18). Accordingly, immature PIT1-lineage, Crooke cell, null-cell, silent corticotroph, sparsely granulated somatotroph, and corticotroph adenomas demonstrate more aggressive behavior (19–22). However, the independent prognostic role of Ki-67 in PitNETs remains unclear.
p53 is a transcription factor that is inactivated in nearly all tumors, and approximately 50% of these cases are associated with mutations in the TP53 (23). In addition to its roles in cell-cycle arrest, apoptosis, and senescence, p53 is responsible for a wide range of tumor-suppressive functions. p53 acts as a metabolic regulator that suppresses anabolic reactions (glycolysis, lipogenesis) and activates catabolic processes (oxidative phosphorylation, fatty acid oxidation). Additionally, p53 promotes ferroptosis, which serves as an alternative to apoptosis in eliminating cells under metabolic stress (24). While p53 functional role and immunohistochemical patterns have been widely studied across a range of cancers, including high‐grade serous carcinoma, endometrial carcinoma, high-grade bladder cancer, and prostate cancer, its specific involvement in PitNETs remains poorly understood (25–27).
Cytokeratin 18 (CK18) is an intermediate filament protein that is co-expressed with cytokeratin 8 (CK8), forming heteropolymers that assemble into keratin filaments, which are found in the cytoplasm of epithelial cells (28). Besides its structural and protective roles, CK18 is involved in multiple cellular processes, including apoptosis, cell cycle progression, mitosis, and cell signaling (29). A large study conducted by Menz and co-authors revealed the involvement of CK18 in various types of cancers. The study demonstrated that CK18 is strongly expressed in most adenocarcinomas, especially those originating from the lung, prostate, colon, pancreas, and ovary. In addition, tumors that arise from CK18-positive tissues, such as breast and renal cancers, may downregulate CK18 expression, leading to more aggressive tumor development and poorer prognosis (30). In the context of neuroendocrine tumors, CK18 immunohistochemistry is widely used for the histopathological classification of PitNETs. For instance, CK18 fibrous bodies in sparsely granulated somatotroph tumors, and Crooke’s cells in corticotroph adenomas (7, 31). However, to date, the relationships between CK18 immunohistochemical reaction types and clinical characteristics of PitNETs have not been established. Collectively, MEG3, Ki-67, p53 and CK18 provide unique insights into tumor biology. However, their impact on the clinicopathological characteristics of PitNETs remains unclear.
Given their involvement in various malignancies, this study aimed to investigate the clinicopathological roles of MEG3 genetic variants, Ki-67, p53, and CK18 in the development of PitNETs, with the goal of clarifying their prognostic value, associations with tumor aggressiveness, and clinical characteristics, which may contribute to improved management of neuroendocrine tumors.
2 Research methodology
2.1 Organization of the research
This research was carried out in the Ophthalmology Laboratory of the Institute of Neurosciences of the Lithuanian University of Health Sciences (LUHS). DNA and tumor tissue samples were collected at the institution between 2014 and 2024 as part of routine diagnostic and research procedures. Kaunas Regional Biomedical Research Ethics Committee approved the study (No. BE-2-47, issued on 25 December 2016). The study was divided into four stages. In the first stage, an analysis of the scientific literature was performed, and DNA extraction was performed using the salting out method from the subjects’ venous blood leukocytes. In the second stage, the lncRNA MEG3 rs4081134 and rs7158663 genotypes were determined using the real-time polymerase chain reaction (RT-PCR). In the third stage, immunohistochemical markers were determined: Ki67, p53, and CK18 at the Department of Pathological Anatomy of the LUHS hospital KK. In the fourth stage, the results were analyzed using the statistical program, the results were described, and a report was prepared.
2.2 Subject selection
The study participants were divided into two groups:
Patients with PitNET (n=120 patients): 69 women (57.5%) and 51 men (42.5%).
Patients who were 18 years of age or older, in good general health, and free of any tumors (except pituitary neoplasms) were included in the PitNET group. PitNETs were identified and verified by magnetic resonance imaging (MRI).
The PitNET group was split up into smaller groups based on relapse, hormonal activity, and invasiveness. Groups were separated into invasive and non-invasive categories, based on histopathological views; active and inactive PitNET groups were formed based on blood serum hormone levels. If a follow-up MRI revealed a new growth or the expansion of a remaining tumor, relapse was indicated. When a new growth or expansion of a residual tumor was seen on follow-up MRI following surgical excision during the research period, PitNET recurrence was identified. If a follow-up MRI showed no indications of tumor progression, the remaining tumor was deemed stable.
A control group consisting of 220 individuals: 120 women (54.5%) and 100 men (45.5%).
The participants in the healthy control group were matched by age and gender to those in the PitNET group and were generally in good health.
All study subjects signed an informed consent form to participate in this study. Blood was collected from the peripheral vein of each study participant.
2.3 DNA extraction and genotyping
Blood from all study participants was collected in vacuum tubes containing ethylenediaminetetraacetate (EDTA) to prevent clot formation. In this study, DNA was isolated from the venous blood of study participants using the leukocyte salt precipitation method. The method was used as described earlier (32). The lncRNA genotypes of the MEG3 rs4081134 and rs7158663 variants were determined by RT-PCR using the StepOne Plus amplifier (Applied Biosystems, USA). The genotypes of selected lncRNA variants were determined according to the protocols of the manufacturer, StepOne Plus (Applied Biosystems). The protocol for determining genotyping conditions and variant characteristics is presented in Table 1.
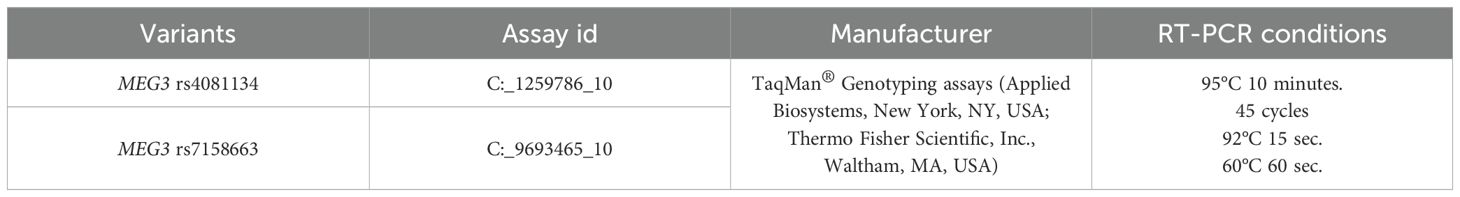
Table 1. Genotype determination protocol and lncRNA variants information.
2.4 SNV selection
Both of our chosen SNVs (rs7158663 and rs4081134) are intronic; such variants can have a significant impact on lncRNA expression, splicing, or structure, which may in turn influence downstream tumor suppressor pathways. In lncRNAs like MEG3, intronic regions may also contain regulatory motifs or binding sites essential for RNA stability or interaction with proteins and other RNAs (10). These SNVs have previously studied cancer for susceptibility and prognosis in other populations. In particular, rs7158663 has been reported to affect MEG3 expression levels, possibly influencing cancer risk (14). To our knowledge, rs7158663 and rs4081134 have not yet been thoroughly investigated in the context of PitNETs, which provided an opportunity to explore novel associations and contribute new data to the field.
2.5 Immunohistochemistry
After fixation of the surgical material with 10% formalin solution, standardized paraffin embedding procedures of PitNET tissues were performed using the Shandon Pathcentre processor (Shandon, UK). After forming paraffin blocks of PitNET tissues in the TBS88 system (Medite, Germany), 2 μm-thick sections were made using a Leica RM2125RT rotary microtome (Leica Biosystems, Germany).
Immunohistochemical reactions of Ki-67 LI and p53 protein biomarkers were performed using the automated Ventana BenchMark ULTRA PLUS staining system (Roche Diagnostics, Switzerland) according to the manufacturer’s recommendations. The Dako Omnis staining system (Agilent Technologies, CA, USA) was used for CK18 analysis according to the manufacturer’s recommendations. Ki-67 LI, p53, and CK18 were detected using monoclonal antibodies, the clones of which are SP6 (Vitro S.A., Spain), DO-7 (Roche Diagnostics, Switzerland), and DC-10 (Vitro S.A., Spain), respectively. After performing Ki-67, p53, and CK18 immunohistochemical reactions, the images were digitized with a Pannoramic 250 FLASH III scanner (3DHISTECH, Hungary). The evaluation of the digitized images for Ki-67, p53, and CK18 was performed by a qualified pathologist at the Clinic of Pathological Anatomy of the LUHS, using the 3DHISTECH SlideViewer 2.9.0. program and based on the WHO Classification of Endocrine and Neuroendocrine Tumors (6).
When evaluating CK18 images, immunohistochemical reactions were divided into positive (+) and negative (-). Diffuse and focal staining patterns were determined for positive reactions. Depending on the nature of the staining, cytoplasmic, perinuclear, fibrous body, and ring-like perinuclear reactions were observed (Table 2).
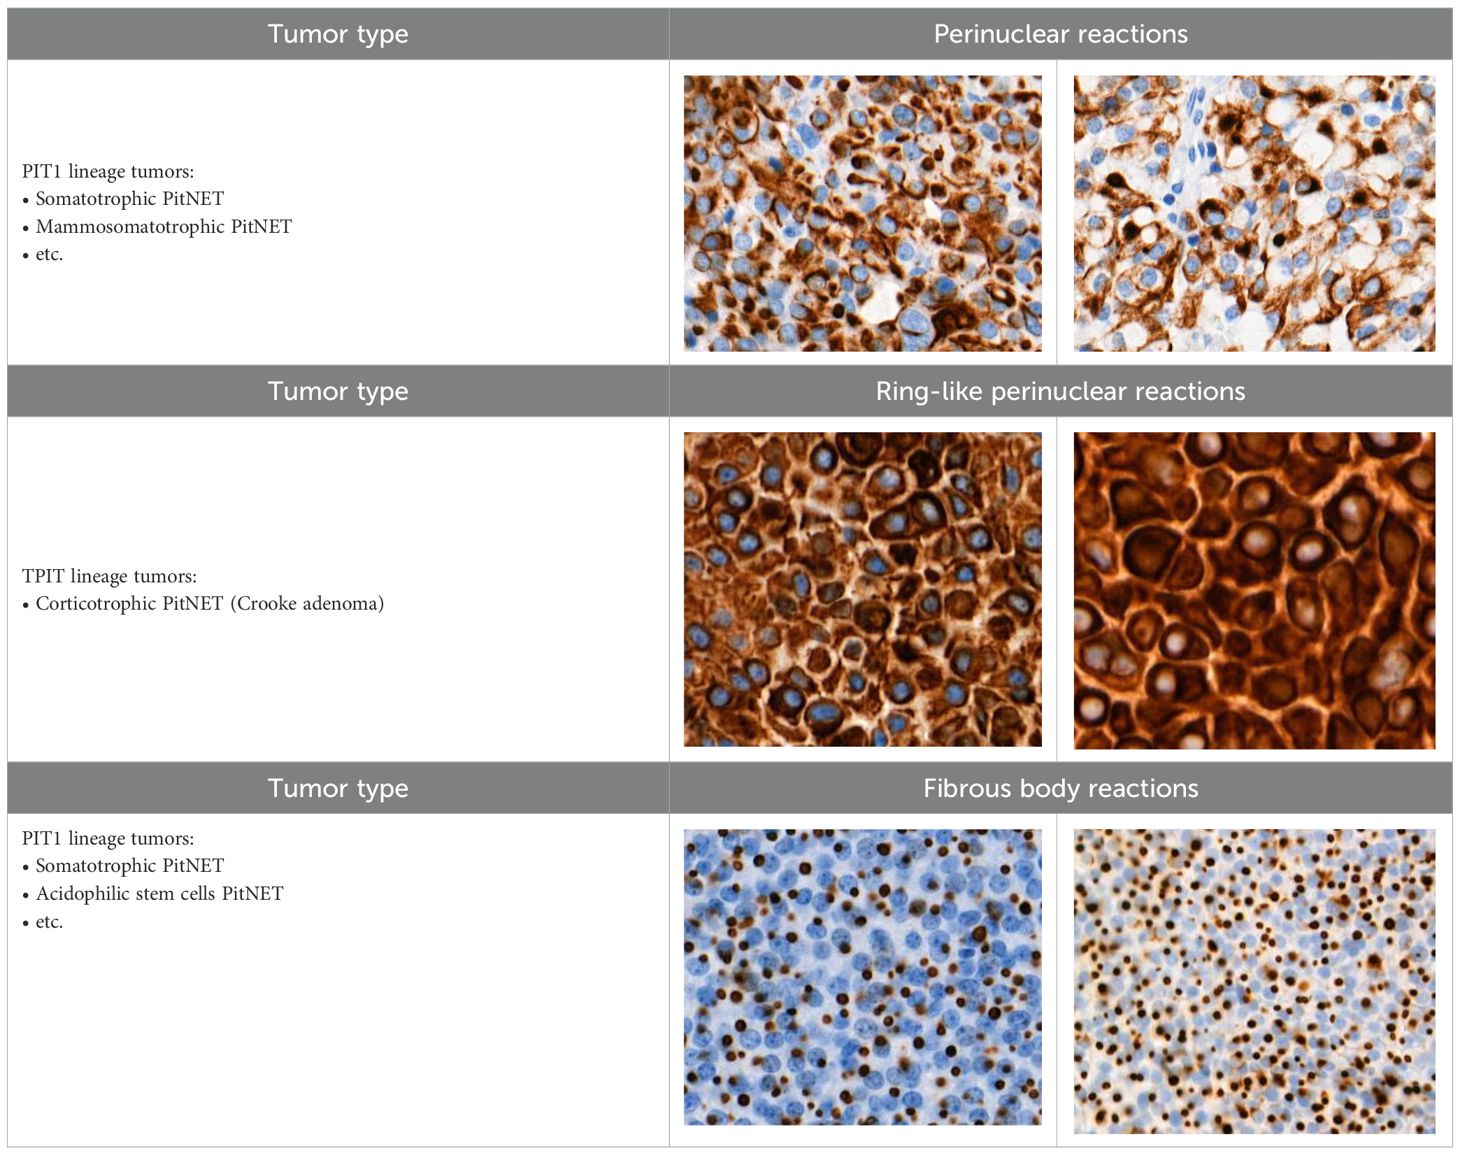
Table 2. Types of immunohistochemical reactions of PitNET with CK18.
Ki-67 and p53 marker assessments were performed in hotspot zones - the most densely positively stained regions (Table 3). After selecting the hotspot zone with the best scanning quality, 300 tumor cell nuclei were evaluated, which falls below recommended standards. However, this approach ensured consistency and feasibility across all cases. When assessing Ki-67, cell nuclei were divided into “Negative (-)” and “Positive (+)” categories and the percentage of positively stained nuclei was calculated. When evaluating p53, tumor cell nuclei were divided into “Negative (-)”, “Weakly positive (+)”, “Moderately positive (++)”, and “Strongly positive (+++)” categories, taking into account the color of the nuclear staining, its intensity, and distribution throughout the nucleus. The percentage of all p53-positive nuclei was calculated and divided by category separately. Morphologically unclear nuclei were not included in the evaluation.
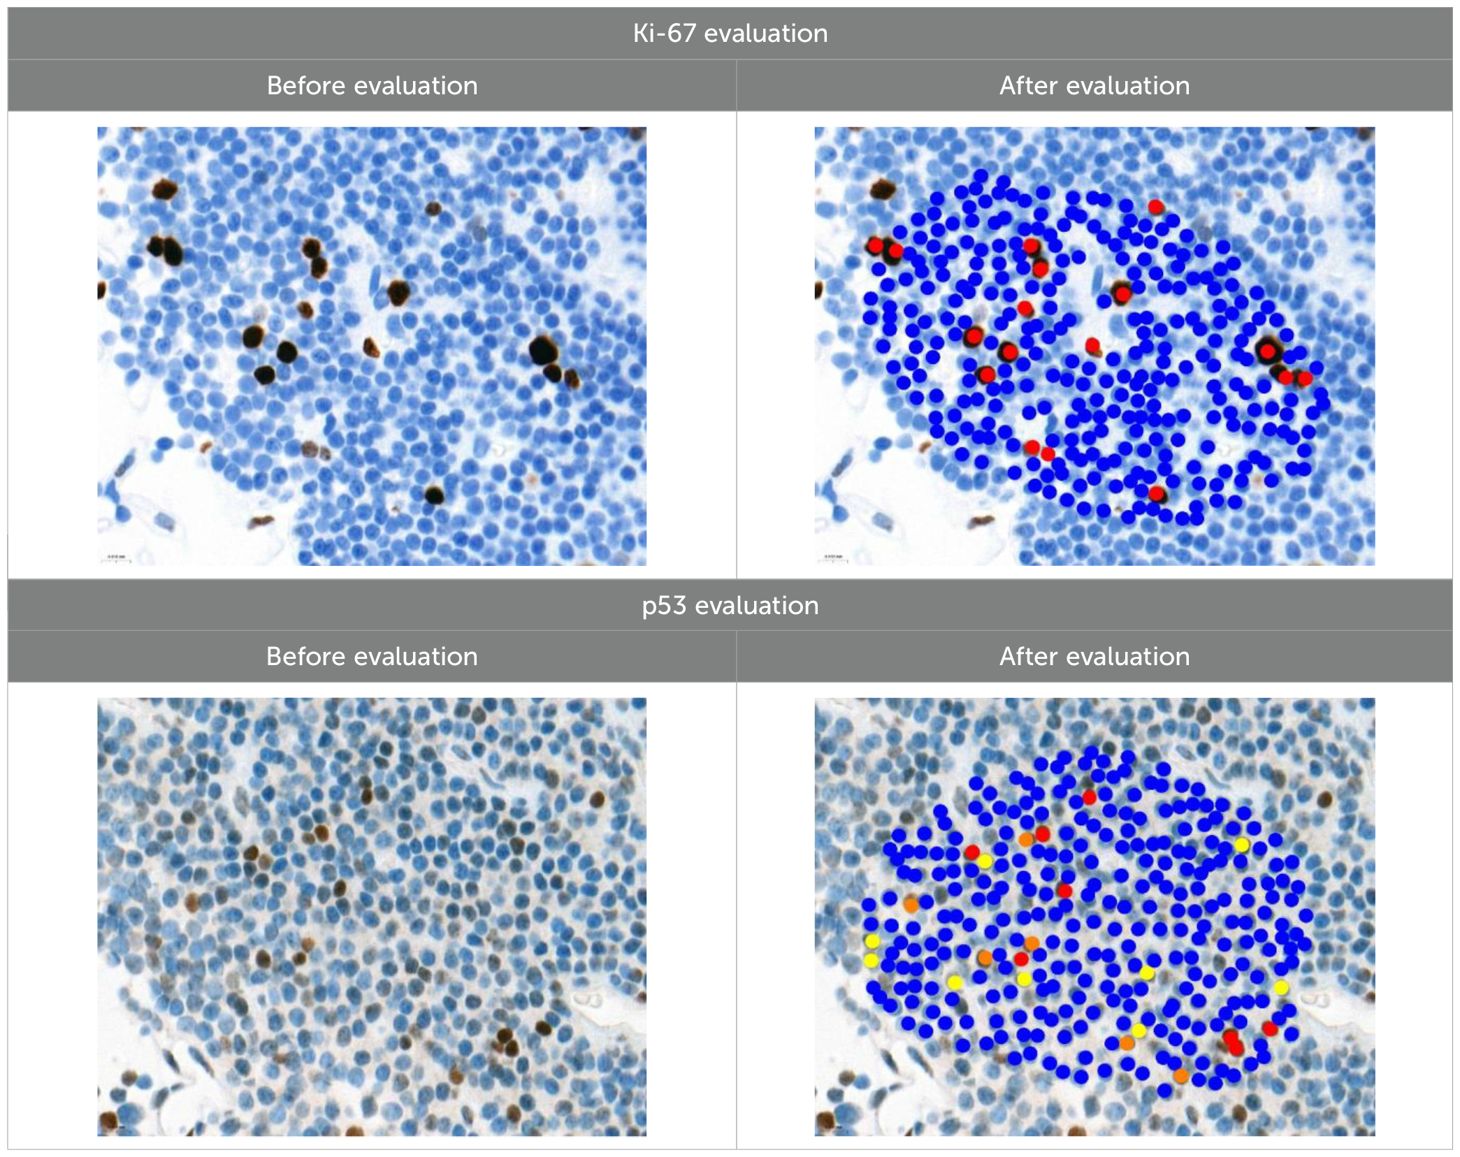
Table 3. Ki-67 and p53 evaluation in PitNET.
To calculate the percentage of Ki-67-positive (brown/dark brown/black) nuclei, negative nuclei were marked in blue and positive nuclei in red. For p53-positive nuclei, “weakly positive (+)” nuclei were marked in yellow, “moderately positive (++)” in orange, and “strongly positive (+++)” in red.
2.6 Statistical analysis
Using the global prevalence of pituitary adenomas of 9% (1) and the minor allele frequencies of MEG3 rs4081134 (31.4%) and rs7158663 (46.9%) from the dbSNP database (33, 34), we calculated the statistical power for detecting associations under the most robust genetic models selected via the lowest AIC in logistic regression. With a sample size of 120 PitNET patients and 220 controls, the study achieved less than 80% power for detecting moderate genetic effects, indicating that future research with larger sample sizes is warranted to confirm these findings. Statistical analysis was performed using the Statistical Package for the Social Sciences, version 29.0 for Windows (SPSS for Windows, version 29.0, USA). The hypothesis of normal distribution for the measured variables was tested using the Kolmogorov-Smirnov test. When the data did not meet the criteria for normal distribution, descriptive statistics such as the median and interquartile range (IQR) were applied, with the non-parametric Mann-Whitney U test. The χ² test was used to analyze the differences in the distribution of single nucleotide variants in MEG3 rs4081134 and rs7158663. Binary logistic regression analysis was used to estimate the odds ratio (OR) of disease occurrence, indicating the OR with a 95% confidence interval (CI). The Akaike Information Criterion (AIC) was used to determine the best-fitting inheritance model, with the lowest AIC value indicating the most appropriate model. According to the 2022 WHO Classification of Endocrine and Neuroendocrine Tumors (6), Ki-67 results were categorized into two groups: “≤3%” and “>3%”. For p53, tumor cell nuclei were classified as “Negative (-)”, “Weakly positive (+)”, “Moderately positive (++)”, or “Strongly positive (+++)”, based on nuclear staining color, intensity, and distribution. To objectively assess p53 staining intensity, a Histoscore (H-score) was calculated as follows: (1 × percentage of weakly staining nuclei) + (2 × percentage of moderately staining nuclei) + (3 × percentage of strongly staining nuclei). To test statistical hypotheses, we chose the significance level (p) criterion, the Bonferroni correction was applied to the SNV analysis, and a statistically significant difference was determined when the p-value was <0.025. In another analysis, statistically significant changes were those with p < 0.05.
3 Results
The case-control study involved 340 subjects divided into two groups: a control group (n=220) and a group of PitNET patients (n=120). After the subject groups were formed, genotyping of the MEG3 rs4081134 and rs7158663 variants was performed. The PitNET group consisted of 120 subjects: 51 males (42.5%) and 69 females (57.5%). The control group consisted of 220 subjects: 100 males (45.5%) and 120 females (54.5%). The demographic data of the subjects are presented in Table 4.
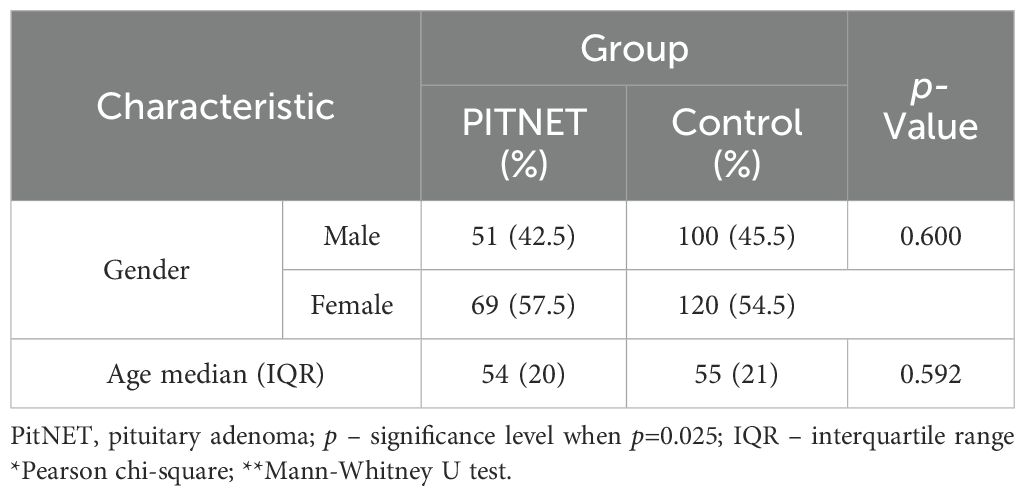
Table 4. Characteristics of study subjects.
The genotypes and allele distributions of MEG3 rs4081134 and rs7158663 were analyzed in the PitNET group and compared with the control group. However, no statistically significant differences were found between the groups (Table 5).
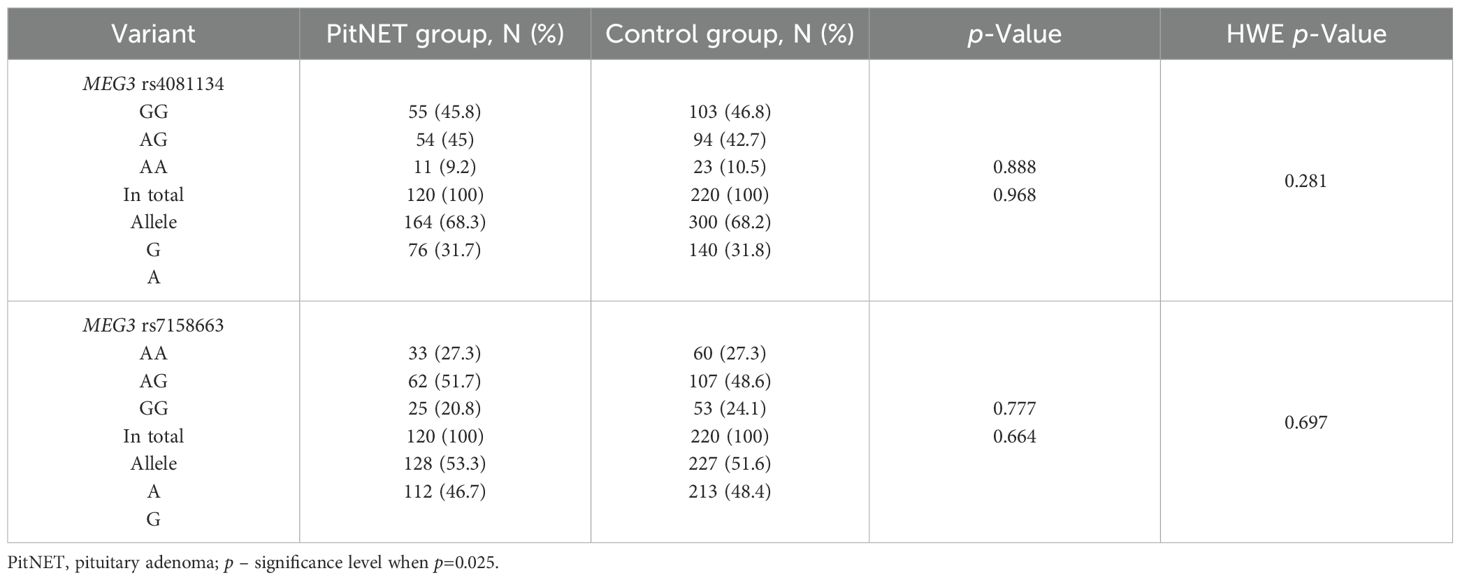
Table 5. MEG3 rs4081134 and rs7158663 genotype and allele frequencies in PitNET and control groups.
Binary logistic regression also revealed no statistically significant differences between PitNET patients and the control group (Table 6).
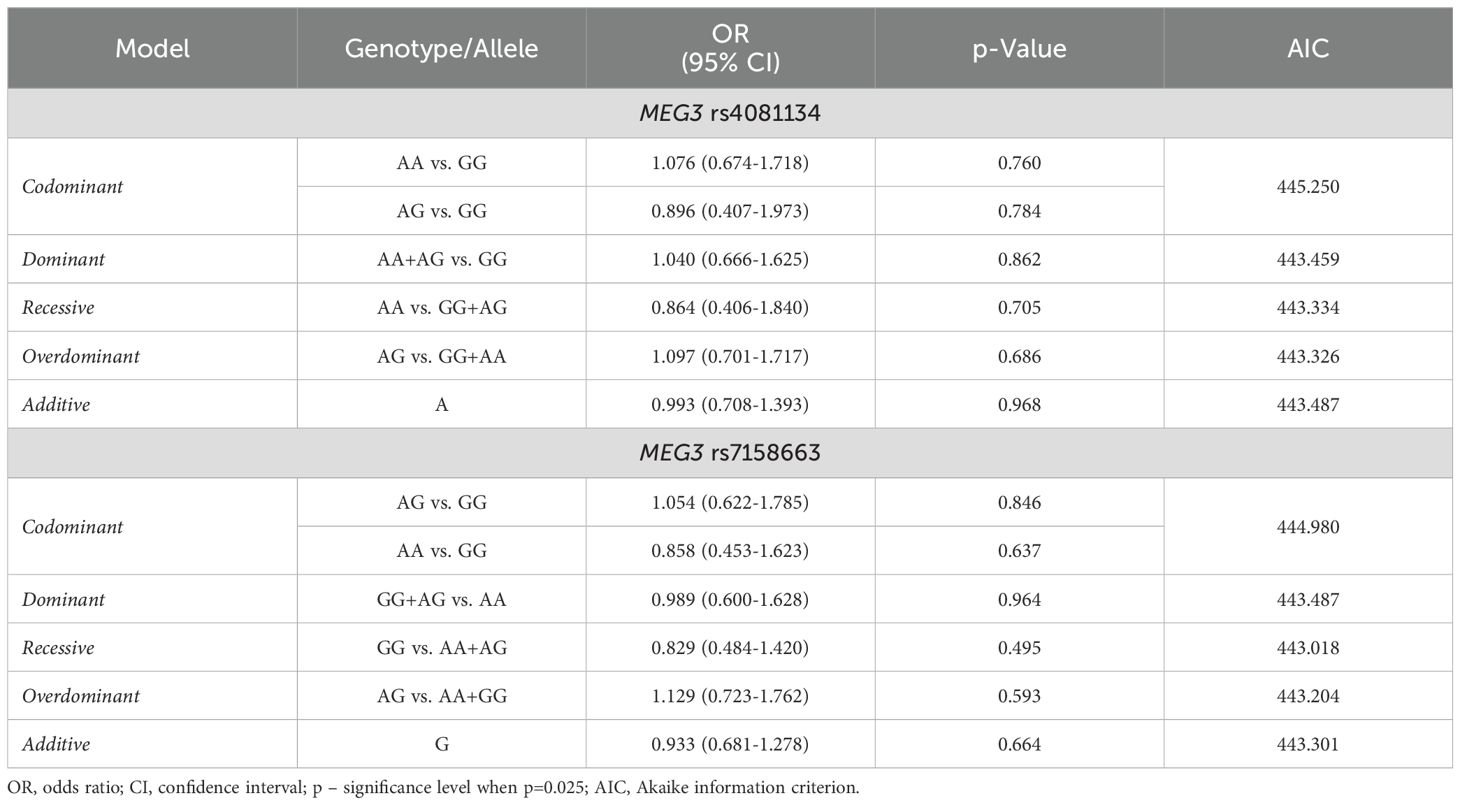
Table 6. MEG3 rs4081134 and rs7158663 binary logistic regression analysis within patients with PitNET and the control group.
The frequencies of genotypes and alleles for the selected SNVs were analyzed within the study groups, stratified by gender. However, there were no statistically significant differences in the distribution of genotypes and alleles and binary logistic regression analysis between females and males with PitNET and the control group (Tables 7–9).
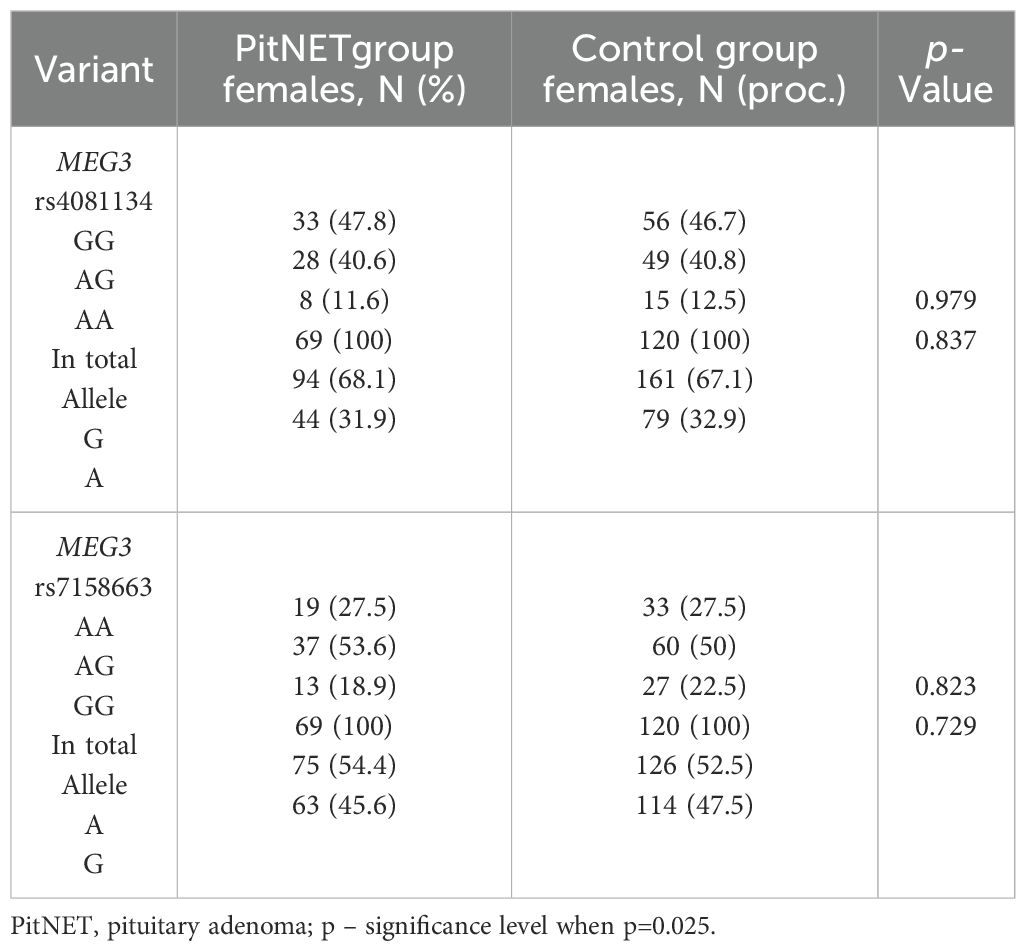
Table 7. MEG3 rs4081134 and rs7158663 genotype and allele frequencies in PitNET and control female groups.
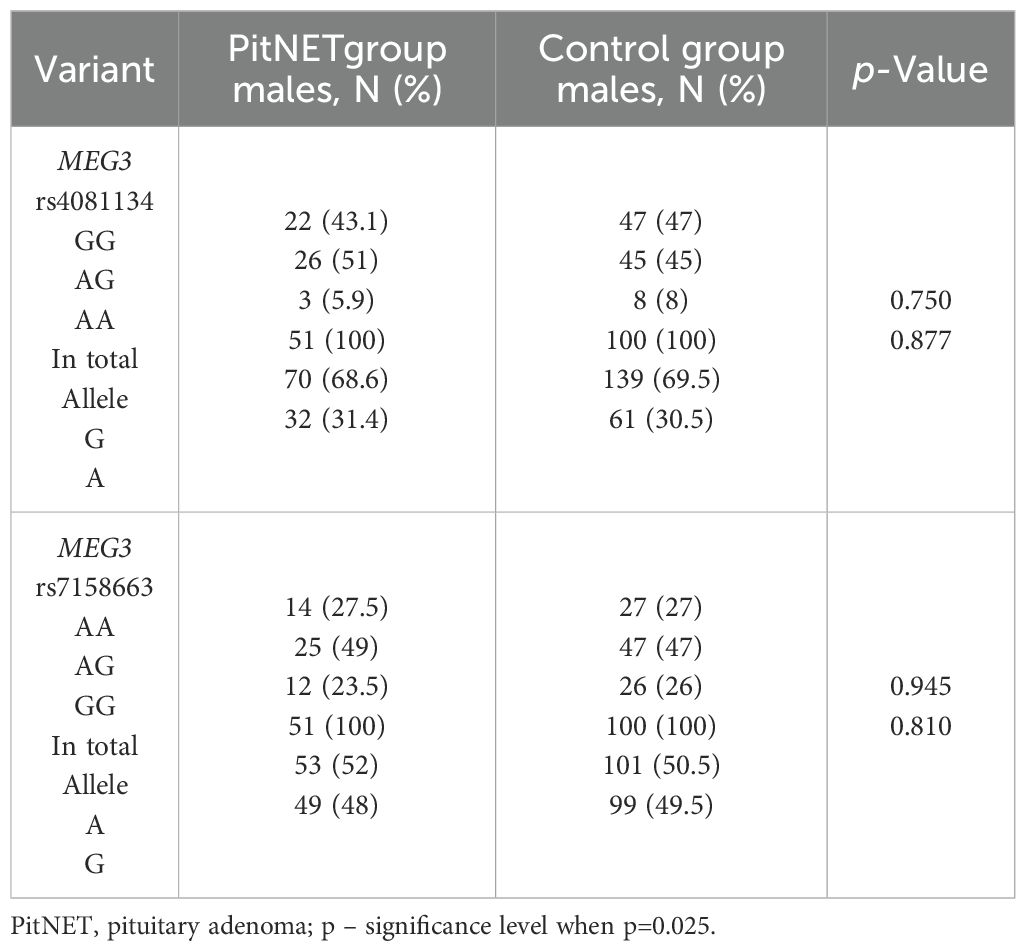
Table 8. MEG3 rs4081134 and rs7158663 genotype and allele frequencies in PitNET and control male groups.
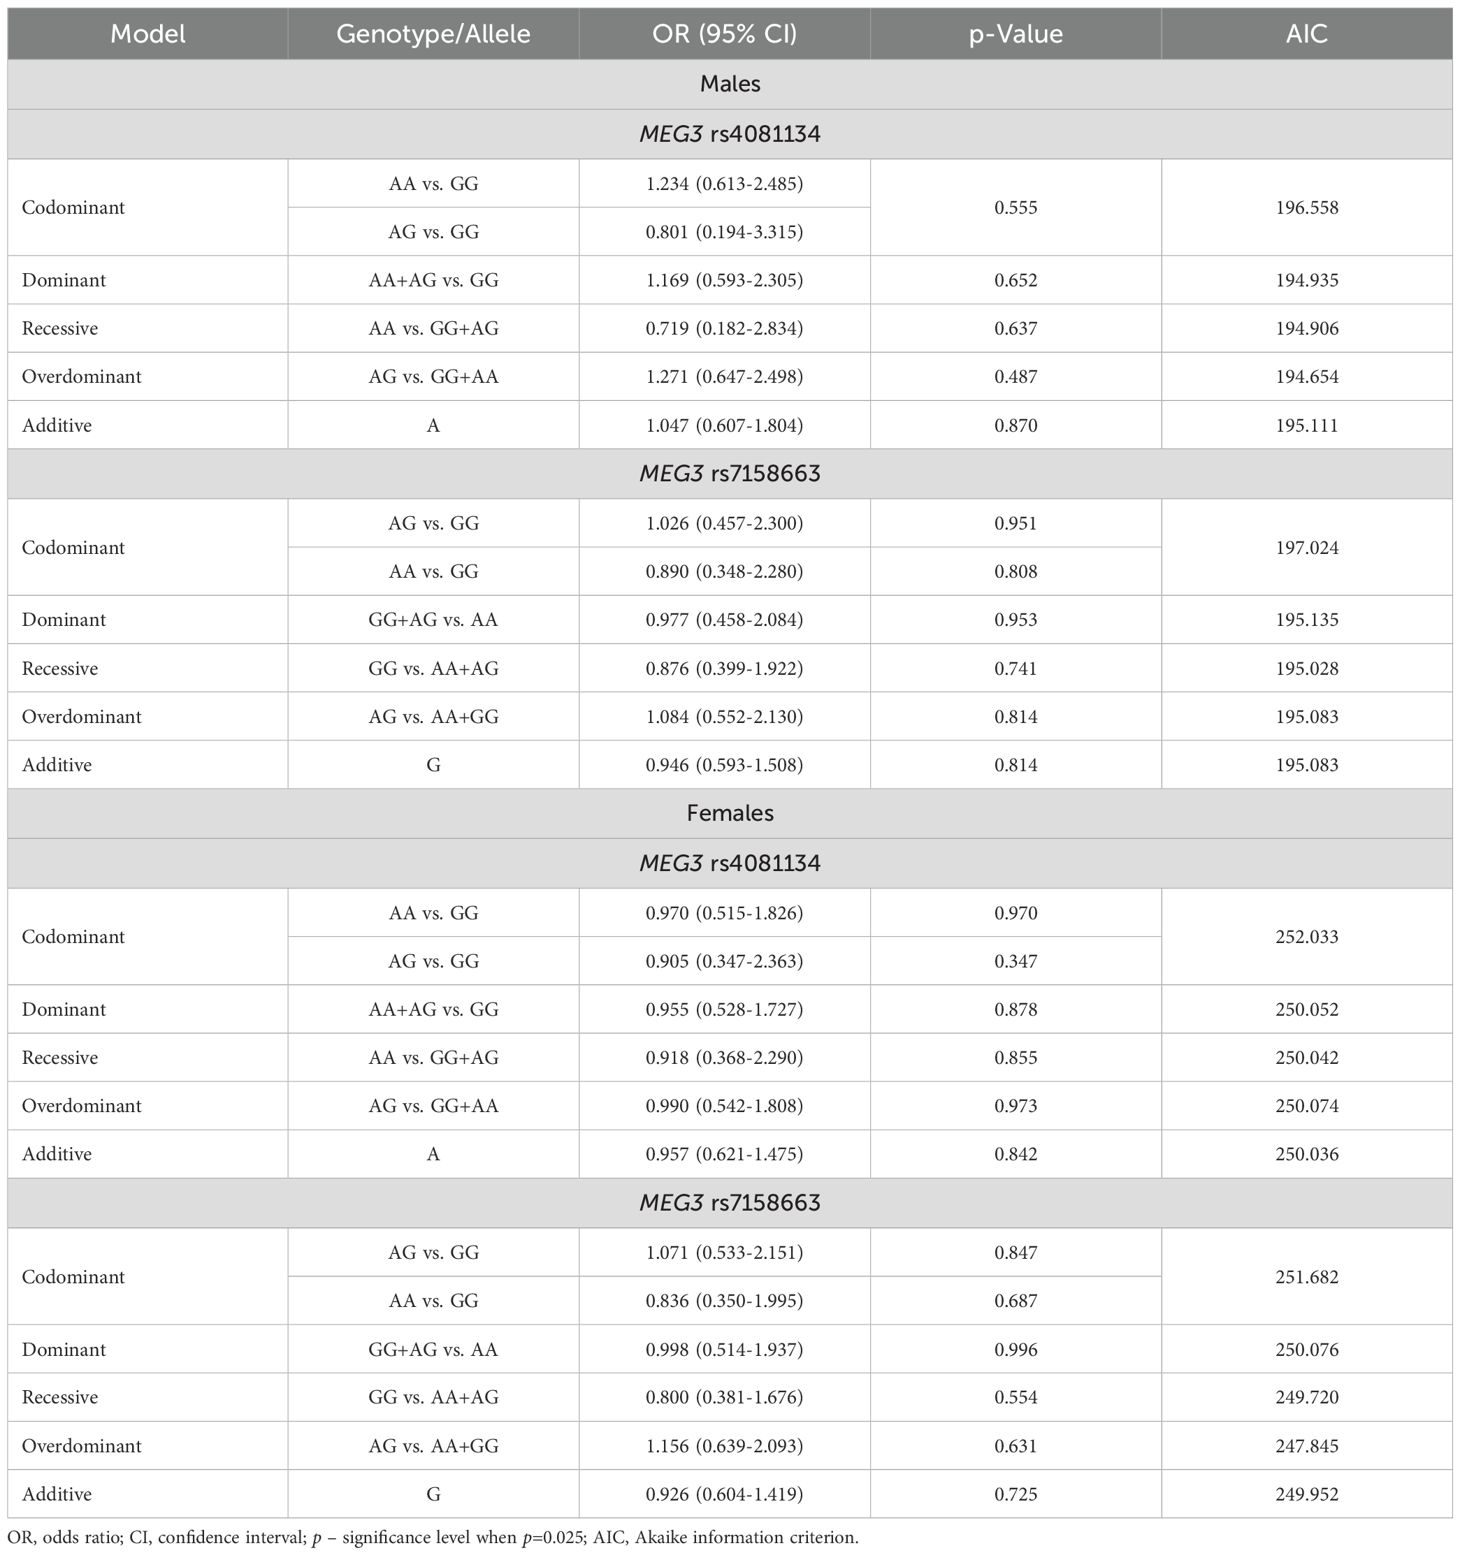
Table 9. MEG3 rs4081134 and rs7158663 binary logistic regression analysis within patients with PitNET and the control group, stratified by gender.
The frequencies of genotypes and alleles for the selected SNVs were also analyzed between microadenoma and macroadenoma and the control groups. However, there were no statistically significant differences in the distribution of genotypes and alleles and binary logistic regression analysis between microadenoma/macroadenoma and the control group (Tables 10 and 11).
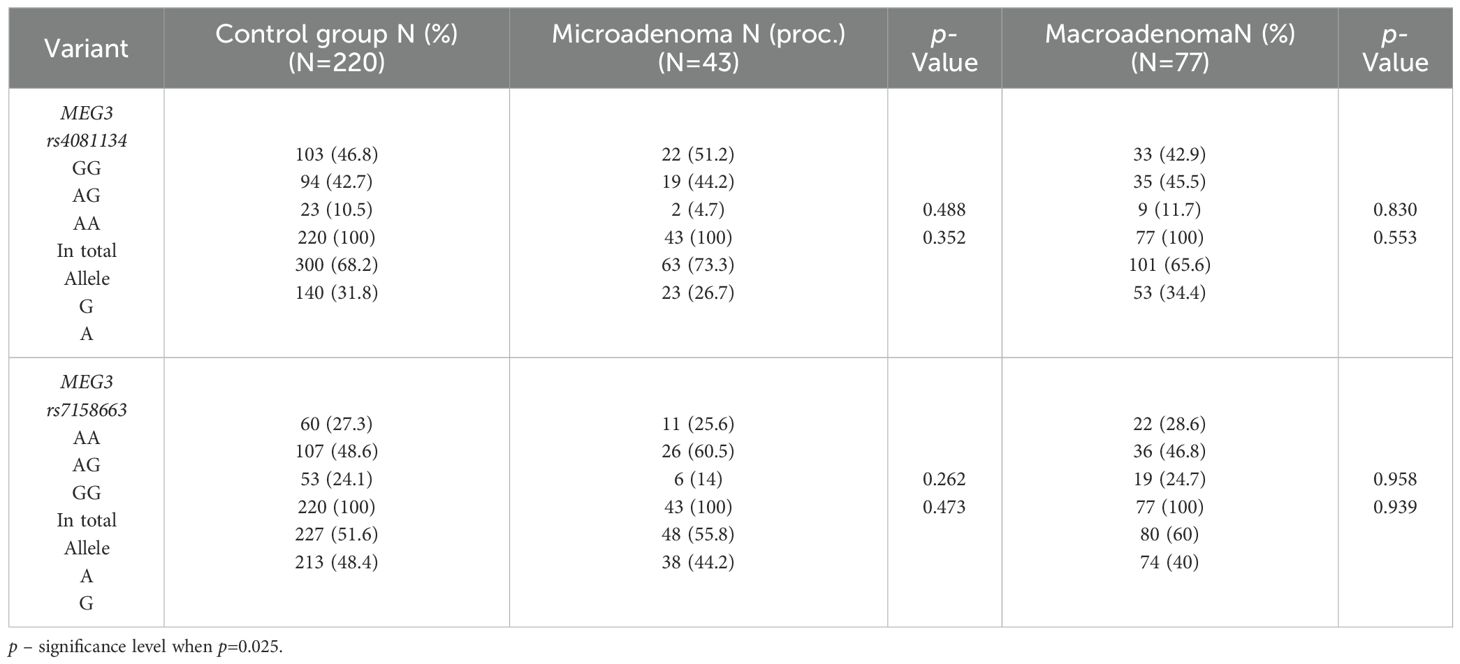
Table 10. MEG3 rs4081134 and rs7158663 genotype and allele frequencies in the control group and PitNET group, depending on the size of the PitNET.
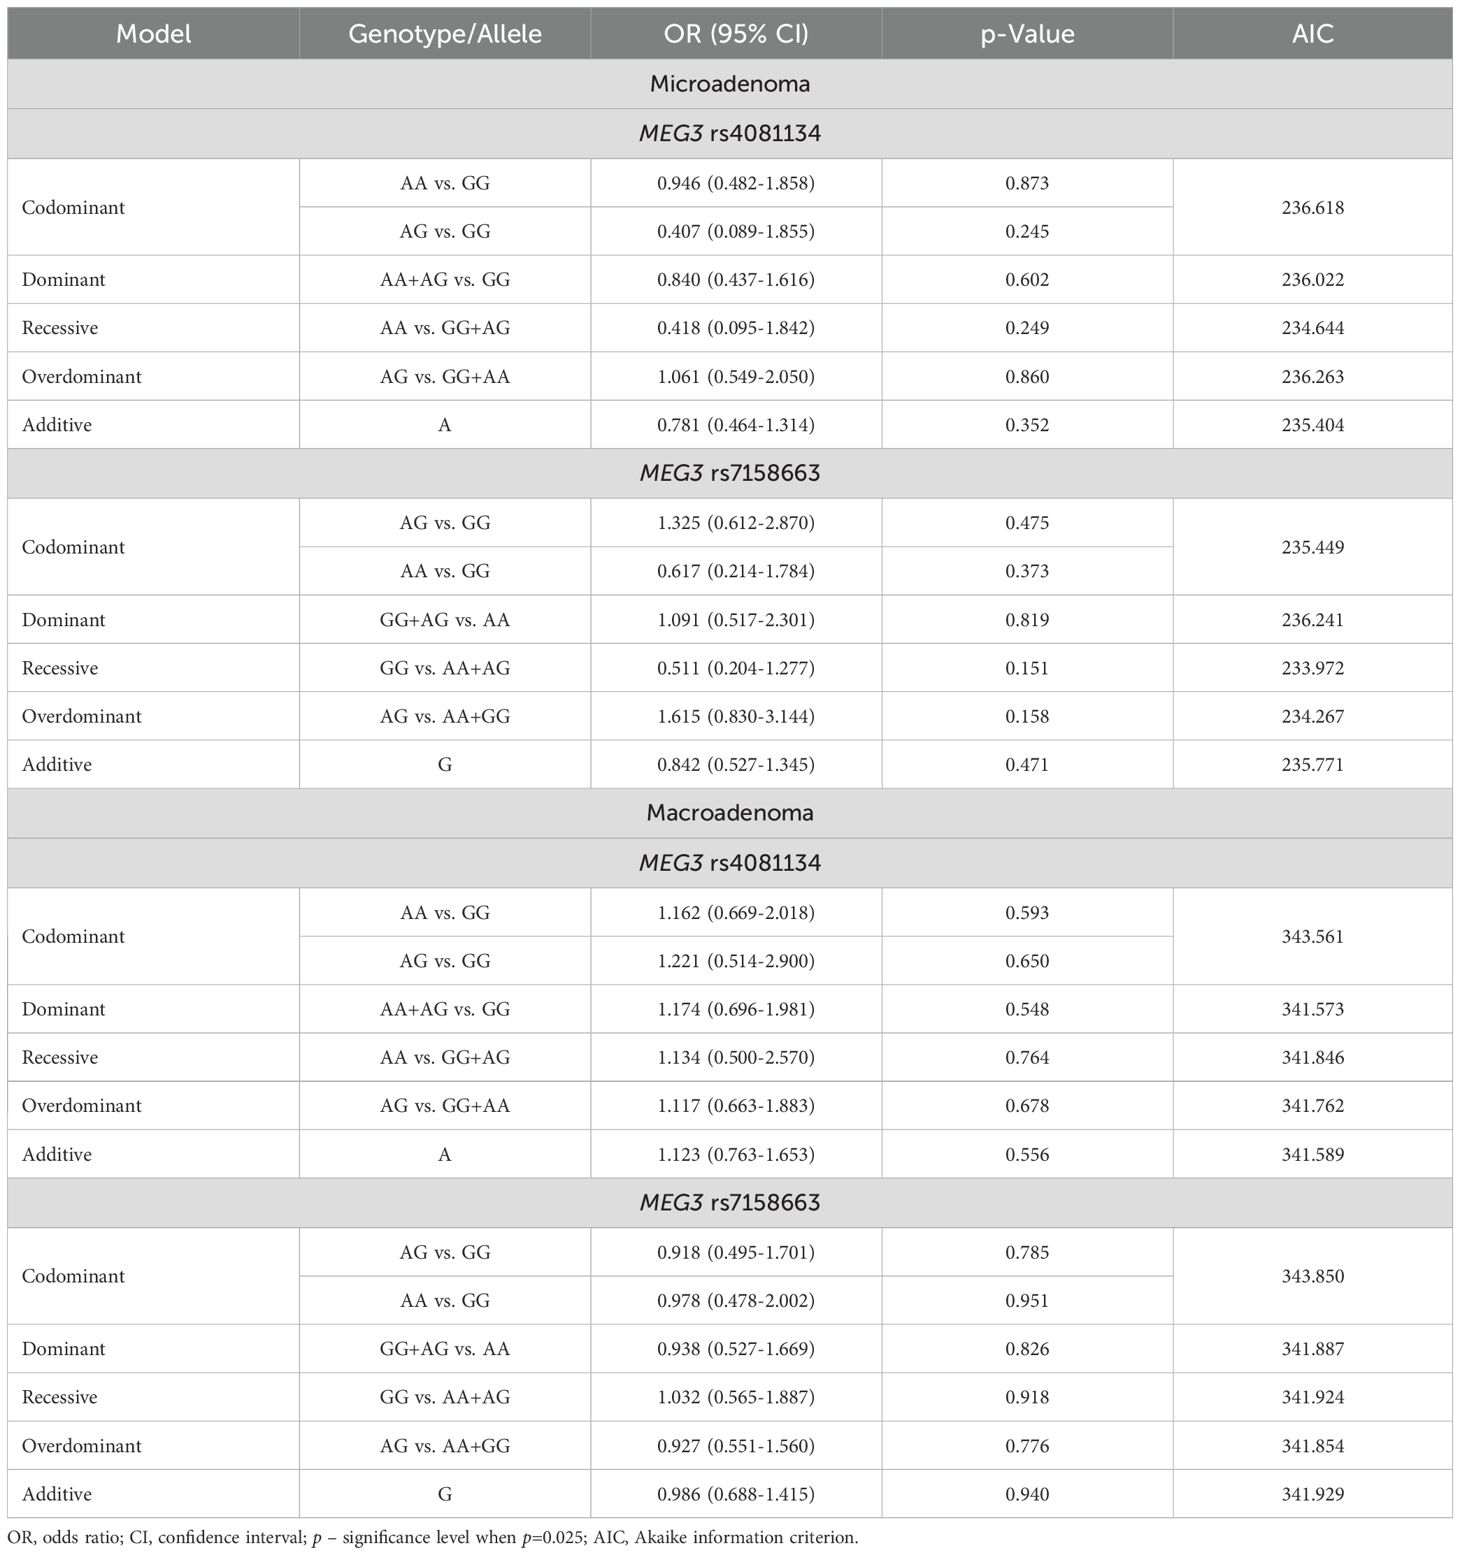
Table 11. MEG3 rs4081134 and rs7158663 binary logistic regression analysis within patients with PitNET and the control group, stratified by PitNET size.
The frequencies of genotypes and alleles for the selected SNVs were also analyzed between the PitNET and control group, depending on the recurrence, activeness, and invasiveness of the PitNET. However, there were no statistically significant differences in the distribution of genotypes and alleles and binary logistic regression analysis between the PitNET with recurrence, active, and invasive PitNET and the control groups (Tables 12 and 13).
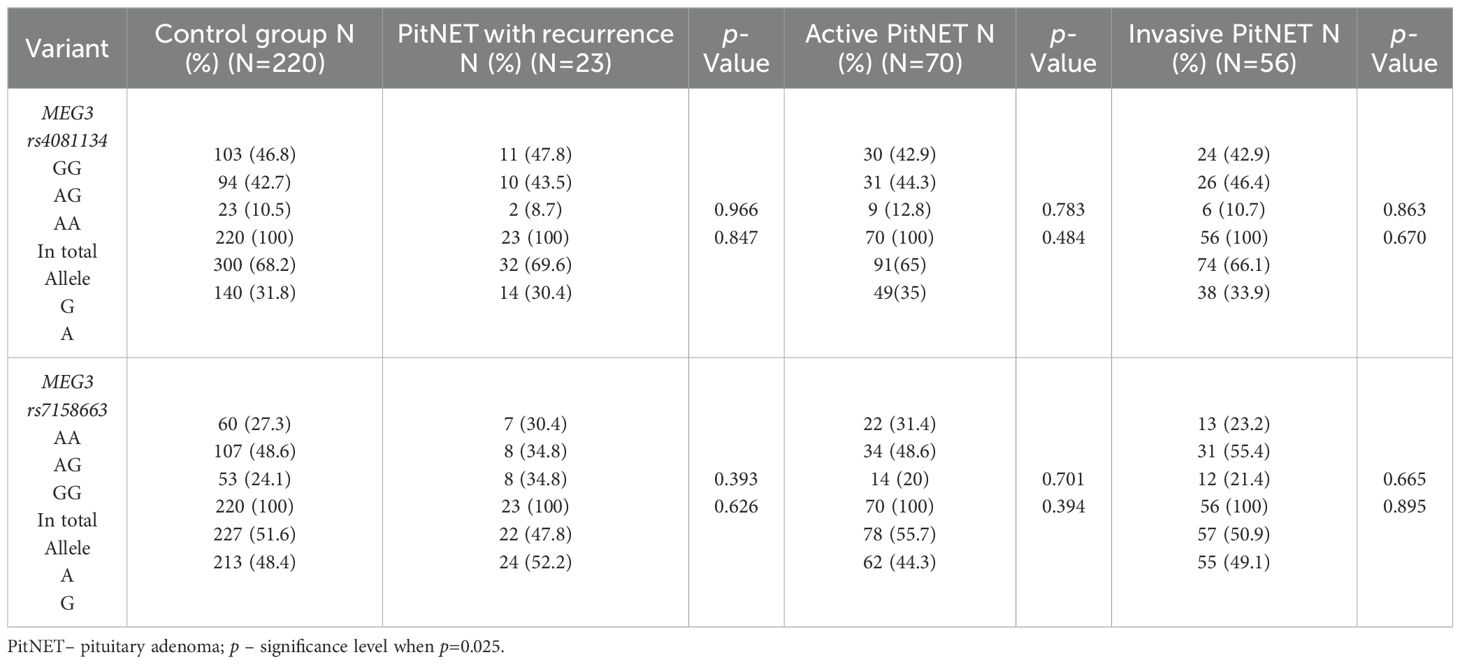
Table 12. MEG3 rs4081134 and rs7158663 genotype and allele frequencies in the control group and PitNET group, depending on the recurrence, activeness and invasiveness of the PitNET.

Table 13. MEG3 rs4081134 and rs7158663 binary logistic regression analysis based on tumor recurrence, hormonal activity, and invasiveness.
The frequencies of genotypes and alleles for the selected SNVs were also analyzed between the PitNET and control group, depending on the PitNET without recurrence, non-activeness, and non-invasiveness of the PitNET. However, there were no statistically significant differences in the distribution of genotypes and alleles and binary logistic regression analysis between the groups (Tables 14 and 15).
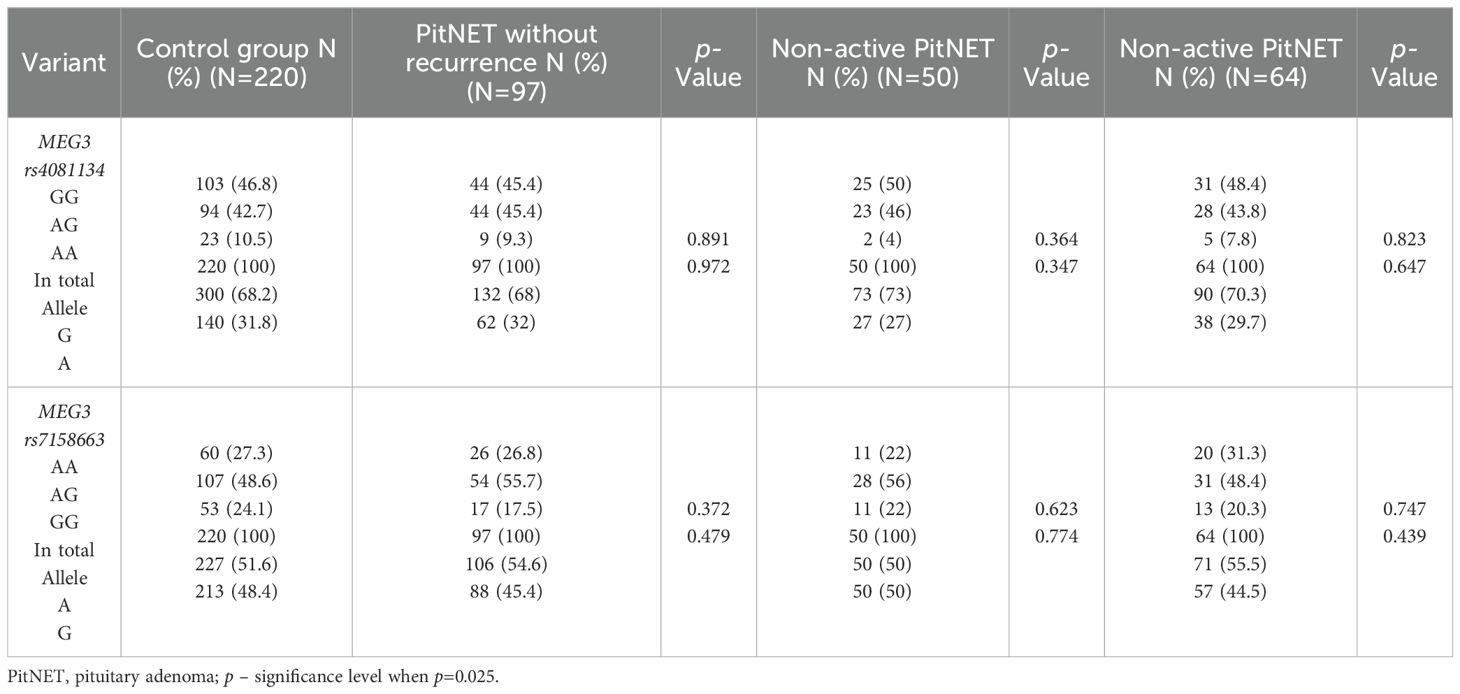
Table 14. MEG3 rs4081134 and rs7158663 genotype and allele frequencies in control group and the PitNET group, depending on the PitNET without recurrence, non-activeness and non-invasiveness.
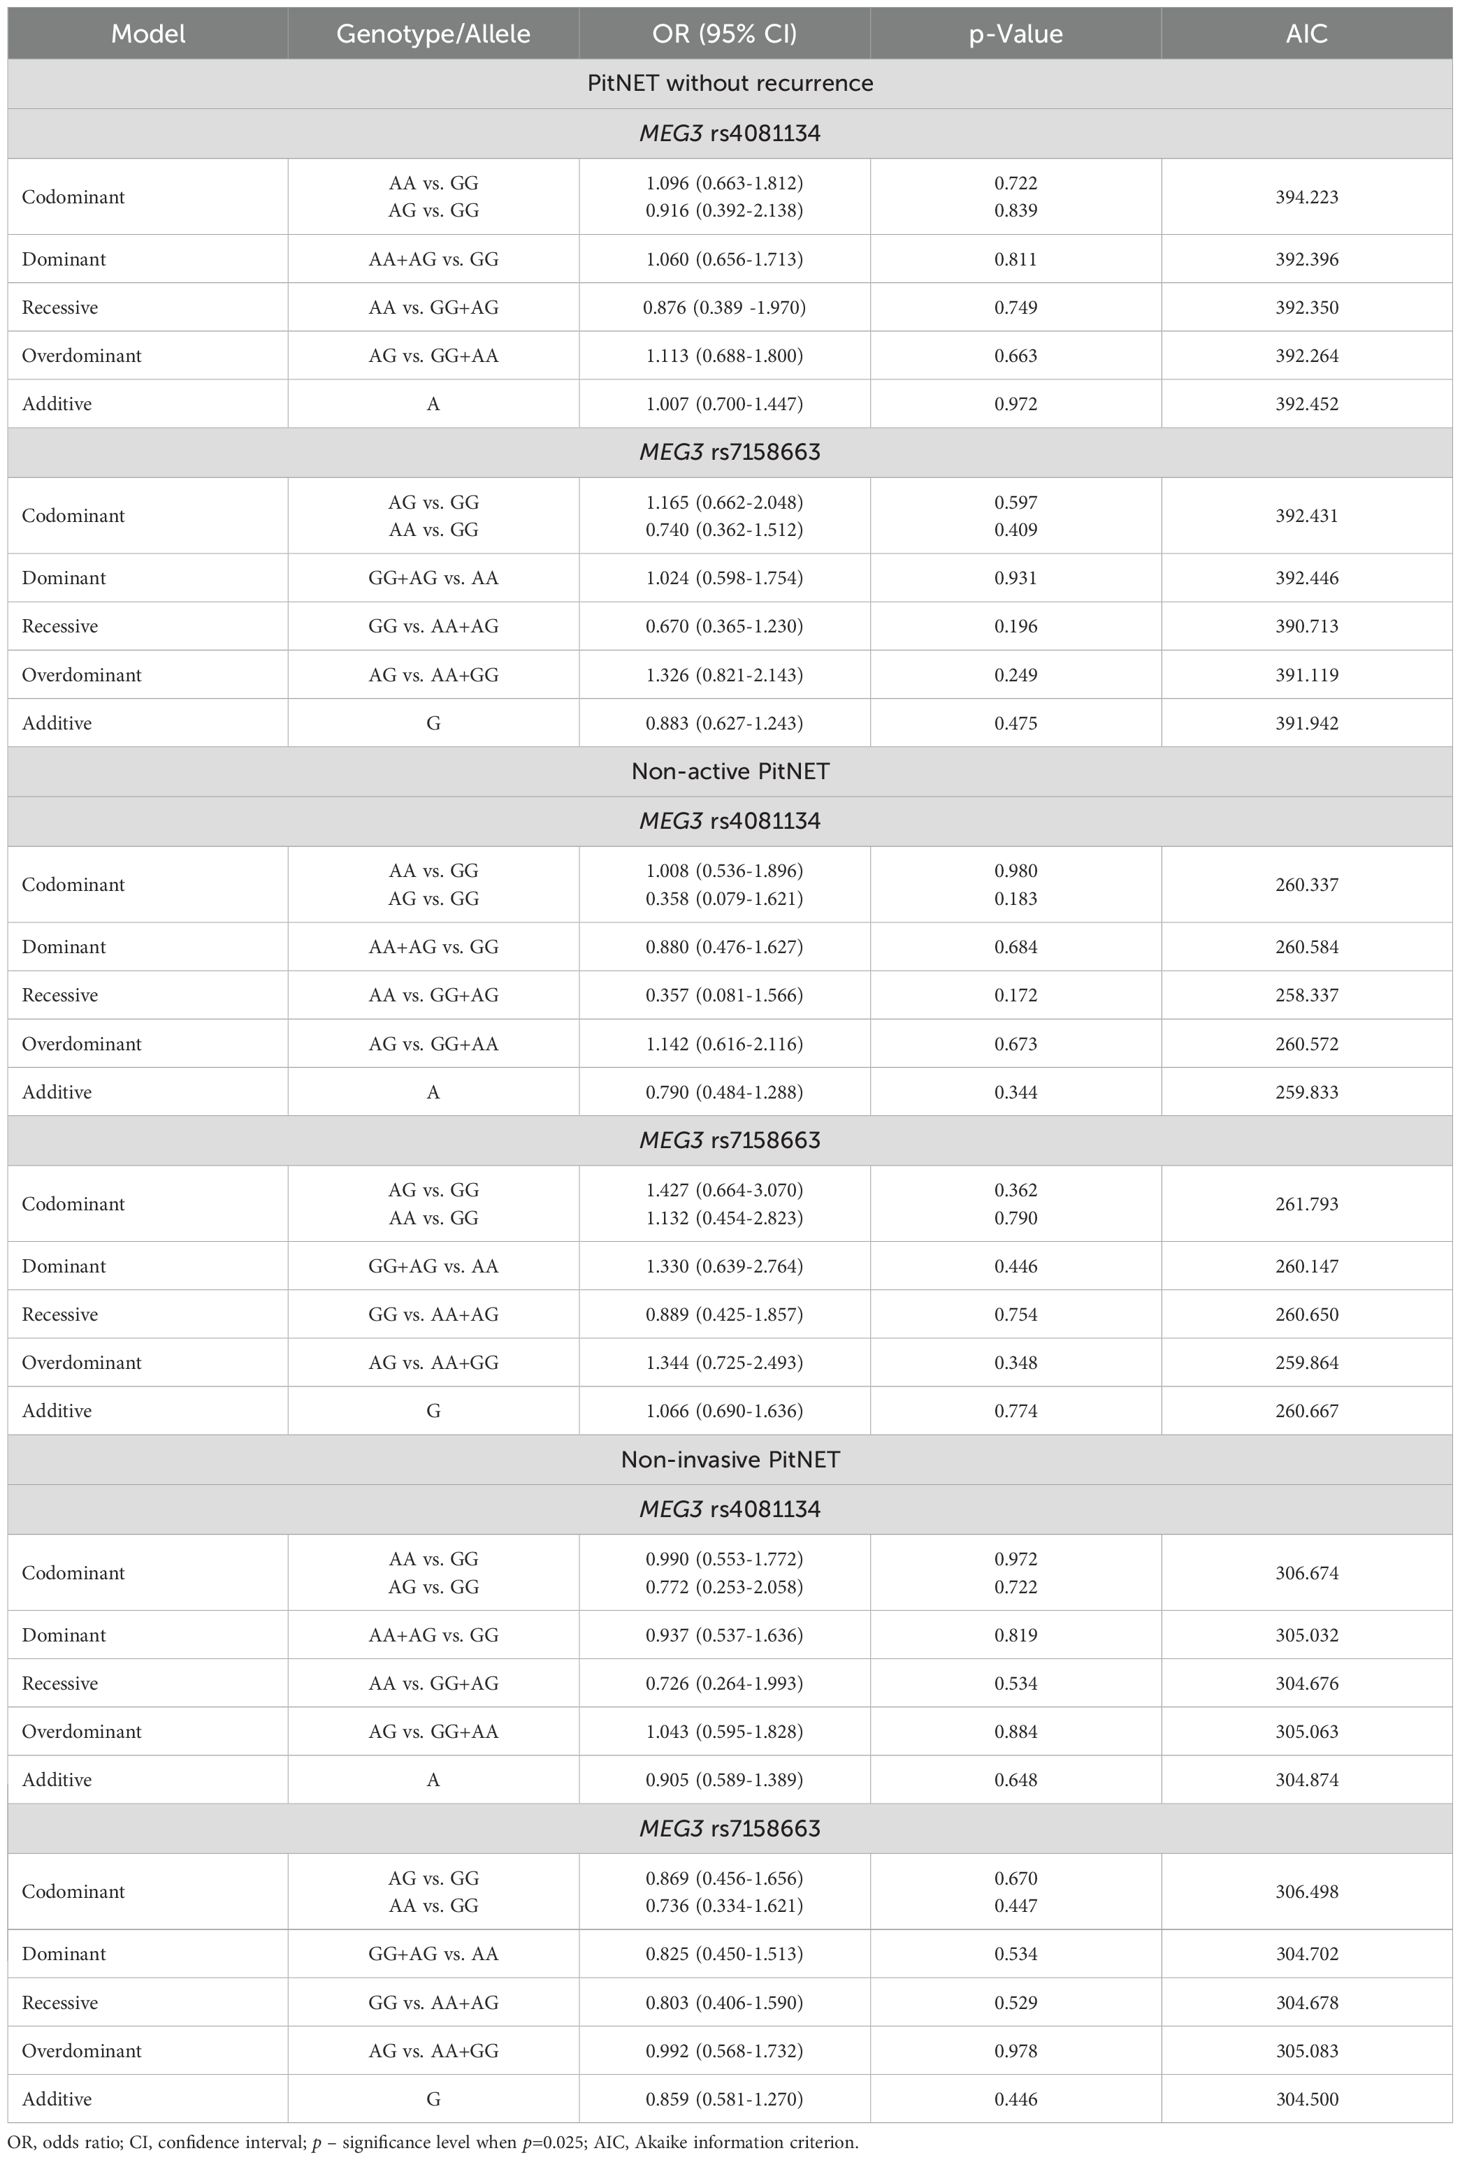
Table 15. MEG3 rs4081134 and rs7158663 binary logistic regression analysis in non-recurrent, non-functioning, and non-invasive PitNET subgroups.
3.1 Immunohistochemistry
Immunohistochemical reactions using Ki-67, p53, and CK18 biomarkers were performed in 99 PitNET patients. Statistically significant differences were found when comparing clinical features of PitNET with the p53 H-score (Table 16). Macroadenomas were found to have a statistically significantly higher p53 H-score than microadenomas (median (IQR): 27 (29.65) vs. 16 (12.84), p=0.008, respectively). In addition, invasive PitNETs had a statistically significantly higher p53 H-score than non-invasive PitNETs (median (IQR): 27 (27.99) vs. 20 (19.31), p=0.018, respectively).
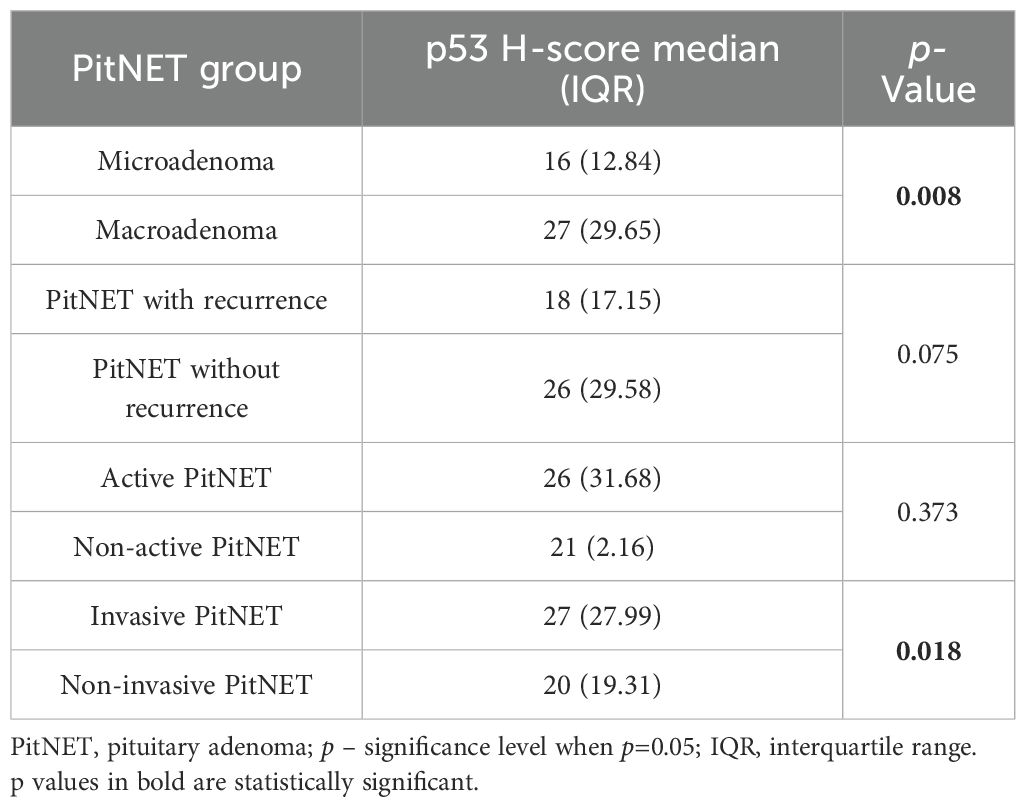
Table 16. Associations of clinical features of PitNET with p53 H-score.
Comparison of the groups with different Ki-67 LI immunohistochemical reactions (<3% and >3%) revealed no statistically significant differences between the clinical PitNET groups (Table 17).
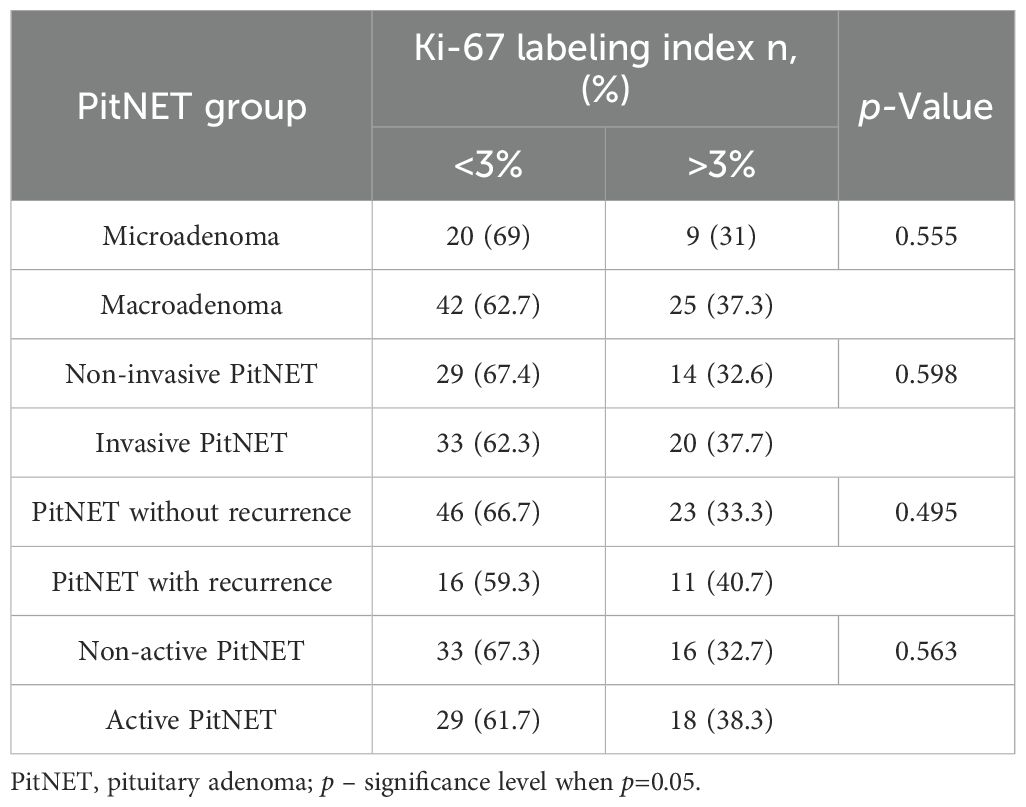
Table 17. Associations of clinical features of PitNET with Ki-67 LI.
Statistically significant differences were found when comparing the groups of PitNET clinical features with the type of CK18 immunohistochemical reaction. Invasive PitNET was found to be characterized by negative CK18 reactions compared to the non-invasive PitNET group (24 (44.4%) vs. 6 (13.3%), p < 0.001, respectively). It was also found that non-active PitNETs had negative CK18 reactions compared to functionally active PitNETs (21 (42.0%) vs. 9 (18.4%), p=0.011, respectively). No statistically significant differences were found when comparing CK18 reactions between microadenoma and macroadenoma and between PitNET with or without recurrence (Table 18).
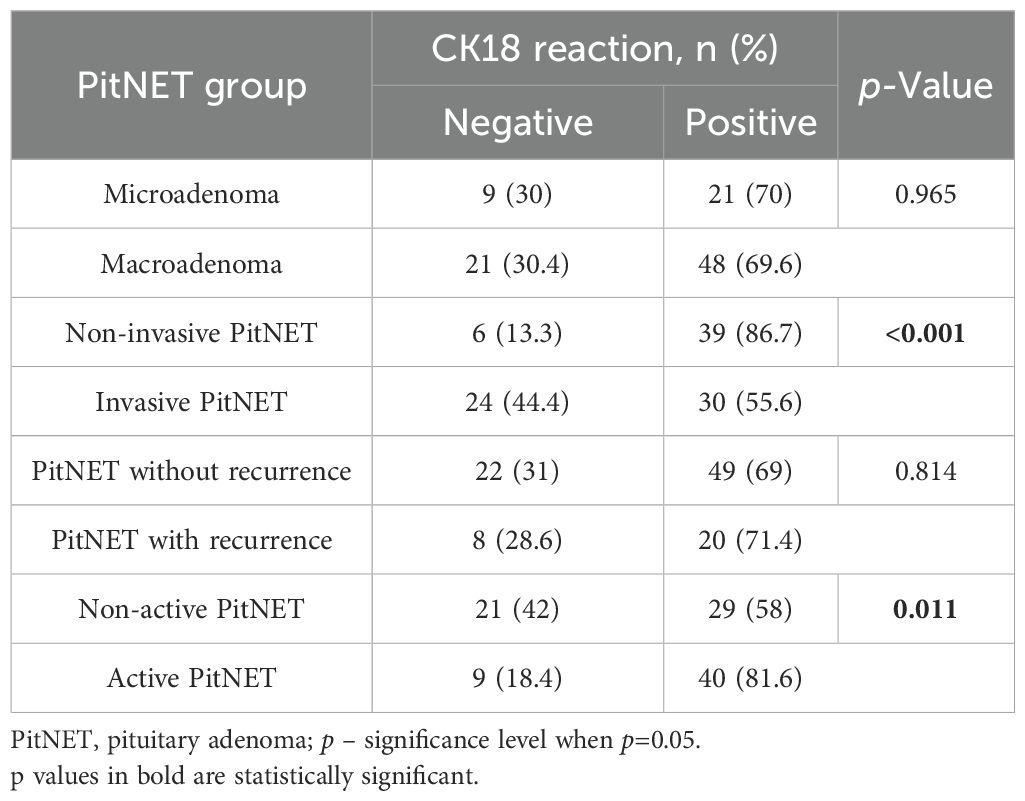
Table 18. Associations of clinical features of PitNET with CK18.
When comparing the distribution of MEG3 rs4081134 and rs7158663 variants between negative and positive CK18 immunohistochemical reaction types, no statistically significant differences were observed (Table 19).
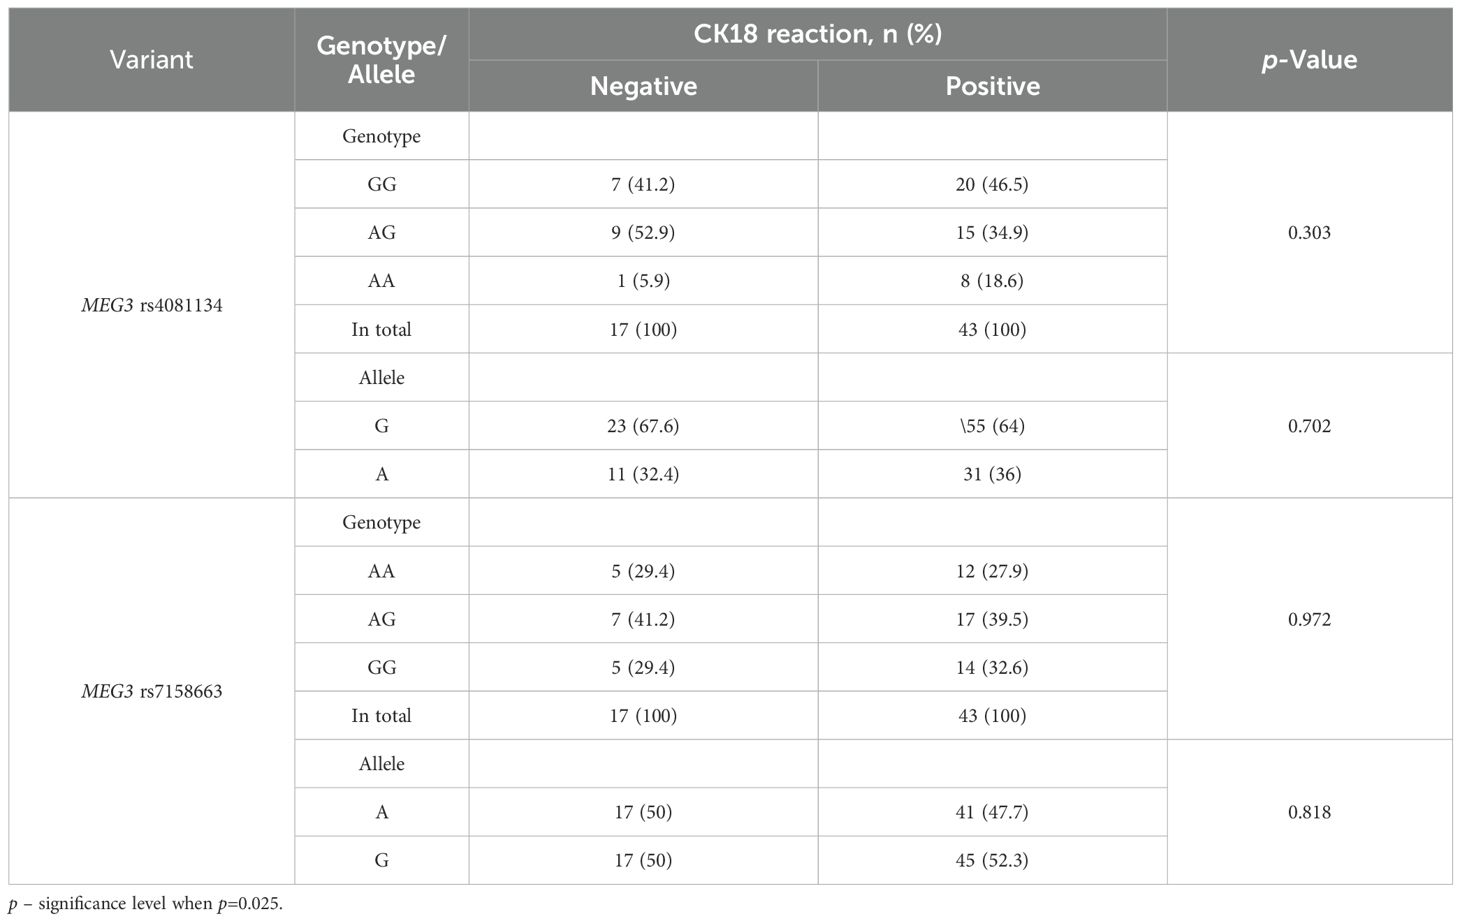
Table 19. MEG3 rs4081134 and rs7158663 genotype and allele frequencies in CK18 negative and CK18 positive reaction groups.
When comparing the distribution of MEG3 rs4081134 and rs7158663 variants between the <3% and >3% Ki-67 LI in immunohistochemical reaction groups, no statistically significant differences were observed (Table 20).
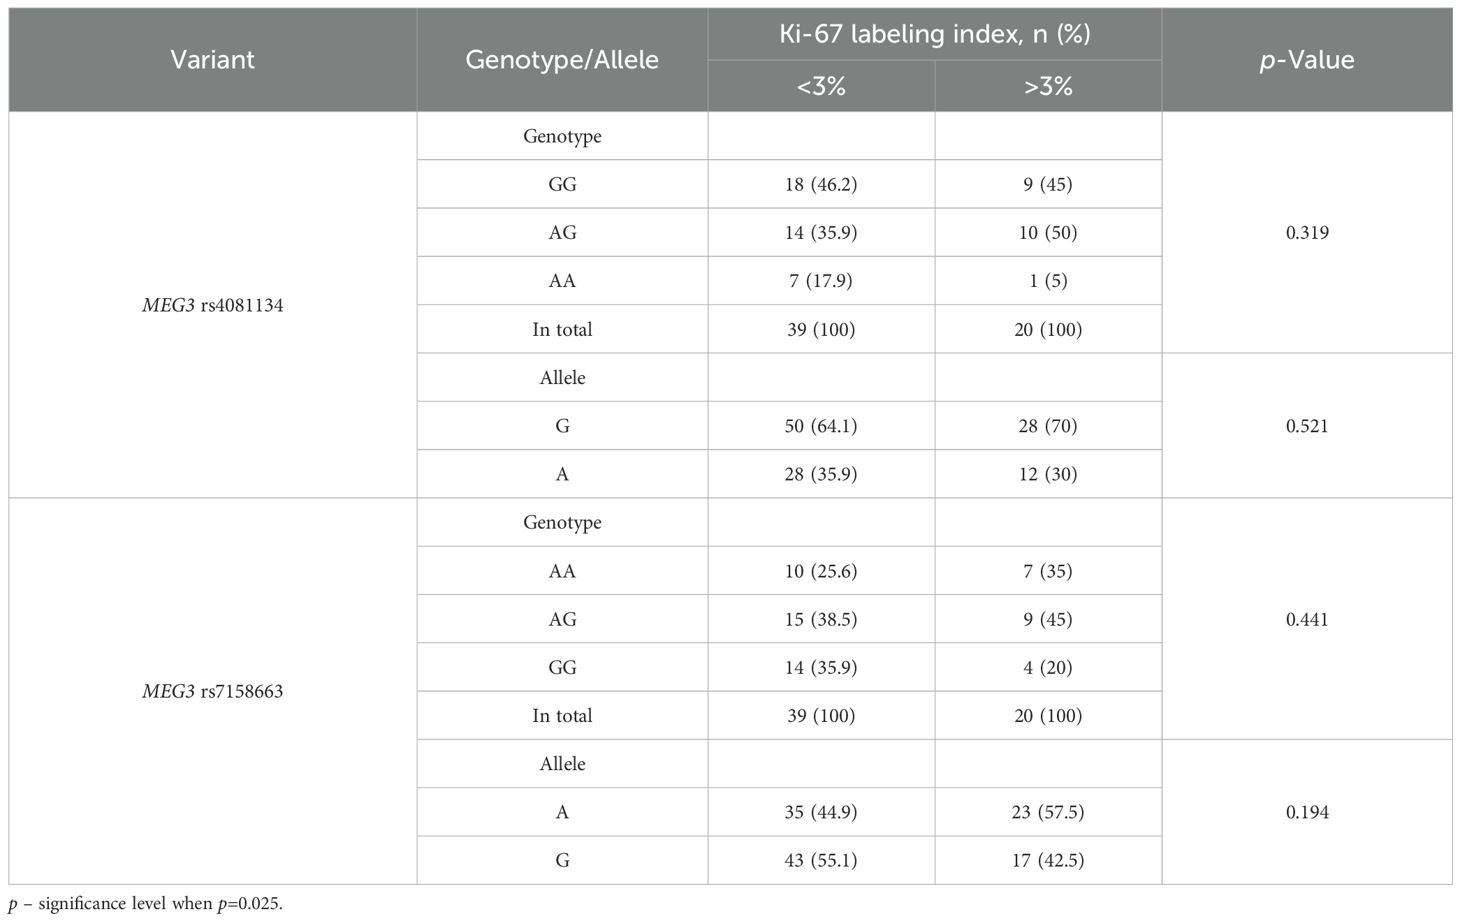
Table 20. MEG3 rs4081134 and rs7158663 genotype and allele frequencies in Ki-67 LI groups.
To evaluate the association between MEG3 rs4081134 and rs7158663 variants and p53, the p53 H-score was calculated in different genotype groups. However, no statistically significant differences were observed (Figures 1 and 2).
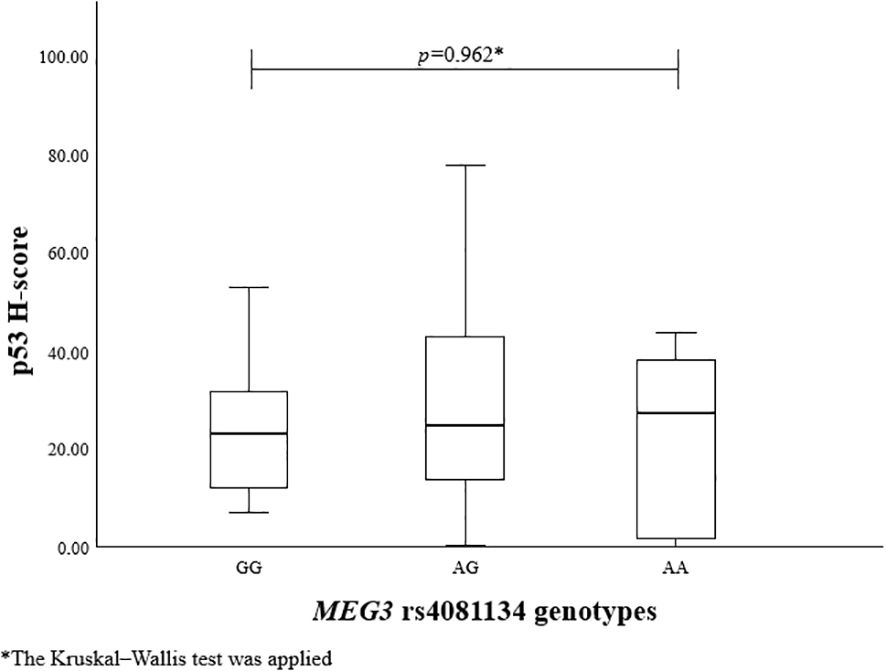
Figure 1. p53 H-score in different MEG3 rs4081134 genotype groups.
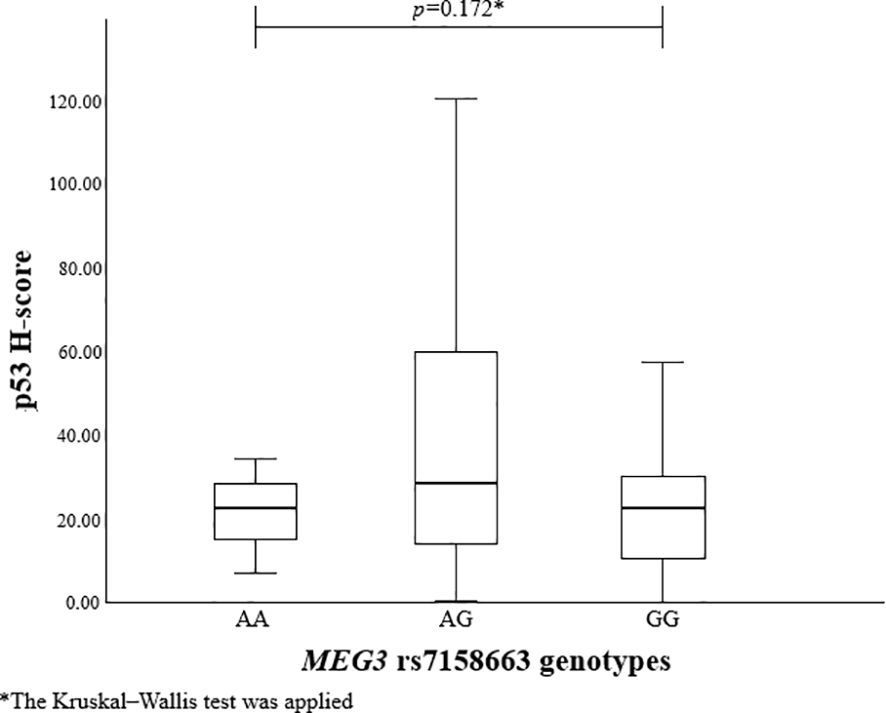
Figure 2. p53 H-score in different MEG3 rs7158663 genotype groups.
4 Discussion
Tumor biomarkers have been proven to play a crucial role in cancer screening and early diagnosis, prognosis prediction, monitoring for recurrence, and evaluating treatment response. Currently, the ongoing research for novel, highly sensitive and specific biomarkers has been a cornerstone of personalized medicine and has dramatically improved outcomes for cancer patients (35).
Our study investigated the relationships between MEG3 rs7158663 and rs4081134 variants, Ki-67 LI, p53 H-score, and CK18 immunohistochemical reactions with the clinicopathological features of PAs. MEG3 is an lncRNA mostly known to be involved in the regulation of p53 tumor suppressor gene expression. In recent years, both MEG3 and its genetic variants have received significant attention within the scientific field due to their potential involvement in tumorigenesis. Interestingly, the MEG3 rs7158663 variant is found to be associated with increased susceptibility to lung, colorectal, and gastric cancers. According to Wang and co-authors, MEG3 rs7158663 variant may disrupt the binding of specific miRNAs, such as hsa-miR-4307 and hsa-miR-1265, to MEG3. Such interference could impact gene regulation mechanisms and potentially contribute to cancer development (36). While these associations have been well-documented in multiple malignancies, it is important to highlight that the role of MEG3 and its variants, particularly rs7158663, has not been extensively studied in the context of PitNETs. Although the general function of MEG3 in tumor suppression is being gradually uncovered, its involvement in PitNET pathophysiology remains relatively unexplored. The study by Wang and co-authors showed that low MEG3 expression was significantly associated with larger PitNET size (>3 cm), increased invasiveness and advanced clinical stage (III-IV). Moreover, MEG3 overexpression was related to inhibition of pituitary cell proliferation and induction of apoptosis (37). A study conducted by Tang and colleagues demonstrated the tumor-suppressive role of MEG3 lncRNA, showing that mutations in the α subunit of the stimulatory G protein (GNAS) upregulate MEG3 lncRNA expression and are associated with less invasive growth hormone-secreting PitNETs (38). In our study, neither the MEG3 rs7158663 nor rs4081134 variants showed any significant associations with PitNETs. Furthermore, no associations were observed between the analyzed variants and Ki-67 LI, p53 H-score, or CK18 immunohistochemical reactions. These findings suggest that, despite the established relevance of MEG3 variants in other cancers, their role in PitNETs remains unclear and warrants further investigation.
Ki-67 is another biomarker that is widely studied across different types of cancer. According to the 2022 WHO Classification of Neuroendocrine Tumors, the Ki-67 LI is no longer used as a formal diagnostic criterion for PitNETs, despite being recognized as a biomarker of aggressive tumor behavior (7). However, a study by Bălinişteanu and colleagues demonstrated a significant positive correlation between prolactin expression and the Ki-67 LI. According to the researchers, no other pituitary hormone showed a statistically significant association with proliferation rate. Moreover, high Ki-67 LI (>3%) was linked to more aggressive tumor behavior, warranting closer radiological and endocrinological follow-up (39). Grimm and co-authors revealed that the Ki-67 proliferation index does not predict invasiveness or the size of PAs. In addition, the Ki-67 LI did not show any significant associations with cavernous-sine invasion (Knosp grade) (40). Conversely, a study by Yuhan and co-authors demonstrated that higher Ki-67 indices of functional PitNETs corresponded to lower Knosp grades. On the other hand, higher Ki-67 indices of nonfunctional PitNETs were associated with higher Knosp grades, indicating that nonfunctional PitNETs can grow larger and more invasive before diagnosis, allowing proliferative tumors to extend into the cavernous sinus (41). However, a recently published study emphasized that Ki-67 LI results are highly dependent on the specific assessment method used. Accordingly, Loughrey et al. proved that digital Ki-67 LI was significantly higher when scored on 1,000 cells vs. 10,000 cells, leading to a substantial margin of error when Ki-67 LI is being assessed on a lower number of cells (42). In our study, we employed a different methodology by using the hot-spot counting method to assess the Ki-67 LI, which is designed to target the most proliferative and potentially aggressive areas within the tumor. Despite this focused approach, we took a different approach in the assessment of the Ki-67 LI by using the hot-spot method, which is thought to represent the most aggressive clones within a tumor. However, no statistically significant associations were found between Ki-67 LI (<3% vs. >3%) groups and clinicopathological characteristics of PitNETs (tumor size, invasiveness, recurrence, functional activity). This lack of correlation may reflect the biological heterogeneity of PitNETs, where proliferation markers like Ki-67 alone might not sufficiently capture the complex mechanisms driving tumor behavior. Alternatively, it may suggest that Ki-67 LI, even when assessed by hot-spot analysis, has limited prognostic value when used in isolation. We also acknowledge that our Ki-67 assessment did not meet the recommended standard of 1,000–5,000 cells per sample. To address this limitation, we analyzed a relatively large cohort (99 cases) and restricted counts to 300 cells in the most proliferative regions. While this approach may slightly overestimate the proliferative fraction, it provided consistent manual evaluation across all samples.
p53 is a transcription factor responsible for modulating various stress-induced antiproliferative pathways. Despite being widely studied in different malignancies, its role in the PitNETs remains unclear (43). Wang et al. revealed that miR-219a-2-3p inhibits PitNET cell proliferation, and promotes apoptosis by modulating the MDM2/p53 axis. Accordingly, miR-219a-2-3p was significantly down-regulated in PitNET cells. However, artificial overexpression of miR-219a-2-3p inhibited PitNET cell proliferation and promoted apoptosis and p53 expression (44). Abnormal p53 expression has also been reported in poorly differentiated neuroendocrine carcinomas (NECs), correlating with aggressive behavior and poorer prognosis, whereas well-differentiated NETs typically retain normal p53 expression (45, 46). In our study, we found that a higher p53 H-score was associated with invasive PitNETs, indicating that elevated p53 expression may contribute to PitNET invasiveness. Additionally, we found that a higher p53 H-score was significantly associated with larger tumor size, showing that increased p53 expression may contribute to clinical symptoms related to tumor compression. These findings suggest that p53 immunohistochemical scoring could serve as a useful tool for risk evaluation in PitNET patients. Incorporating p53 H-score into routine clinical practice may help identify tumors at higher risk of invasiveness and aggressive growth.
To date, the relationship between CK18 immunostaining patterns and the clinicopathological features of PitNETs has not yet been established. Although, CK18 expression has been extensively studied in various other malignancies, where it is often associated with tumor differentiation, proliferative activity, and overall prognosis. Yang et al. highlighted that elevated serum CK18 levels are associated with poorer breast cancer prognosis, whereas high CK18 tissue expression indicates a better outcome. Additionally, high CK18 expression has been found to be associated with larger tumor size, stage, and grade (47). Shi and co-authors revealed that CK18 expression is suppressed in advanced and metastatic breast tumors. Moreover, CK18 loss was found to activate the NF-κB/Snail axis, leading to the upregulation of breast cancer resistance protein (BCRP) (48). Safadi et al. demonstrated that CK18 expression rises with tumor aggressiveness. Stronger CK18 immunohistochemical staining scores were significantly associated with advanced clinical stage and greater invasion of oral and oropharyngeal squamous cell carcinoma. Besides, elevated CK18 expression showed higher chances of tumor recurrence after surgical resection (49). A study by Yin et al. showed that CK18 expression in prostate cancer inversely correlates with tumor grade. Lower CK18 staining intensity was associated with higher Gleason scores (>7), indicating CK18 downregulation in aggressive prostate tumors (50). In our study, we found that invasive PitNETs are associated with negative CK18 reactions compared to the non-invasive PitNET group, showing that loss of CK18 expression may be related to PitNET tumor aggressiveness. Also, an additional consideration is the heterogeneity of CK18 staining patterns observed in our study, including diffuse, focal, cytoplasmic, perinuclear, fibrous body, and ring-like perinuclear reactions. Such variability may reflect underlying biological differences in tumor architecture or cell stress responses, and future studies are warranted to clarify whether distinct patterns (e.g., fibrous body vs. diffuse) carry prognostic or diagnostic significance. Additionally, we found that functionally inactive PitNETs are more likely to demonstrate negative CK18 reactions compared to functionally active PitNET groups, indicating that CK18 downregulation may be linked to the loss of hormonal production. As with p53, these findings suggest that CK18 immunostaining could serve as a practical biomarker in PitNETs, helping to predict tumor invasiveness and functional status.
5 Conclusion
This study found that elevated p53 H-score was significantly associated with both larger PitNET size and invasive behavior. Assuming that a higher p53 H-score can be associated with more aggressive progression of PitNET. Additionally, negative CK18 staining was significantly associated with non-functioning PitNETs and invasiveness. This result suggests that the absence of CK18 expression may indicate a more aggressive tumor phenotype and reduced hormonal activity. These findings indicate that p53 expression level and CK18 status may serve as a useful prognostic tool in PitNETs.
6 Limitations
We assessed the Ki-67 labeling index by counting 300 cells in hotspot regions across a relatively large cohort of 99 cases, ensuring consistent evaluation. Future studies with larger cohorts and automated methods may further enhance the robustness of these findings.
Data availability statement
The original contributions presented in the study are included in the article/Supplementary Material. The datasets of genotype analysis are available in the European Variation Archive repository (Project number: PRJEB96895, Analyses: HGV analysis=>ERZ28422108). Direct link: https://www.ebi.ac.uk/eva/?eva-study=PRJEB96895. The immunohistochemical data are provided in Figshare: https://doi.org/10.6084/m9.figshare.30000169.v1.
Ethics statement
Permission to conduct the study (No. BE-2-47, 14 December 2016) was granted by the Ethics Committee for Biomedical Research, Lithuanian University of Health Sciences. The studies were conducted in accordance with the local legislation and institutional requirements. The participants provided their written informed consent to participate in this study.
Author contributions
BZ: Software, Writing – review & editing, Visualization, Formal Analysis, Methodology, Writing – original draft, Data curation, Investigation. EP: Visualization, Methodology, Validation, Software, Writing – original draft, Formal Analysis, Writing – review & editing, Data curation, Investigation. MD: Investigation, Writing – review & editing, Visualization, Methodology, Writing – original draft, Data curation. JM: Investigation, Writing – original draft, Validation, Methodology, Formal Analysis, Data curation. LP: Investigation, Formal Analysis, Validation, Data curation, Writing – original draft, Methodology. VR: Writing – original draft, Methodology. S-NW: Methodology, Writing – original draft. AT: Supervision, Conceptualization, Writing – original draft, Resources, Funding acquisition. RL: Data curation, Visualization, Validation, Conceptualization, Methodology, Investigation, Supervision, Resources, Writing – original draft, Project administration, Writing – review & editing.
Funding
The author(s) declare financial support was received for the research and/or publication of this article. This research was funded by the Research Council of Lithuania under the Lithuania-Latvia-Taiwan initiative, grant No. P-LLT-23-16 and by the Research Council of Lithuania under the initiative of Researcher Group Projects, Funding No. P-ST-24-196.
Conflict of interest
The authors declare that the research was conducted in the absence of any commercial or financial relationships that could be construed as a potential conflict of interest.
Generative AI statement
The author(s) declare that no Generative AI was used in the creation of this manuscript.
Any alternative text (alt text) provided alongside figures in this article has been generated by Frontiers with the support of artificial intelligence and reasonable efforts have been made to ensure accuracy, including review by the authors wherever possible. If you identify any issues, please contact us.
Publisher’s note
All claims expressed in this article are solely those of the authors and do not necessarily represent those of their affiliated organizations, or those of the publisher, the editors and the reviewers. Any product that may be evaluated in this article, or claim that may be made by its manufacturer, is not guaranteed or endorsed by the publisher.
Supplementary material
The Supplementary Material for this article can be found online at: https://www.frontiersin.org/articles/10.3389/fendo.2025.1657520/full#supplementary-material
References
1. Tritos NA and Miller KK. Diagnosis and management of pituitary adenomas: A review. JAMA. (2023) 329:1386–98. doi: 10.1001/jama.2023.5444
2. Lee IH, Miller NR, Zan E, Tavares F, Blitz AM, Sung H, et al. Visual defects in patients with pituitary adenomas: The myth of bitemporal hemianopsia. Am J Roentgenology. (2015) 205:W512–8. doi: 10.2214/AJR.15.14527
3. Pappachan JM, Raskauskiene D, Kutty VR, and Clayton RN. Excess mortality associated with hypopituitarism in adults: A meta-analysis of observational studies. J Clin Endocrinol Metab. (2015) 100:1405–11. doi: 10.1210/jc.2014-3787
4. Melmed S, Kaiser UB, Lopes MB, Bertherat J, Syro LV, Raverot G, et al. Clinical biology of the pituitary adenoma. Endocrine Rev. (2022) 43:1003–37. doi: 10.1210/endrev/bnac010
5. Molitch ME. Nonfunctioning pituitary tumors and pituitary incidentalomas. Endocrinol Metab Clinics North America. (2008) 31:151–71. doi: 10.1016/j.ecl.2007.10.011
6. Rindi G, Mete O, Uccella S, Basturk O, La Rosa S, Brosens LAA, et al. Overview of the 2022 WHO classification of neuroendocrine neoplasms. Endocrine Pathol. (2022) 33:115–54. doi: 10.1007/s12022-022-09708-2
7. Asa SL, Mete O, Perry A, and Osamura RY. Overview of the 2022 WHO classification of pituitary tumors. Endocrine Pathol. (2022) 33:6–26. doi: 10.1007/s12022-022-09703-7
8. Zaidi HA, Cote DJ, Dunn IF, and Laws ER. Predictors of aggressive clinical phenotype among immunohistochemically confirmed atypical adenomas. J Clin Neurosci. (2016) 34:246–51. doi: 10.1016/j.jocn.2016.09.014
9. Salehi F, Agur A, Scheithauer BW, Kovacs K, Lloyd RV, and Cusimano M. KI-67 in pituitary neoplasms: A review - Part I. Neurosurgery. (2009) 65:429–37. doi: 10.1227/01.NEU.0000349930.66434.82
10. Ghafouri-Fard S and Taheri M. Maternally expressed gene 3 (MEG3): A tumor suppressor long non coding RNA. Biomedicine Pharmacotherapy. (2019) 118. doi: 10.1016/j.biopha.2019.109129
11. Zhou Y, Zhong Y, Wang Y, Zhang X, Batista DL, Gejman R, et al. Activation of p53 by MEG3 non-coding RNA. J Biol Chem. (2007) 282:24731–42. doi: 10.1074/jbc.M702029200
12. Zhu J, Liu S, Ye F, Shen Y, Tie Y, Zhu J, et al. Long noncoding RNA MEG3 interacts with p53 protein and regulates partial p53 target genes in hepatoma cells. PloS One. (2015) 10. doi: 10.1371/journal.pone.0139790
13. Mondal T, Subhash S, Vaid R, Enroth S, Uday S, Reinius B, et al. MEG3 long noncoding RNA regulates the TGF-β pathway genes through formation of RNA-DNA triplex structures. Nat Commun. (2015) 6. doi: 10.1038/ncomms8743
14. Xu J, Wang X, Zhu C, and Wang K. A review of current evidence about lncRNA MEG3: A tumor suppressor in multiple cancers. Vol. 10, Frontiers in Cell and Developmental Biology. Front Media S.A. (2022) 10. doi: 10.3389/fcell.2022.997633
15. Uxa S, Castillo-Binder P, Kohler R, Stangner K, Müller GA, and Engeland K. Ki-67 gene expression. Cell Death Differ. (2021) 28:3357–70. doi: 10.1038/s41418-021-00823-x
16. Li LT, Jiang G, Chen Q, and Zheng JN. Predic Ki67 is a promising molecular target in the diagnosis of cancer (Review). Mol Med Rep. (2015) 11:1566–72. doi: 10.3892/mmr.2014.2914
17. Trouillas J, Roy P, Sturm N, Dantony E, Cortet-Rudelli C, Viennet G, et al. A new prognostic clinicopathological classification of pituitary adenomas: A multicentric case-control study of 410 patients with 8 years post-operative follow-up. Acta Neuropathol. (2013) 126:123–35. doi: 10.1007/s00401-013-1084-y
18. La Rosa S. Diagnostic, prognostic, and predictive role of ki67 proliferative index in neuroendocrine and endocrine neoplasms: past, present, and future. Endocrine Pathol. (2023) 34:79–97. doi: 10.1007/s12022-023-09755-3
19. Almeida JP, Stephens CC, Eschbacher JM, Felicella MM, Yuen KCJ, White WL, et al. Clinical, pathologic, and imaging characteristics of pituitary null cell adenomas as defined according to the 2017 World Health Organization criteria: a case series from two pituitary centers. Pituitary. (2019) 22:514–9. doi: 10.1007/s11102-019-00981-9
20. Mete O, Cintosun A, Pressman I, and Asa SL. Epidemiology and biomarker profile of pituitary adenohypophysial tumors. In: Modern pathology. New York: Nature Publishing Group (2018). p. 900–9.
21. Balogun JA, Monsalves E, Juraschka K, Parvez K, Kucharczyk W, Mete O, et al. Null cell adenomas of the pituitary gland: an institutional review of their clinical imaging and behavioral characteristics. Endocr Pathol. (2015) 26:63–70. doi: 10.1007/s12022-014-9347-2
22. Alahmadi H, Lee D, Wilson JR, Hayhurst C, Mete O, Gentili F, et al. Clinical features of silent corticotroph adenomas. Acta Neurochir (Wien). (2012) 154:1493–8. doi: 10.1007/s00701-012-1378-1
23. Joerger AC, Stiewe T, and Soussi T. TP53: the unluckiest of genes? Cell Death Differ. (2024) 32:219–24. doi: 10.1038/s41418-024-01391-6
24. Liu Y, Su Z, Tavana O, and Gu W. Understanding the complexity of p53 in a new era of tumor suppression. Cancer Cell. (2024) 42:946–67. doi: 10.1016/j.ccell.2024.04.009
25. Stopsack KH, Salles DC, Vaselkiv JB, Grob ST, Mucci LA, and Lotan TL. p53 immunohistochemistry to identify very high-risk primary prostate cancer: A prospective cohort study with three decades of follow-up. Eur Urol Oncol. (2023) 6:110–2. doi: 10.1016/j.euo.2021.12.003
26. Raffone A, Travaglino A, Cerbone M, De Luca C, Russo D, Di Maio A, et al. Diagnostic accuracy of p53 immunohistochemistry as surrogate of TP53 sequencing in endometrial cancer. Pathol Res Pract. (2020) 216. doi: 10.1016/j.prp.2020.153025
27. Hodgson A, van Rhijn BWG, Kim SS, Ding C, Saleeb R, Vesprini D, et al. Reassessment of p53 immunohistochemistry thresholds in invasive high grade bladder cancer shows a better correlation with TP53 and FGFR3 mutations. Pathol Res Pract. (2020) 216. doi: 10.1016/j.prp.2020.153186
28. Mall R, Franke WW, Schiller DL, Geiger B, and Krepler R. The catalog of human cytokeratins: patterns of expression in normal epithelia, tumors and cultured cells review. Cell. (1982) 31. doi: 10.1016/0092-8674(82)90400-7
29. Weng YR, Cui Y, and Fang JY. Biological functions of cytokeratin 18 in cancer. Mol Cancer Res. (2012) 10:485–93. doi: 10.1158/1541-7786.MCR-11-0222
30. Menz A, Weitbrecht T, Gorbokon N, Büscheck F, Luebke AM, Kluth M, et al. Diagnostic and prognostic impact of cytokeratin 18 expression in human tumors: a tissue microarray study on 11,952 tumors. Mol Med. (2021) 27. doi: 10.1186/s10020-021-00274-7
31. Asa SL and Mete O. Cytokeratin profiles in pituitary neuroendocrine tumors. Hum Pathol. (2021) 107:87–95. doi: 10.1016/j.humpath.2020.10.004
32. Sidaraite A, Liutkeviciene R, Glebauskiene B, Vilkeviciute A, and Kriauciuniene L. Associations of cholesteryl ester transfer protein (CETP) gene variants with pituitary adenoma. Biomed Papers. (2020) 164:189–95. doi: 10.5507/bp.2019.016
33. Home–SNP–NCBI . Available online at: https://www.ncbi.nlm.nih.gov/snp/rs4081134 (Accessed 6 August 2025).
34. Home–SNP–NCBI . Available online at: https://www.ncbi.nlm.nih.gov/snp/rs7158663 (Accessed 6 August 2025).
35. Zhou Y, Tao L, Qiu J, Xu J, Yang X, Zhang Y, et al. Tumor biomarkers for diagnosis, prognosis and targeted therapy. Signal Transduction Targeted Ther. (2024) 9. doi: 10.1038/s41392-024-01823-2
36. Wang W, Xiong W, Zheng J, Jin Y, Dong L, Feng X, et al. The contribution of MALAT1 gene rs3200401 and MEG3 gene rs7158663 to the risk of lung, colorectal, gastric and liver cancer. Pathol Res Pract. (2022) 240. doi: 10.1016/j.prp.2022.154212
37. Wang X, Li X, and Wang Z. lncRNA MEG3 inhibits pituitary tumor development by participating in cell proliferation, apoptosis and EMT processes. Oncol Rep. (2021) 45. doi: 10.3892/or.2021.7991
38. Tang C, Zhong C, Zhu J, Yuan F, Yang J, Xu Y, et al. GNAS mutations suppress cell invasion by activating MEG3 in growth hormone–secreting pituitary adenoma. Oncol Res. (2024) 32:1079–91. doi: 10.32604/or.2024.046007
39. Bălinişteanu B, Cîmpean AM, Ceauşu AR, Corlan AS, Melnic E, and Raica M. High Ki-67 expression is associated with prolactin secreting pituitary adenomas. Bosn J Basic Med Sci. (2017) 17:104–8. doi: 10.17305/bjbms.2017.1750
40. Grimm F, Maurus R, Beschorner R, Naros G, Stanojevic M, Gugel I, et al. Ki-67 labeling index and expression of p53 are non-predictive for invasiveness and tumor size in functional and nonfunctional pituitary adenomas. Acta Neurochir (Wien). (2019) 161:1149–56. doi: 10.1007/s00701-019-03879-4
41. Yuhan L, Zhiqun W, Jihui T, and Renlong P. Ki-67 labeling index and Knosp classification of pituitary adenomas. Br J Neurosurg. (2024) 38:393–7. doi: 10.1080/02688697.2021.1884186
42. Loughrey PB, Greene C, McCombe KD, Sidi FA, McQuaid S, Cooke S, et al. Assessment of Ki-67 and mitoses in pituitary neuroendocrine tumours—Consistency counts. Brain Pathol. (2024) 35:e13285. doi: 10.1111/bpa.13285
43. Maleki Dana P, Sadoughi F, Mirzaei H, Asemi Z, and Yousefi B. DNA damage response and repair in the development and treatment of brain tumors. Eur J Pharmacol. (2022) 924. doi: 10.1016/j.ejphar.2022.174957
44. Wang Y, Zhao J, Zhang C, Wang P, Huang C, and Peng H. MiR-219a-2-3p suppresses cell proliferation and promotes apoptosis by targeting MDM2/p53 in pituitary adenomas cells. Biosci Biotechnol Biochem. (2020) 84:911–8. doi: 10.1080/09168451.2020.1715780
45. Yamauchi Y, Kodama Y, Shiokawa M, Kakiuchi N, Marui S, Kuwada T, et al. Rb and p53 execute distinct roles in the development of pancreatic neuroendocrine tumors. Cancer Res. (2020) 80:3620–30. doi: 10.1158/0008-5472.CAN-19-2232
46. Kanaan C, Bani MA, Ducreux M, Planchard D, Lamartina L, Moog S, et al. Diagnostic relevance of p53 and Rb status in neuroendocrine tumors G3 from different organs: an immunohistochemical study of 465 high-grade neuroendocrine neoplasms. Virchows Archiv. (2024) 486:941–50. doi: 10.1007/s00428-024-04006-0
47. Yang J, Gao S, Xu J, and Zhu J. Prognostic value and clinicopathological significance of serum- and tissue-based cytokeratin 18 express level in breast cancer: A meta-analysis. Biosci Rep. (2018) 38. doi: 10.1042/BSR20171145
48. Shi R, Wang C, Fu N, Liu L, Zhu D, Wei Z, et al. Downregulation of cytokeratin 18 enhances BCRP-mediated multidrug resistance through induction of epithelial-mesenchymal transition and predicts poor prognosis in breast cancer. Oncol Rep. (2019) 41:3015–26. doi: 10.3892/or.2019.7069
49. Safadi RA, Abdullah NI, Alaaraj RF, Bader DH, Divakar DD, Hamasha AA, et al. Clinical and histopathologic prognostic implications of the expression of cytokeratins 8, 10, 13, 14, 16, 18 and 19 in oral and oropharyngeal squamous cell carcinoma. Arch Oral Biol. (2019) 99:1–8. doi: 10.1016/j.archoralbio.2018.12.007
Keywords: pituitary adenoma, p53, CK18, Ki-67, MEG3, PitNET, immunohistochemistry, biomarkers
Citation: Zaliunas BR, Pileckaite E, Duseikaite M, Makstiene J, Poskiene L, Rovite V, Wu S-N, Tamasauskas A and Liutkeviciene R (2025) Associations of MEG3 rs7158663, rs4081134 gene variants and Ki-67, p53, CK18 immunohistochemical markers with clinical features of pituitary neuroendocrine tumors. Front. Endocrinol. 16:1657520. doi: 10.3389/fendo.2025.1657520
Received: 01 July 2025; Accepted: 15 September 2025;
Published: 09 October 2025.
Edited by:
Rosario Pivonello, University of Naples Federico II, ItalyReviewed by:
Masaaki Yamamoto, Cedars-Sinai, United StatesDario Fontanelli, Federico II University Hospital, Italy
Copyright © 2025 Zaliunas, Pileckaite, Duseikaite, Makstiene, Poskiene, Rovite, Wu, Tamasauskas and Liutkeviciene. This is an open-access article distributed under the terms of the Creative Commons Attribution License (CC BY). The use, distribution or reproduction in other forums is permitted, provided the original author(s) and the copyright owner(s) are credited and that the original publication in this journal is cited, in accordance with accepted academic practice. No use, distribution or reproduction is permitted which does not comply with these terms.
*Correspondence: Enrika Pileckaite, ZW5yaWthLnBpbGVja2FpdGVAbHNtdS5sdA==; Monika Duseikaite, bW9uaWthLmR1c2Vpa2FpdGVAbHNtdS5sdA==