 Haixiao Chen1Kezhen Huang1Caihui Ma1Jie Geng1
 Lanlan Liu1,2Zhenfang Liu1Xuhong Na1
 Xiaoming Jiang1
 Jiali Cai1,2*
 Jianzhi Ren1*
- 1Reproductive Medicine Center, Xiamen University Affiliated Chenggong Hospital, Xiamen, Fujian, China
- 2School of Medicine, Xiamen University, Xiamen, Fujian, China
Background: E2 is important in follicular development. During monitoring of stimulated cycles, serum levels of E2 are expected to increase steadily with follicle growth until final maturation. Unexpected E2 decline before triggering is reported in monitored COS cycles, yet its clinical significance remains controversial.
Methods: The retrospective study was carried out in 27,487 conventional COS cycles at Xiamen University Affiliated Chenggong Hospital between January 2013 and December 2021. The occurrence of E2 decline during the monitoring was defined as the observation of a lower E2 value than the previous visit. Propensity matching and multivariate generalized linear models were used to analyze the association between E2 decline and cumulative live birth rates (CLBRs).
Results: A total of 2,863 (10.3%) patients with E2 decline during COS monitoring were identified. In both unmatched and matched cohorts, the CLBRs were significantly decreased (unmatched cohort: 66.3% versus 55%, P<0.001, adjusted OR 0.83, 95% CI: 0.76,0.91; matched cohort: 59% versus 55%, P = 0.003, adjusted OR 0.84, 95%CI: 0.75,0.94). The E2 decline also decreased the oocyte yield and embryo yield, but the live birth following fresh transfer was not affected after matching. Mediation analyses showed that the decrease in CLBR was primarily due to decreased embryo yield in both unmatched (76.5% mediated, P = 0.002) and matched cohorts (72.5% mediated, P = 0.01). Subgroup analyses suggested that increasing the gonadotropin (Gn) dose did not improve CLBR (adjusted OR 0.91, 95% CI: 0.71,1.16). However, the patients with two consecutive declines in two visits may have worse outcomes (adjusted OR 0.72, 95% CI: 0.56,0.94).
Conclusions: Although E2 is frequently monitored during COS, the value of routine E2 monitoring during COS has already been questioned. Our data suggest that the decline in E2 during COS monitoring is associated with the CLBR following a complete cycle, indicating it remains a critical biomarker in predicting the outcomes during COS. However, the overall size of the association is modest, and further attention should be paid to specific subgroups of patients, such as patients with consecutive E2 decline.
Introduction
Controlled ovarian stimulation (COS) is a fundamental component of assisted reproductive technologies (ART) (1). It maximizes the potential for successful outcomes by stimulating multiple follicles to mature simultaneously, thereby increasing the availability of viable embryos for transfer. However, multiple follicle growth also raises concerns regarding the excessive ovarian response. During the process, follicular development and serum E2 are closely monitored to justify the decision to trigger oocyte maturation and in the prevention of ovarian hyperstimulation syndrome (OHSS) (2, 3).
The importance of E2 in follicular development in both natural and stimulated cycles has been well-established, as it is secreted by the granulosa cells (GC) in response to endogenous or exogenous follicle-stimulating hormone (FSH) stimulation to support the follicular growth and maturation (4). During monitoring of stimulated cycles, serum levels of E2 are expected to increase steadily with follicle growth until final maturation (5). However, unexpected E2 decline during COS monitoring is also reported in monitored COS cycles, yet its clinical significance remains controversial. An early study suggested that a decline in serum E2 before triggering is associated with a dramatically decreased pregnancy rate (6). However, milder effects or no effect of E2 decline during COS monitoring are also reported in other studies (7). The conflicting conclusions surrounding the clinical significance of E2 decline during COS can be attributed to various factors, such as limited sample size, heterogeneity of patients, or failure to adjust for important confounders. Importantly, previous research has predominantly focused on the outcomes of the fresh transfer, where patients with excessive ovarian response and patients with very poor response may both be excluded from the fresh transfer cycle. Selection bias may occur when paitents being included in the study basing of their exposure or outcomes status (8). In addition, the role of chance may also be a consideration when only fresh transfer is evaluated. Due to the morphology-based embryo selection having only limited discriminatory power (9), the “correct” embryos may be selected following multiple transfers.
Evaluating the cumulative birth rates taking into account all transfer attempts in a complete COS cycle (10) may minimize the bias associated with fresh transfer and the random effect of embryo selection. Moreover, the majority of the previous studies have associated the E2 decline with decreased fertilization or reduced embryo yield, suggesting fewer chances of transfer attempts (11–13). We hypothesize that an E2 decline observed during COS monitoring may compromise the cumulative live birth via the mediation of reduced embryo yield, even if the fresh transfer outcomes are not affected. The present study aims to evaluate the impact of E2 decline during COS monitoring on the cumulative live birth rate in a large COS cohort, exploring the mediation effect of embryo yield and the contribution of patient heterogeneity.
Materials and methods
Study subjects
We reviewed all patients who underwent ovarian stimulation for assisted reproductive technologies at Xiamen University Affiliated Chenggong Hospital between January 2013 and December 2021 for potential inclusion. The study was approved by the Institutional Review Board (IRB) of Xiamen University Affiliated Chenggong Hospital. Since the research was based on non-identifiable records, as approved by the IRB, obtaining informed consent was not required.
Due to the primary goal of the study being to evaluate the cumulative live birth following a complete cycle, the inclusion criteria were patients who achieved at least one live birth during the cycle or patients who had all their embryos transferred. The patients with surplus embryos but without a live birth (n=7767) were excluded. The exclusion criteria were patients who received non-conventional ovarian stimulation protocols such as natural, mild, or luteal phase cycles(n=1224), and cycles with errors in data input (n=3). The inclusion/exclusion criteria were detailed in a flowchart (Figure 1).
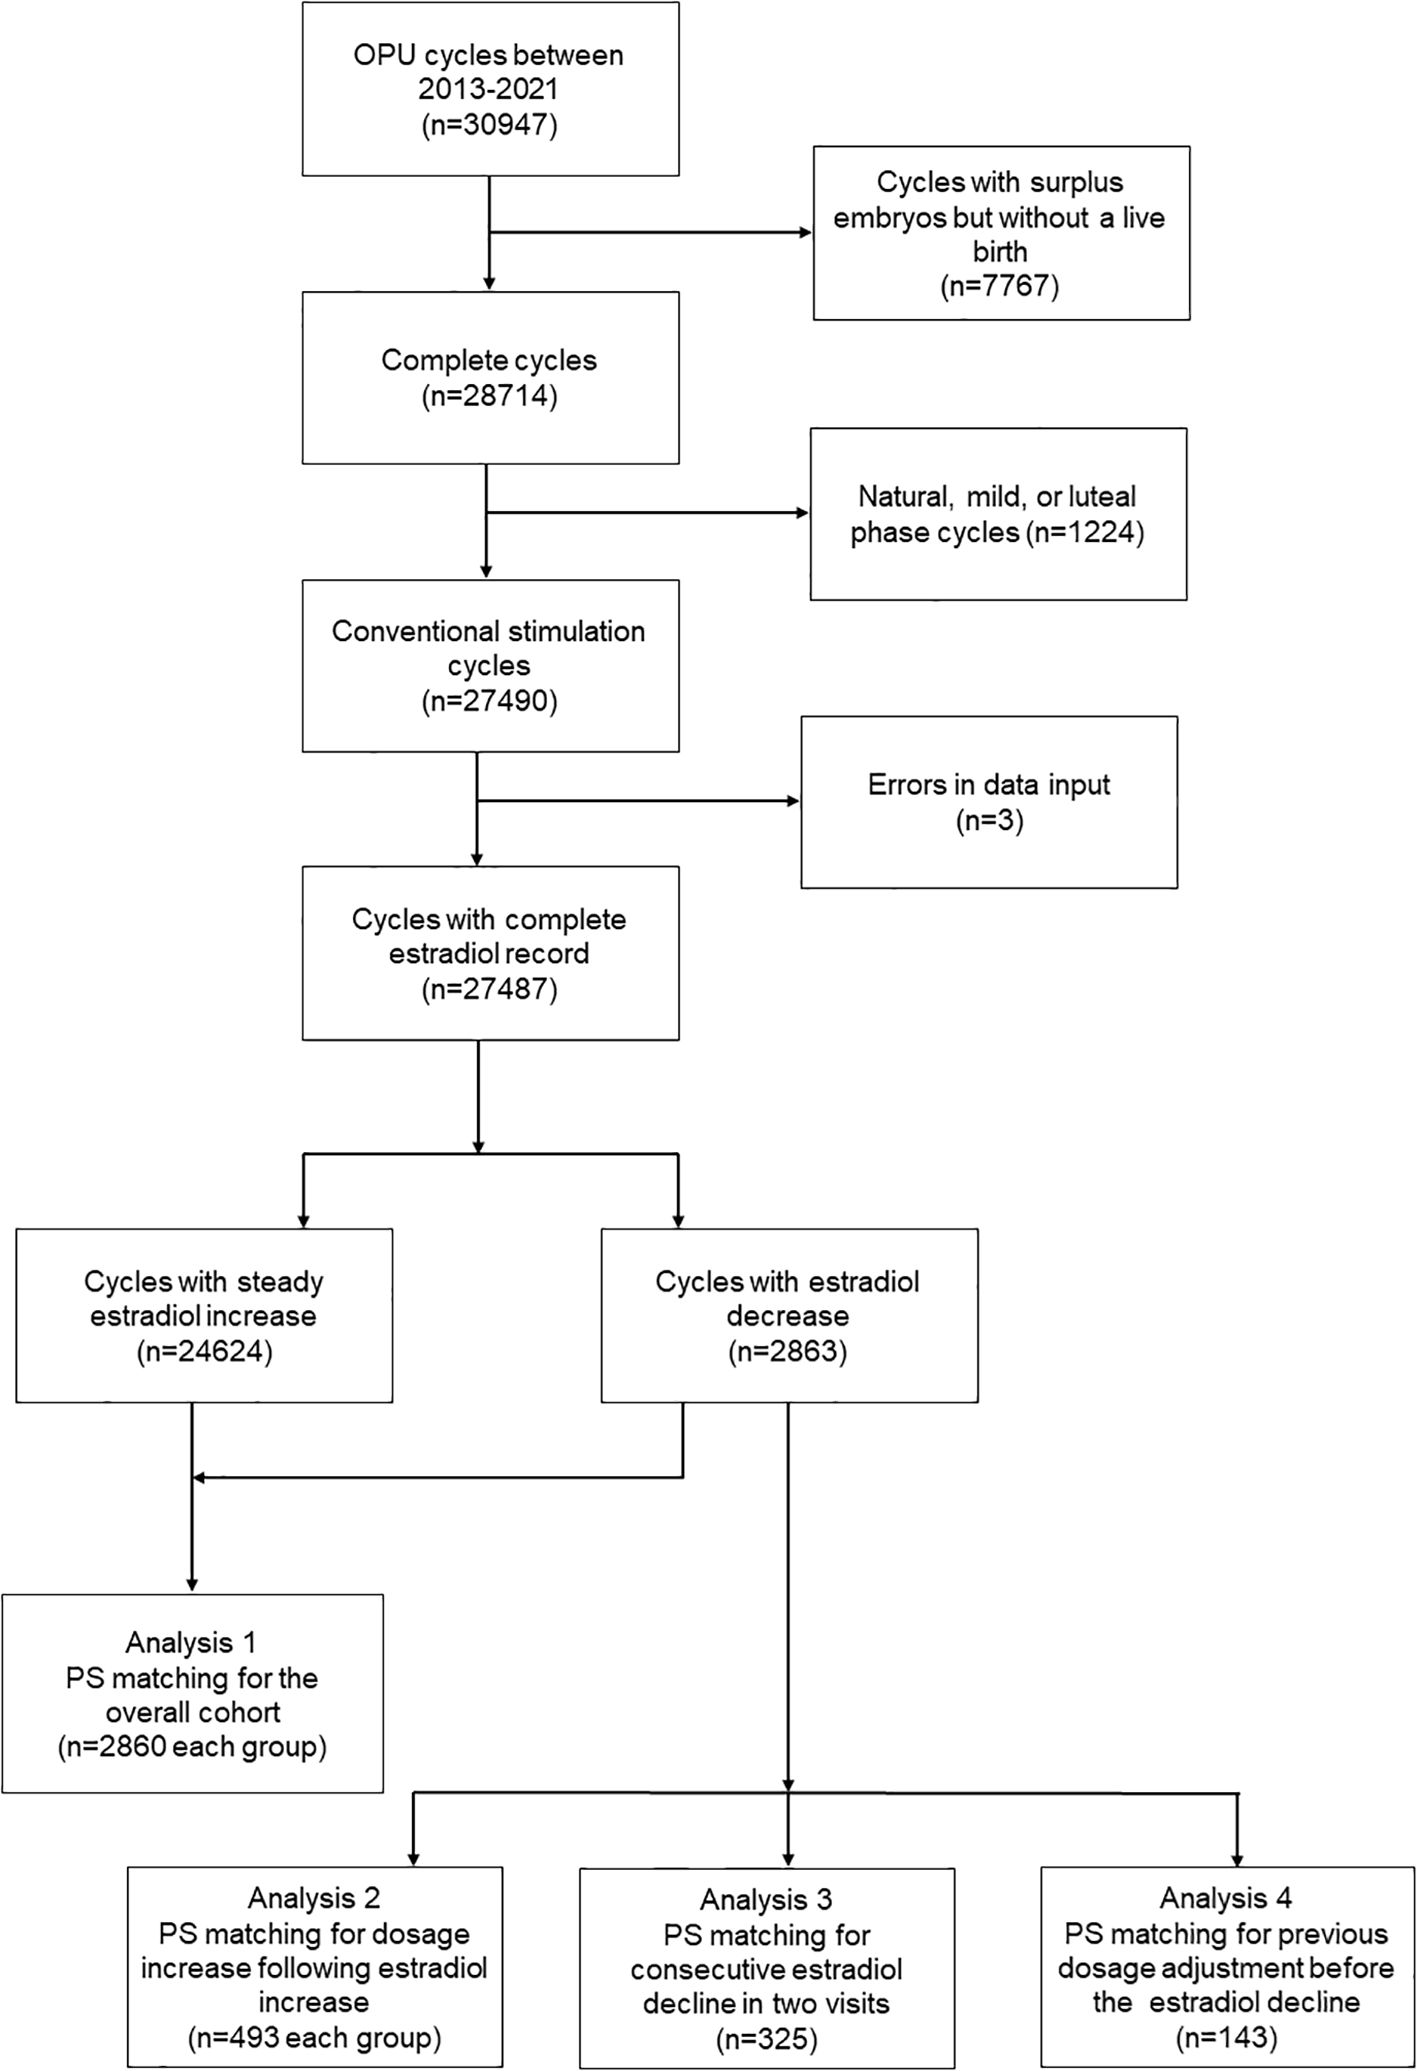
Figure 1. A flow chart for patient inclusion.
Ovarian stimulation and monitoring
During the stimulation cycle, all patients received either the agonist or antagonist protocol and were administered follicle-stimulating hormone (FSH) or human menopausal gonadotropin (hMG), as previously described (14). The starting dose of gonadotropins (Gn) for ovarian stimulation ranged from 75 to 300 IU, determined according to the patient’s age, BMI, and ovarian reserve. Following the initiation of stimulation, the patient returned for the next visit in 4 to 6 days if the diameter of the follicle was less than 1.2 cm. When the diameter of the follicle was greater than 1.2 cm, the patient returned for monitoring every 1 to 2 days. In each visit during COS, the development of follicles was monitored under transvaginal ultrasonic examination, and the serum levels of serum follicle-stimulating hormone (FSH), estradiol (E2), and luteinizing hormone (LH) were also evaluated. Gn dosage adjustment may occur following a visit on the clinician’s decision, according to the outcomes of monitoring. The occurrence of a decrease in estradiol during the monitoring period was defined as observing an estradiol value lower than that of the previous follow-up.
Once ultrasonography confirmed that the average diameter of at least one follicle reached 18 mm or the diameter of two dominant follicles reached 17 millimeters, 200-250 μg of recombinant human chorionic gonadotropin injection (r-HCG, Ovitrelle, Merck Serono, Germany) would be administered subcutaneously to promote the final maturation of the follicles. Transvaginal ultrasound-guided oocyte retrieval was performed 35 to 37 hours after hCG administration. The occurrence of E2 decline during the monitoring was defined as the observation of a lower E2 value than the previous visit.
Laboratory procedures
The oocytes were inseminated through either conventional in vitro fertilization (IVF) or intracytoplasmic sperm injection (ICSI) and cultured in individual droplets with oil overlay (OVOIL, Vitrolife, Göteborg, Sweden) in COOK culture mediums (COOK MEDICAL, Bloomington, IN). Conventional incubators (C200, Labotect, G¨ottingen, Germany) at 37 °C, 6% CO2, and 5% O2 in a humidified atmosphere were used for the in vitro culture. On day 3, the quality of embryos was scored manually according to the criteria of the Istanbul consensus (12). Patients would receive blastocyst culture according to the preference of the patients or clinicians. The blastocysts were scored according to the Gardner criteria (15).
For both cleavages and blastocysts, a vitrification protocol, employing 15% (v/v) dimethyl sulfoxide, 15% (v/v) ethylene glycol, and 0.6 M sucrose as cryoprotectants, was used for potential cryopreservation. A laser system (SATURN, RI, Falmouth, UK) was used for blastocyst collapse before vitrification.
Pregnancy and live birth evaluation criteria
The criteria for judging live births in obstetrics follow the definition of the World Health Organization (WHO) (16). A live birth event is confirmed as a complete expulsion or extraction from its mother of a product of fertilization, irrespective of the duration of the pregnancy, which, after such separation, breathes or shows any other evidence of life, such as heart beat, umbilical cord pulsation, or definite movement of voluntary muscles, irrespective of whether the umbilical cord has been cut or the placenta is attached.
The cumulative live birth as the primary outcome of interest was defined as the first live birth event within a complete cycle. A complete cycle was defined as an OPU cycle that achieves at least one live birth event or has all resulting embryos transferred.
Statistics
The association between E2 decline during ovarian stimulation monitoring and cumulative live birth was evaluated using a generalized linear model (GLM) and propensity score matching (PS-matching). For PS-matching, a MatchIt package in R software was used (17). The cobalt package (18) was used to test the balance. Standard differences (D) were calculated to evaluate the balance of the distribution of the baseline characteristics between the groups before and after PS matching. D < 0.1 was used as the threshold to indicate a negligible difference in the mean or prevalence of a covariate (19). The balance of covariates was also examined by the distribution of propensity score (distance) between matched groups.
The covariates and confounders for the analyses were selected based on previous knowledge and clinical experience with the assistance of a direct acyclic graph (DAG). The DAG was created by DAGitty software (https://dagitty.net/dags.html) and shown as a supplementary figure (Supplementary Figure S1). With a hypothesized association between E2 decline and cumulative pregnancy, the covariates that are associated with both the E2 decline (P<0.1 in the dataset) and cumulative live birth (20) were adjusted. These covariates included female age and BMI, fertility-related diagnosis (duration of infertility, tubal factor, endometriosis, PCOS), ovarian reserve markers (basal FSH, LH, and AFC), and ovarian stimulation (protocol and starting dosage). The analyses were also adjusted for potential confounders, including male factors (male age, BMI, total motile sperm count, and sperm normal morphology), insemination protocols (ICSI versus IVF), and clinical decisions (freeze-all and blastocyst culture) (20–23).
To test the hypothesis that E2 decline during monitoring affects the cumulative live birth via decreasing the embryo viability, we used the “mediation” packages to calculate the proportion of the total effect of E2 decline mediated by the average causal mediation effect (ACME) of the associated decreased embryo number.
To investigate whether a dose-dependent association exists between E2 decline and cumulative live birth, the association was also analyzed using generalized additive models (GAM) adjusted for the aforementioned covariates. The E2 decline was analyzed as continuous values and natural log-transformed. A “gratia” (Graceful ‘ggplot’-based graphics and utility functions for working with GAMs fitted using the ‘mgcv’) package was used to identify the potential turning point incorporated with the shape of the resulting curves. The package divided the range of E2 decline to 1000 points, and derivatives were calculated at each point based on the GAM model. Where the derivatives changed significantly (from indistinguishable from 0 to distinguishable from 0 or vice versa), the threshold was defined.
To explore the heterogeneity among patients with E2 decline, we also carried out PS-matching in patients with and without Gonadotropin (Gn) increase following E2 decrease, patients with and without consecutive decline at two visits, and patients with and without Gn adjustment before E2 decline.
E-values were introduced to measure the minimum strength of association that an unmeasured confounder would need to have to fully explain away the association of interest. The E-values were calculated using the R package “EValue”.
For descriptive analyses, continuous variables were analyzed using the Wilcoxon test, and categorical variables were analyzed using the chi-square test or Fisher’s exact test; P < 0.05 was considered to be significant. All analyses were performed using R statistical software 4.12 (24).
Results
In this study, 30947 ART cycles were reviewed for potential inclusion, and 27487 cycles were finally included. The number of cycles that underwent at least one E2 decline was 2863 (10.3%). The characteristics of the patients are shown in Table 1. The patients encountering E2 decline during ovarian stimulation monitoring were associated with older female age, higher BMI, poorer AFC, and a lower proportion of agonist cycle. However, they also have a higher proportion of PCOS diagnoses and a history of delivering live births. Some of the characteristics of male counterparts, including age and Total motile sperm count (TMC), were also significantly different between patients with and without E2 decline. Following PS-matching, the standardized differences (D) for all the covariates were lower than 0.1, and the distribution of propensity scores (distance) was identical between comparison groups (Supplementary Figure S2).
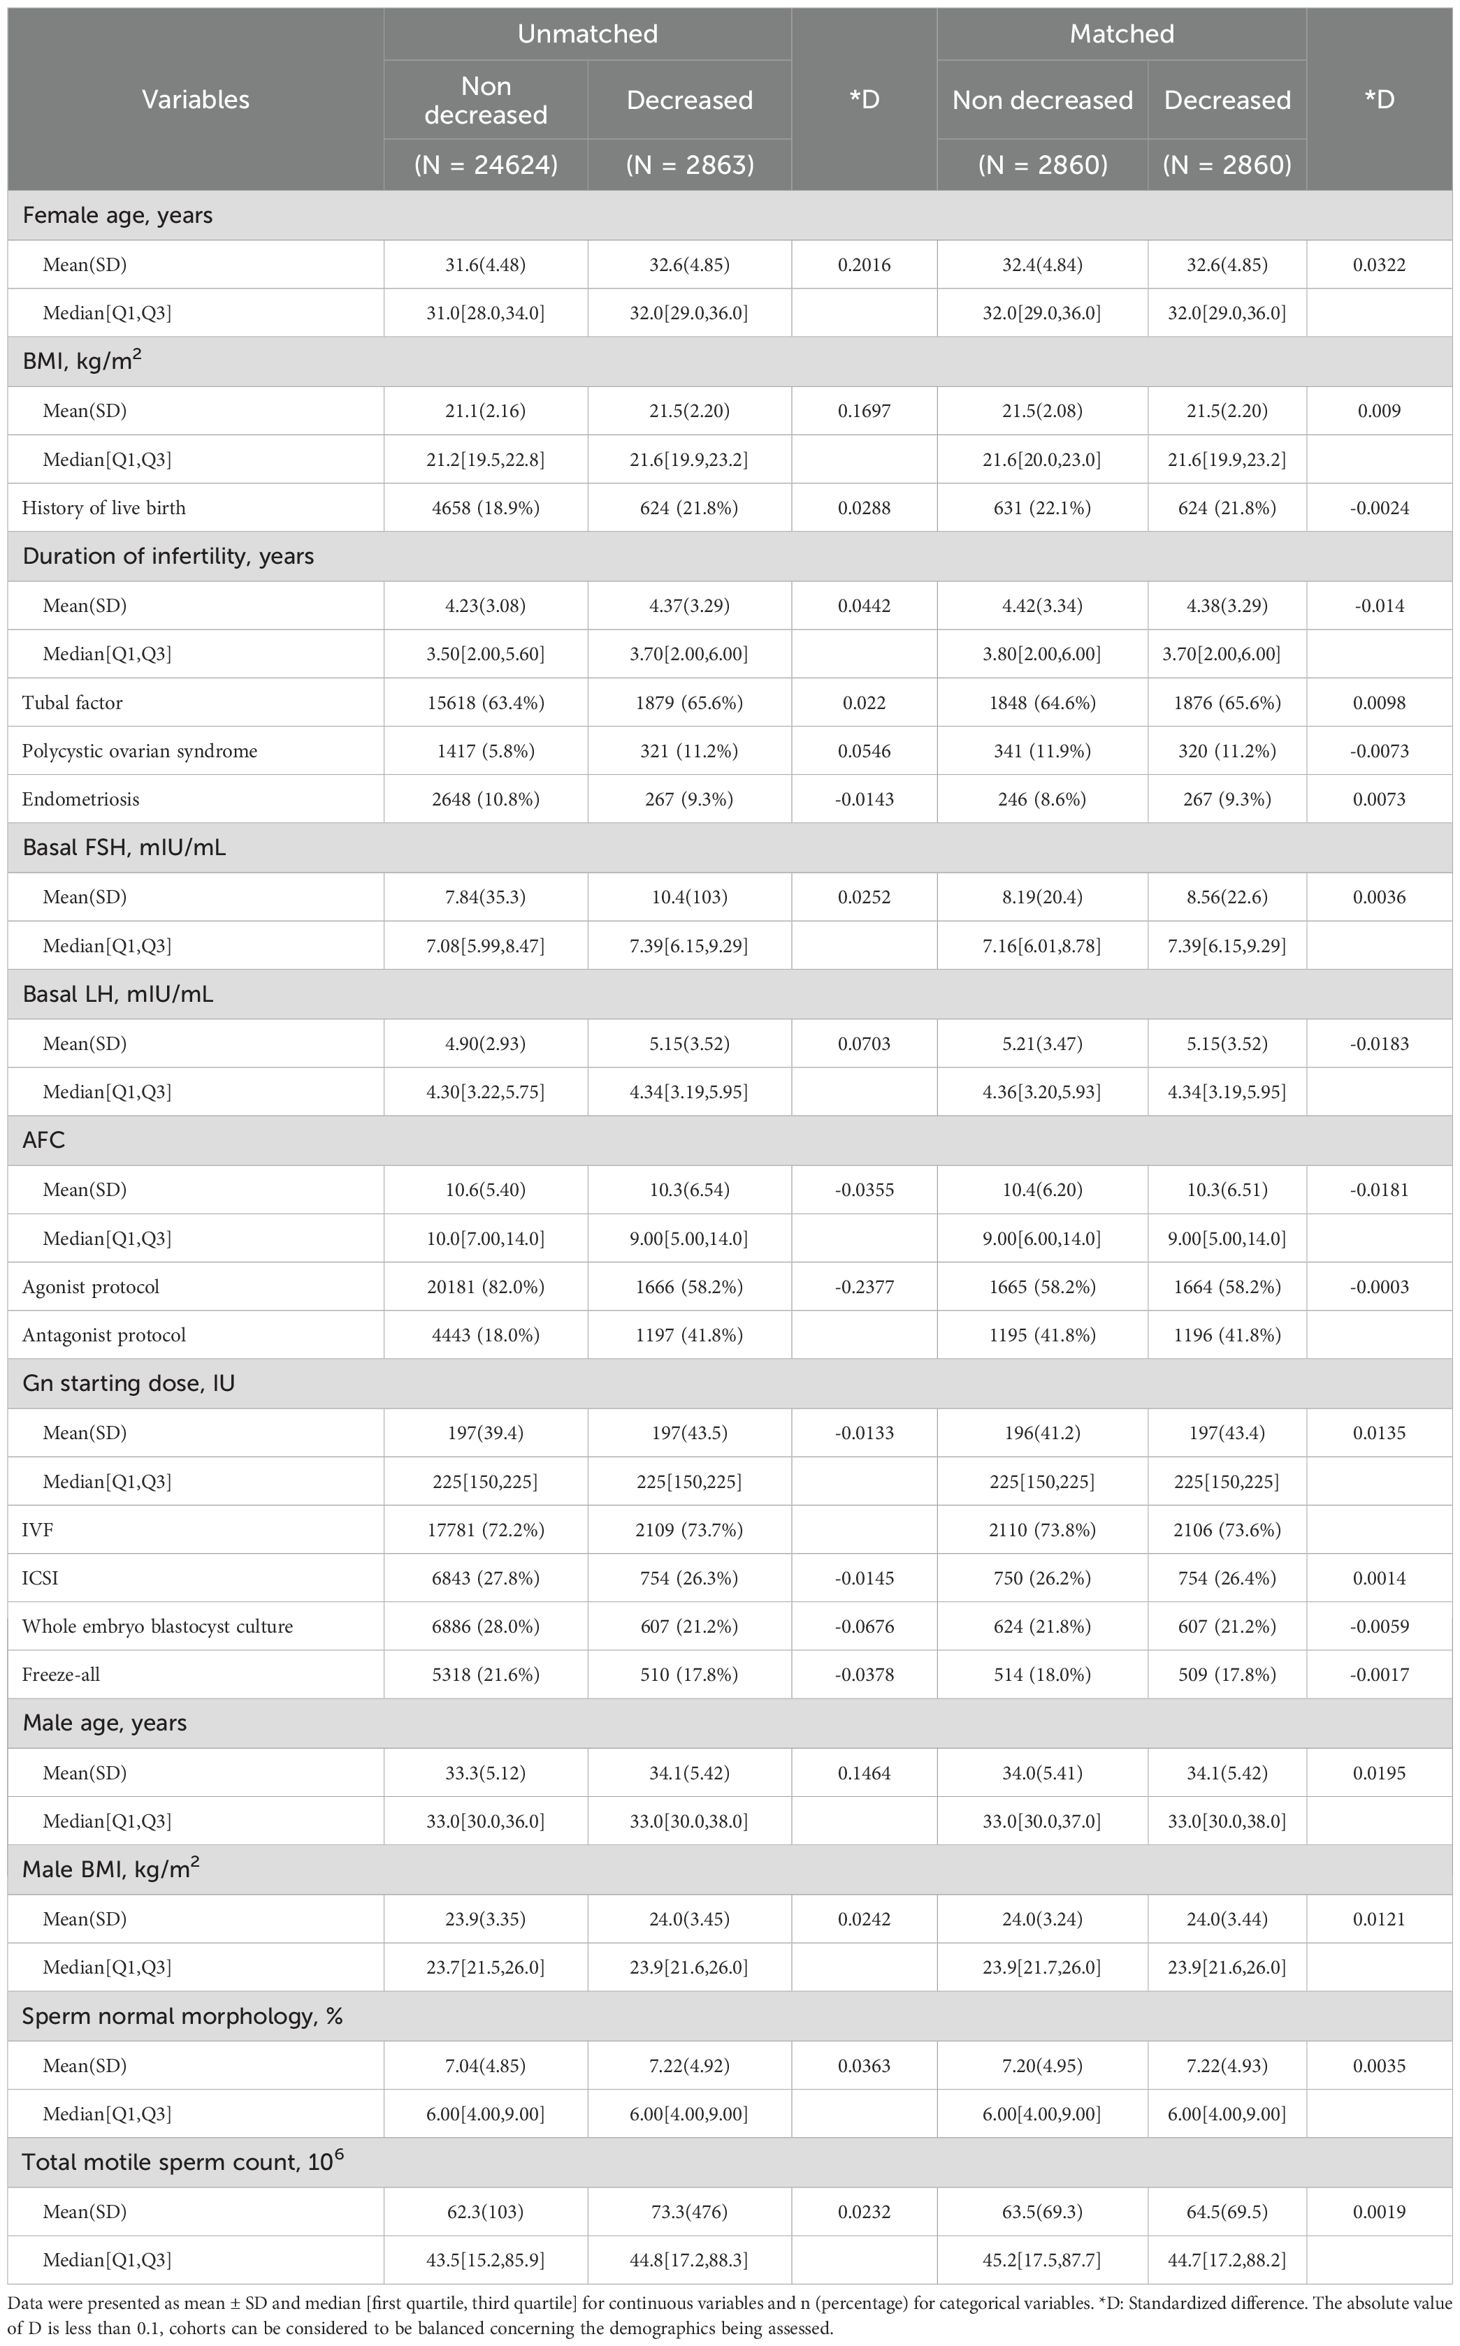
Table 1. Characteristics of patients with and without unexpected estradiol decrease during monitoring.
Table 2 shows the outcomes of patients with or without E2 decreased. The decrease in E2 levels during monitoring was associated with poorer ovarian response, which led to a prolonged duration of stimulation, increased total gonadotropin dosage, and a lower oocyte yield in both matched and unmatched cohorts. The number of mature oocytes, embryos, and high-quality embryos also decreased accordingly. These changes ultimately resulted in approximately a 4% difference (59% VS 55%, P = 0.002) in the cumulative live birth rate in the matched cohort. In the multivariate GLM analyses, the adjusted odds ratios (OR) for cumulative live birth were similar in the unmatched and the matched cohort (OR 0.83, 95% CI: 0.76,0.91 for the unmatched cohort; OR 0.84, 95%CI: 0.75,0.94). On the other hand, the live birth following fresh transfer did not significantly differ between patients with and without an E2 decline after PS-matching.
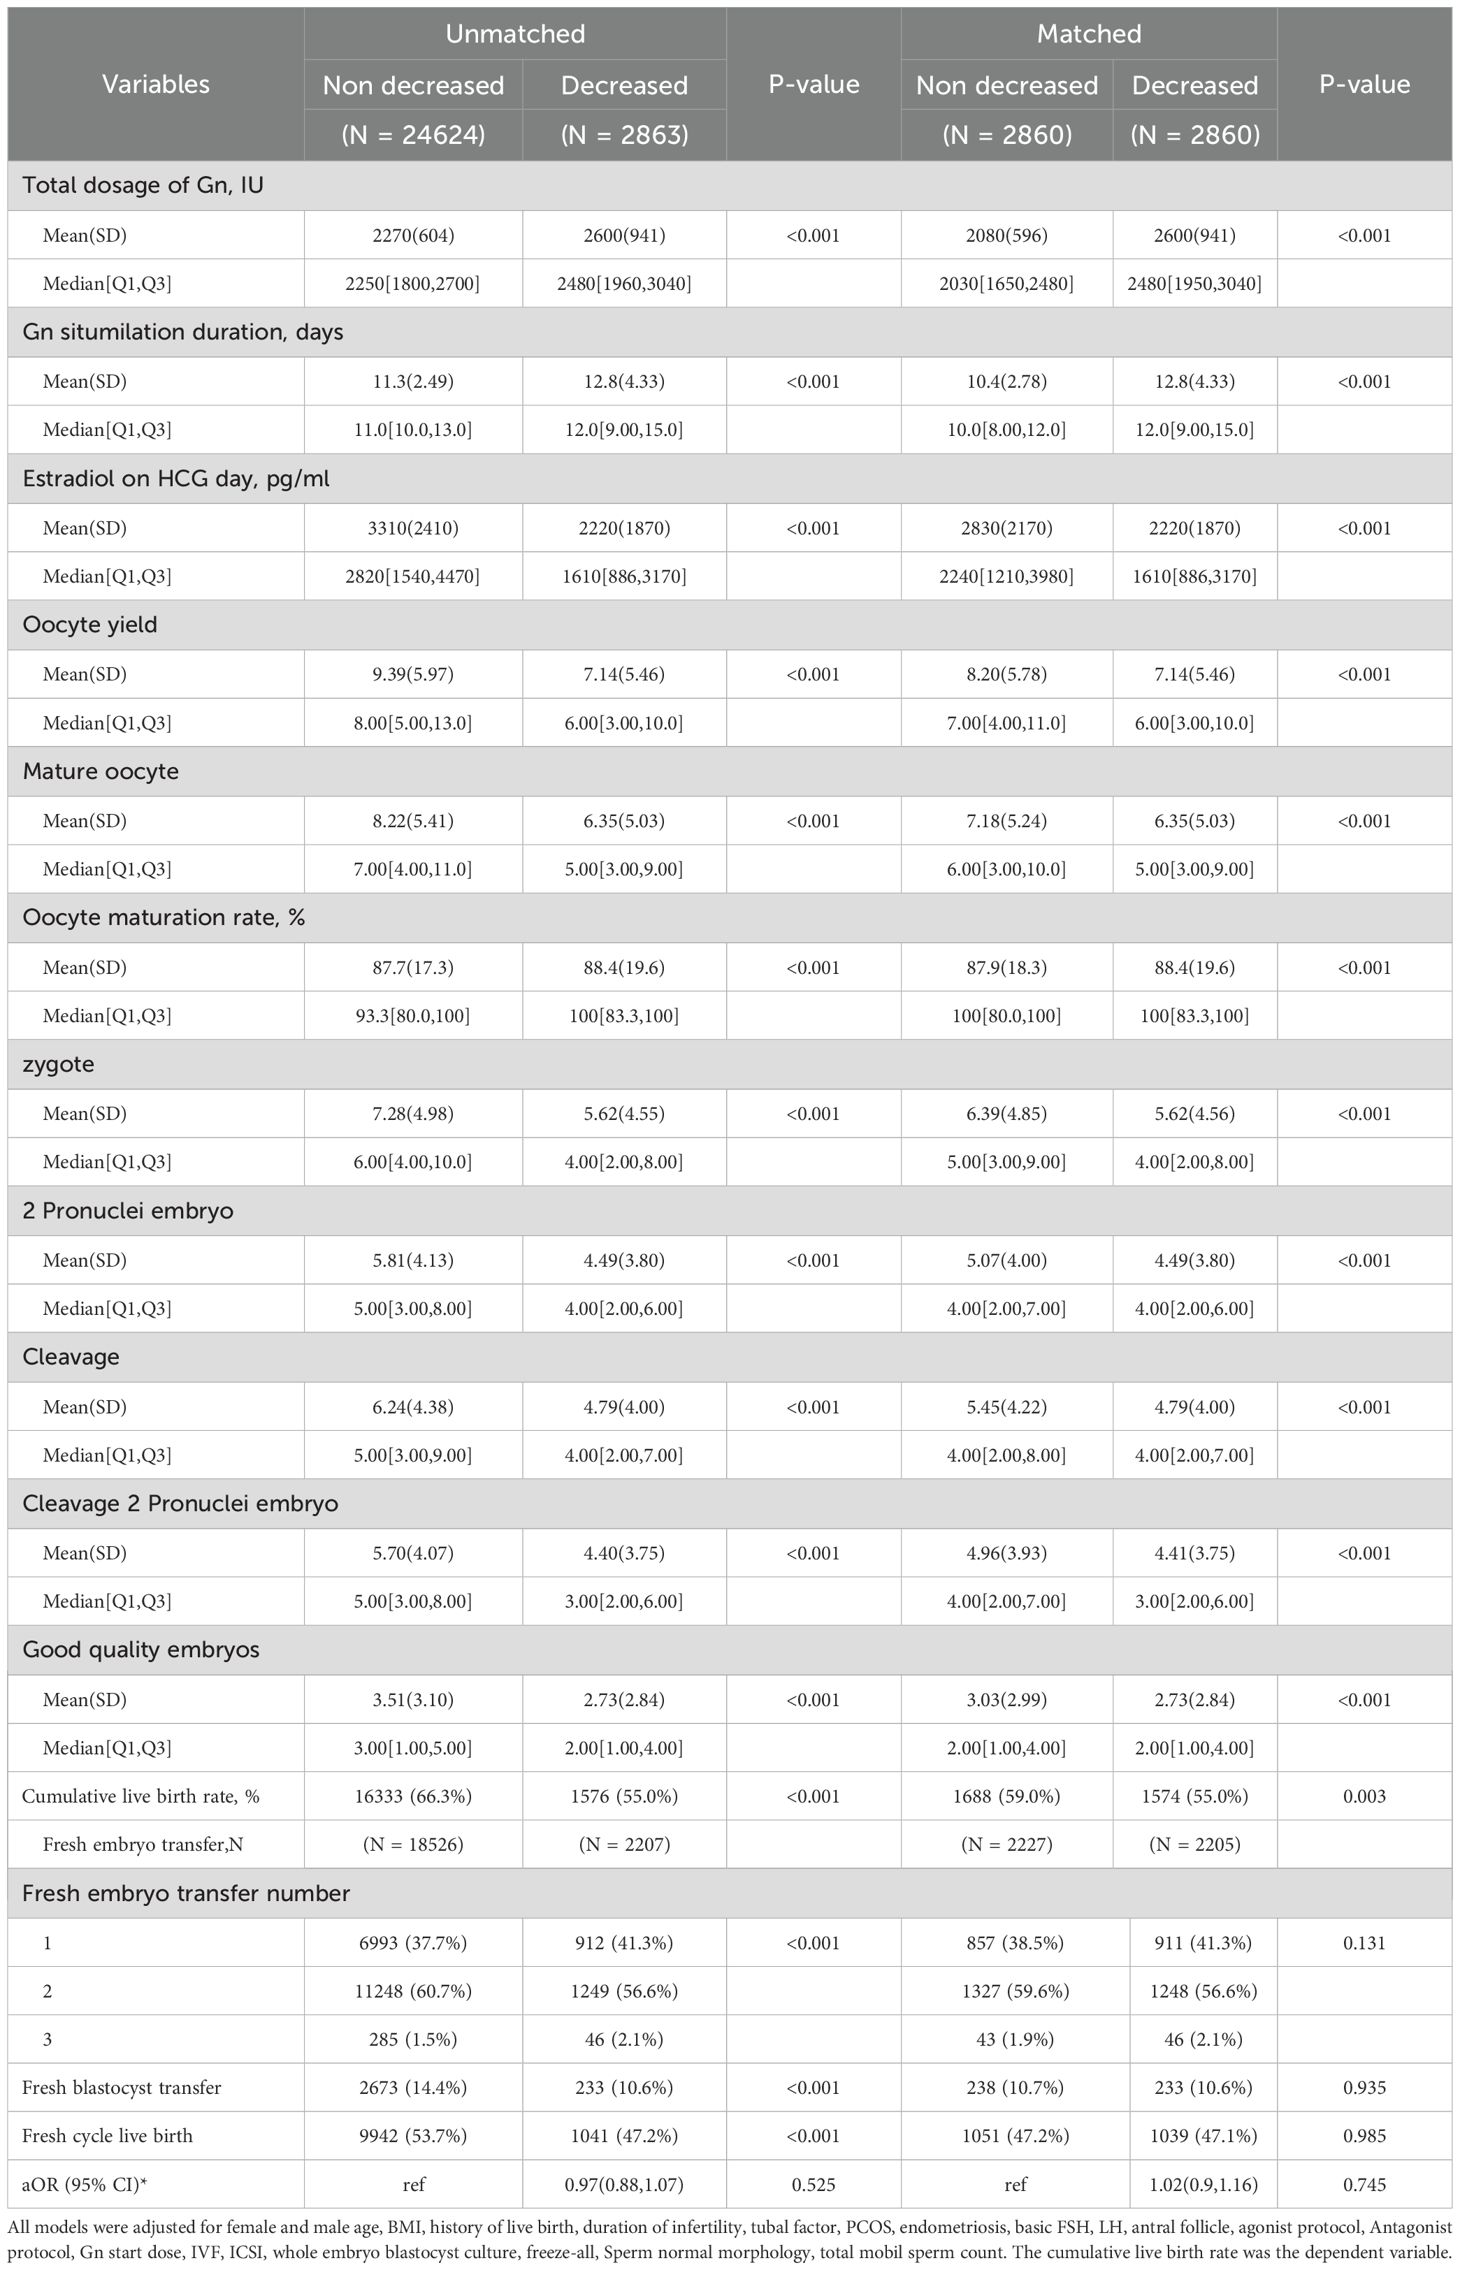
Table 2. Clinical outcomes of patients with and without unexpected estradiol decrease during monitoring.
The mediation analyses suggested that the decreased cumulative live birth rate following E2 decline was largely mediated by the reduced number of mature oocytes or decreased embryo availability. The mature oocyte yield mediated 75.3% (P<0.001) of CLBR decline in the unmatched cohort and 78.3% (P = 0.006) in the matched cohort. Embryo number mediated 76.5% (P = 0.002) and 72.5% (P = 0.01) in the unmatched and matched cohorts, respectively.
The GAM model suggested a U-shaped association between E2 decline and cumulative live birth (edf=2, P = 0.01). The cumulative live birth rates were negatively associated with the degree of E2 decline when the differences between the two visits were less than 108.9 pg/ml (natural log-transformed 4.68) (Figure 2). However, the negative association diminished in cycles with greater E2 decline. The OR for the negative association was 0.862(95%CI: 0.765-0.972). When patients were stratified according to COS protocols, the pattern of association between E2 decline and CLBR was similar between the agonist and antagonist protocols (Supplementary Figure S3). However, the dose-response lacked statistical significance in patients with the antagonist protocol (p=0.38). We further visualized the difference between the dose-response curves of agonist and antagonist protocols in the GAM model. It shows that the CLBR was significantly lower in the antagonist protocol than the agonist protocol when the E2 decline is higher than 4.28 pg/ml (log transformed 1.455), and the difference further extends when the degree of E2 decline further increases. Considering a much lower CLBR in the antagonist protocol than that in the agonist protocol (37.3% versus 71.1%), the lack of association in the antagonist protocol would be due to a lack of power.
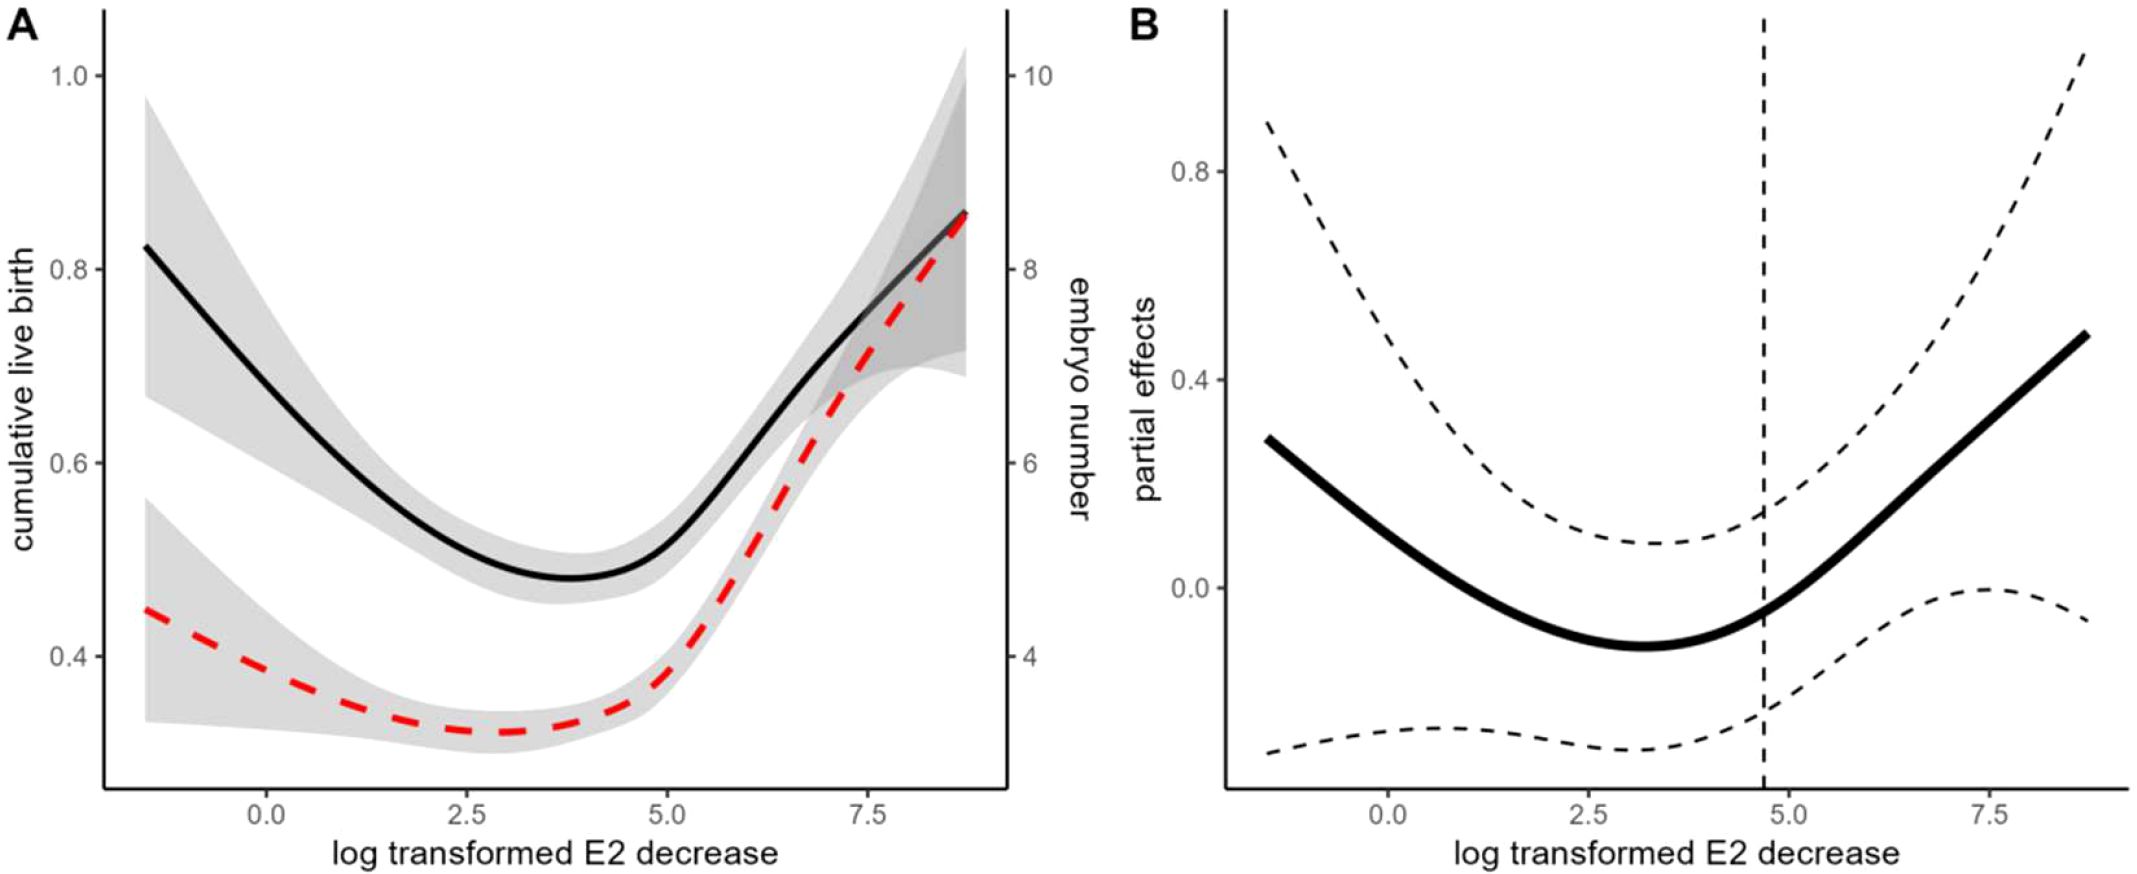
Figure 2. Association between the degree of E2 decline and cumulative live birth rate (CLBR). (A) Unadjusted GAM models indicate the association between E2 decline and CLBR and embryo yield. The black solid line indicates the association with CLBR. The Red dashed line indicates the association with embryo yield. (B) Adjusted GAM spline for E2 decline in association with CLBR. The dashed line indicates the inflection point according to the “gratia” package. The model is adjusted for female age and BMI, fertility-related diagnosis (duration of infertility, tubal factor, endometriosis, PCOS), ovarian reserve markers (basal FSH, LH, and AFC), and ovarian stimulation (protocol and starting dosage), male age, BMI, total motile sperm count, sperm normal morphology, insemination protocols (ICSI versus IVF), and clinical decisions (freeze-all and blastocyst culture).
Table 3 demonstrates the characteristics of the E2 decline during monitoring. Most of the E2 decline occurred between the 8th and 13th day of stimulation, with a median E2 decline of 244 pg/ml. The E2 decline only had a limited association with follicle count and mean diameter at the visit. As shown in a Pearson correlation matrix (Supplementary Figure S4), the degree of E2 decline did not correlate with follicle diameter changes in comparison with the previous visit, and only a low correlation with follicle count changes. A modest correlation (r=0.181) between the degree of E2 decline and the Gn dosage change in the previous visit was also observed. However, only a small proportion of patients with E2 decline (5.1%, n=146) were associated with a Gn dosage decrease in the previous visit. On the other hand, 18.8% (n=538) of the patients underwent Gn dosage increase following the observation of decline. In addition, about 11.4% of the patients underwent consecutive E2 decline at two visits. Since the descriptive data suggested that there was considerable heterogeneity in patients with E2 decline, we further investigated the effects of heterogeneity on cumulative outcomes.
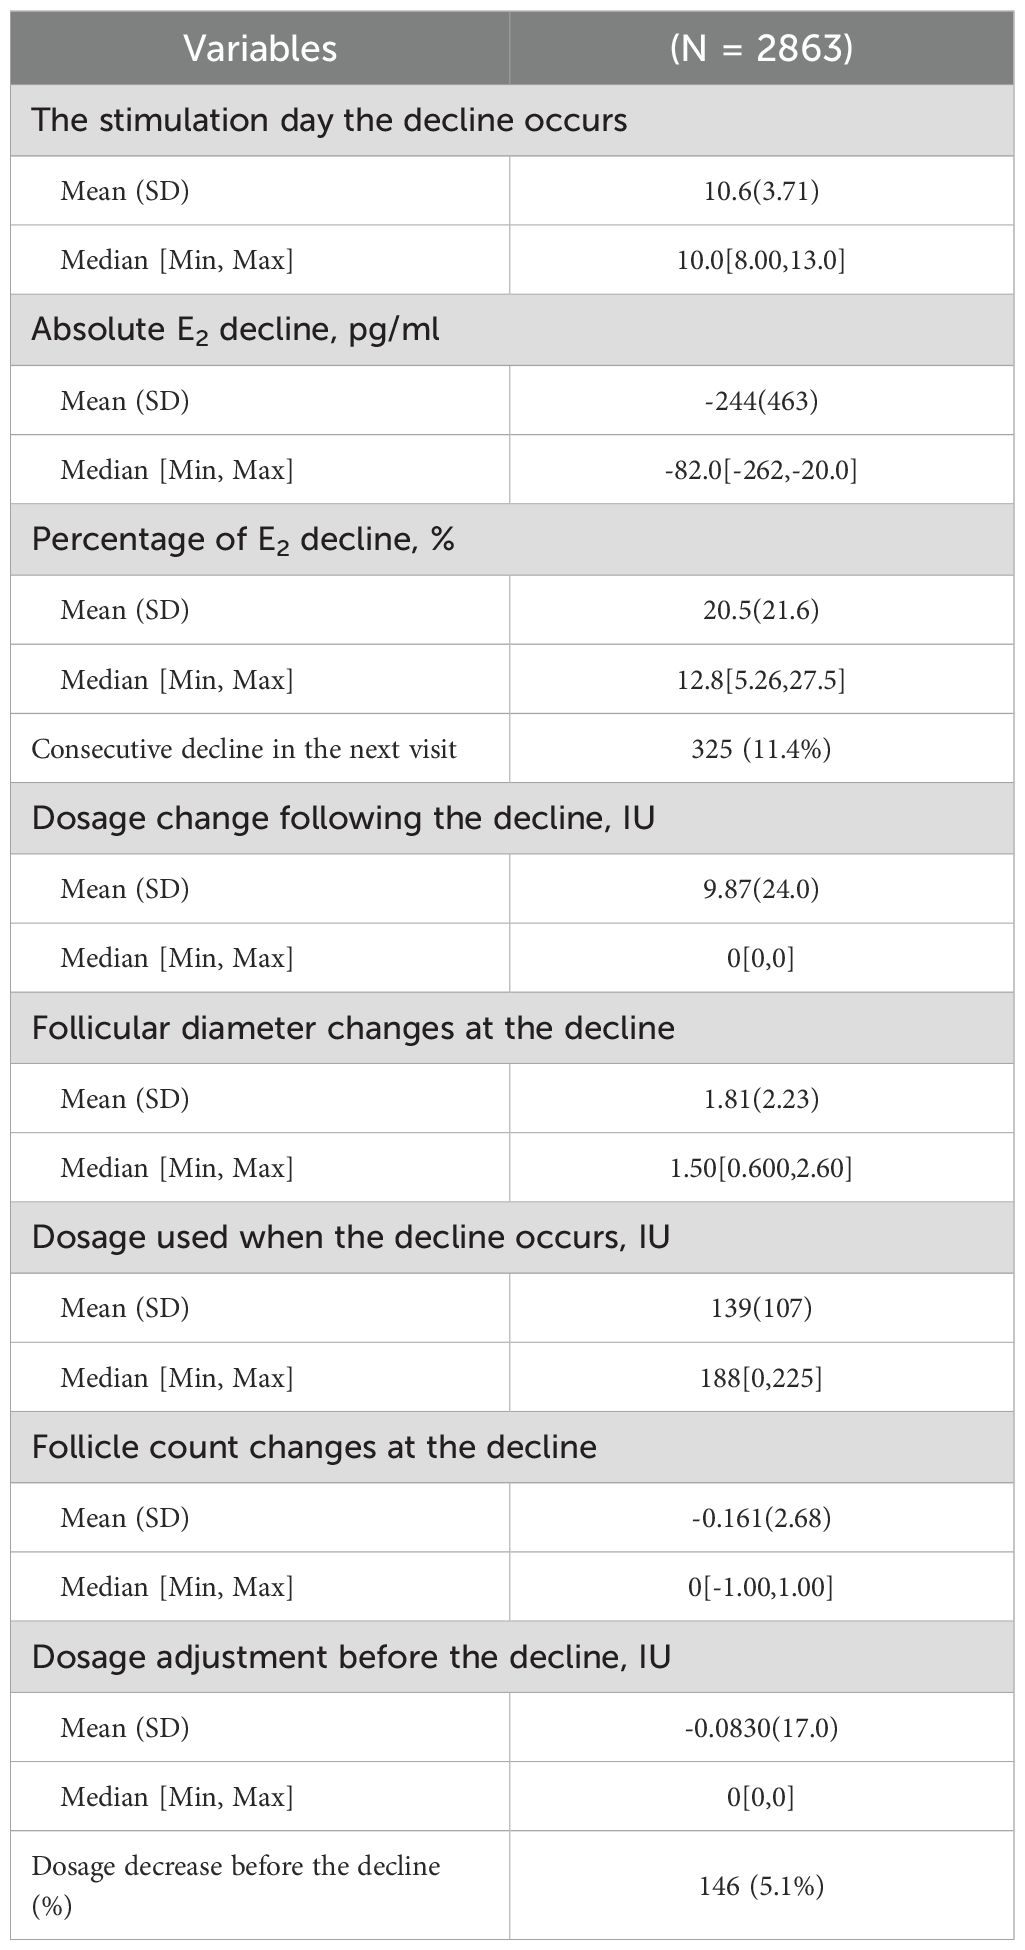
Table 3. Heterogeneity of patients with estradiol decline during monitoring.
Because the Venn diagram (Supplementary Figure S5) suggests that there was limited overlapping between patients who underwent Gn dosage decrease before E2 decline, patients with Gn dosage increase following E2 decline, and patients with consecutive E2 decline in two consecutive visits, we analyzed them independently in multivariate models. In multivariate glm models, we compared the aforementioned E2 decline subgroups (patients with and without Gn increase following E2 decrease, patients with and without consecutive decline at two visits, and patients with and without Gn decrease before E2 decline) with patients without E2 decline (Supplementary Figure S6). The size of association (ORs) did not significantly differ between the patients with and without Gn increase following E2 decrease or patients with and without Gn decrease before E2 decline (Supplementary Figure S6). However, the OR in patients with two consecutive E2 declines (0.58, 95% CI: 0.45,0.74) was significantly lower than that in patients without (OR 0.87, 95%CI: 0.79,0.96).
To confirm the effect of heterogeneity, we also carried out PS-matching in the subgroups (detailed in Supplementary Table S1-6, Supplementary Figures S7-9), and the summarized results are shown in Table 4. Increasing the dosage of Gn following E2 decline appeared to improve cumulative live birth, but the difference diminished following matching or multivariate analyses. On the other hand, the patients with consecutive E2 decline in two visits tended to have lower cumulative live birth rates than patients without in both the unmatched and matched cohorts. Although the P values became marginal in the matched cohort due to reduced sample size, the size of the association was robust in both the unmatched and matched cohorts, with or without multivariate adjustment.
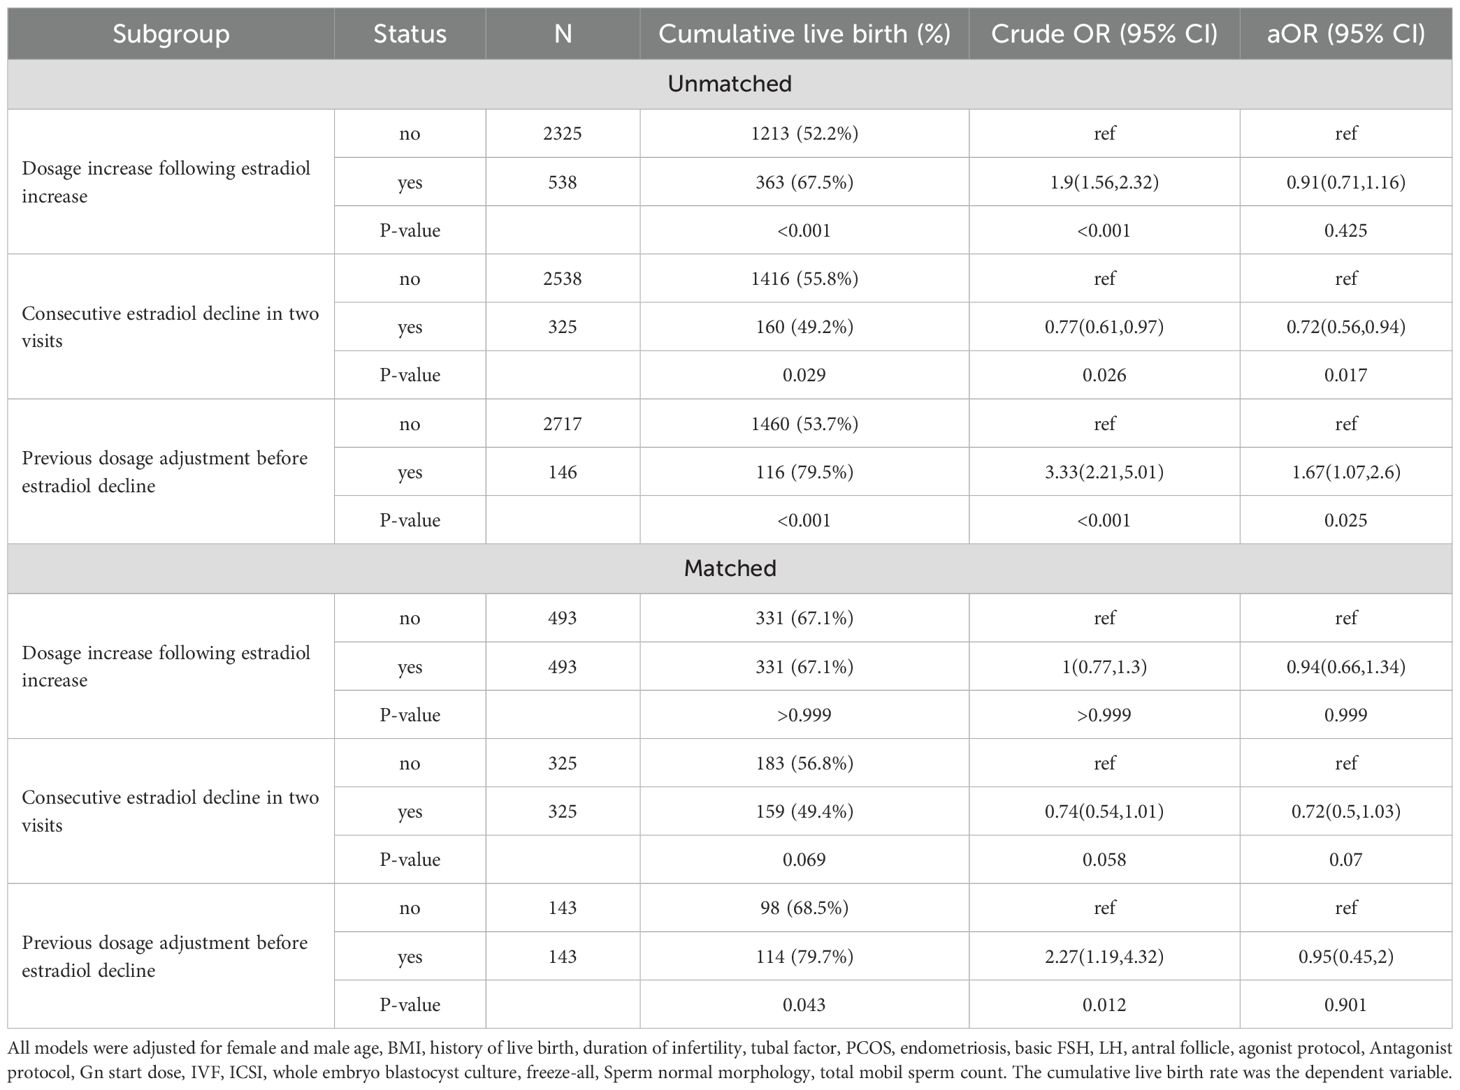
Table 4. The effect of heterogeneity in patients with estradiol decline during monitoring on cumulative live birth.
E-values of these associations (Supplementary Table S8) suggested that the minimal strength of the association that an unknown confounding needs to explain away the association between E2 decline and CLBR was 1.43(95%CI: 1.27,1.56), which was greater than that of the well-known predictor, female age (1.25, 95%CI: 1.23,1.27). For patients with a consecutive estradiol decline, the E-value for E2 decline was even higher (1.95, 95%CI: 1.6,2.35).
Discussion
In our study, we observed a decline in E2 levels in 2,863 out of 27,487 patients undergoing COS, corresponding to an incidence of 10.63%. This incidence indicates that E2 decline is a moderate occurrence in the context of COS, highlighting the need for further investigation into its clinical significance. However, the data also shows a modest association between the E2 decline and decreased CLBR following complete cycles. Compared with propensity score-matched controls, a 4% difference in CLBR was observed. Therefore, E2 decline may be a potential detriment in COS treatment as a part of ART.
Historically, the impact of E2 decline on the ART outcomes is debatable and the majority of the studies focused on the fresh transfer cycles. Some studies reported a dramatic decrease in pregnancy rates following E2 decline. For instance, Kulshrestha, et al. reported a 14% pregnancy rate in 23 patients undergoing pre-triggering E2 decline (6). In a cohort of 78 patients with spontaneous E2 decline before hCG administration, Fisher et al. found that clinical pregnancy rates were significantly reduced (13% vs. 39%, p = 0.012) (11). In contrast, Styer et al (7) reported no significant differences in live birth or pregnancy loss rates between cycles with E2 decline and controls in GnRH agonist-downregulated protocols (n=65). Other studies demonstrated a modest decrease in pregnancy and live births following E2 decline (12, 25). This discrepancy may stem from variations in study populations or protocols. Many of the studies have only limited sample sizes (dozens of patients per group), which could be easily affected by random variation and thus give opposite conclusions (26). In addition, important determinators of embryo transfer outcomes, such as the number of embryos transferred and the stage of the transferred embryo, are adjusted in none of the above-mentioned studies. Our study contributes to the ongoing debate by adding evidence in a patient cohort with a large sample size and confounders adjusted, showing a neutral effect of E2 decline on fresh transfer.
Despite conflicting conclusions on the outcomes following the transfer, the majority of the previous studies agree that E2 decline during COS may decrease embryo yield for subsequent treatment (11–13). It also raises concerns regarding embryo developmental competence. In a donor-recipient cohort, Cobo et al’s study indicates that a fall of ≥30% in serum E2 concentration during ovarian stimulation in donors negatively affects pregnancy rates and embryo quality in recipients (27). The authors warn against a decreased embryo quality following E2 decline and suggest considering a cycle cancellation. Corroborating these studies, our study demonstrates that E2 decline significantly reduced the total number of oocytes, embryos, and high-quality embryos, mediating a decrease in CLBR following complete cycles. However, considering the limited effect size, we do not recommend cycle cancellation due to the E2 decline.
The degree of E2 decline is another potential concern. Previous studies may use arbitrary thresholds such as 10% or 30% to define E2 decline (7, 11–13, 25, 28). However, since E2 is secreted in granulosa cells, the magnitude of both absolute and relative E2 decline is largely dependent on the size of the patients’ growing follicle cohort. Excessive E2 decline could only be expected in hyperresponders. On the other hand, the marginal benefit of CLBR per embryo number increase would also be narrowed in hyperresponders (Supplementary Figure S10). Considering the decrease in CLBR was primarily mediated by embryo yield, it may explain the U-shaped curve observed in GAM analyses. Nevertheless, our dose-response curves still suggested that patients with a suboptimal response (eg. embryo <=4) are more vulnerable to the E2 decline, and an E2 decrease of around 100 pg/ml might be a threshold of concern.
We also explored the heterogeneity of patients encountering E2 decline. Several previous studies have distinguished between spontaneous E2 decline and intended E2 reductions via Gn dose adjustment (7, 13), showing that suboptimal outcomes are only found in patients with spontaneous E2 decline. Echoing the studies, we also found patients having a Gn adjustment prior to E2 decline tended to have an optimal outcome, though the small number of such patients hampered drawing a firm conclusion. On the other hand, we noted that a significant part of the patients underwent consecutive E2 decline in two visits, which led to a poorer prognosis. Although the mechanism is not known, the decline may reflect compromised granulosa cell function or accelerated follicular atresia in follicles (27). While COS recruits a cohort of antral follicles by administration of exogenous Gn, follicles in the cohort may have different degrees of atresia which is probably due to unsynchronized growth (29). The follicles destinated to atresia before triggering produce E2 in a gradually reduced production rate but resulted in no oocyte. The consecutive decline would suggest a high degree of atresia in the cohort and impaired follicular dynamics.
When encountering a decline in E2 levels during COS, clinicians may face management decisions, such as maintaining the scheduled dose of Gn or Gn dosage adjustment during COS. Increasing Gn dosage during COS is a commonly used strategy to maximize the ovarian response and oocyte yield (30, 31). However, its usefulness in patients with E2 decline is less clear. Styer et al. reported no significant differences in live birth rates in patients with E2 decline, regardless of whether the dose of gonadotropins was adjusted (7), suggesting increasing the Gn dosage following the occurrence of E2 decline may not be effective management. Our subgroup analyses also support the point in a larger, multivariate-adjusted cohort. Nevertheless, the evidence so far is based on retrospective studies, and further study is warranted to investigate to optimize the management of these patients.
Strengths and limitations
The strengths of the study may include a larger sample size than previous studies (7, 11–13, 25, 28), with multivariate adjustment and reporting of CLBR following the complete cycle. By focusing on CLBR, our study bridges a gap in existing literature, statistically linking repeated E2 declines to diminished reproductive success.
The limitations of this study lie in its retrospective research design, which inherently carries the risk of biases related to the selection and evaluation of clinical cases. Although we employed multivariate analysis to adjust for confounding variables, there is still a possibility that unknown or unmeasured factors may have influenced the research results. For instance, although the culture system, equipment, and staff remained stable during the study period, unmeasured variations in the laboratory environment, such as fluctuation in air quality, may contribute to confounding. Nevertheless, the E-values suggest that the minimal strength of the association that an unknown confounding needs to explain away the association between E2 decline and CLBR was greater than the well-known predictor, female age. These limitations emphasize the need for caution when interpreting the research findings, and also highlight the importance of using prospective research methods in the future to validate our findings and further elucidate the relationship between E2 levels and reproductive outcomes during the COS process.
In addition, due to the study being observational, the study cohort was also involved in interventions such as Gn dose adjustment during COS. Such interventions are based on the clinicians` decisions on individual cases and inevitably introduce bias. Although we also carried out subgroup analyses, they may be underpowered and heterogeneous.
Finally, the reasons for the occurrence of continuous decreases in E2 are still unclear. It is possible that patients who underwent E2 decline for different reasons are misclassified in our study and previous ones, which resulted in a skewed conclusion.
Conclusions
Although E2 is frequently monitored during COS (32), the value of routine E2 monitoring during COS has already been questioned (33). Our data suggest that the decline in E2 during COS monitoring is associated with the CLBR following a complete cycle, indicating it remains a critical biomarker in predicting the outcomes during COS. However, the overall size of the association is modest, with an E-value (1.43, 95%CI: 1.27,1.56) comparable to that of female age. Further attention should be paid to specific subgroups of patients, such as patients with consecutive E2 decline.
Data availability statement
The raw data supporting the conclusions of this article will be made available by the authors, without undue reservation.
Ethics statement
The studies involving humans were approved by the Institutional Review Board (IRB) of Xiamen University Affiliated Chenggong Hospital. The studies were conducted in accordance with the local legislation and institutional requirements. Written informed consent for participation was not required from the participants or the participants’ legal guardians/next of kin because the research was based on non-identifiable records.
Author contributions
HC: Writing – original draft, Writing – review & editing, Conceptualization, Data curation, Formal analysis, Investigation. KH: Writing – original draft, Writing – review & editing, Conceptualization, Data curation, Formal analysis, Investigation. CM: Writing – original draft, Writing – review & editing, Conceptualization, Data curation. JG: Writing – review & editing, Writing – original draft, Data curation, Formal analysis, Investigation. LL: Formal analysis, Writing – review & editing, Writing – original draft. ZL: Writing – original draft, Writing – review & editing. XN: Data curation, Writing – review & editing, Writing – original draft. XJ: Writing – original draft, Writing – review & editing. JC: Writing – review & editing, Writing – original draft. JR: Writing – review & editing, Writing – original draft.
Funding
The author(s) declare that no financial support was received for the research, and/or publication of this article.
Acknowledgments
We appreciate all clinicians, embryologists, and nurses of the Reproductive Medicine Center, Xiamen University Afliated Chenggong Hospital for their treatments provided to the infertile couples included in the study.
Conflict of interest
The authors declare that the research was conducted in the absence of any commercial or financial relationships that could be construed as a potential conflict of interest.
Generative AI statement
The author(s) declare that no Generative AI was used in the creation of this manuscript.
Any alternative text (alt text) provided alongside figures in this article has been generated by Frontiers with the support of artificial intelligence and reasonable efforts have been made to ensure accuracy, including review by the authors wherever possible. If you identify any issues, please contact us.
Publisher’s note
All claims expressed in this article are solely those of the authors and do not necessarily represent those of their affiliated organizations, or those of the publisher, the editors and the reviewers. Any product that may be evaluated in this article, or claim that may be made by its manufacturer, is not guaranteed or endorsed by the publisher.
Supplementary material
The Supplementary Material for this article can be found online at: https://www.frontiersin.org/articles/10.3389/fendo.2025.1658236/full#supplementary-material
Supplementary Figure 1 | A directed acyclic graph for covariate selection.
Supplementary Figure 2 | Association between the degree of E2 decline and cumulative live birth rate (CLBR) in antagonist and agonist protocols. (A) GAM models indicate the association between E2 decline and CLBR in antagonist and agonist protocols. The blue line indicates the association in the antagonist protocol. The bed line indicates the association in the agonist protocol. (B) The difference between GAM splines in antagonist and agonist protocols. The shade indicates 95% confidence intervals of the difference. The red area indicates. All models are adjusted for female age and BMI, fertility-related diagnosis (duration of infertility, tubal factor, endometriosis, PCOS), ovarian reserve markers (basal FSH, LH, and AFC), and ovarian stimulation (protocol and starting dosage), male age, BMI, total motile sperm count, sperm normal morphology, insemination protocols (ICSI versus IVF), and clinical decisions (freeze-all and blastocyst culture).
Supplementary Figure 3 | The distribution of propensity score in patients matched for E2 decline. The green shades indicate patients with E2 decline and the pink shades indicate controls.
Supplementary Figure 4 | A correlation matrix between E2 decline and changes in gonadotropin dosage and follicles. A blank grid indicates no significant association. FF_diameter_change, changes in mean diameters of the monitored follicles at the visit; Gn_change_previously, changes in Gn dosage in previous visit; E2_decrease, the degree of E2 decline in comparison with the previous visit; Gn_dosing_change, changes in Gn dosage following the occurrence of E2 decline, FF_count_change, changes in the count of the monitored follicles at the visit.
Supplementary Figure 5 | Overlapping of heterogeneous subgroups of patients with E2 decline. Set 1, patients with gonadotropin (Gn) increase following E2 decline, Set 2, patients with and without consecutive decline at two visits, Set 3, patients with and without Gn adjustment before E2 decline.
Supplementary Figure 6 | Odds ratios (OR) comparing E2 decline subgroups with patients without E2 decline. All models are adjusted for female age and BMI, fertility-related diagnosis (duration of infertility, tubal factor, endometriosis, PCOS), ovarian reserve markers (basal FSH, LH, and AFC), and ovarian stimulation (protocol and starting dosage), male age, BMI, total motile sperm count, sperm normal morphology, insemination protocols (ICSI versus IVF), and clinical decisions (freeze-all and blastocyst culture).
Supplementary Figure 7 | The distribution of propensity score in patients matched for gonadotropin (Gn) increase following E2 decline. The green shades indicate patients with Gn increase and the pink shades indicate control patients with E2 decline.
Supplementary Figure 8 | The distribution of propensity score in patients matched for consecutive E2 decline at two visits. The green shades indicate patients with consecutive E2 decline and the pink shades indicate control patients with E2 decline.
Supplementary Figure 9 | The distribution of propensity score in patients matched for gonadotropin (Gn) adjustment before E2 decline. The green shades indicate patients with Gn adjustment and the pink shades indicate control patients with E2 decline.
Supplementary Figure 10 | The association between embryo yield and cumulative birth.
References
1. Orvieto R, Venetis CA, Fatemi HM, D’hooghe T, Fischer R, Koloda Y, et al. Optimising Follicular Development, Pituitary Suppression, Triggering and Luteal Phase Support During Assisted Reproductive Technology: A Delphi Consensus. Front Endocrinol (Lausanne). (2021) 12:675670. doi: 10.3389/fendo.2021.675670
2. Garnett E, Bruno-Gaston J, Cao J, Zarutskie P, and Devaraj S. The importance of estradiol measurement in patients undergoing in vitro fertilization. Clin Chim Acta. (2020) 501:60–5. doi: 10.1016/j.cca.2019.09.021
3. García-Velasco JA, Isaza V, Quea G, and Pellicer A. Coasting for the prevention of ovarian hyperstimulation syndrome: much ado about nothing? Fertil Steril. (2006) 85:547–54. doi: 10.1016/j.fertnstert.2005.07.1335
4. Holesh JE, Bass AN, and Lord M. Physiology, Ovulation. StatPearls Publishing (2025). Available online at: https://pubmed.ncbi.nlm.nih.gov/28723025/ (Accessed January 01, 2025).
5. Couzinet B and Schaison G. The control of gonadotrophin secretion by ovarian steroids. Hum Reprod. (1993) 8:97–101. doi: 10.1093/humrep/8.suppl_2.97
6. Kulshrestha S, Barnhart KT, Coutifaris C, and Patrizio P. Unexplained decrease or plateau in serum estradiol levels during ovulation induction in ART: Effects on fertilization and pregnancy rates. Fertil Steril. (2001) 76:S133. doi: 10.1016/S0015-0282(01)02392-5
7. Styer AK, Jackson KV, Hornstein MD, Racowsky C, Ginsburg ES, and Gargiulo AR. Pregnancy outcomes in in vitro fertilization cycles with serum estradiol drop prior to human chorionic gonadotropin. Int J Gynaecol Obstet. (2005) 89:133–7. doi: 10.1016/j.ijgo.2005.02.005
8. Lu H, Cole SR, Howe CJ, and Westreich D. Toward a Clearer Definition of Selection Bias When Estimating Causal Effects. Epidemiology. (2022) 33:699–706. doi: 10.1097/EDE.0000000000001516
9. Fordham DE, Rosentraub D, Polsky AL, Aviram T, Wolf Y, Perl O, et al. Embryologist agreement when assessing blastocyst implantation probability: is data-driven prediction the solution to embryo assessment subjectivity? Hum Reprod. (2022) 37:2275–90. doi: 10.1093/humrep/deac171
10. Maheshwari A, Mclernon D, and Bhattacharya S. Cumulative live birth rate: time for a consensus? Hum Reprod. (2015) 30:2703–7. doi: 10.1093/humrep/dev263
11. Fisher S, Grin A, Paltoo A, and Shapiro HM. Falling estradiol levels as a result of intentional reduction in gonadotrophin dose are not associated with poor IVF outcomes, whereas spontaneously falling estradiol levels result in low clinical pregnancy rates. Hum Reprod. (2005) 20:84–8. doi: 10.1093/humrep/deh543
12. Cheng J, Yang S, Ma H, Liang Y, and Zhao J. Estradiol (E2) Reduction Adversely Affect the Embryo Quality and Clinical Outcomes of In Vitro Fertilization and Embryo transfer (IVF-ET). J Healthc Eng. (2022) 2022:2473876. doi: 10.1155/2022/2473876
13. Grin L, Berkovitz-Shperling R, Zohav E, Namazov A, Leyetes S, and Friedler S. Do spontaneously decreasing estradiol levels prior to triggering of ovulation adversely impact in vitro fertilization outcomes? Clin Exp Reprod Med. (2020) 47:213–20. doi: 10.5653/cerm.2019.03419
14. Cai J, Liu L, Zhang J, Qiu H, Jiang X, Li P, et al. Low body mass index compromises live birth rate in fresh transfer in vitro fertilization cycles: a retrospective study in a Chinese population. Fertil Steril. (2017) 107:422–429.E2. doi: 10.1016/j.fertnstert.2016.10.029
15. Gardner DK, Lane M, Stevens J, Schlenker T, and Schoolcraft WB. Blastocyst score affects implantation and pregnancy outcome: towards a single blastocyst transfer. Fertil Steril. (2000) 73:1155–8. doi: 10.1016/s0015-0282(00)00518-5
16. Zegers-Hochschild F, Adamson GD, De Mouzon J, Ishihara O, Mansour R, Nygren K, et al. The International Committee for Monitoring Assisted Reproductive Technology (ICMART) and the World Health Organization (WHO) Revised Glossary on ART Terminology, 2009. Hum Reprod. (2009) 24:2683–7. doi: 10.1093/humrep/dep343
17. Ho D, Imai K, King G, and Stuart EA. MatchIt: Nonparametric Preprocessing for Parametric Causal Inference. J Stat Software. (2011) 42:1–28. doi: 10.18637/jss.v042.i08
18. Greifer N. Cobalt: Covariate Balance Tables and Plots (2025). R package version 4.3.2. 2022. Available online at: https://CRAN.R-project.org/package=cobalt (Accessed January 19, 2022).
19. Austin PC. An Introduction to Propensity Score Methods for Reducing the Effects of Confounding in Observational Studies. Multivar Behav Res. (2011) 46:399–424. doi: 10.1080/00273171.2011.568786
20. Cai J, Jiang X, Liu L, Liu Z, Chen J, Chen K, et al. Pretreatment prediction for IVF outcomes: generalized applicable model or centre-specific model? Hum Reprod. (2024) 39:364–73. doi: 10.1093/humrep/dead242
21. Wang Y, Li R, Yang R, Zheng D, Zeng L, Lian Y, et al. Intracytoplasmic sperm injection versus conventional in-vitro fertilisation for couples with infertility with non-severe male factor: a multicentre, open-label, randomised controlled trial. Lancet. (2024) 403:924–34. doi: 10.1016/S0140-6736(23)02416-9
22. Li Z, Wang AY, Bowman M, Hammarberg K, Farquhar C, Johnson L, et al. Cumulative live birth rates following a ‘freeze-all’ strategy: a population-based study. Hum Reprod Open. (2019) 2019:hoz004. doi: 10.1093/hropen/hoz004
23. De Croo I, Colman R, De Sutter P, and Tilleman K. Blastocyst transfer for all? Higher cumulative live birth chance in a blastocyst-stage transfer policy compared to a cleavage-stage transfer policy. Facts Views Vis Obgyn. (2019) 11:169–76.
24. R Core Team. R: A Language and Environment for Statistical Computing (2024). Available online at: https://www.r-project.org/ (Accessed March 01, 2024).
25. Zhu Y, Zheng Z, Fan B, Sun Y, Zhai J, and Du Y. Estradiol Decline Before hCG Administration in COH Has a Negative Effect on IVF Outcomes in Patients Without OC Pretreatment. Int J Womens Health. (2024) 16:411–9. doi: 10.2147/IJWH.S423089
26. Cao Y, Chen RC, and Katz AJ. Why is a small sample size not enough? Oncologist. (2024) 29:761–3. doi: 10.1093/oncolo/oyae162
27. Mcevoy MJ, Mcafee M, Hession JA, and Creedon L. A Mathematical Model of Estradiol Production from Ultrasound Data for Bovine Ovarian Follicles. Cells. (2022) 11:3908. doi: 10.3390/cells11233908
28. Cobo A, Pérez S, De Los Santos M, Zulategui J, Domingo J, and Remohí J. Effect of different cryopreservation protocols on the metaphase II spindle in human oocytes. Reprod BioMed Online. (2008) 17:350–9. doi: 10.1016/S1472-6483(10)60218-0
29. Hayden CB, Sala RV, Absalón-Medina VA, Motta JCL, Pereira D, Moreno JF, et al. Synchronization of follicle wave emergence before ovarian superstimulation with FSH and ovum pick-up improves in vitro embryo production in pregnant heifers. Theriogenology. (2022) 188:71–8. doi: 10.1016/j.theriogenology.2022.05.017
30. Orvieto R, Aizer A, Saar-Ryss B, Marom-Haham L, Noach-Hirsh M, Haas J, et al. Elective egg freezing patients may benefit from increasing the maximal daily gonadotropin dose above 300IU. Reprod Biol Endocrinol. (2022) 20:171. doi: 10.1186/s12958-022-01049-3
31. Alper MM and Fauser BC. Ovarian stimulation protocols for IVF: is more better than less? Reprod BioMed Online. (2017) 34:345–53. doi: 10.1016/j.rbmo.2017.01.010
32. Sachs-Guedj N, Hart R, Requena A, Vergara V, and Polyzos NP. Real-world practices of hormone monitoring during ovarian stimulation in assisted reproductive technology: a global online survey. Front Endocrinol (Lausanne). (2023) 14:1260783. doi: 10.3389/fendo.2023.1260783
Keywords: assisted reproductive biotechnologies (ART), ovarian stimulation, estradiol decline, follicular development, cumulative live birth rate
Citation: Chen H, Huang K, Ma C, Geng J, Liu L, Liu Z, Na X, Jiang X, Cai J and Ren J (2025) Unexpected estradiol decline during ovarian stimulation monitoring affects cumulative live birth. Front. Endocrinol. 16:1658236. doi: 10.3389/fendo.2025.1658236
Received: 02 July 2025; Accepted: 06 October 2025;
Published: 20 October 2025.
Edited by:
Bassem Refaat, Umm Al-Qura University, Saudi ArabiaReviewed by:
Sallwa Alshehre, Umm al-Qura University, Saudi ArabiaJiayu Huang, The First Affiliated Hospital of Chongqing Medical University, China
Copyright © 2025 Chen, Huang, Ma, Geng, Liu, Liu, Na, Jiang, Cai and Ren. This is an open-access article distributed under the terms of the Creative Commons Attribution License (CC BY). The use, distribution or reproduction in other forums is permitted, provided the original author(s) and the copyright owner(s) are credited and that the original publication in this journal is cited, in accordance with accepted academic practice. No use, distribution or reproduction is permitted which does not comply with these terms.
*Correspondence: Jiali Cai, amlhbGljYWlAeG11LmVkdS5jbg==; Jianzhi Ren, cmp6MTc0QDEyNi5jb20=