 Moeko Sakamoto1†‡
 Nao Hasuzawa1*†‡
 Lixiang Wang2‡
 Kyoko Tashiro3
 Miyuki Kitamura1‡
 Shimpei Iwata1‡Nobuhiko Wada1‡
 Seiji Nomura2‡
 Sawako Moriyama1‡
 Mizuki Gobaru1‡Yukihiro Inoguchi1
 Ayako Nagayama1‡
 Kenji Ashida1‡
 Yoshinori Moriyama1
 Masatoshi Nomura1‡
- 1Division of Endocrinology and Metabolism, Department of Internal Medicine, Kurume University School of Medicine, Kurume, Japan
- 2Department of Medical Biochemistry, Kurume University School of Medicine, Kurume, Japan
- 3Research Institute of Medical Mass Spectrometry, Kurume University School of Medicine, Kurume, Japan
Aims/hypothesis: Sodium–glucose cotransporter 2 inhibitors (SGLT2i) confer cardio-renal protection, and recent work implicates enhanced branched-chain amino acid (BCAA) catabolism as a potential mechanism in the heart. Whether SGLT2i also promotes renal BCAA catabolism is largely unknown. We hypothesized that SGLT2i enhances renal BCAA catabolism independently of glycemic effects.
Methods: We conducted a prospective, single-center, open-label, nonrandomized, controlled clinical study in patients with type 2 diabetes stably treated with insulin, who were assigned to dapagliflozin (5 mg/day with dose-reduced insulin; n=8/9 completed) or insulin dose-up (n=5/8 completed). At 12 weeks, changes in urinary and plasma metabolites and short-chain acylcarnitines related to BCAA catabolism were quantified. To explore mechanisms, 10-week-old db/db mice received luseogliflozin (10 mg/kg/day, p.o.) or insulin glargine (10 U/day, s.c.) for 4 weeks; renal histology, mRNA and protein expression of key enzymes involved in BCAA catabolism, including branched-chain aminotransferase 2 (BCAT2), branched-chain ketoacid dehydrogenase (BCKDH), and BCKD kinase (BCKDK), were assessed.
Results: Dapagliflozin treatment induced greater increases in urinary excretion of three BCAA-derived metabolites—3-hydroxypropionic acid, C5-OH carnitine, and 3-hydroxybutyric acid—compared with insulin at comparable glycemic levels. In contrast, C4 carnitine (an earlier metabolite in valine catabolism) rose more with insulin. No corresponding between-group differences were detected in plasma metabolites. In db/db mice, luseogliflozin attenuated glomerular mesangial expansion and tubular epithelial atrophy, and reduced Col1a1 mRNA and TGF-β1 protein, compared with glargine at comparable glycemic levels. Luseogliflozin decreased the phosphorylated (inactive) form of the BCKDH E1α subunit (p-BCKDHA/BCKDHA) and lowered BCKDK protein. mRNA expression of amino acid transporters and BCAT2 expression was unchanged.
Conclusions/interpretation: Across complementary human and mouse studies, SGLT2 inhibition was suggested to enhance renal BCAA catabolism compared with insulin at comparable glycemic levels. In humans, increases in urinary BCAA-derived downstream metabolites without corresponding changes in plasma support a kidney-localized metabolic effect. In mice, SGLT2 inhibitor improved renal histopathology, and reduced phosphorylation-mediated inactivation of BCKDH. These findings provide mechanistic, translational evidence that SGLT2i modulate BCAA flux independently of glucose lowering, suggesting BCAA catabolism as a therapeutic axis in diabetic kidney disease.
Clinical trial registration: https://rctportal.mhlw.go.jp/en/detail?trial_id=UMIN000052955, identifier UMIN000052955.
1 Introduction
Diabetic kidney disease (DKD) is a chronic complication of diabetes and a leading cause of end-stage renal disease (ESRD) (1). Studies have shown that as DKD progresses, both mortality rates and cardiovascular disease risk increase (2–4). The development of treatments to slow DKD progression remains a critical medical issue for improving patients’ quality of life and healthcare outcomes.
The advent of sodium-glucose co-transporter 2 (SGLT2) inhibitors has revolutionized DKD treatment. SGLT2 inhibitors lower blood glucose levels by inhibiting glucose reabsorption in renal proximal tubule cells (5). SGLT2 inhibitors are reported to significantly reduce all-cause mortality, cardiovascular mortality, hospitalization due to heart failure, and ESRD risk (6–8).
Several hypotheses have been proposed to explain the cardiorenal protective mechanisms of SGLT2 inhibitors. These drugs promote weight loss, primarily by reducing fat mass (9, 10), enhance insulin sensitivity, and lower blood pressure and serum uric acid levels (11). Furthermore, SGLT2 inhibitors increase circulating levels of ketone bodies and enhance their utilization, improving oxygen consumption efficiency (12). Ketone bodies also possess anti-inflammatory properties (13). While these mechanisms partially explain the clinical cardiorenal benefits, further research is needed to fully elucidate the effects of SGLT2 inhibitors.
Recently, activation of branched-chain amino acids (BCAA) catabolism in the heart has emerged as a potential mechanism for the cardioprotective effects of SGLT2 inhibitors. Empagliflozin has been shown to ameliorate adverse cardiac remodeling and heart failure in a non-diabetic porcine model by shifting myocardial fuel utilization towards BCAA (14). Although kidneys also have high BCAA oxidation flux (15), few studies have investigated renal BCAA catabolism in this context.
Previously, Sharma et al. identified 13 metabolites that were significantly decreased in patients with diabetes and CKD compared with healthy controls and/or patients with diabetes without CKD (16). We noted that six metabolites among these—3-hydroxypropionic acid, 3-methylcrotonylglycine, 2-methylacetoacetate, 3-hydroxyisovalerate, 2-ethyl-3-hydroxypropionate, and tiglylglycine—are all products of branched-chain amino acid (BCAA) catabolism. Furthermore, a study conducted by Mulder et al. demonstrated that treatment with dapagliflozin increased the levels of the first three of these six metabolites (3-hydroxypropionic acid, 3-methylcrotonylglycine, and 2-methylacetoacetate) compared with pre-intervention levels (17). Based on these findings, we hypothesized that SGLT2 inhibitors may enhance renal BCAA catabolism, which is impaired in DKD.
BCAA catabolism occurs mainly within mitochondria. In the first step, BCAAs are converted to branched-chain α-ketoacids (BCKAs) by mitochondrial branched-chain aminotransferase 2 (BCAT2). During this process, nitrogen from BCAAs is transferred to α-ketoglutarate, forming glutamate. Because hepatic BCAT2 activity is very low, this first step mainly occurs in other organs, including the kidneys and skeletal muscle (15). In the second step, BCKAs are converted into branched-chain acyl-CoA (BCA-CoA) by branched-chain α-ketoacid dehydrogenase complex (BCKDC). This step is irreversible and is the rate-limiting step in BCAA breakdown. BCKDC is inactivated by another enzyme, branched-chain α-ketoacid dehydrogenase kinase (BCKDK), which is activated in insulin resistance (18). Elevated plasma BCAA levels are associated with insulin resistance (19). Elucidating how SGLT2 inhibitors affect renal BCAA metabolism is an important step forward in understanding their glucose-independent renal protective effects and for identifying potential therapeutic pathways.
This study analyzed the effects of SGLT2 inhibitor administration on renal BCAA metabolism in patients with type 2 diabetes and in db/db mice, which have been reported to recapitulate the elevations in plasma BCAAs observed in humans with type 2 diabetes (15). To distinguish drug-specific effects of SGLT2 inhibitors from general changes induced by glucose-lowering, we compared the effects of SGLT2 inhibitors to those of insulin, maintaining comparable blood glucose levels between groups.
2 Materials and methods
2.1 Patient enrollment
We conducted a prospective, single-center, open-label, nonrandomized, controlled trial at Kurume University Hospital (Kurume, Japan) from January 2020 to October 2022. Inclusion criteria comprised a diagnosis of type 2 diabetes with HbA1c > 47 mmol/mol (6.5%), age ≥20 and <80 years, a stable antidiabetic treatment with insulin for at least 8 weeks prior to the study, and no prior use of SGLT2 inhibitors. Exclusion criteria encompassed pregnant or breastfeeding women and patients with malignant disease, severe infections (including urinary tract infections), severe trauma, or recent surgery. After baseline examinations, patients were divided into two groups: the dapagliflozin group received 5 mg/day of dapagliflozin in addition to a reduced insulin dose (approximately 80% of baseline), while the insulin group received an increased insulin dose. In each group, clinical data were evaluated at baseline and 12 weeks after initiating treatment. This study was approved by the ethics committee of Kurume University, and the protocol complied with the Declaration of Helsinki. All patients provided their written informed consent before enrollment. The study was registered with UMIN Clinical Trials Registry (UMIN000052955).
2.2 Study endpoints
The study endpoints included changes in plasma and urinary amino acids and metabolites, anthropometric parameters, and blood parameters. Blood parameters included HbA1c, fasting plasma glucose (FPG), serum C-peptide (CPR), LDL and HDL cholesterol, triglycerides (TG), alanine aminotransferase (ALT), aspartate aminotransferase (AST), blood urea nitrogen (BUN), creatinine (Cr), uric acid (UA), 3-hydroxybutyric acid, liver-type fatty acid-binding protein (L-FABP), and urinary albumin-to-creatinine ratio (mg/g). All parameters were measured after an overnight fasting period of at least 8 hours.
2.3 Animals
We used male mice exclusively to avoid potential confounding effects of estrogen on renal injury development. Db/db male mice (BKS.Cg-Dock7m+/+LeprdbJ) and db/+ mice were obtained from Charles River Laboratories Japan, Inc. The mice were housed individually and provided ad libitum access to diet (D12450JM, Research Diets, New Brunswick, NJ, USA) and were maintained under a 12-h light/dark cycle. Ten-week-old male db/db mice were randomly assigned to experimental groups (n = 4–8 per group) and subjected to the intervention for 4 weeks, while an untreated control group was maintained under the same conditions. The luseogliflozin-treated group received a daily oral gavage of 10 mg/kg luseogliflozin diluted in water, while the glargine-treated group received a daily subcutaneous injection of 10 U insulin glargine. The doses of drugs were determined based on previous studies (20–22). Random blood glucose levels were measured weekly using a Glutest Sensor (Sanwa Kagaku, Nagoya, Japan). Mice were maintained under ad libitum feeding conditions and sacrificed under isoflurane anesthesia at Zeitgeber time 6 (mid-light phase) for tissue collection. Histological analyses were performed in four groups: db/db control, db/db luseogliflozin, db/db glargine, and db/+ as a non-diabetic control. The db/+ group was excluded from other quantitative analyses to account for the potential effects of genetic background. All experiments were conducted in accordance with institutional guidelines and approved by the ethics committee of Kurume University School of Medicine (approval number: 2020-131).
2.4 Clinical analysis
Amino acids and metabolites in urine and plasma samples from patients were analyzed by HPLC or GC/MS. Other laboratory analyses were performed by the hospital laboratory or SRL Inc (Tokyo, Japan). Body weight, BMI, skeletal muscle weight, and skeletal muscle percentage were measured using a body composition analyzer (LookingBody 120, Tokyo, Japan) employing the bioimpedance method. eGFR was calculated using revised equations for Japanese individuals.
2.5 Blood and urine biochemistry
Amino acids in urine and plasma samples from patients were analyzed by HPLC. HPLC was performed using JLC-500/V fully automatic high-speed amino acid analyzer (JEOL, Tokyo, Japan) according to the manufacturer’s procedures. Briefly, the urine and plasma samples were deproteinized with 3% sulfosalicylic acid, and the supernatants were filtered through a 0.45 µm filter. These samples were analyzed by an automated amino acid analyzer consisting of cation exchange chromatography and post-column ninhydrin detection.
Metabolites in urine and plasma of patients were measured by gas chromatography-mass spectrometry (GC/MS) as described previously (23, 24). Each analyte was identified from the spectrum, and the area under the spectrum of targeted metabolites was divided by that of heptadecanoic acid to acquire the ratio of each metabolite, which was further normalized to creatinine.
Acylcarnitines in urine and plasma of patients were measured by high-performance liquid chromatography–tandem mass spectrometry (HPLC-MS/MS) as described previously (25). Each analyte was identified from the spectrum, and the area under the spectrum of each targeted metabolite was standardized using stable isotope standards of the respective carnitines at known concentrations to determine metabolite concentration. The urinary concentration was further normalized to urinary creatinine.
2.6 Histopathological analysis
Mouse kidney samples were fixed in 4% paraformaldehyde, embedded in paraffin, sectioned, and stained with hematoxylin-eosin or periodic acid-Schiff (PAS). Glomerular and mesangial areas were quantified by analyzing 10 randomly selected glomeruli per animal, and the mean value for each animal was used for statistical analysis (n = 4 per group). Immunostaining was performed on paraffin-embedded sections using a pS6 monoclonal antibody (1:200) or a cystatin C antibody (1:200). For fluorescence quantification, images were randomly captured by a blind investigator. Images were analyzed using BZ-X Hybrid Cell Count software (Keyence).
2.7 mRNA analysis
Total RNA was extracted from mouse kidney samples using TRIzol reagent (Invitrogen). Reverse transcription was carried out using 1 μg of RNA and the QuantiTect Reverse Transcription Kit (Qiagen). Quantitative real-time PCR was performed using TB Green Premix Ex Taq II (Takara Bio) on the Step-One plus Real-Time PCR System (Applied Biosystems). The primer sequences for the selected genes are listed in the Supplementary Table S1. Results were normalized to Gapdh expression and presented as fold changes relative to gene expression in the control mice.
2.8 Western blot analysis
Mouse kidney homogenates were prepared using Western lysis buffer (20 mM Tris-HCl pH 7.6, 150mM NaCl, 2 mM EDTA, 0.5% NP-40) containing protease and phosphatase inhibitor tablets (Roche Applied Science, Mannheim, Germany). Protein levels in the samples were quantified using a bicinchoninic acid (BCA) protein assay kit (Thermo Fisher Scientific), then mixed with Laemmli sample buffer (Bio-Rad, Hercules, CA, USA) and heated at 95 °C for 5 min. A total of 10 μg of protein was separated by SDS-PAGE and transferred onto a PVDF membrane. After blocking, the blots were incubated overnight at 4 °C with primary antibodies (1:1000) against pS6 (Ser235/236), tS6, p-p70 S6 Kinase (Thr389; pS6K), p70 S6 Kinase (S6K), eEF2K, KLF15, BCAT2, p-BCKDHA(S293), BCKDHA, PPM1K, or BCKDK; primary antibodies (1:2000) against fibronectin, eEF2, or DLD; or a primary antibody against TGF-β1 (1:500). Horseradish peroxidase (HRP)-conjugated secondary antibodies (1:2000) were applied for 1h at room temperature, followed by chemiluminescence detection using the Western Blotting Detection System (GE Healthcare, Buckinghamshire, UK). Relative band intensities were quantified using ImageJ software (NIH, Bethesda, MD, USA). The antibodies used are listed in Supplementary Table S2. Full blot images are presented in Supplementary Figures S3-S5.
2.9 Statistical analyses
Statistical analyses were performed using GraphPad Prism 10 software (GraphPad, San Diego, CA, USA). Sample sizes are reported in the results section and figure legends. For the comparison of baseline characteristics, including sex and concomitant medication use, Fisher’s exact test was used. The Shapiro–Wilk test was used to assess the normality of the data. Clinical trial data were reported as the mean ± SD or the median (interquartile range), depending on the distribution. For normally distributed data, differences were analyzed using an unpaired two-tailed Student’s t-test. For non-normally distributed data, differences were analyzed using the Mann–Whitney test. For animal studies, results are presented as the mean ± SEM. Statistical significance among three or more groups was determined using two-way ANOVA followed by Tukey’s or Dunnett’s post hoc test. P-values <0.05 were considered statistically significant.
3 Results
3.1 Dapagliflozin treatment increases urinary excretion of BCAA metabolites compared with insulin in patients with diabetes
Seventeen patients were enrolled in the study, eight in the insulin group and nine in the dapagliflozin group (Figure 1). Baseline characteristics including the use of concomitant medications were similar between the two groups (Table 1). During the study, three patients in the insulin group withdrew due to development of malignant disease (n=2) or heart failure (n=1), while one patient in the dapagliflozin group withdrew due to an adverse event (increased urine output). Five patients in the insulin group and eight in the dapagliflozin group completed the 12-week intervention. No participants experienced or reported symptomatic hypoglycemia.
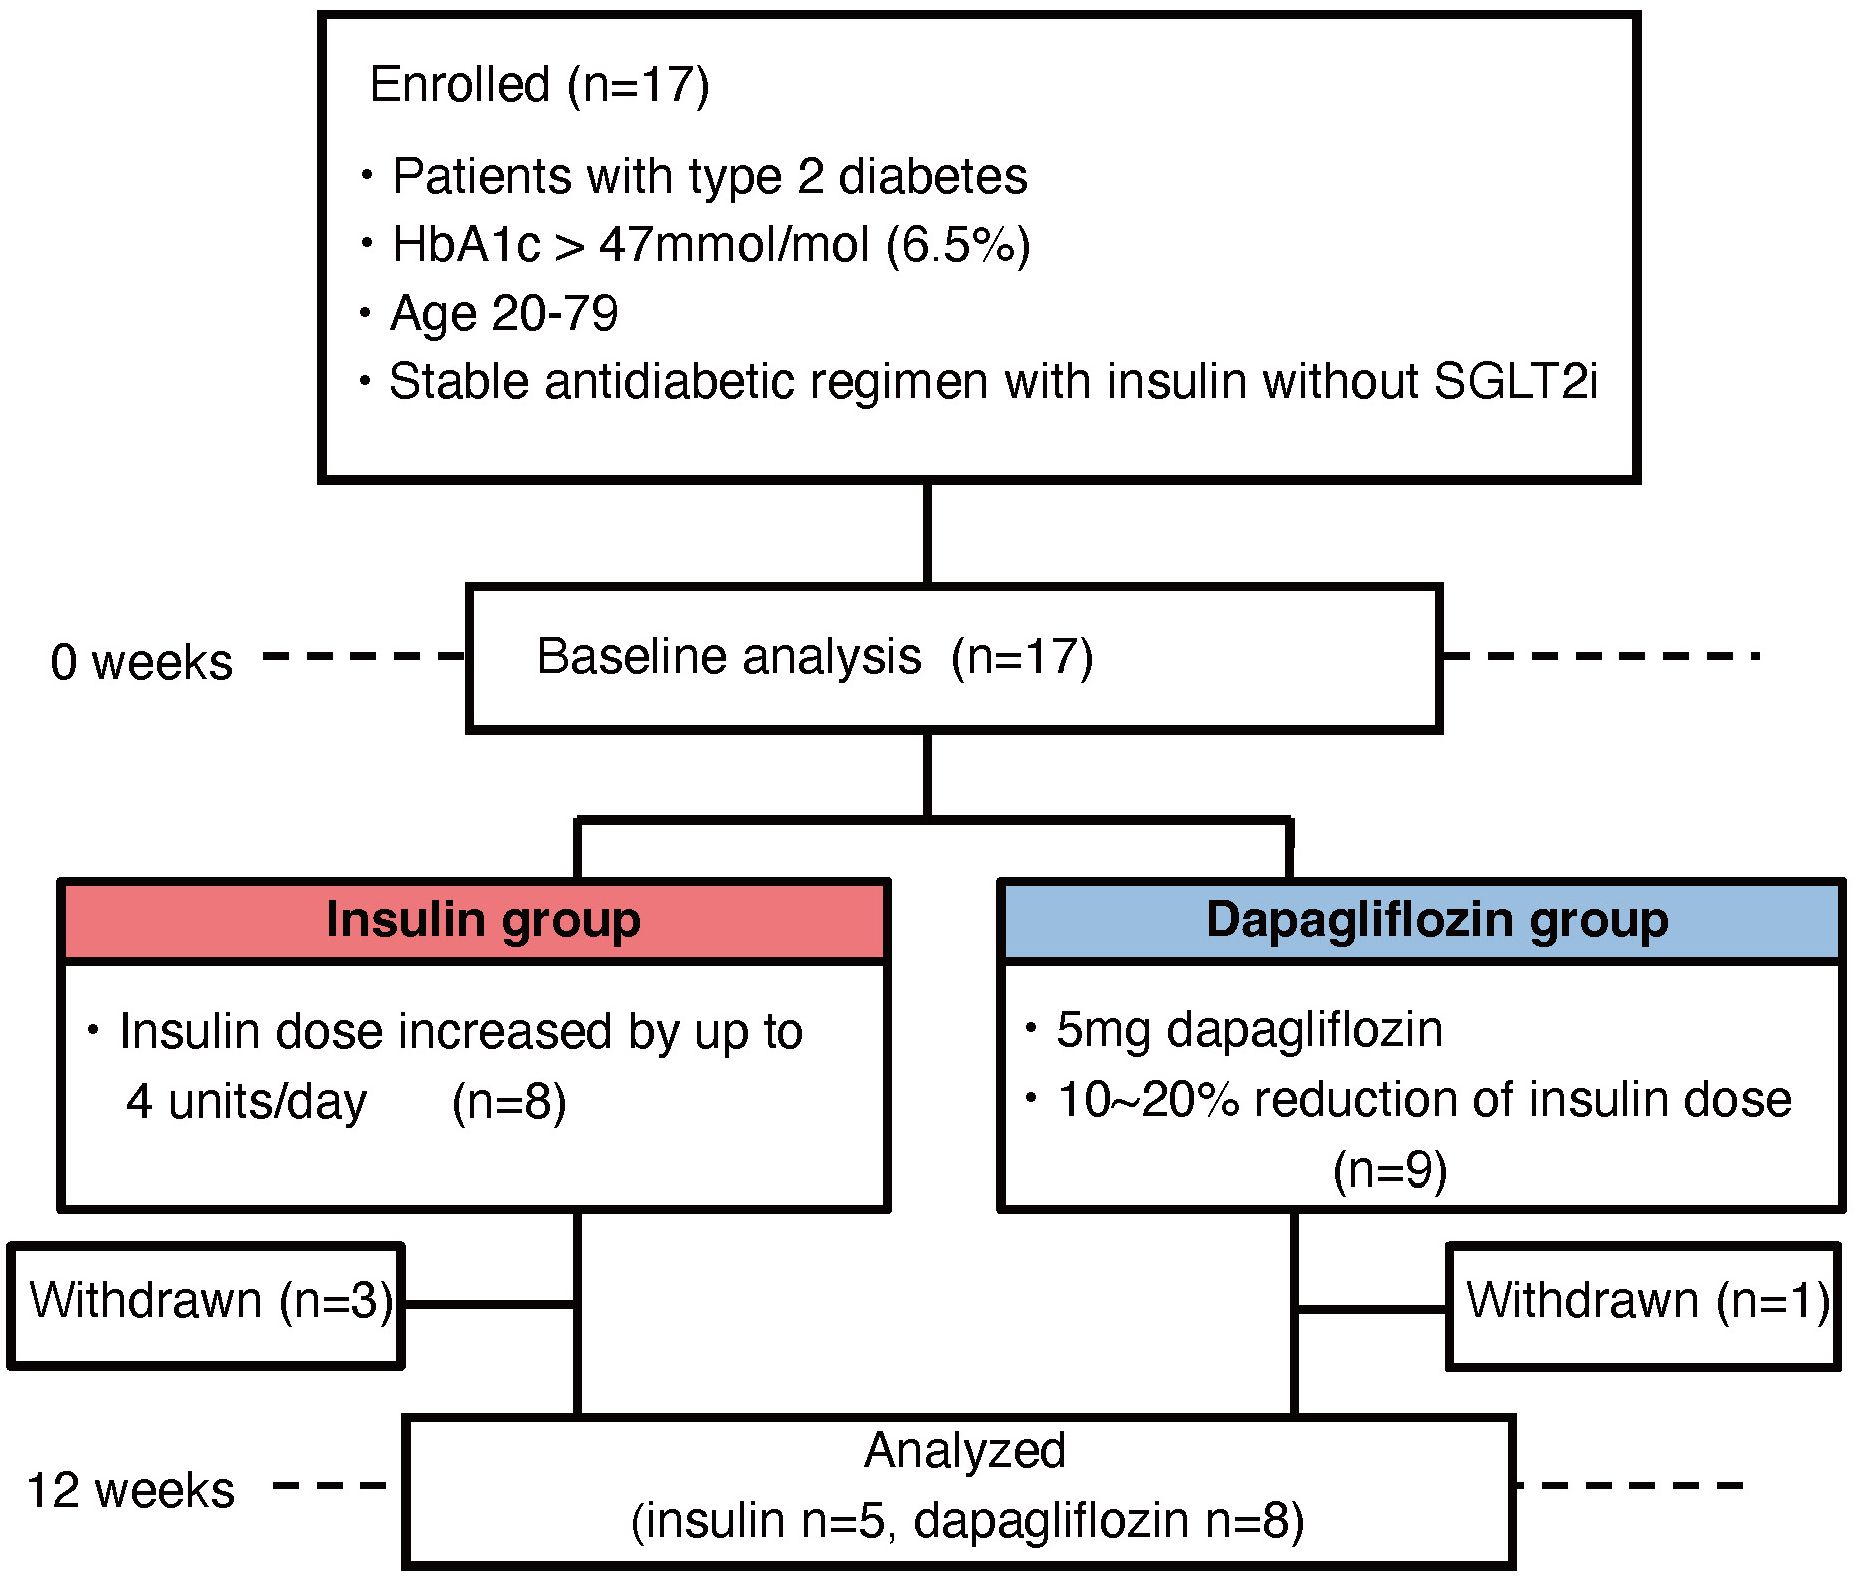
Figure 1. Flowchart of patient enrollment.
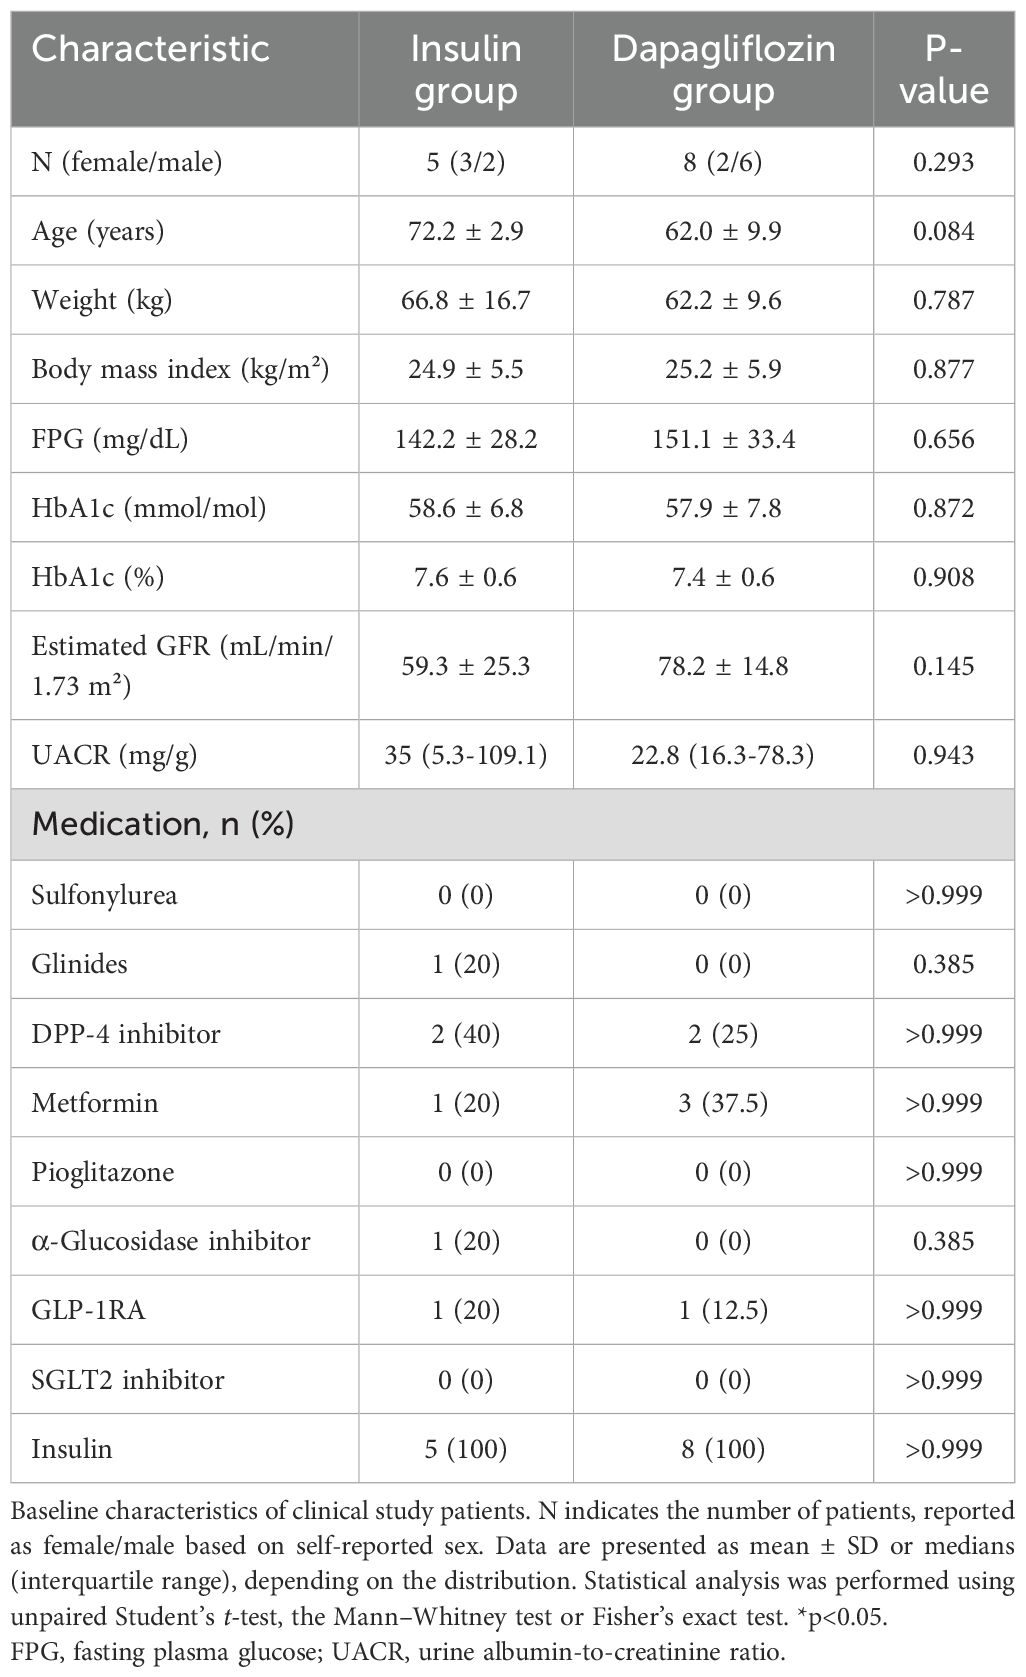
Table 1. Baseline characteristics of the patients.
The 12-week intervention did not induce significant changes in glycemic control in either group (Table 2), likely due to the limited increase in insulin dose (2–4 units/day) in the insulin group and the reduction of insulin dose (approximately –20%) in the dapagliflozin group. There were no significant changes in body weight, skeletal muscle mass, skeletal muscle percentage, or body fat in the insulin group. In contrast, the dapagliflozin group showed a non-significant trend toward decreased body weight and a significant decrease in body fat mass and percentage (Table 2). Skeletal muscle mass was preserved in both groups, while the skeletal muscle percentage was significantly increased in the dapagliflozin group, reflecting the reduction in body fat. However, this observation should be interpreted with caution because of the unequal distribution of sex and age between the groups (Table 1). In the insulin group, eGFR increased modestly, whereas it remained stable with dapagliflozin. Given that renal function markers, including urinary albumin and L-FABP, did not show significant changes in either group, the slight eGFR increase in the insulin group might reflect hemodynamic variation.
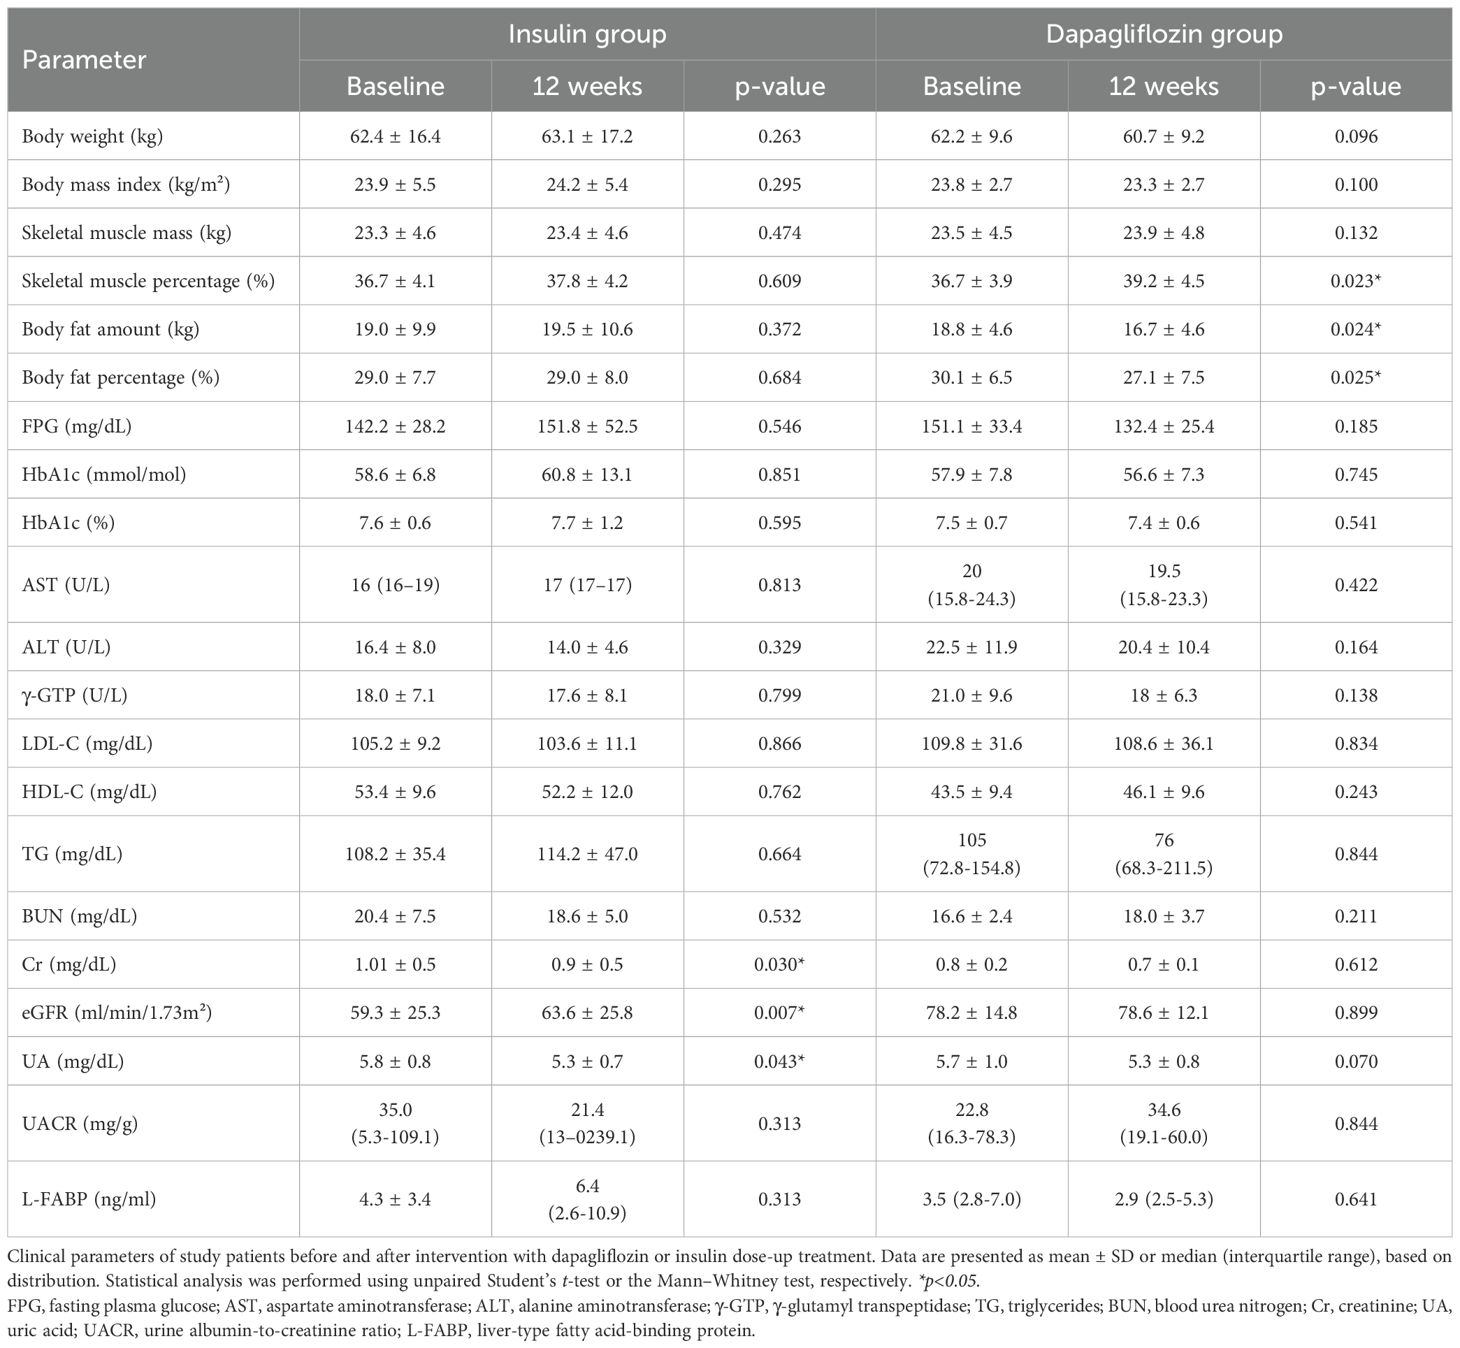
Table 2. Clinical parameters at baseline and after 12 weeks of treatment.
We analyzed urinary levels of metabolites and short-chain acylcarnitines (C3, C4, and C5 carnitine) related to BCAA catabolism, including six metabolites previously identified as DKD biomarkers. Because absolute values varied considerably among patients, we analyzed changes from before to after the intervention. BCAA downstream metabolites—C5-OH carnitine [a leucine-derived metabolite], 3-hydroxypropionic acid [an isoleucine and valine-derived metabolite], and 3-hydroxybutyric acid [also known as a leucine-derived metabolite]—exhibited significantly greater increases in the dapagliflozin group compared with the insulin group (Figure 2). These findings are consistent with those of Mulder et al., who reported increases in 3-hydroxypropionic acid and two other metabolites, 3-methylcrotonylglycine and 2-methylacetoacetate, which were not detected in the present assay, after dapagliflozin treatment. In contrast, C4 carnitine, an earlier metabolite in valine catabolism, showed a significantly greater increase in the insulin group compared with the dapagliflozin group. Other DKD biomarker metabolites identified by Sharma et al., as well as the DKD metabolite score (MSDKD) calculated based on Mulder et al. (17), showed no significant differences in changes between treatment groups (Supplementary Figures S1A, B). We also measured these BCAA metabolites in plasma; however, no significant between-group differences in changes corresponding to those observed in urine were detected (Figure 3). Similarly, no significant group differences were observed in plasma concentrations of other DKD biomarker metabolites (Supplementary Figure S1C).
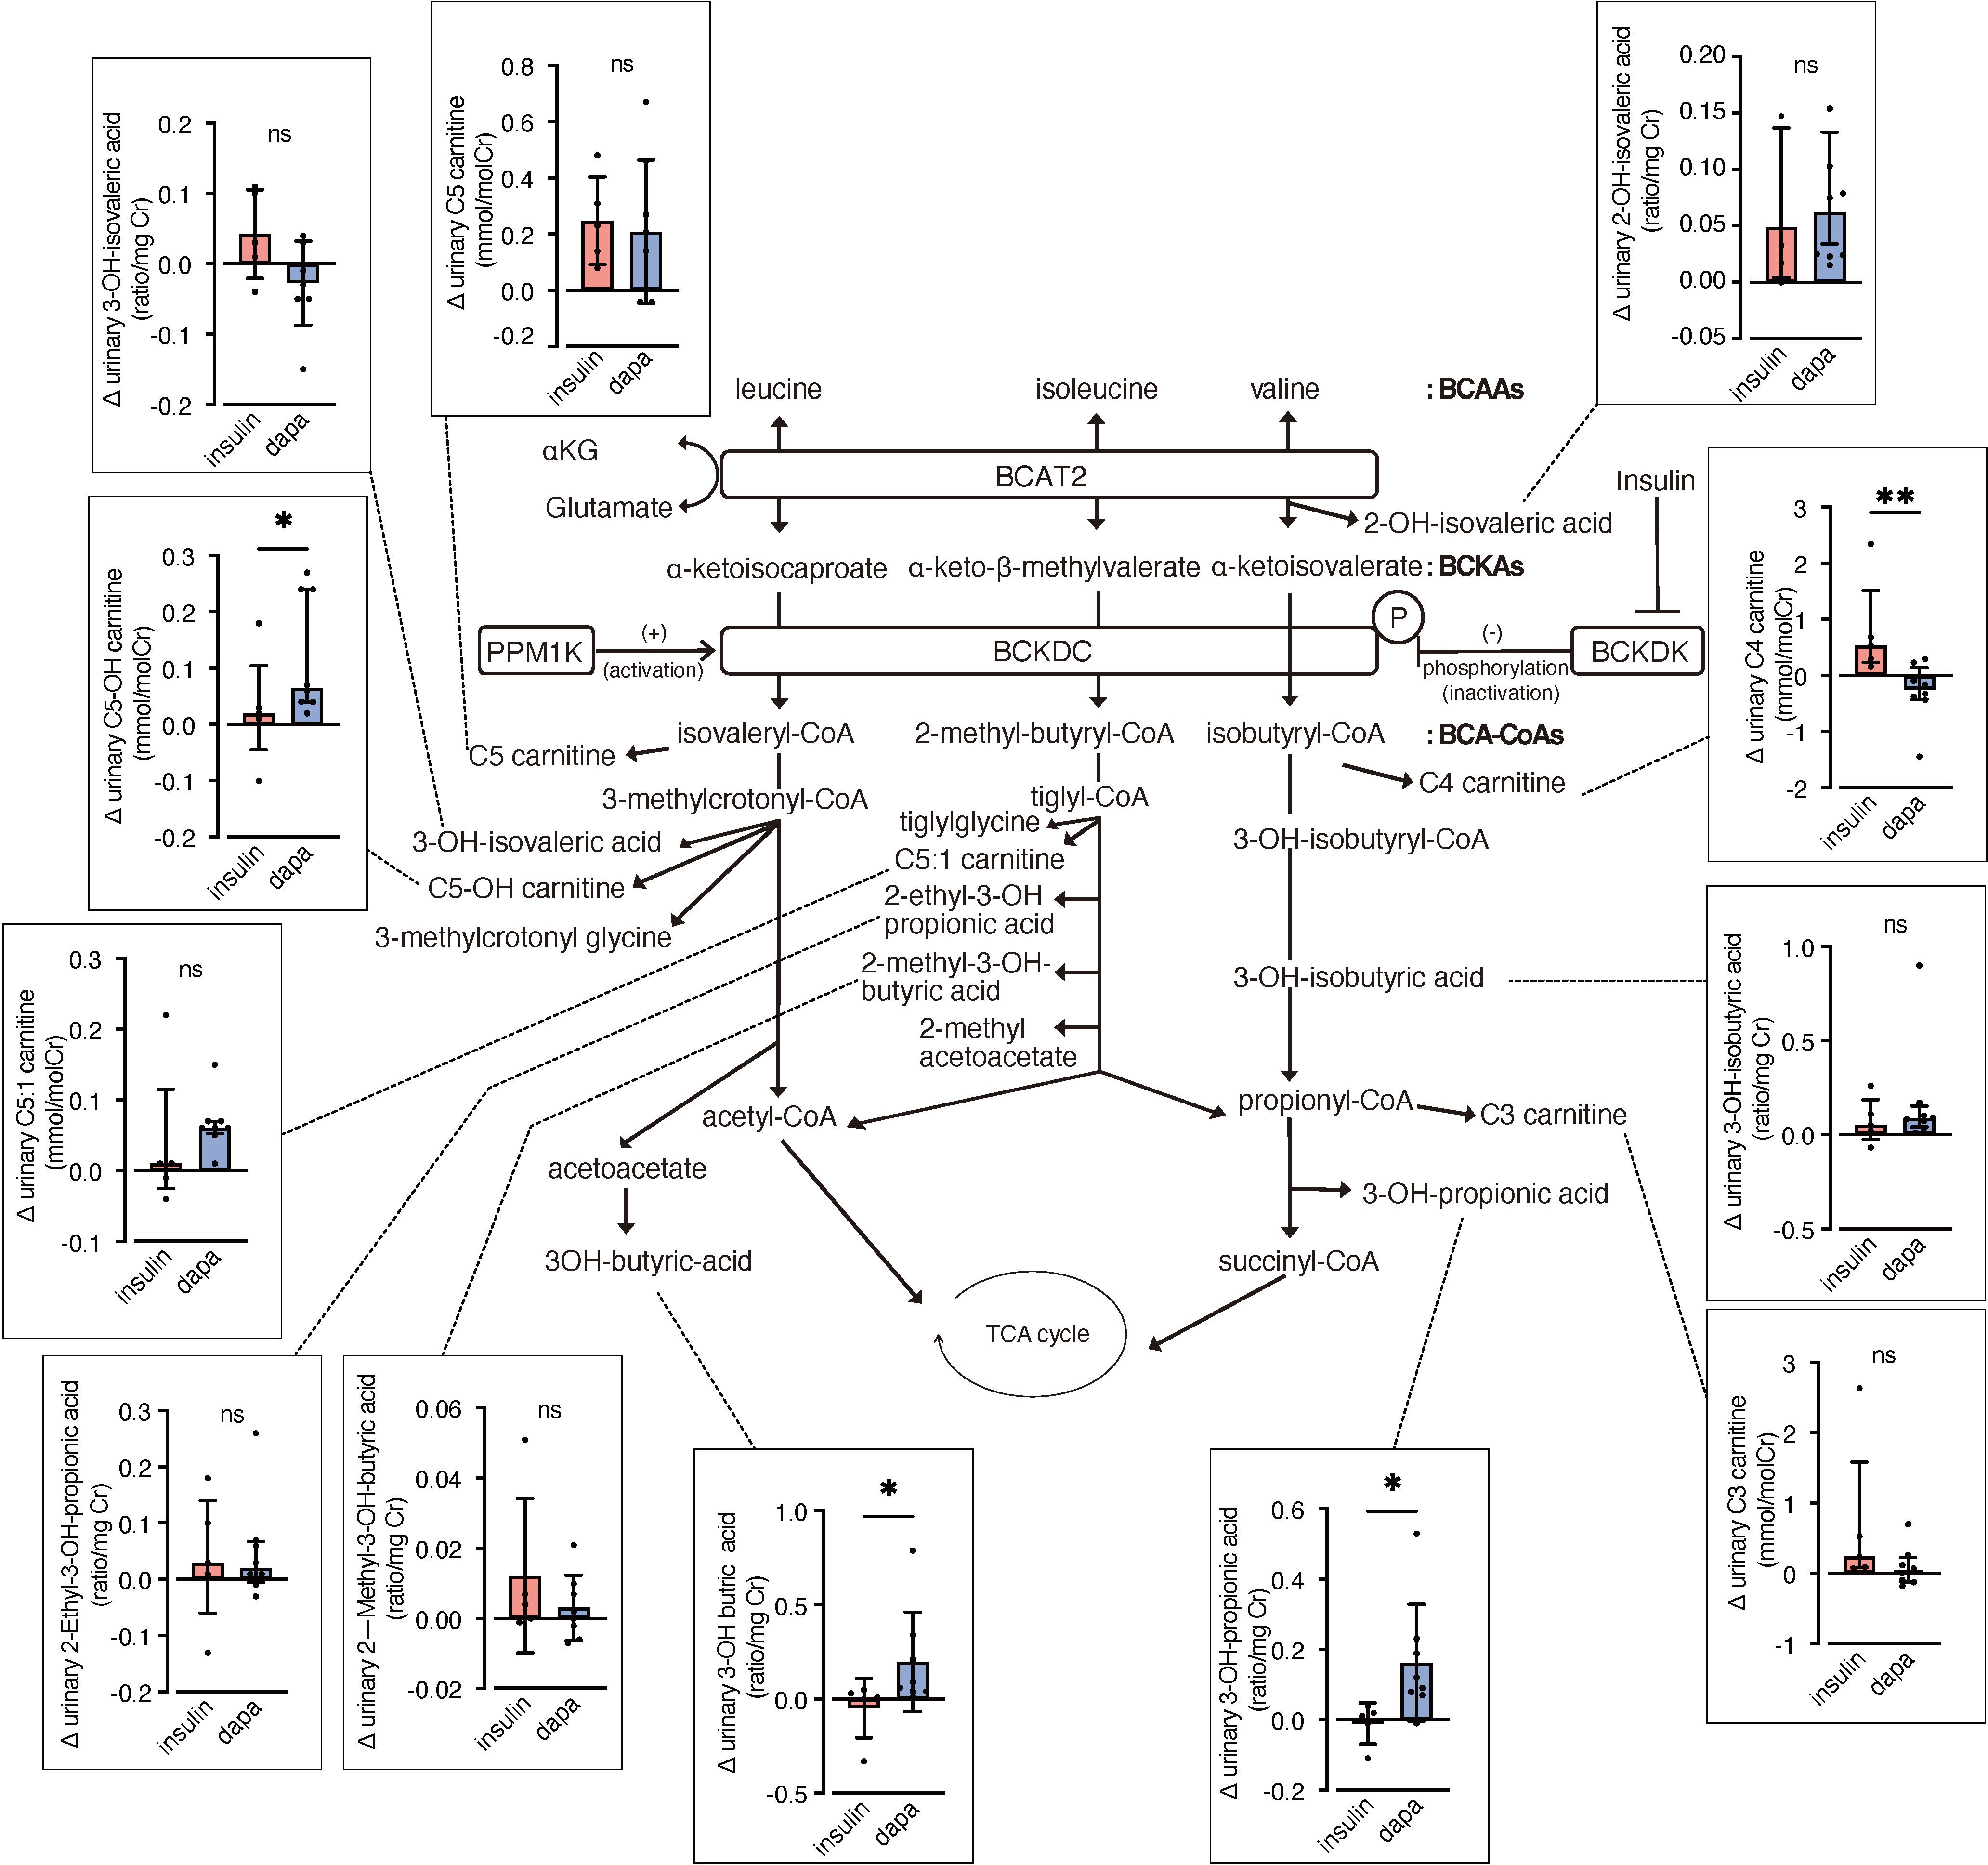
Figure 2. Changes in urinary BCAA metabolites induced by dapagliflozin or insulin dose-up treatment. The BCAA catabolic pathway and changes in the levels of urinary metabolites and acylcarnitines related to BCAA catabolism after 12 weeks of insulin dose-up or dapagliflozin treatment. Data are expressed as mean ± SD for normally distributed variables, or as median with error bars representing the interquartile range for non-normally distributed variables. Statistical analysis was performed using unpaired Student’s t-test or the Mann–Whitney test, respectively. *p<0.05. TCA cycle, Tricarboxylic acid cycle; αKG, α-ketoglutarate; BCAA, branched chain amino acid; BCKA, branched-chain α-ketoacids; BCA-CoA, branched-chain acyl-CoA; BCAT2, branched-chain aminotransferase 2; BCKDC, branched-chain α-ketoacid dehydrogenase complex; BCKDK, branched-chain α-ketoacid dehydrogenase kinase; PPM1K, protein phosphatase, Mg2+/Mn2+ dependent 1K.
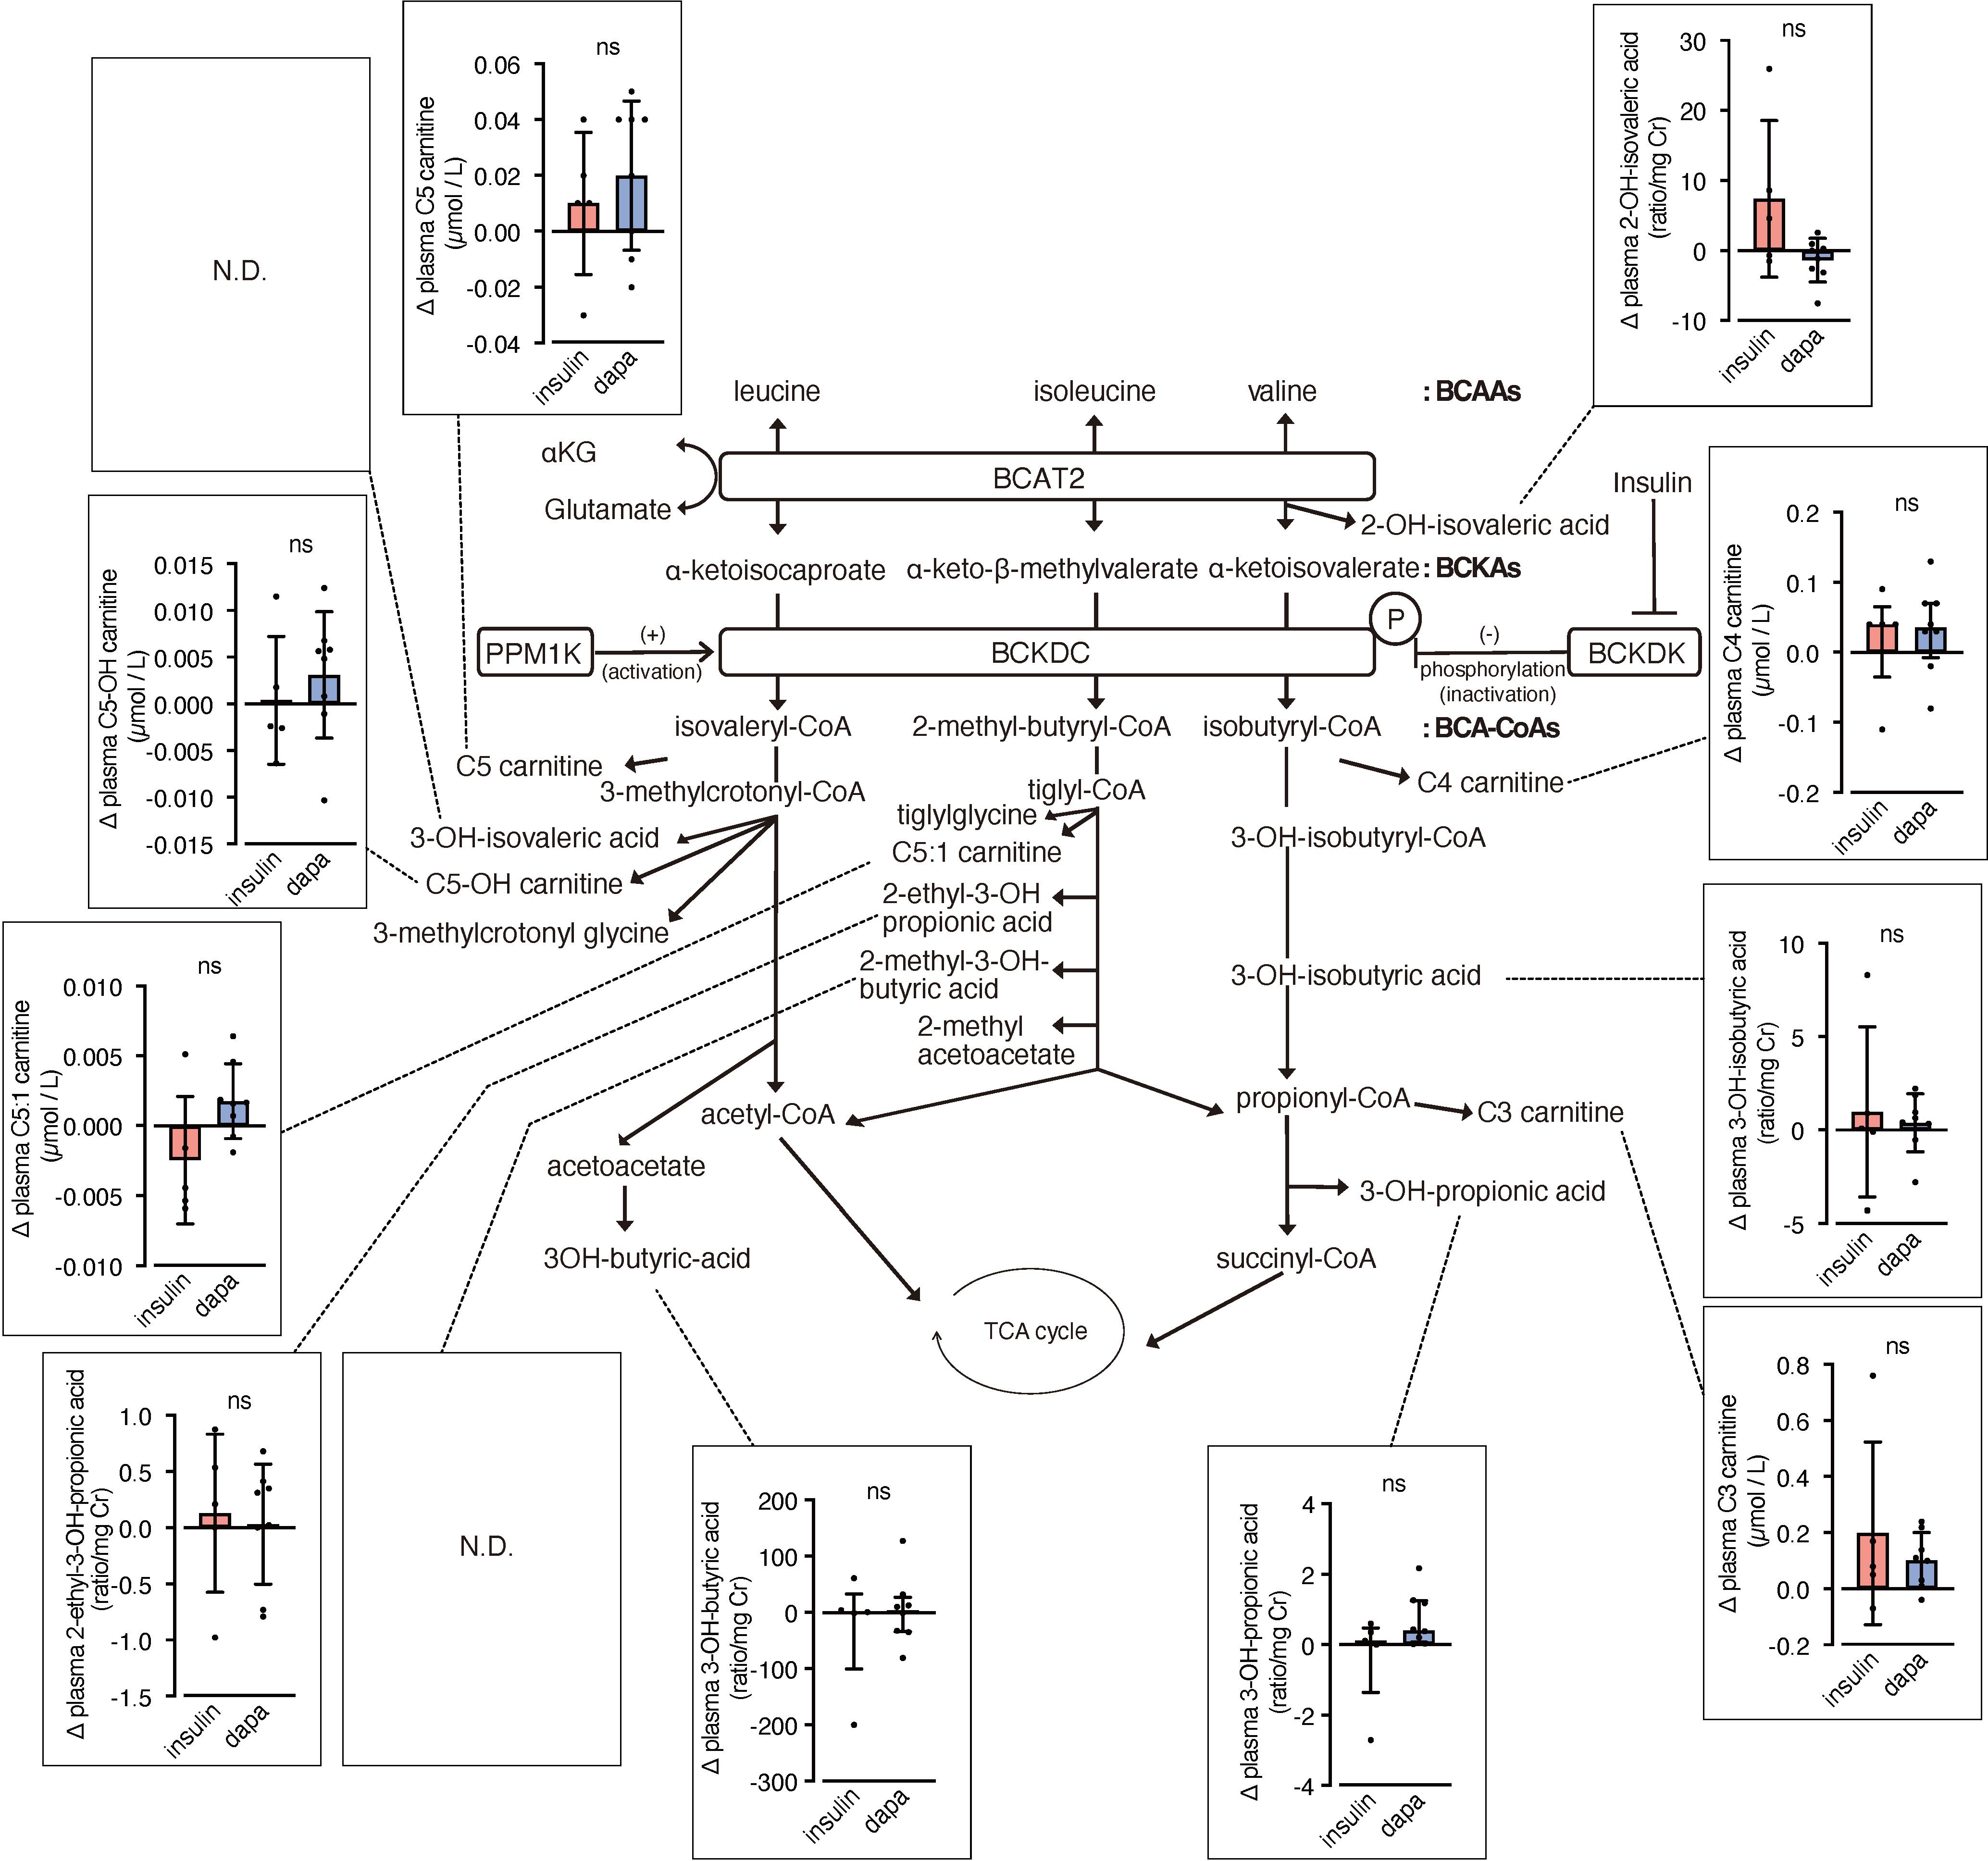
Figure 3. Changes in plasma BCAA metabolites induced by dapagliflozin or insulin dose-up treatment. The BCAA catabolic pathway and changes in the levels of plasma metabolites and acylcarnitines related to BCAA catabolism after 12 weeks of insulin dose-up or dapagliflozin treatment. Data are expressed as mean ± SD for normally distributed variables, or as median with error bars representing the interquartile range for non-normally distributed variables. Statistical analysis was performed using unpaired Student’s t-test or the Mann–Whitney test, respectively. *p<0.05..
3.2 Dapagliflozin does not significantly affect blood levels of branched-chain amino acids in patients with diabetes
To assess the potential effect of dapagliflozin on BCAA metabolism in the kidney, we analyzed amino acid concentrations in urine and blood. In urine samples, there was a trend towards increased levels of valine (p = 0.06) and total BCAA (p = 0.06) in the dapagliflozin group compared with the insulin group (Figure 4A). No significant changes or trends in plasma BCAA levels were observed between the two groups (Figure 4B). In contrast, blood glutamate (Glu) levels showed a trend towards an increase in the dapagliflozin group compared with the insulin group (p = 0.06).
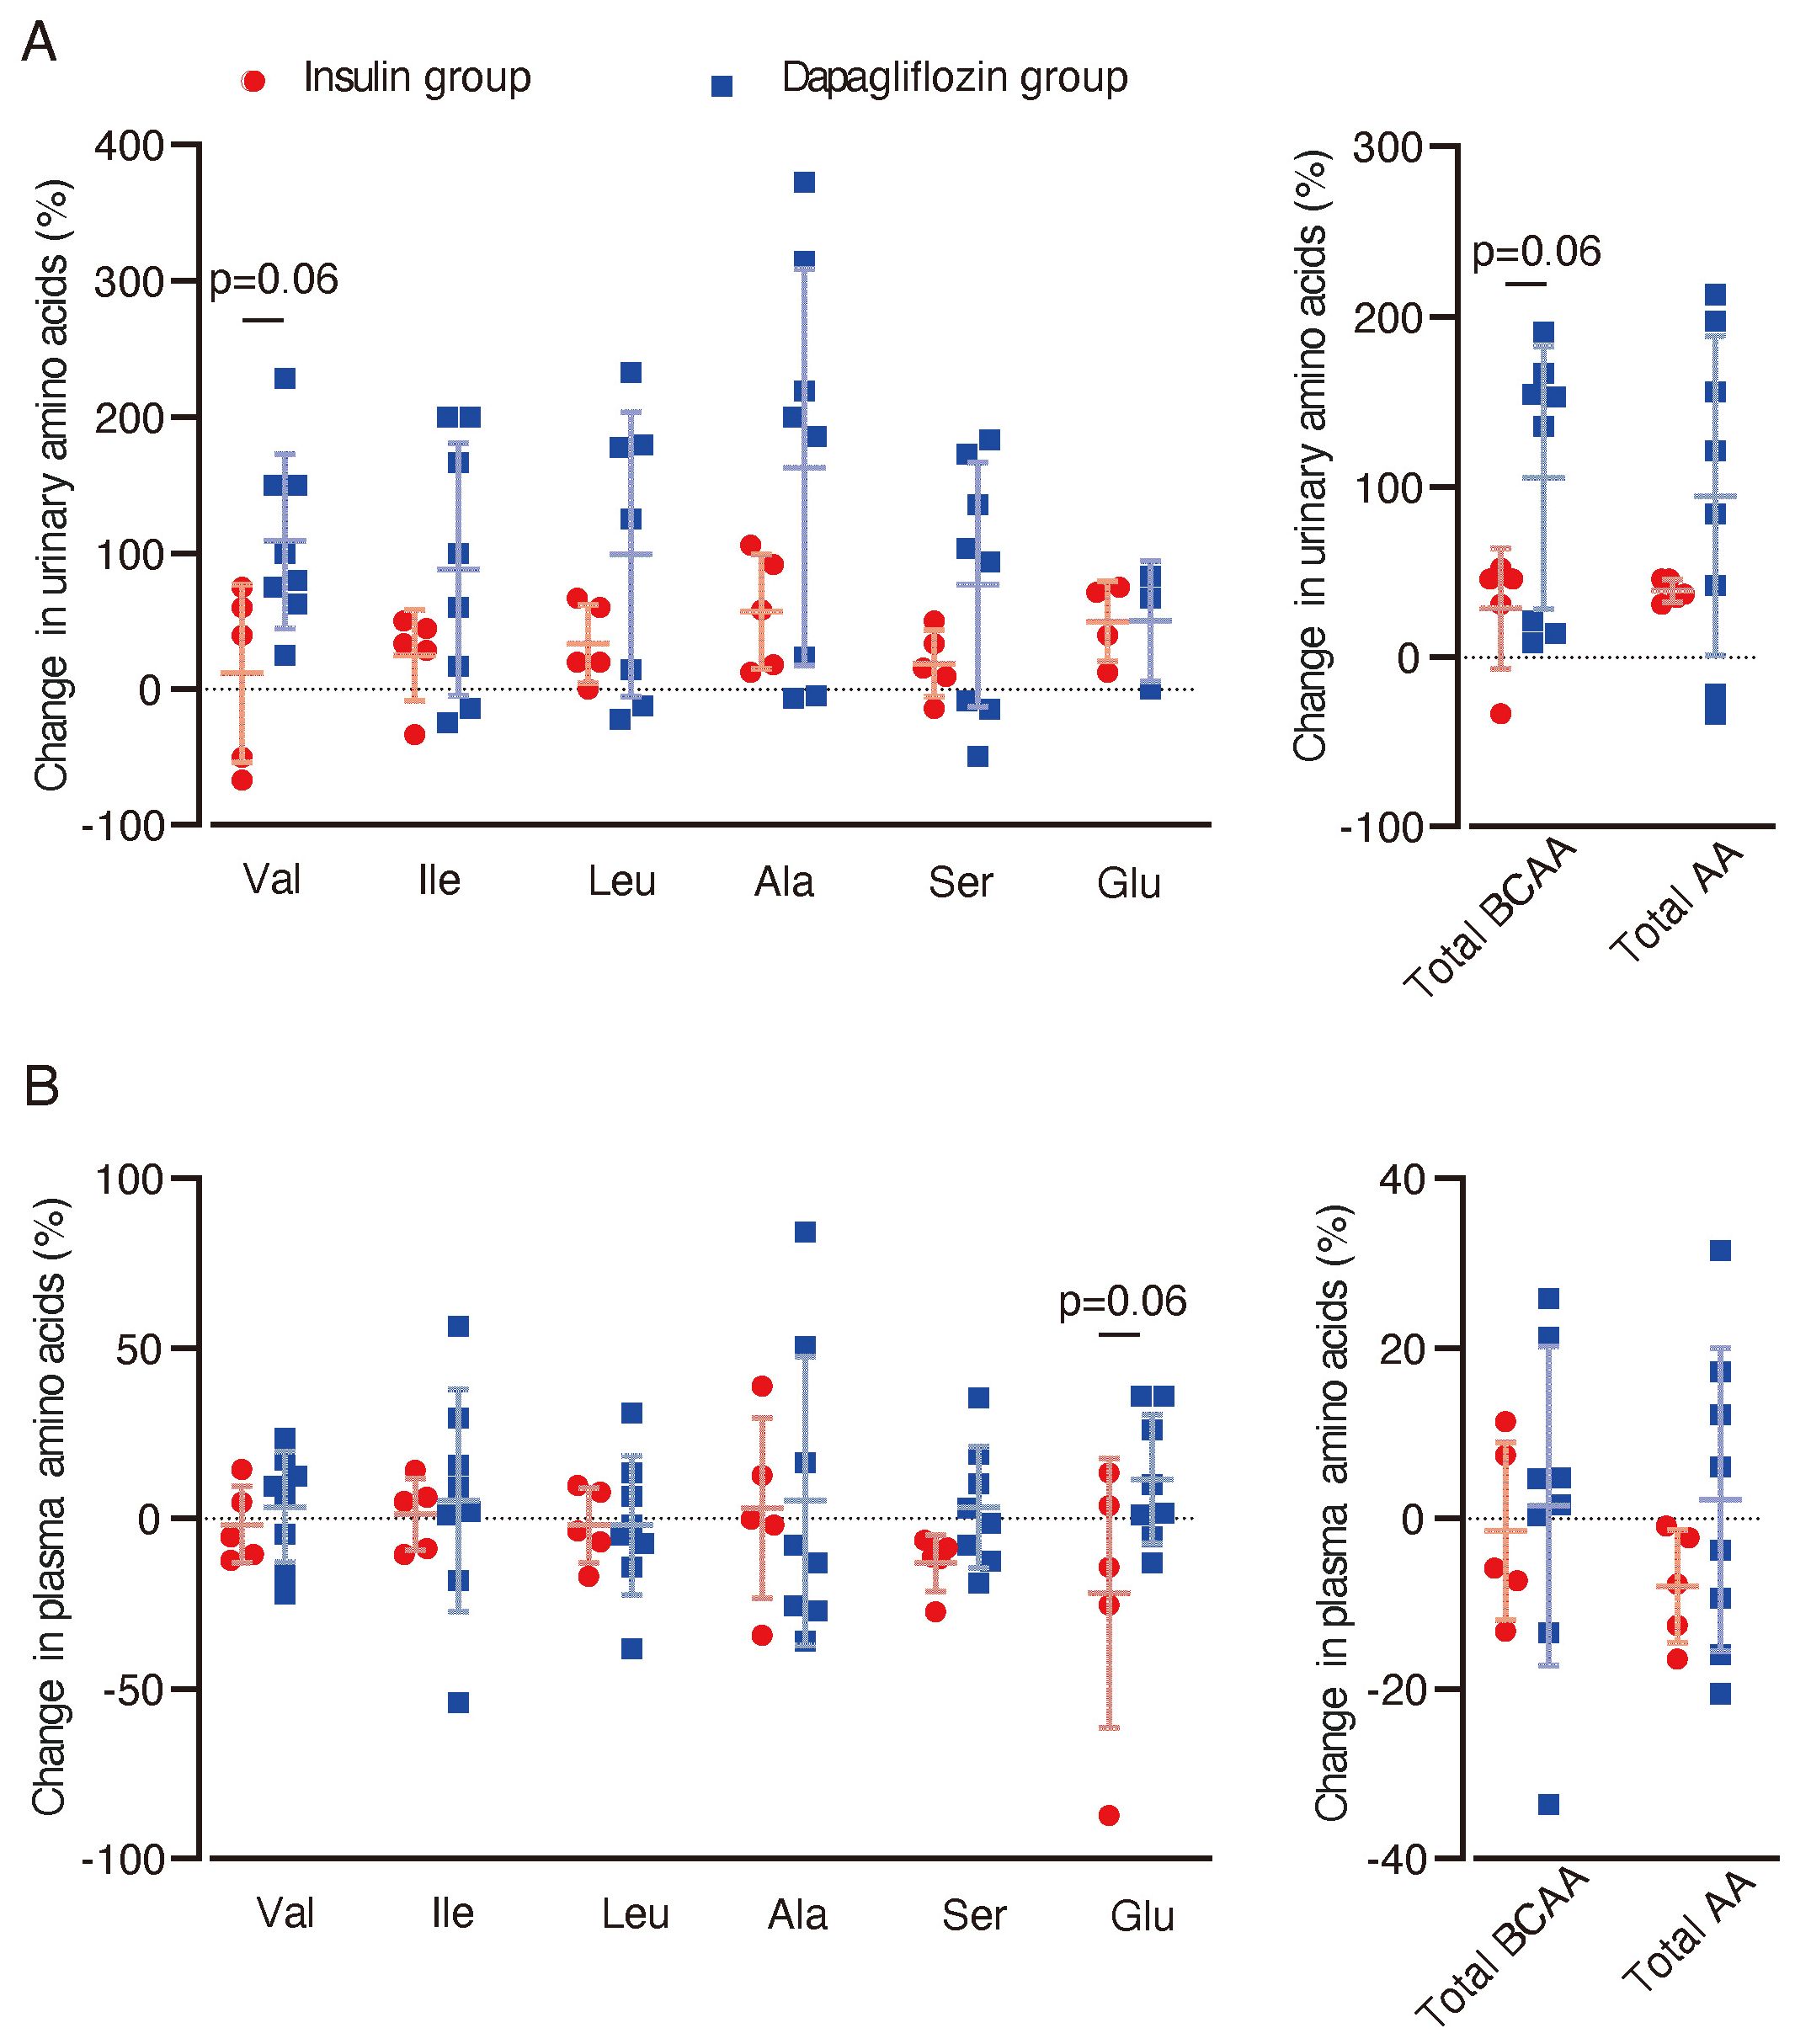
Figure 4. Changes in urinary and plasma amino acid concentrations after dapagliflozin or insulin dose-up treatment. Changes in urinary and plasma amino acid concentrations between baseline and 12 weeks after the intervention were analyzed. (A) Percentage changes (%) from baseline in urinary levels of amino acids after 12 weeks of intervention. (B) Percentage changes (%) in plasma levels of amino acids from baseline (dapagliflozin n=8, insulin n=5). Data are expressed as mean ± SD. Statistical analysis was performed using unpaired Student’s t-test. Val, valine. Ileu, isoleucine; Leu, leucine; Ala, alanine; Ser, serine; Glu, glutamic acid.
3.3 Luseogliflozin reduces mesangial expansion and tubular epithelial atrophy compared with insulin glargine in db/db mice
To further investigate the effects of SGLT2 inhibitors on renal branched-chain amino acid (BCAA) metabolism, we performed analyses in diabetic db/db mice. Ten-week-old db/db mice were subjected to a 4-week treatment regimen with luseogliflozin (10 mg/kg/day, oral) or insulin glargine (10 U/day, s.c.), while other db/db mice and db/+ mice served as untreated and non-diabetic controls, respectively (Figure 5A). Both luseogliflozin and glargine treatment significantly reduced blood glucose levels compared with the control group (Figure 5B). Glargine treatment led to significant body weight gain, whereas luseogliflozin did not cause weight changes compared with the control group (Figure 5C).
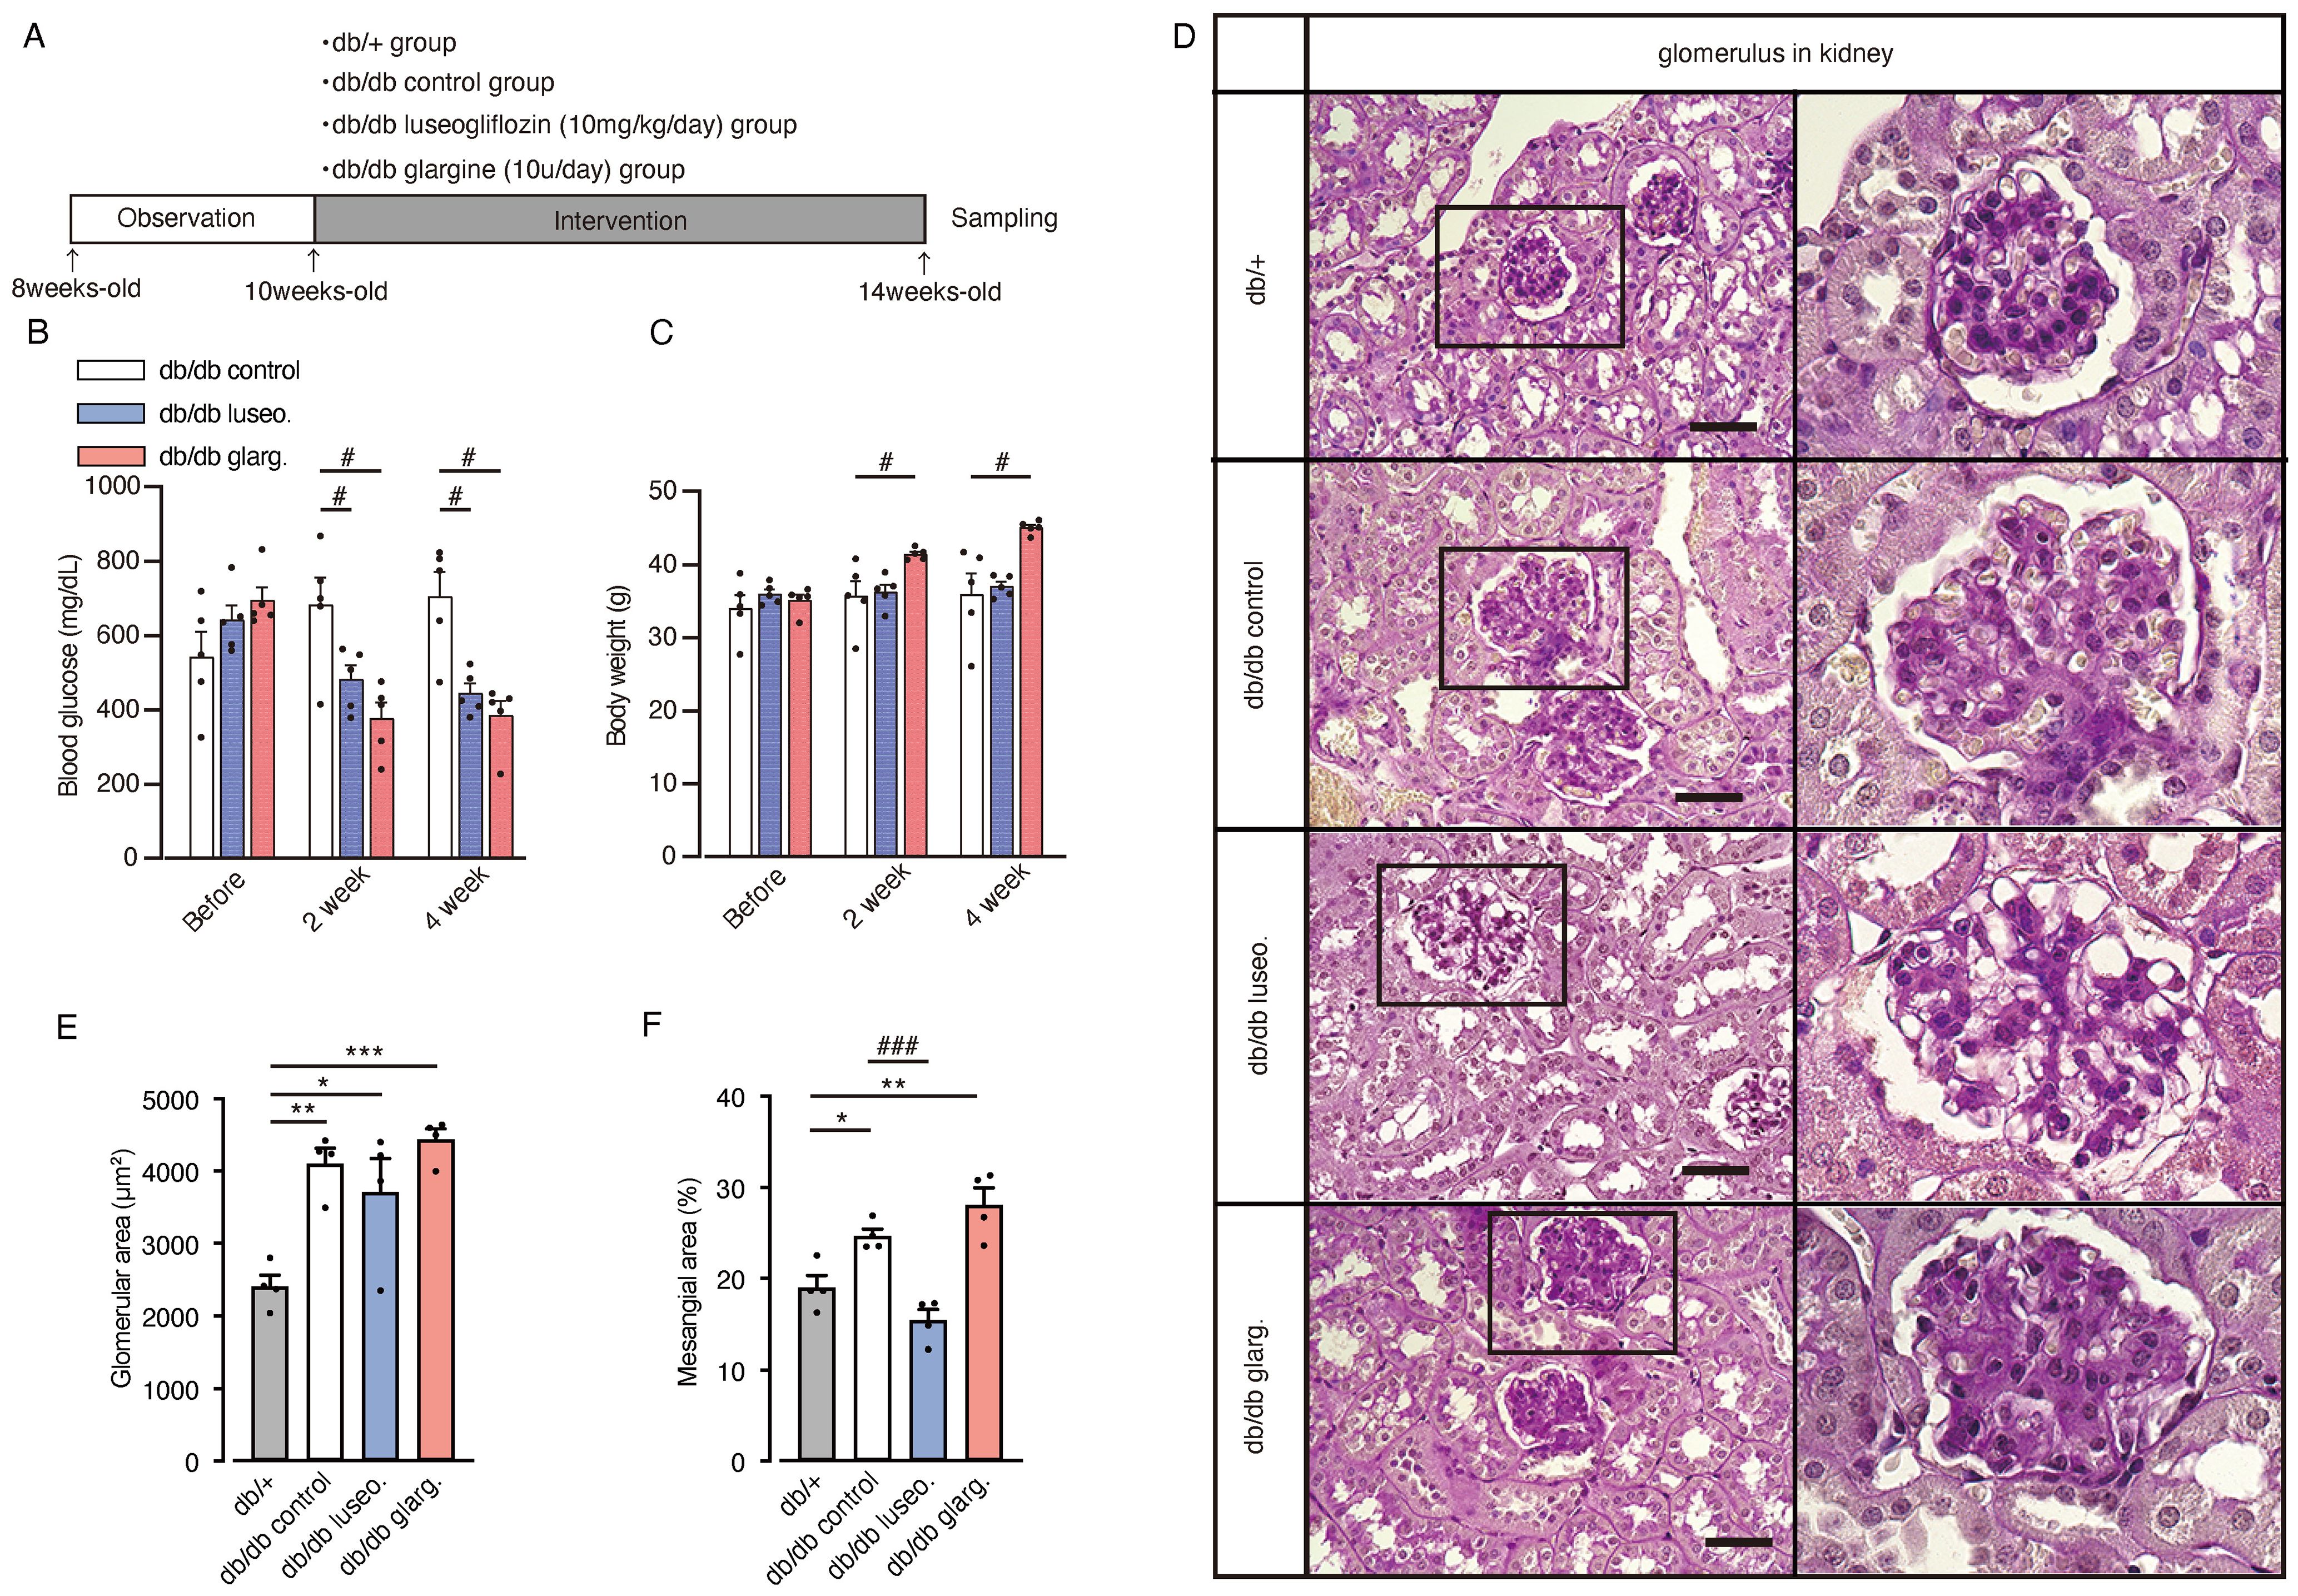
Figure 5. Effect of luseogliflozin and insulin glargine treatment on glomeruli of db/db diabetic mice. Db/db diabetic mice were treated with luseogliflozin (10 mg/kg/day, oral) or insulin glargine (10 U/body/day, s.c.). (A) Workflow of the animal experiment. (B, C) Blood glucose levels (B) and body weight (C) of mice before and after the intervention. (D) Representative PAS staining of kidney sections after 4 weeks of intervention. (E, F) Glomerular cross-sectional area (μm²) (E) and percentage of PAS-positive mesangial area (%) (F) were quantified in 10 randomly selected glomeruli per animal. Data are expressed as mean ± SEM of 4–5 mice per group. Statistical analysis was performed using two-way ANOVA followed by Tukey’s or Dunnett’s post hoc test. Scale bar, 50 μm. *p<0.05 versus db/+, # p<0.05 versus db/db control. PAS staining, periodic acid-Schiff staining.
Histological analysis revealed glomerular hypertrophy in all groups (control, luseogliflozin-treated, and insulin-treated), compared with non-diabetic db/+ mice (Figures 5D, E). Luseogliflozin significantly reduced mesangial expansion in db/db mice to levels similar to those in non-diabetic db/+ mice. This effect was not observed with glargine (Figures 5D, F).
Moreover, db/db control mice exhibited prominent tubular epithelial atrophy, reduced PAS staining in the brush border, and thickening of the basement membranes compared with non-diabetic db/+ mice (Figure 6A). Notably, luseogliflozin, but not glargine, reversed these pathological changes. Immunostaining revealed increased expression of the tubular injury marker cystatin-C in db/db mice compared with non-diabetic db/+ mice (Figures 6B, C). Both luseogliflozin and glargine treatment reversed the increase in cystatin-C expression (Figure 6C). Collagen type I alpha 1 (Col1a1) mRNA expression, an indicator of fibrosis, was significantly reduced in luseogliflozin-treated mice compared with the control group, whereas no significant reduction was observed in the glargine-treated mice (Figure 6D). Tgfb, Tnfa, and Il1b mRNA expression levels showed no significant differences between the groups. Western blot analysis of fibrosis-related factors revealed a significant reduction in TGF-β1 expression in luseogliflozin-treated mice compared with the glargine group, consistent with the changes in Col1a1 mRNA expression, one of the target genes of TGF-β (Figures 6E, F). Fibronectin expression was significantly reduced in the kidney tissue from both luseogliflozin- and glargine-treated groups compared with the control group (Figures 6E, G).
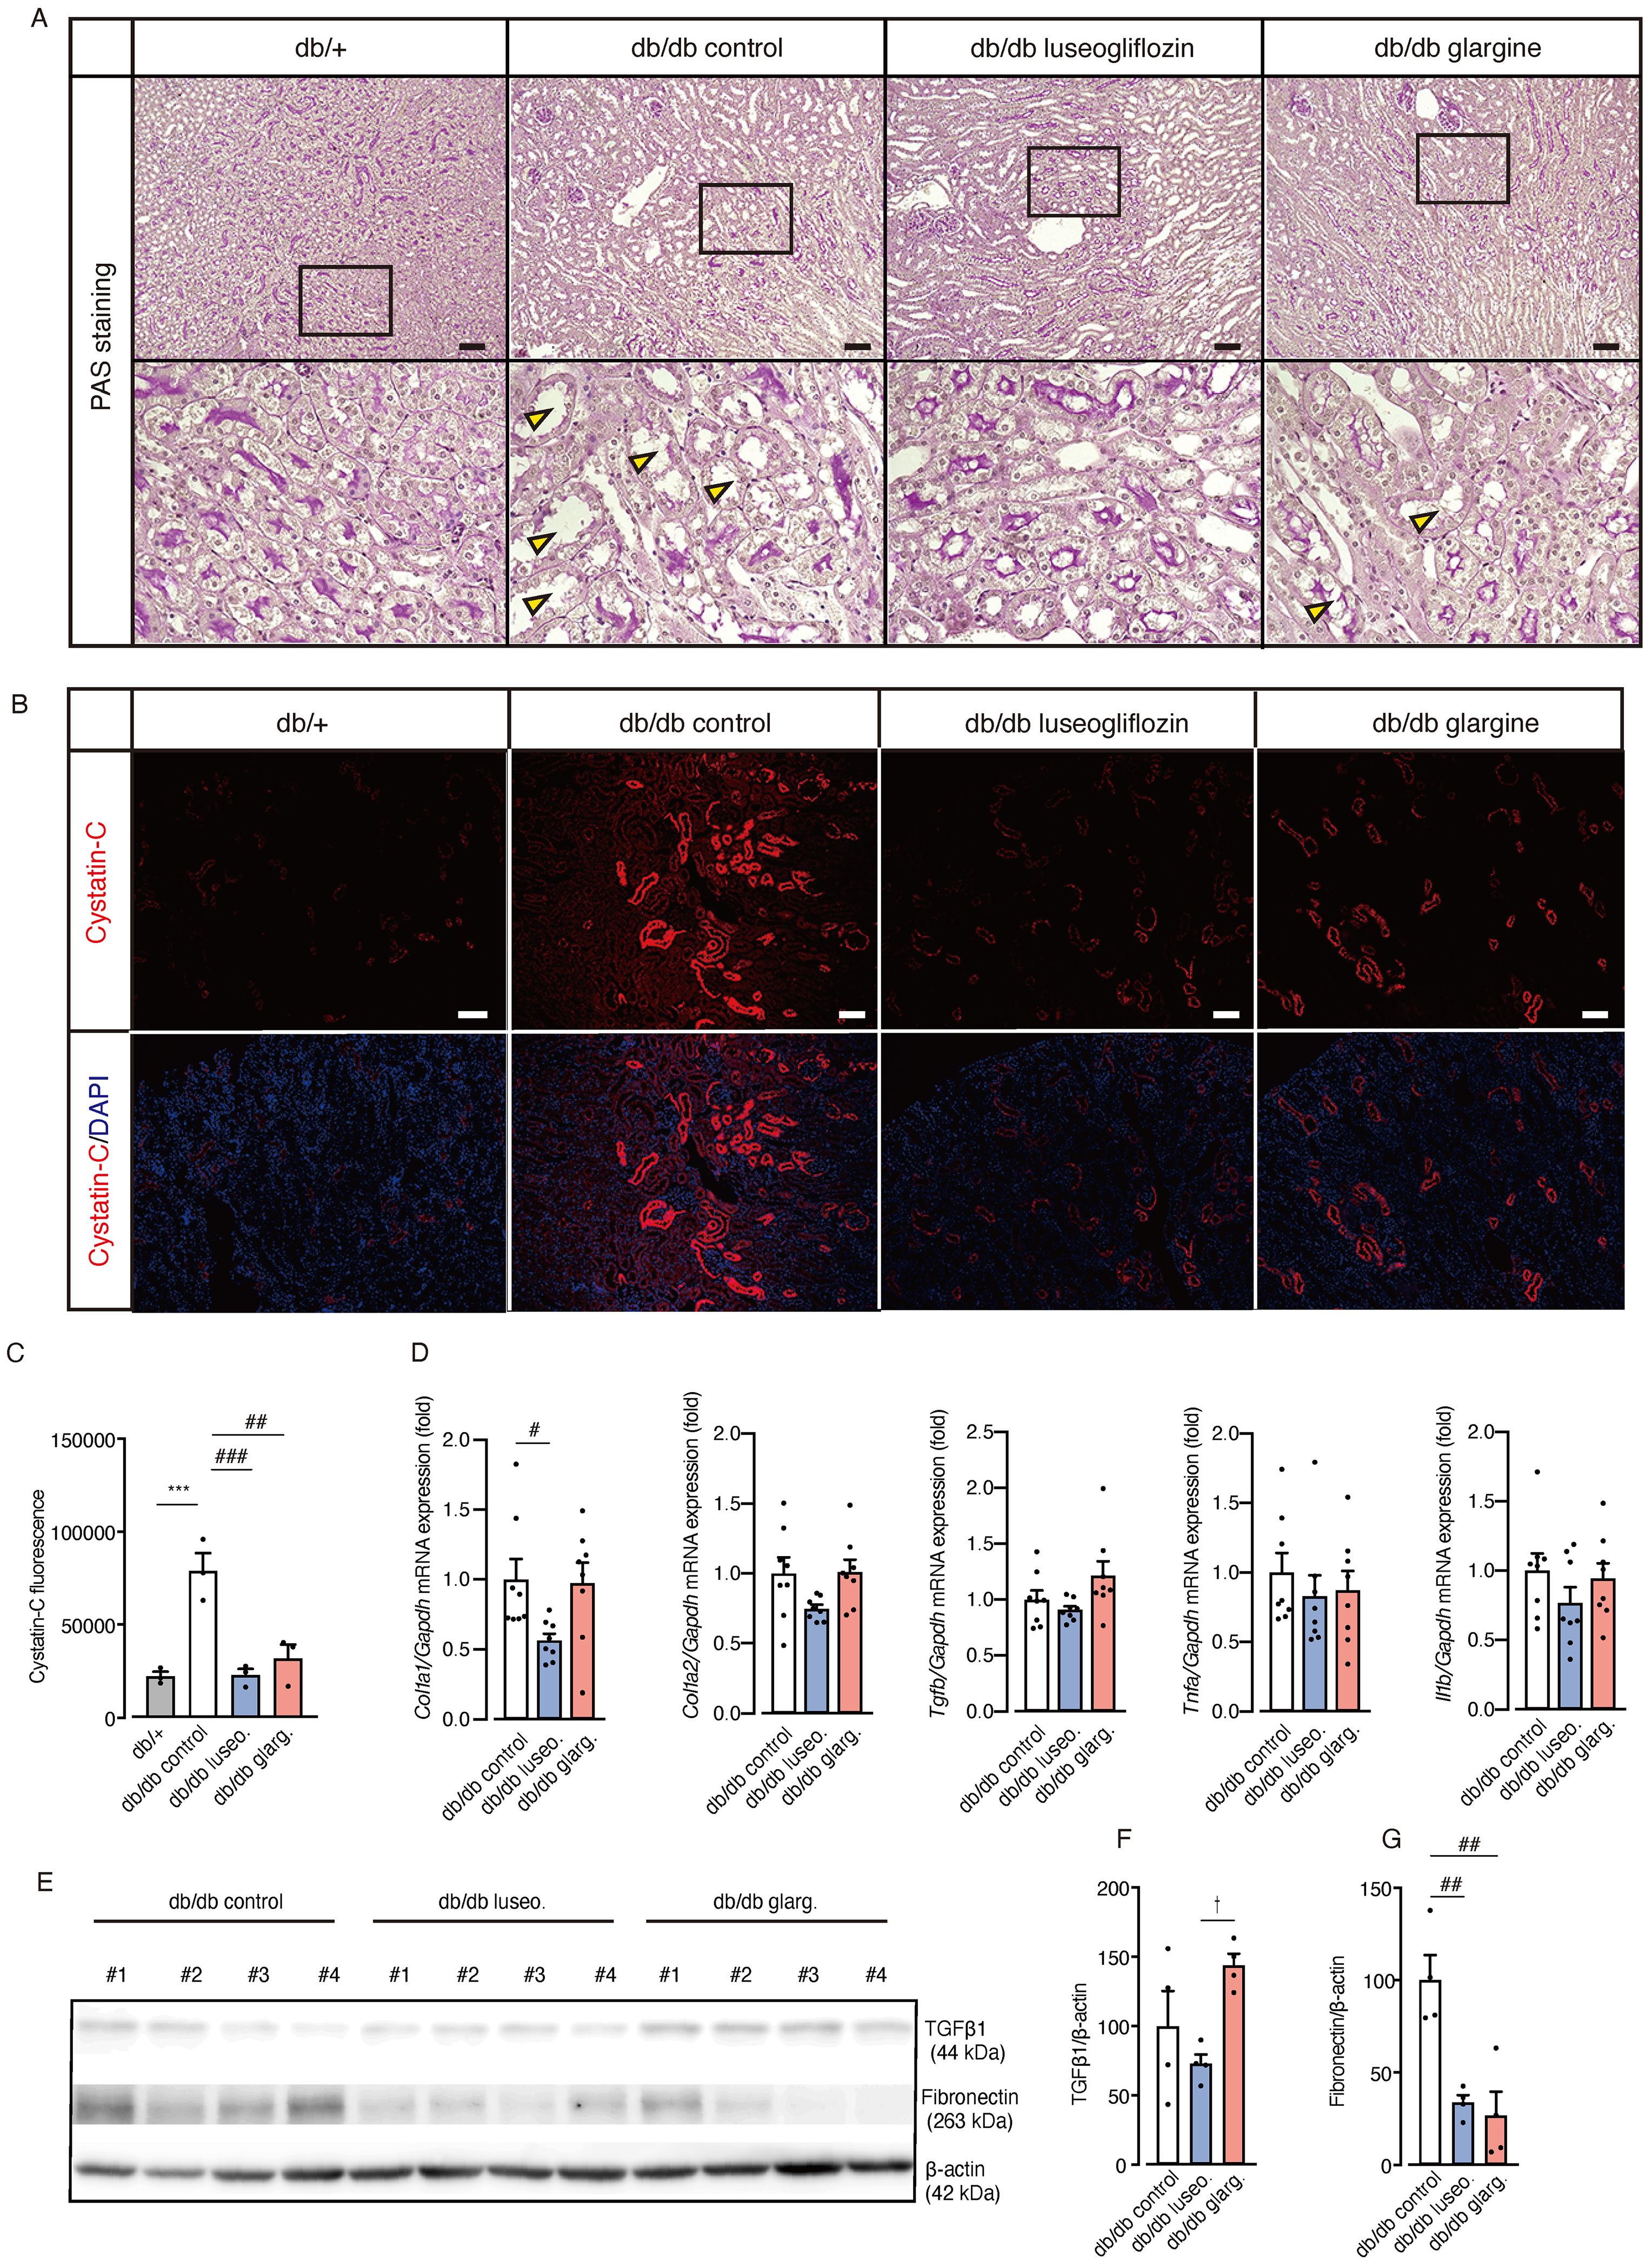
Figure 6. Effect of luseogliflozin and insulin glargine treatment on tubular epithelial atrophy, renal injury, and fibrosis in db/db diabetic mice. (A) Representative PAS staining of renal tubules after 4 weeks of intervention. Arrowheads indicate tubular atrophy with brush border loss. (B, C) Immunofluorescence staining for the proximal tubule injury marker cystatin-C (B) and quantitative analysis of fluorescence intensity (C). (D) Kidney mRNA expressions of Col1a1, Col1a2, Tgf-β1, Tnf-α, and Il-1β. (E-G). Western blot analysis and quantification of TGFβ1, Fibronectin, and β-actin in kidney lysates. Data are mean ± SEM of 3–8 mice per group. Statistical analysis was performed using two-way ANOVA followed by Tukey’s or Dunnett’s post hoc test. Scale bar, 100 μm. * p<0.05 versus db/+, †p < 0.05 db/db luseogliflozin versus db/db glargine. # p<0.05 versus db/db control. Col Ia1, Ia2, collagen Ia1, Ia2. PAS staining, periodic acid-Schiff staining.
Next, we examined the activity of mTORC1 in renal tissue, which was previously associated with the protective effects of SGLT2 inhibitors by regulating fibrogenesis (20). A reduction in pS6 fluorescence intensity, indicating mTORC1 activity, was observed in renal tubules from both luseogliflozin- and glargine-treated db/db mice compared with the db/db control group (Figure 7A). However, Western blot analysis showed no significant changes in the pS6/tS6 ratio or the pS6K/tS6K ratio, but a significant reduction in eukaryotic elongation factor 2 kinase (eEF2K) in both treatment groups (Figures 7B–F). Although we cannot exclude the potential involvement of mTORC1 activity via other downstream pathways, including 4EBP1, these findings suggest that the drug-specific renoprotective effects of SGLT2 inhibitors might result from mechanisms other than the mTORC1 pathway.
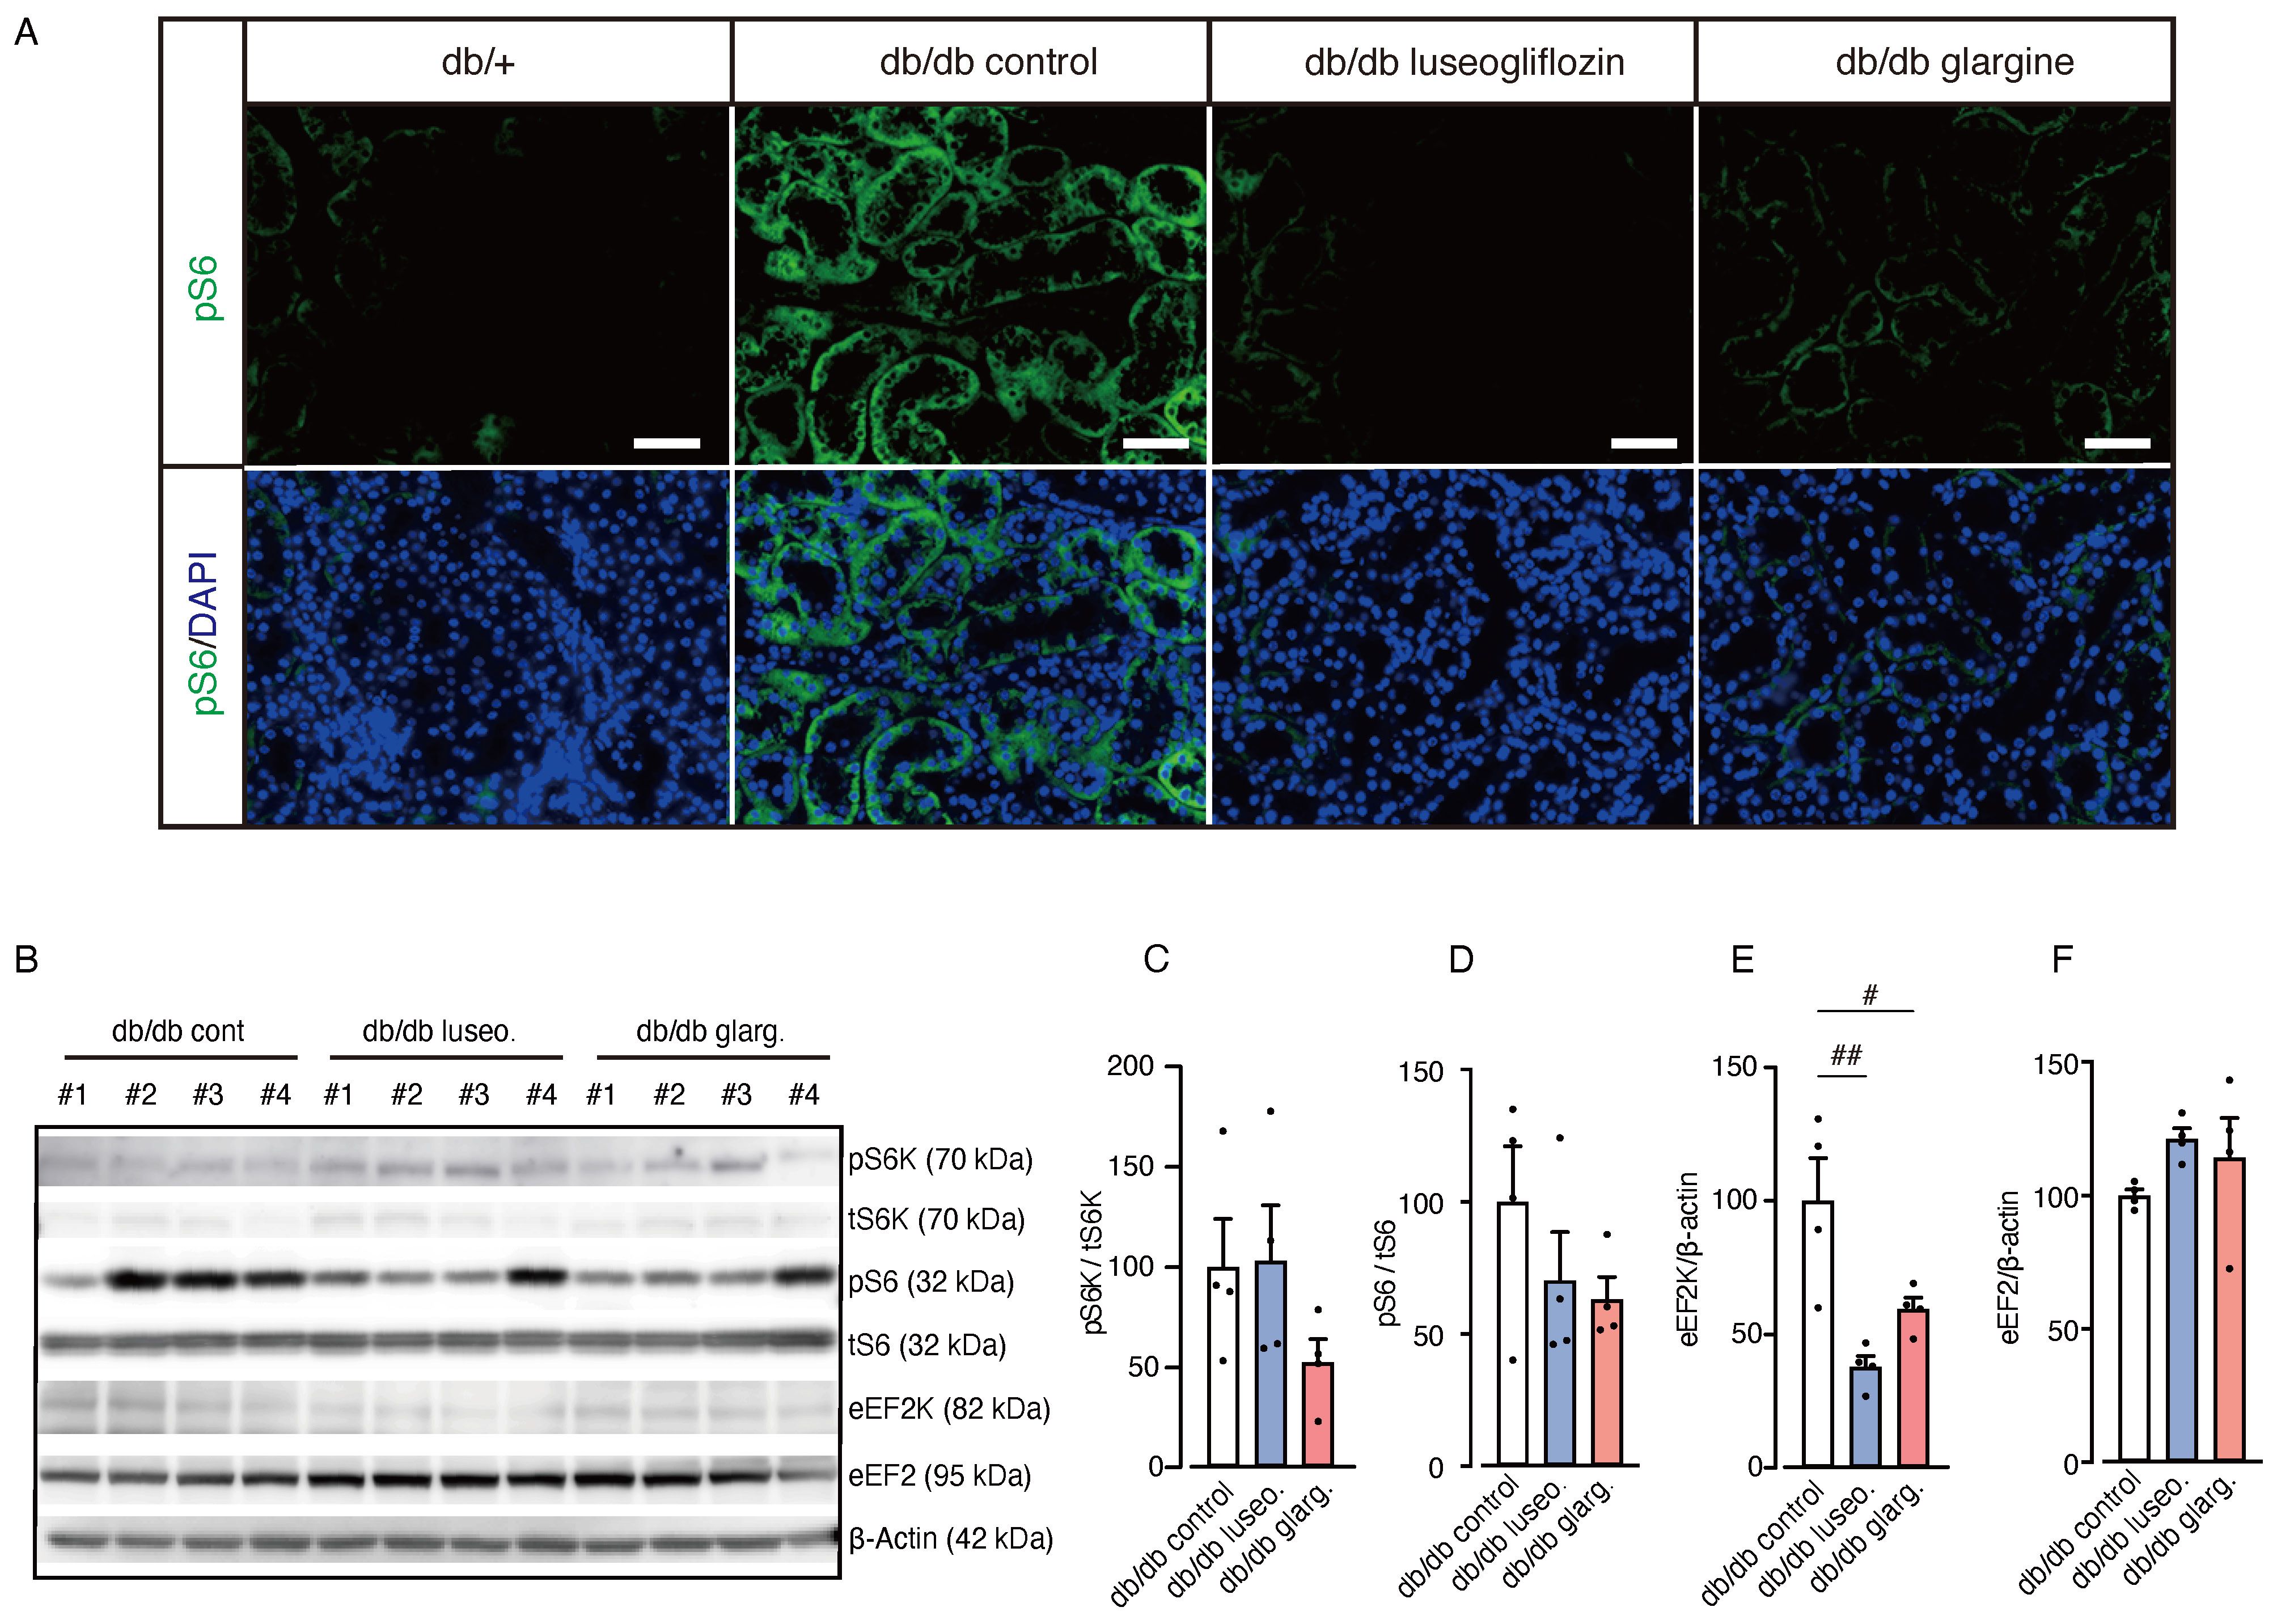
Figure 7. Effect of luseogliflozin and insulin glargine treatment on mTORC1 activity in db/db mice. The effect of luseogliflozin and insulin glargine treatment on renal mTORC1 activity was analyzed in db/db diabetic mice by immunofluorescence and Western blotting. (A) Representative immunofluorescence staining for pS6 on kidney sections. (B-F) Western blot analysis (B) and quantification of the ratio of phosphorylated to total p70 S6 ribosomal protein kinase (pS6K/tS6K), the ratio of phosphorylated to total ribosomal protein S6 (pS6/tS6), eEF2K, eEF2, and β-actin (C-F). Data are expressed as mean ± SEM of 4 mice per group. Statistical analysis was performed using two-way ANOVA followed by Tukey’s or Dunnett’s post hoc test. Scale bar, 50 μm. # p < 0.05 versus db/db control. mTORC1, mammalian target of rapamycin complex 1; S6K, p70 S6 ribosomal protein kinase; S6, ribosomal protein S6; eEF2K, eukaryotic elongation factor 2 kinase; eEF2, eukaryotic elongation factor 2.
3.4 Luseogliflozin activates renal BCKDC through dephosphorylation, in contrast to insulin glargin
To evaluate the impact of luseogliflozin and glargine on renal BCAA metabolism, we analyzed the gene expression related to BCAA metabolism. No significant differences were observed between the groups in the mRNA expression of amino acid transporters (Slc7a5, Slc7a8, and Slc6a19) and of Bcat2, the key enzyme involved in the initial step of BCAA catabolism (Figures 8A, B).
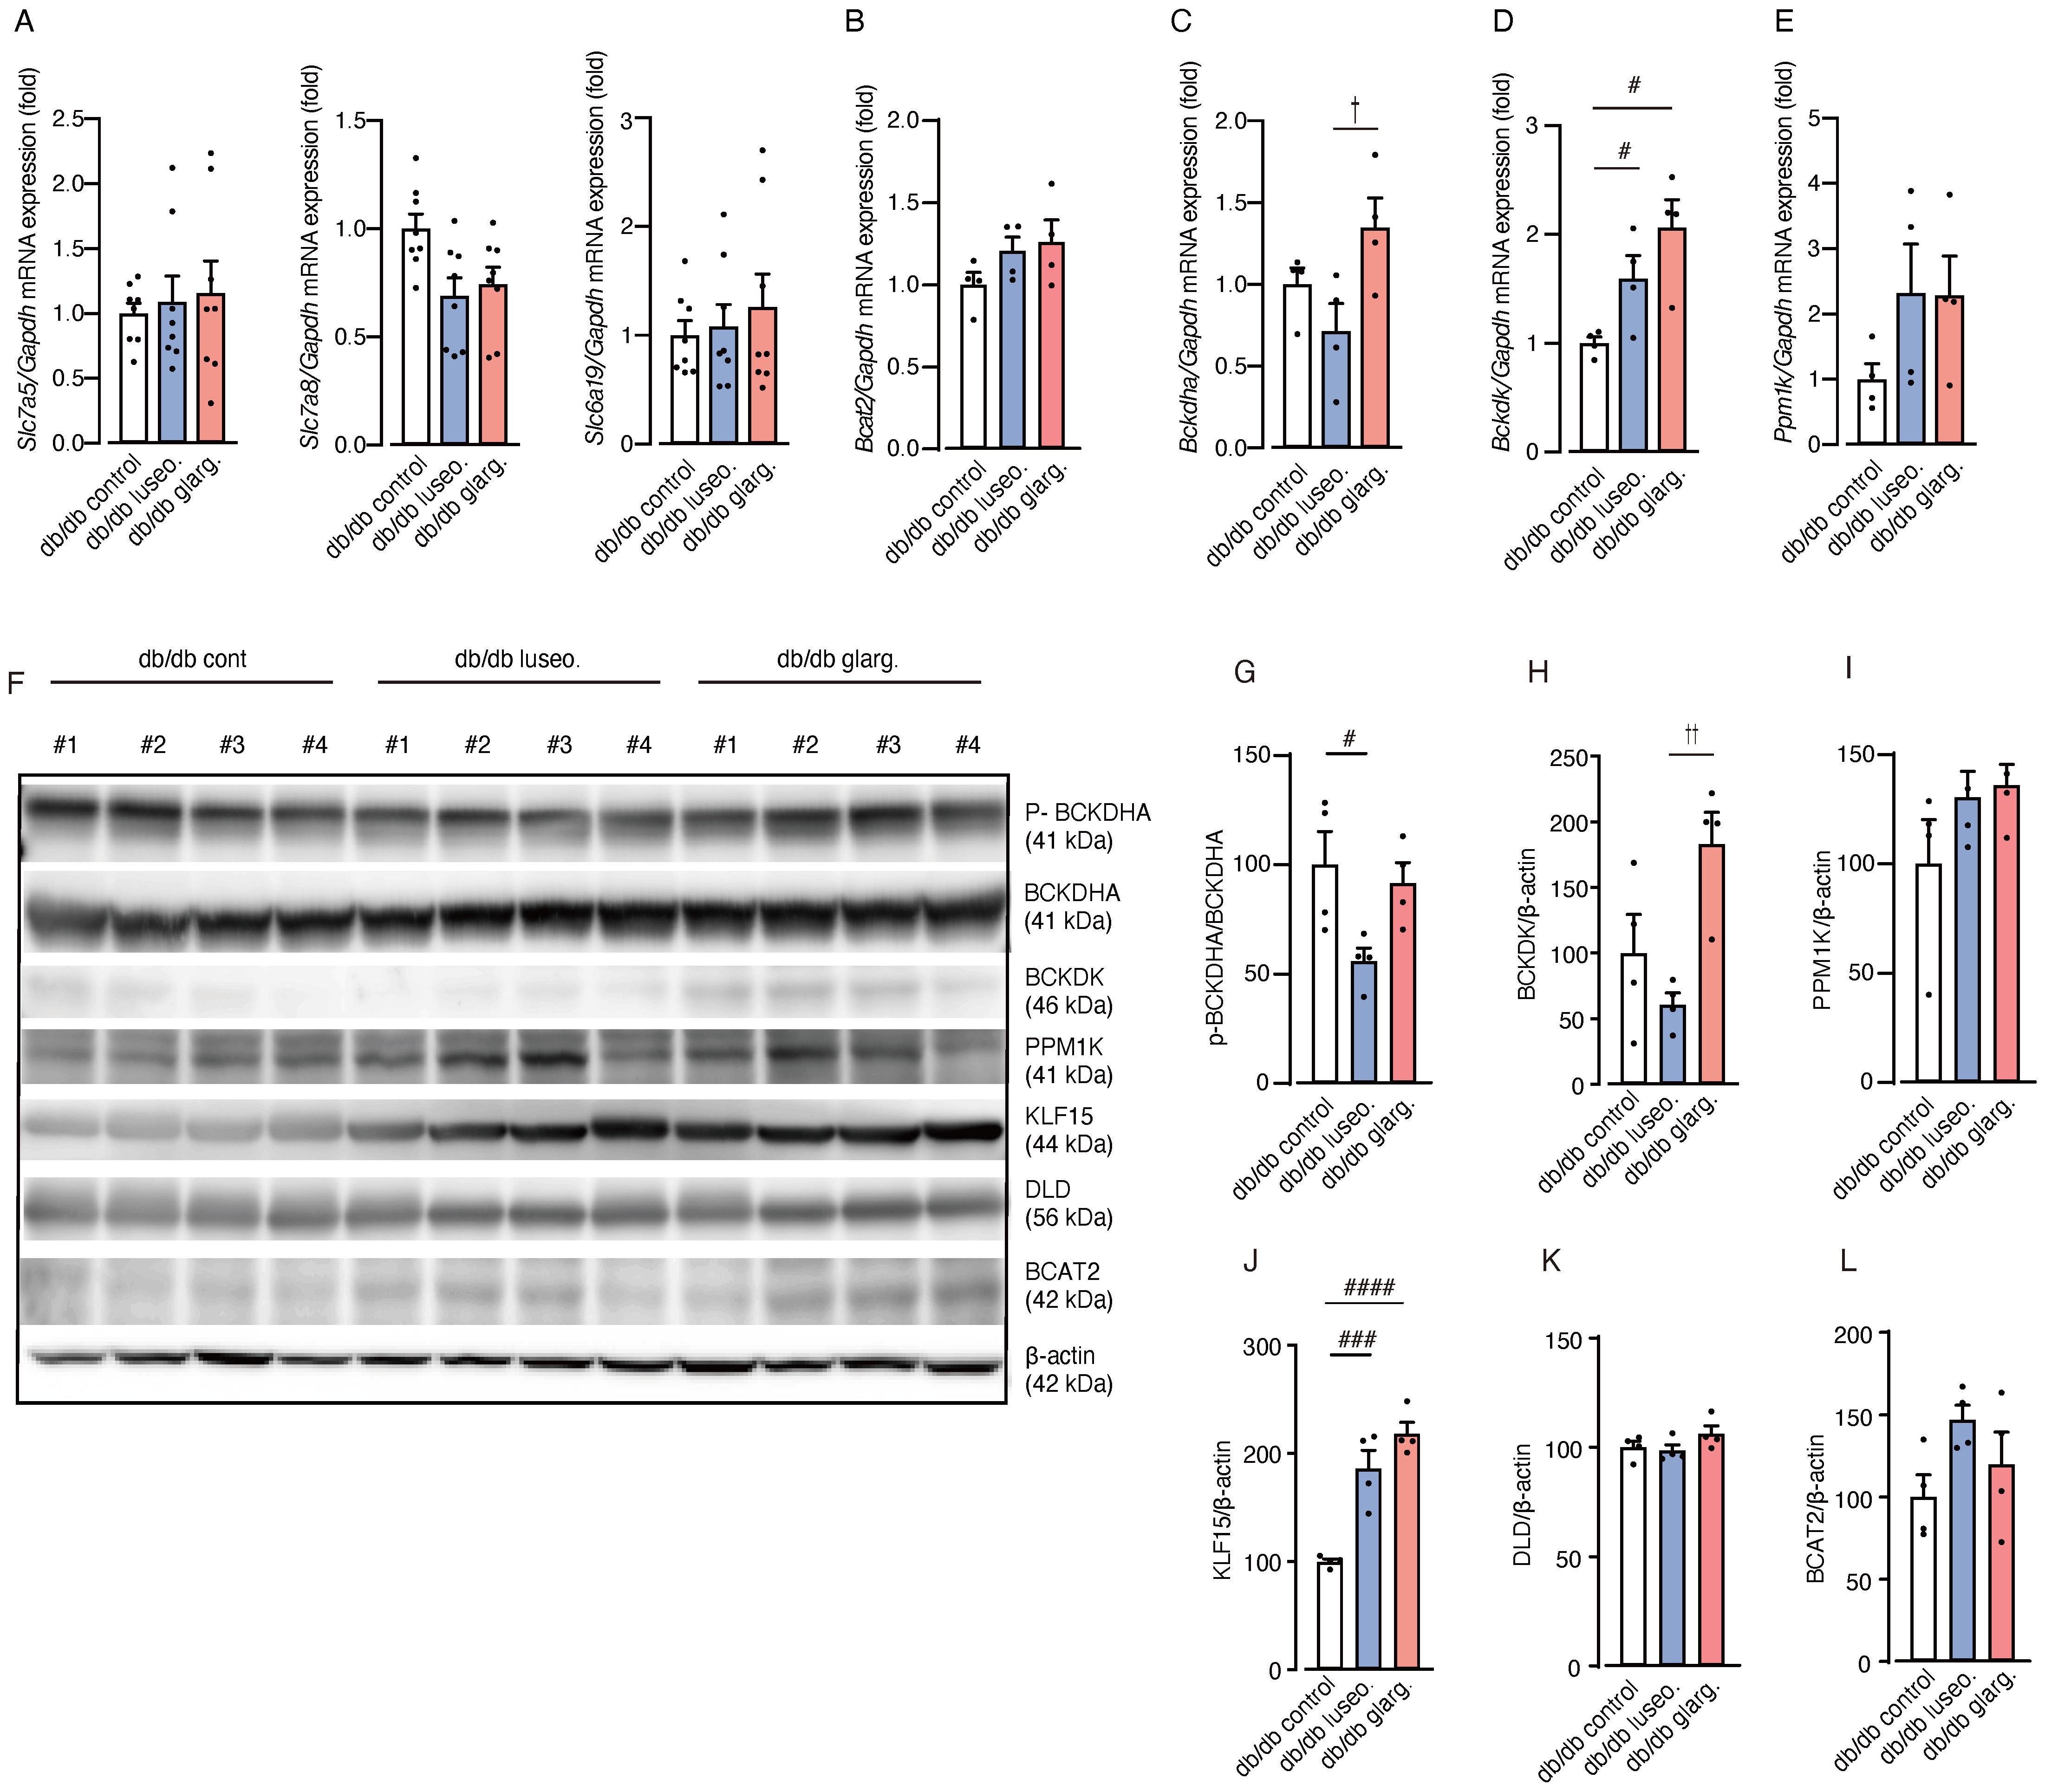
Figure 8. Luseogliflozin induces dephosphorylation of BCKDHA. The effects of luseogliflozin and insulin glargine treatment on the renal BCAA catabolic pathway were analyzed in db/db mice. (A) Relative mRNA levels of amino acid transporters (Slc7a5, Slc7a8 and Slc6a19) were measured by quantitative real-time PCR. (B-E) Expression of BCAA catabolism related genes: Bcat2 (B), Bckdha (C), Bckdk (D) and Ppm1k (E). (F-L) Western blot analysis and quantification of BCKDHA,p-BCKDHA, KLF15, BCAT2, PPM1K, BCKDK, DLD, and β-actin in kidney lysates (n = 4/group). Data represent the mean ± SEM of 4–8 mice per group. Statistical analysis was performed with two-way ANOVA followed by Tukey’s or Dunnett’s post hoc test. # p < 0.05 versus db/db control, †p < 0.05 db/db luseogliflozin versus db/db glargine. See also Supplementary Figures S3-S6. Slc, solute carrier family; Bcat, BCAA aminotransferase; Bckdha, BCKDHA, branched-chain ketoacid dehydrogenase E1 subunit alpha; Bckdk, BCKDK, branched-chain alpha-ketoacid dehydrogenase kinase; KLF15, Krüppel-like factor 15; BCAT2, branched chain amino acid transaminase2; PPM1K, protein phosphatase, Mg2+/Mn2+ dependent 1K; BCKDK, branched chain ketoacid dehydrogenase kinase; DLD, Dihydrolipoamide Dehydrogenase.
In contrast, the gene expression of branched-chain ketoacid dehydrogenase E1 subunit alpha (Bckdha), a subunit of the BCKDC responsible for the second and rate-limiting step in BCAA degradation, was significantly downregulated in luseogliflozin-treated mice compared with those treated with glargine (Figure 8C). In addition, the mRNA expression of BCKD kinase (Bckdk), which inactivates BCKDC, was significantly increased in both the luseogliflozin and glargine groups compared with the control (Figure 8D). The expression of the Ppm1k gene, which encodes an activator of BCKDC, showed no significant differences between the groups (Figure 8E).
We then performed an analysis of protein expression. In contrast to the mRNA expression analysis, Western blotting revealed that luseogliflozin reduced the phosphorylated/inactivated form of BCKDHA (p-BCKDHA/BCKDHA), whereas glargine had no significant effect on phosphorylation (Figures 8F, G). BCKDK levels were also reduced in the luseogliflozin group compared with the glargine group (Figures 8F, H). PPM1K did not differ significantly between the groups (Figures 8F, I).
Krüppel-like factor 15 (KLF15), a critical transcription factor that regulates enzymes reported to increase BCAT2 and BCKDHA levels (26), showed significant increases in both the luseogliflozin and glargine groups (Figures 8F, J). DLD, which encodes the E3 component of the BCKDC, and BCAT2 showed no significant differences between the groups (Figures 8F, K, L). The expression of genes associated with glycogenesis, ketone metabolism or fatty acid metabolism, did not exhibit significant changes between the groups except for Scd1 (Supplementary Figure S2).
These results suggest that the effects of SGLT2 inhibitors on renal BCAA catabolism are mediated by BCKDC activation through inhibition of phosphorylation, rather than transcriptional regulation. To provide an overview, Figure 9 illustrates the renal BCAA catabolism in DKD and the potential effects of the drugs.
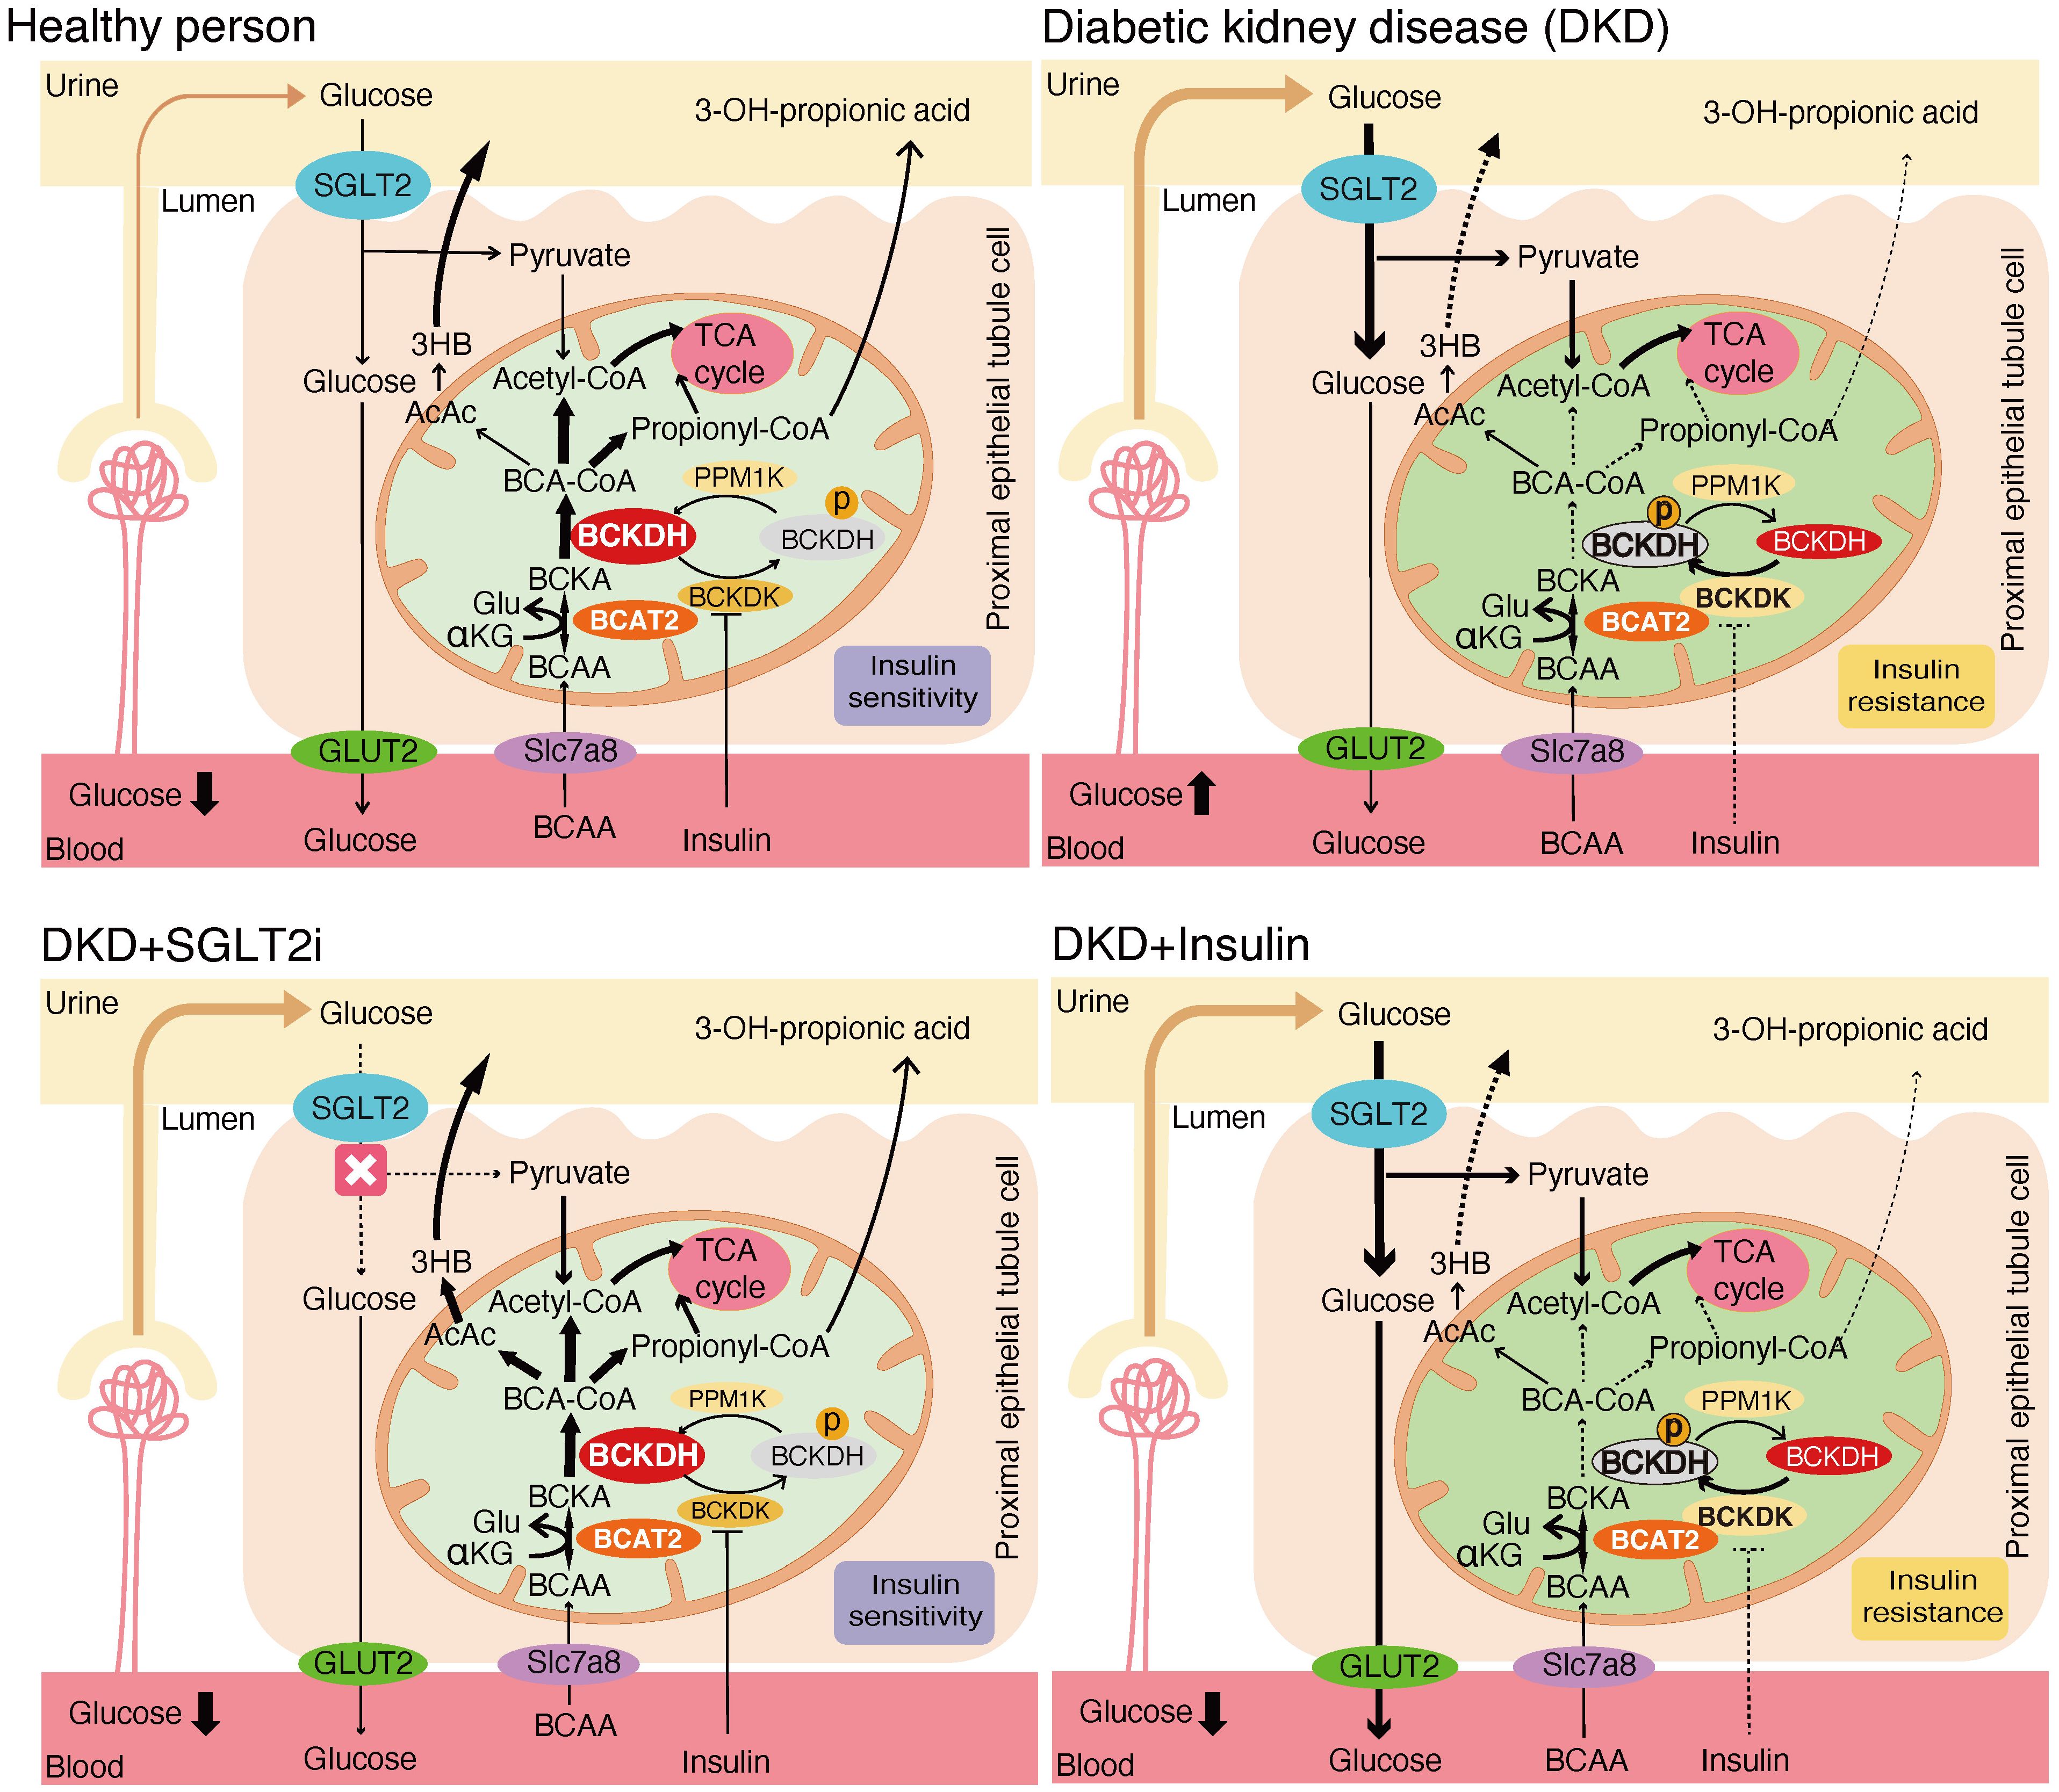
Figure 9. Mechanistic model of the effects of SGLT2 inhibitors and insulin treatment on renal BCAA catabolism.
4 Discussion
In the present study, SGLT2 inhibitor treatment was associated with enhanced BCAA catabolism in humans and mice, compared with insulin treatment at comparable glycemic levels. In humans, the SGLT2 inhibitor dapagliflozin induced greater increases in urinary C5-OH carnitine, 3-hydroxybutyric acid and 3-hydroxypropionic acid, downstream degradation products of BCAA, compared with insulin. In mice, the SGLT2 inhibitor luseogliflozin decreased BCKDK and phosphorylated/inactivated form of BCKDHA and reduced glomerular mesangial expansion and the fibrosis-related gene Col1a1 expression, along with TGFβ1 expression, compared with glargine. This study provides novel evidence that SGLT2 inhibitors enhance renal BCAA catabolism compared with insulin at comparable blood glucose levels.
Leucine, isoleucine, and valine are essential BCAAs abundant in dietary protein. Higher dietary BCAA intake has been associated with increased mitochondrial biogenesis, enhanced physical endurance, longer lifespan, and a lower risk of cardiovascular disease and all-cause mortality (27–29). However, elevated serum BCAA levels and BCAA-supplemented high-fat diets have been associated with greater insulin resistance and a higher incidence of type 2 diabetes (30, 31). Individuals with reduced insulin sensitivity or those who later developed type 2 diabetes had significantly higher plasma valine and leucine levels (32). Fasting BCAA levels during routine examinations predicted future diabetes onset in otherwise healthy, normoglycemic individuals (33). These findings suggest that BCAA utilization rate may play a crucial role in the pathogenesis of type 2 diabetes.
Sharma et al. identified 13 urinary metabolites that were significantly reduced in patients with diabetes and CKD compared with healthy controls and/or patients with diabetes without CKD, six of which were involved in BCAA catabolism (16). Interestingly, they found that among these metabolites, only 3-hydroxypropionic acid showed no significant difference between patients with diabetes with CKD and those without CKD. This finding suggests that urinary 3-hydroxypropionic acid is already reduced in the early stages of diabetes, before the onset of nephropathy. 3-hydroxypropionic acid is produced from propionyl-CoA, which is an intermediate of the catabolism of BCAAs (leucine, isoleucine, and valine) or of other compounds including methionine, threonine, and odd-chain fatty acids. Thus, the observed change in urinary 3-hydroxypropionic acid may not exclusively reflect alterations in BCAA catabolism. However, the consistent increases observed in urinary C5-OH carnitine and 3-hydroxybutyric acid, and the absence of corresponding changes in plasma metabolites also support the enhancement of BCAA catabolism in the kidney induced by SGLT2 inhibitors. We also observed a significant increase in urinary C4-carnitine, an earlier metabolite in valine catabolism, in the insulin-treated patients compared with the dapagliflozin group. Increased plasma C4-acylcarnitine has been associated with coronary artery disease (34).
Several studies have shown that SGLT2 inhibitors promote BCAA catabolism in the myocardium. In a porcine model of heart failure, empagliflozin normalized myocardial BCAA uptake and increased BCKDC activity with decreased phosphorylation, switching myocardial fuel utilization away from glucose to BCAA (14). Similarly, an untargeted metabolomics analysis in patients with type 2 diabetes mellitus and cardiovascular disease showed that empagliflozin activates BCAA catabolism (35). In contrast, few studies have addressed the effect of SGLT2 inhibitors on BCAA metabolism in the kidney, where SGLT2 is almost exclusively expressed (36). A study on this issue showed that dapagliflozin reversed the upregulation of amino acid transporters (Slc7a8 and Slc6a19) and increased Bcat1 and Bckdha gene expression in diabetic Akita mice, leading to the inhibition of mTORC1 in the proximal tubule and the prevention of renal fibrogenesis when compared with untreated controls (20). However, it remained unclear whether these changes were induced by glucose-lowering or by a drug-specific mechanism of SGLT2 inhibitors.
In in vivo experiments with db/db diabetic mice, we found that luseogliflozin reduced renal injury compared with glargine. Luseogliflozin significantly reduced the phosphorylation ratio of BCKDHA, and decreased BCKDK levels compared with glargine. We did not detect differences in mTOR signaling between luseogliflozin- and glargine-treated db/db mouse groups. Together with the observed differences in urinary BCAA breakdown products between patients treated with dapagliflozin and those treated with insulin alone, these results suggest that SGLT2 inhibitors promote BCAA catabolism and exert a renoprotective effect.
The mechanism by which SGLT2 inhibitors enhance intracellular BCAA catabolism requires further investigation. Insulin inhibits BCKDK, which inactivates BCKDHA. Therefore, the reduction in BCKDK and decreased phosphorylation/inactivation of BCKDHA induced by luseogliflozin could be explained by improved insulin sensitivity. A very recent study demonstrated that enhancement of BCAA catabolism through inhibition of BCKDK improved kidney function, supporting the potential relevance of this pathway (37). Another possibility is that SGLT2 inhibition promotes BCAA catabolism as part of metabolic adaptations to energy and water shortages, leading to the generation of organic osmolytes (38). Urea, a typical organic osmolyte, is produced from ammonia via the oxidative deamination of glutamate. We observed an increasing trend in plasma glutamate levels in dapagliflozin-treated patients. The catabolism of BCAA provides nitrogen for glutamate synthesis. Notably, BCKDK knockout mice, which exhibit increased systemic BCAA oxidation, were reported to have increased plasma glutamate levels (15), suggesting a potential link between BCAA catabolism and blood glutamate levels.
SGLT2 inhibitors are known to induce a mild increase in blood ketone bodies, although the detailed mechanism remains incompletely understood. Recently, it has been reported that renal proximal tubular cells under fasting conditions express 3-hydroxymethylglutaryl-CoA synthase (HMGCS2), the rate-limiting enzyme of ketogenesis, which is normally exclusive to hepatocytes (39). However, we found no significant differences in renal HMGCS2 mRNA expression between the mouse treatment groups. In contrast, we observed an increase in urinary 3-hydroxybutyric acid in the dapagliflozin-treated group compared with the insulin-treated group. Amino acid catabolism, particularly of leucine, is another known source of ketone bodies (40). Recent human data demonstrated that dapagliflozin treatment increased whole-body fat oxidation and tended to increase protein oxidation (41). SGLT2 inhibitors are associated with an increased risk of euglycemic diabetic ketoacidosis in both type 1 and type 2 diabetes (42). Based on these findings, we propose that a shift in fuel metabolism, including enhanced BCAA catabolism, may partially contribute to the tendency of SGLT2 inhibitors to elevate systemic ketone levels. Further studies are needed to explore the effect of SGLT2 inhibitors on inter-organ coupling of fuel utilization, ketogenesis, and BCAA catabolism.
This study has several limitations. First, only 13 patients completed the study. Some measurements showed relatively large ranges. Because no prior reports examined differences in urinary metabolite changes between the SGLT2 inhibitor- and insulin-treated groups, we selected a sample size based on feasibility, aiming to detect clinically relevant differences in exploratory analyses. Therefore, the following null hypothesis was tested: There is no difference in urinary metabolite changes between dapagliflozin and insulin dose-up treatments. A prospective controlled study was designed, and a statistically significant difference in changes in urinary 3-hydroxypropionic acid between the two treatment groups was observed at an alpha level of 0.05, leading to the rejection of the null hypothesis. For reference, in a post hoc analysis, the statistical power for the observed difference was 0.65 (sample size was set at 7), while a statistical power of 0.80 or higher is typically preferred. However, given that this was an exploratory phase study, the obtained statistical power of 0.65 was considered acceptable to provide a basis for designing a larger-scale study in the future.
Second, we used different SGLT2 inhibitors in this study. Although the cardio-renal benefits of SGLT2 inhibitors are considered to be a class effect, the possibility of a drug-specific effect on renal BCAA metabolism cannot be excluded. Luseogliflozin was chosen for the experimental models due to its superior selectivity for SGLT2 over SGLT1, which was particularly relevant for evaluating the effects of SGLT2 inhibition in this context. For the clinical study, dapagliflozin was selected because, at the time, it was the only SGLT2 inhibitor approved in Japan for the treatment of chronic kidney disease. Its use was therefore considered promising for patient benefit.
Our results demonstrate that SGLT2 inhibitors—but not insulin—enhance BCAA catabolism by activating BCKDHA in the kidney. The concomitant improvement in renal histology suggests the therapeutic relevance of BCAA catabolism in the context of DKD.
Data availability statement
The datasets generated during the current study are available from the corresponding author on reasonable request.
Ethics statement
The studies involving humans were approved by the ethics committee of Kurume University. The studies were conducted in accordance with the local legislation and institutional requirements. The participants provided their written informed consent to participate in this study. The animal study was approved by the ethics committee of Kurume University School of Medicine. The study was conducted in accordance with the local legislation and institutional requirements.
Author contributions
MS: Conceptualization, Data curation, Formal analysis, Investigation, Methodology, Visualization, Writing – original draft, Writing – review & editing. NH: Conceptualization, Data curation, Formal analysis, Funding acquisition, Investigation, Methodology, Project administration, Visualization, Writing – original draft, Writing – review & editing. LW: Conceptualization, Data curation, Formal analysis, Investigation, Methodology, Supervision, Writing – review & editing. KT: Data curation, Investigation, Methodology, Validation, Writing – review & editing. MK: Data curation, Investigation, Writing – review & editing. SI: Data curation, Investigation, Writing – review & editing. NW: Data curation, Investigation, Writing – review & editing. SN: Data curation, Investigation, Methodology, Writing – review & editing. SM: Data curation, Investigation, Methodology, Writing – review & editing. MG: Conceptualization, Data curation, Investigation, Methodology, Writing – review & editing. YI: Data curation, Investigation, Writing – review & editing. AN: Conceptualization, Data curation, Investigation, Writing – review & editing. KA: Conceptualization, Data curation, Investigation, Supervision, Writing – review & editing. YM: Conceptualization, Methodology, Project administration, Supervision, Writing – review & editing. MN: Conceptualization, Funding acquisition, Methodology, Project administration, Supervision, Writing – review & editing.
Funding
The author(s) declare financial support was received for the research and/or publication of this article. This work was supported in part by the Japanese Society for the Promotion of Science (JSPS) KAKENHI (Grant Nos. JP21K17653 and JP25K14802 to NH), Takeda Science Foundation, and Naito Memorial Foundation. The authors declare that this study received funding from Taisho Pharmaceutical Co., Ltd. The funder was not involved in the study design, collection, analysis, interpretation of data, the writing of this article or the decision to submit it for publication.
Acknowledgments
The authors thank the Institute for Disease Modeling, Kurume University School of Medicine, for technical support. We thank Y. Watanabe, Research Institute of Medical Mass Spectrometry, Kurume University School of Medicine, for her contribution to the amino acid analysis.
Conflict of interest
The authors declare that the research was conducted in the absence of any commercial or financial relationships that could be construed as a potential conflict of interest.
Generative AI statement
The author(s) declare that no Generative AI was used in the creation of this manuscript.
Any alternative text (alt text) provided alongside figures in this article has been generated by Frontiers with the support of artificial intelligence and reasonable efforts have been made to ensure accuracy, including review by the authors wherever possible. If you identify any issues, please contact us.
Publisher’s note
All claims expressed in this article are solely those of the authors and do not necessarily represent those of their affiliated organizations, or those of the publisher, the editors and the reviewers. Any product that may be evaluated in this article, or claim that may be made by its manufacturer, is not guaranteed or endorsed by the publisher.
Supplementary material
The Supplementary Material for this article can be found online at: https://www.frontiersin.org/articles/10.3389/fendo.2025.1706838/full#supplementary-material
Glossary
ACC: acetyl CoA carboxylase
ACS: acyl-CoA synthetase
ALT: alanine aminotransferase
AST: aspartate aminotransferase
BCA-CoA: branched-chain acyl-CoA
BCAA: branched chain amino acid
BCAT2: branched-chain aminotransferase 2
BCKA: branched-chain α-ketoacids
BCKDC: branched-chain α-ketoacid dehydrogenase complex
BCKDHA: branched chain ketoacid dehydrogenase E1 subunit alpha
BCKDK: branched-chain α-ketoacid dehydrogenase kinase
BUN: blood urea nitrogen
CPR: C-peptide immunoreactivity
CPT1A: carnitine palmitoyltransferase 1A
Col1a1: collagen type I alpha 1 chain
Cre: creatinine
DKD: diabetic kidney disease
DLD: dihydrolipoyl dehydrogenase
ESRD: end-stage renal disease
FPG: fasting plasma glucose
G6pc1: glucose-6-phosphatase catalytic subunit 1
Glu: glutamate
HMGCS2: 3-hydroxy-3-methylglutaryl-CoA synthase 2
KLF15: kr̈ppel-like factor 15
LFABP: liver-type fatty acid-binding protein
MSDKD: metabolite score for diabetic kidney disease
PAS: periodic acid-Schiff
PPARa: peroxisome proliferator-activated receptor α
Ppm1k: protein phosphatase, Mg2+/Mn2+ dependent 1K
SCOT: succinyl-CoA:3-ketoacid CoA transferase
SGLT2i: sodium-glucose co-transporter 2 inhibitors
Slc: solute carrier
Srebp1: sterol regulatory element-binding protein 1
TCA: tricarboxylic acid
TG: triglyceride
UA: uric acid
eEF2: eukaryotic elongation factor 2
eEF2K: eukaryotic elongation factor 2 kinase
mTORC1: mammalian target of rapamycin complex 1
pS6: phosphorylated S6 ribosomal Protein
pS6K: phosphorylated p70 S6 ribosomal protein kinase
tS6: total S6 ribosomal Protein.
References
1. Collins AJ, Foley RN, Herzog C, Chavers B, Gilbertson D, Ishani A, et al. US renal data system 2010 annual data report. Am J Kidney Dis. (2011) 57:A8. doi: 10.1053/j.ajkd.2010.10.007
2. Afkarian M, Sachs MC, Kestenbaum B, Hirsch IB, Tuttle KR, Himmelfarb J, et al. Kidney disease and increased mortality risk in type 2 diabetes. J Am Soc Nephrol. (2013) 24:302–8. doi: 10.1681/ASN.2012070718
3. Groop P-H, Thomas MC, Moran JL, Wadèn J, Thorn LM, Mäkinen V-P, et al. The presence and severity of chronic kidney disease predicts all-cause mortality in type 1 diabetes. Diabetes. (2009) 58:1651–8. doi: 10.2337/db08-1543
4. Orchard TJ, Secrest AM, Miller RG, and Costacou T. In the absence of renal disease, 20 year mortality risk in type 1 diabetes is comparable to that of the general population: a report from the Pittsburgh Epidemiology of Diabetes Complications Study. Diabetologia. (2010) 53:2312–9. doi: 10.1007/s00125-010-1860-3
5. Oku A, Ueta K, Arakawa K, Ishihara T, Nawano M, Kuronuma Y, et al. T-1095, an inhibitor of renal Na+-glucose cotransporters, may provide a novel approach to treating diabetes. Diabetes. (1999) 48:1794–800. doi: 10.2337/diabetes.48.9.1794
6. Zinman B, Wanner C, Lachin JM, Fitchett D, Bluhmki E, Hantel S, et al. Empagliflozin, cardiovascular outcomes, and mortality in type 2 diabetes. N Engl J Med. (2015) 373:2117–28. doi: 10.1056/NEJMoa1504720
7. Wiviott SD, Raz I, Bonaca MP, Mosenzon O, Kato ET, Cahn A, et al. Dapagliflozin and cardiovascular outcomes in type 2 diabetes. New Engl J Med. (2019) 380:347–57. doi: 10.1056/nejmoa1812389
8. Zelniker TA, Wiviott SD, Raz I, Im K, Goodrich EL, Bonaca MP, et al. SGLT2 inhibitors for primary and secondary prevention of cardiovascular and renal outcomes in type 2 diabetes: a systematic review and meta-analysis of cardiovascular outcome trials. Lancet. (2019) 393:31–9. doi: 10.1016/S0140-6736(18)32590-X
9. Yabe D, Shiki K, Homma G, Meinicke T, Ogura Y, and Seino Y. Efficacy and safety of the sodium-glucose co-transporter-2 inhibitor empagliflozin in elderly Japanese adults (≥65 years) with type 2 diabetes: A randomized, double-blind, placebo-controlled, 52-week clinical trial (EMPA-ELDERLY). Diabetes Obes Metab. (2023) 25:3538–48. doi: 10.1111/dom.15249
10. Sakamoto M, Goto Y, Nagayama A, Yano M, Sato S, Tajiri Y, et al. Two-year administration of sodium-glucose co-transporter 2 inhibitor brought about marked reduction of body fat independent of skeletal muscle amount or glycemic improvement in Japanese patients with type 2 diabetes. Diabetol Int. (2022) 13:117–23. doi: 10.1007/s13340-021-00512-7
11. Bonora BM, Avogaro A, and Fadini GP. Extraglycemic effects of SGLT2 inhibitors: A review of the evidence. Diabetes Metab Syndrome Obes. (2020) 13:161–74. doi: 10.2147/DMSO.S233538
12. Mudaliar S, Alloju S, and Henry RR. Can a shift in fuel energetics explain the beneficial cardiorenal outcomes in the EMPA-REG OUTCOME study? a unifying hypothesis. Diabetes Care. (2016) 39:1115–22. doi: 10.2337/dc16-0542
13. Prattichizzo F, De Nigris V, Micheloni S, La Sala L, and Ceriello A. Increases in circulating levels of ketone bodies and cardiovascular protection with SGLT2 inhibitors: Is low-grade inflammation the neglected component? Diabetes Obes Metab. (2018) 20:2515–22. doi: 10.1111/dom.13488
14. Santos-Gallego CG, Requena-Ibanez JA, San Antonio R, Ishikawa K, Watanabe S, Picatoste B, et al. Empagliflozin ameliorates adverse left ventricular remodeling in nondiabetic heart failure by enhancing myocardial energetics. J Am Coll Cardiol. (2019) 73:1931–44. doi: 10.1016/j.jacc.2019.01.056
15. Neinast MD, Jang C, Hui S, Murashige DS, Chu Q, Morscher RJ, et al. Quantitative analysis of the whole-body metabolic fate of branched-chain amino acids. Cell Metab. (2019) 29:417–429.e4. doi: 10.1016/j.cmet.2018.10.013
16. Sharma K, Karl B, Mathew AV, Gangoiti JA, Wassel CL, Saito R, et al. Metabolomics reveals signature of mitochondrial dysfunction in diabetic kidney disease. J Am Soc Nephrol. (2013) 24:1901–12. doi: 10.1681/ASN.2013020126
17. Mulder S, Heerspink HJL, Darshi M, Kim JJ, Laverman GD, Sharma K, et al. Effects of dapagliflozin on urinary metabolites in people with type 2 diabetes. Diabetes Obes Metab. (2019) 21:2422–8. doi: 10.1111/dom.13823
18. Doisaki M, Katano Y, Nakano I, Hirooka Y, Itoh A, Ishigami M, et al. Regulation of hepatic branched-chain α-keto acid dehydrogenase kinase in a rat model for type 2 diabetes mellitus at different stages of the disease. Biochem Biophys Res Commun. (2010) 393:303–7. doi: 10.1016/j.bbrc.2010.02.004
19. Lu J, Xie G, Jia W, and Jia W. Insulin resistance and the metabolism of branched-chain amino acids. Front Med. (2013) 7:53–9. doi: 10.1007/s11684-013-0255-5
20. Kogot-Levin A, Hinden L, Riahi Y, Israeli T, Tirosh B, Cerasi E, et al. Proximal tubule mTORC1 is a central player in the pathophysiology of diabetic nephropathy and its correction by SGLT2 inhibitors. Cell Rep. (2020) 32:107954. doi: 10.1016/j.celrep.2020.107954
21. Rahman A, Fujisawa Y, Nakano D, Hitomi H, and Nishiyama A. Effect of a selective SGLT2 inhibitor, luseogliflozin, on circadian rhythm of sympathetic nervous function and locomotor activities in metabolic syndrome rats. Clin Exp Pharmacol Physiol. (2017) 44:522–5. doi: 10.1111/1440-1681.12725
22. Rao CH, Liu L, Gao J, Du ZH, and Gao C. Establishment of blood glucose control model in diabetic mice. Int J Ophthalmol. (2022) 15:1908–14. doi: 10.18240/ijo.2022.12.03
23. Matsumoto I and Kuhara T. A new chemical diagnostic method for inborn errors of metabolism by mass spectrometry - Rapid, practical, and simultaneous urinary metabolites analysis. Mass Spectrom Rev. (1996) 15:43–57. doi: 10.1002/(SICI)1098-2787(1996)15:1<43::AID-MAS3>3.0.CO;2-B
24. Shoemaker JD and Elliott WH. Automated screening of urine samples for carbohydrates, organic and amino acids after treatment with urease. J Chromatogr. (1991) 562:125–38. doi: 10.1016/0378-4347(91)80571-s
25. Shigematsu Y, Hirano S, Hata I, Tanaka Y, Sudo M, Sakura N, et al. Newborn mass screening and selective screening using electrospray tandem mass spectrometry in Japan. J Chromatogr B Analyt Technol Biomed Life Sci. (2002) 776:39–48. doi: 10.1016/s1570-0232(02)00077-6
26. Shao D, Villet O, Zhang Z, Choi SW, Yan J, Ritterhoff J, et al. Glucose promotes cell growth by suppressing branched-chain amino acid degradation. Nat Commun. (2018) 9:2935. doi: 10.1038/s41467-018-05362-7
27. Xu B, Wang M, Pu L, Shu C, Li L, and Han L. Association of dietary intake of branched-chain amino acids with long-term risks of CVD, cancer and all-cause mortality. Public Health Nutr. (2022) 25:3390–400. doi: 10.1017/S1368980021004948
28. D’Antona G, Ragni M, Cardile A, Tedesco L, Dossena M, Bruttini F, et al. Branched-chain amino acid supplementation promotes survival and supports cardiac and skeletal muscle mitochondrial biogenesis in middle-aged mice. Cell Metab. (2010) 12:362–72. doi: 10.1016/j.cmet.2010.08.016
29. Zheng L, Cai J, Feng Y-H, Su X, Chen S-Y, Liu J-Z, et al. The association between dietary branched-chain amino acids and the risk of cardiovascular diseases in Chinese patients with type 2 diabetes: A hospital-based case-control study. Front Nutr. (2022) 9:999189. doi: 10.3389/fnut.2022.999189
30. Lynch CJ and Adams SH. Branched-chain amino acids in metabolic signalling and insulin resistance. Nat Rev Endocrinol. (2014) 10:723–36. doi: 10.1038/nrendo.2014.171
31. Newgard CB, An J, Bain JR, Muehlbauer MJ, Stevens RD, Lien LF, et al. A branched-chain amino acid-related metabolic signature that differentiates obese and lean humans and contributes to insulin resistance. Cell Metab. (2009) 9:311–26. doi: 10.1016/j.cmet.2009.02.002
32. Palmer ND, Stevens RD, Antinozzi PA, Anderson A, Bergman RN, Wagenknecht LE, et al. Metabolomic profile associated with insulin resistance and conversion to diabetes in the Insulin Resistance Atherosclerosis Study. J Clin Endocrinol Metab. (2015) 100:E463–8. doi: 10.1210/jc.2014-2357
33. Wang TJ, Larson MG, Vasan RS, Cheng S, Rhee EP, McCabe E, et al. Metabolite profiles and the risk of developing diabetes. Nat Med. (2011) 17:448–53. doi: 10.1038/nm.2307
34. Gander J, Carrard J, Gallart-Ayala H, Borreggine R, Teav T, Infanger D, et al. Metabolic impairment in coronary artery disease: elevated serum acylcarnitines under the spotlights. Front Cardiovasc Med. (2021) 8:792350. doi: 10.3389/fcvm.2021.792350
35. Kappel BA, Lehrke M, Schütt K, Artati A, Adamski J, Lebherz C, et al. Effect of empagliflozin on the metabolic signature of patients with type 2 diabetes mellitus and cardiovascular disease. Circulation. (2017) 136:969–72. doi: 10.1161/CIRCULATIONAHA.117.029166
36. Sabolic I, Vrhovac I, Eror DB, Gerasimova M, Rose M, Breljak D, et al. Expression of Na+-D-glucose cotransporter SGLT2 in rodents is kidney-specific and exhibits sex and species differences. Am J Physiol Cell Physiol. (2012) 302:C1174–88. doi: 10.1152/ajpcell.00450.2011
37. Bollinger E, Williams G, Piper ME, Steen K, Neale KT, Chen X, et al. Restoration of branched chain amino acid catabolism improves kidney function in preclinical cardiovascular-kidney-metabolic syndrome models. Kidney Int. (2025) 108:310–6. doi: 10.1016/j.kint.2025.04.025
38. Marton A, Kaneko T, Kovalik J-P, Yasui A, Nishiyama A, Kitada K, et al. Organ protection by SGLT2 inhibitors: role of metabolic energy and water conservation. Nat Rev Nephrol. (2021) 17:65–77. doi: 10.1038/s41581-020-00350-x
39. Venable AH, Lee LE, Feola K, Santoyo J, Broomfield T, and Huen SC. Fasting-induced HMGCS2 expression in the kidney does not contribute to circulating ketones. Am J Physiology-Renal Physiol. (2022) 322:F460–7. doi: 10.1152/ajprenal.00447.2021
40. Newman JC and Verdin E. Ketone bodies as signaling metabolites. Trends Endocrinol Metab. (2014) 25:42–52. doi: 10.1016/j.tem.2013.09.002
41. Veelen A, Andriessen C, Op den Kamp Y, Erazo-Tapia E, de Ligt M, Mevenkamp J, et al. Effects of the sodium-glucose cotransporter 2 inhibitor dapagliflozin on substrate metabolism in prediabetic insulin resistant individuals: A randomized, double-blind crossover trial. Metabolism. (2023) 140:155396. doi: 10.1016/j.metabol.2022.155396
Keywords: branched-chain amino acids (BCAA), SGLT2 inhibitors, type 2 diabetes, diabetic kidney disease, renal BCAA metabolism, urinary BCAA metabolites, insulin therapy
Citation: Sakamoto M, Hasuzawa N, Wang L, Tashiro K, Kitamura M, Iwata S, Wada N, Nomura S, Moriyama S, Gobaru M, Inoguchi Y, Nagayama A, Ashida K, Moriyama Y and Nomura M (2025) Sodium-glucose cotransporter 2 inhibitors—but not insulin—enhance renal branched-chain amino acid catabolism. Front. Endocrinol. 16:1706838. doi: 10.3389/fendo.2025.1706838
Received: 16 September 2025; Accepted: 20 October 2025;
Published: 07 November 2025.
Edited by:
Kim Loh, University of Melbourne, AustraliaReviewed by:
Calum Forteath, University of Dundee, United KingdomMarina Katerelos, University of Melbourne, Australia
Copyright © 2025 Sakamoto, Hasuzawa, Wang, Tashiro, Kitamura, Iwata, Wada, Nomura, Moriyama, Gobaru, Inoguchi, Nagayama, Ashida, Moriyama and Nomura. This is an open-access article distributed under the terms of the Creative Commons Attribution License (CC BY). The use, distribution or reproduction in other forums is permitted, provided the original author(s) and the copyright owner(s) are credited and that the original publication in this journal is cited, in accordance with accepted academic practice. No use, distribution or reproduction is permitted which does not comply with these terms.
*Correspondence: Nao Hasuzawa, aGFzdXphd2FAbWVkLmt1cnVtZS11LmFjLmpw
†These authors have contributed equally to this work and share first authorship
‡ORCID: Nao Hasuzawa, orcid.org/0000-0003-1344-8667
Moeko Sakamoto, orcid.org/0009-0006-3569-5393
Lixiang Wang, orcid.org/0000-0003-2087-4787
Miyuki Kitamura, orcid.org/0000-0001-6473-3850
Shimpei Iwata, orcid.org/0009-0003-0711-8175
Nobuhiko Wada, orcid.org/0009-0009-6243-9768
Sawako Moriyama, orcid.org/0009-0006-5701-2899
Seiji Nomura, orcid.org/0009-0001-7706-1034
Mizuki Gobaru, orcid.org/0000-0002-7519-5979
Ayako Nagayama, orcid.org/0009-0001-1695-4787
Kenji Ashida, orcid.org/0000-0001-8753-6016
Masatoshi Nomura, orcid.org/0000-0002-0725-3161