 Luca Havelda1,2Eszter Ágnes Szalai1,3Mahmoud Obeidat1Dalma Dobszai1,4Dániel Sándor Veres1,5Tamás Kói1Emese Sipter1,6
 Szilárd Váncsa1,2Péter Jenő Hegyi1,2Maria Bucur1Anita Molnár1Klára Lara Vámossy1,2Péter Hegyi1,2,4,7†
 Andrea Szentesi1,4*†
- 1Centre for Translational Medicine, Semmelweis University, Budapest, Hungary
- 2Institute of Pancreatic Diseases, Semmelweis University, Budapest, Hungary
- 3Department of Restorative Dentistry and Endodontics, Semmelweis University, Budapest, Hungary
- 4Institute for Translational Medicine, Medical School, University of Pécs, Pécs, Hungary
- 5Department of Biophysics and Radiation Biology, Semmelweis University, Budapest, Hungary
- 6Department of Internal Medicine and Haematology, Semmelweis University, Budapest, Hungary
- 7Translational Pancreatology Research Group, Interdisciplinary Centre of Excellence for Research Development and Innovation, University of Szeged, Szeged, Hungary
Introduction: The prevalence of type 2 diabetes mellitus (T2DM) has more than doubled in the past 20 years. Most T2DM cases are preventable if risk factors are eliminated early. Hypertriglyceridemia (HTG) is also a potential but modifiable risk factor, and has a high prevalence as well. We aimed to investigate the dose-dependent effect of HTG on the development of T2DM.
Methods: We carried out a systematic search in three databases (MEDLINE, Embase, and CENTRAL) on 9 November 2023. We investigated an adult population with different triglyceride levels (exposure). The outcome of interest was the development of T2DM. Pooled hazard ratio (HR), odds ratio (OR), and mean differences (MDs) with 95% confidence intervals (CIs) were calculated using a random-effects model. Risk of bias was assessed with the Quality In Prognosis Studies (QUIPS) tool. The protocol was registered in PROSPERO (CRD42023471288).
Results: We identified 31,098 articles and included 101 in our meta-analysis. We found that people with HTG had more than a 1.5-fold higher risk (HR: 1.73 [1.31; 2.29]) of developing T2DM. Those who had their TG levels between 1.7 and 2.3 mmol/L had a 42% higher risk (HR: 1.42 [1.13; 1.79]), while those with TG levels above 2.3 mmol/L had an even higher risk for T2DM (HR: 1.82 [1.18; 2.87]) compared with patients with TG levels below 1.7 mmol/L. When investigating the hypertriglyceridemic waist phenotype, we found that only those with increased waist circumference had a higher risk in both sex groups among the different phenotype groups (female: HR: 2.86 [1.59; 5.14], male: HR: 3.31 [1.57; 7.27]).
Conclusion: HTG is a dose-dependent risk factor for T2DM. Elevated waist circumference may have an even more important role in the development of T2DM than HTG.
Systematic review registration: https://www.crd.york.ac.uk/prospero/, identifier CRD42023471288.
Highlights
● Hypertriglyceridemia is a dose-dependent risk factor for T2DM.
● Elevated waist circumference is a risk factor for T2DM and may have an even more important role in the development T2DM than hypertriglyceridemia.
● Higher triglyceride-glucose index and triglyceride-to-high-density lipoprotein cholesterol ratio are associated with a higher risk of T2DM.
Introduction
According to the International Diabetes Foundation, in 2021, diabetes mellitus (DM) impacted over 530 million adults worldwide, and is projected to reach 783 million by 2045 (1). Type 2 diabetes mellitus (T2DM) accounts for more than 90% of all DM cases (1) and poses substantial health and economic challenges, including rising healthcare costs, an increased burden on healthcare systems, and a higher risk of complications, such as cardiovascular disease (CVD), neuropathy, retinopathy, and nephropathy, reducing quality of life and increasing mortality (1–3). The condition is caused by genetic, environmental, and lifestyle factors, particularly poor diet, physical inactivity, and obesity (1, 4). Notably, approximately 80% of T2DM cases could be prevented by addressing modifiable risk factors, including high body mass index (BMI) and inadequate fiber intake (4).
These same modifiable risk factors can also contribute to the development of metabolic syndrome, a constellation of metabolic abnormalities including central obesity, hypertension, dyslipidemia, and impaired glucose regulation (5). This syndrome is a well-established predictor of cardiovascular morbidity and mortality, and among its components, hypertriglyceridemia (HTG) plays a key role in promoting atherogenic dyslipidemia and systemic inflammation (5–8). Furthermore, severe HTG has been linked to acute pancreatitis, underscoring the clinical importance of managing elevated triglyceride levels (9).
In addition to its established associations with CVD and pancreatitis, HTG has been identified as a potential modifiable risk factor for T2DM (10–12). Elevated triglyceride levels have been associated with increased insulin resistance (IR) and beta-cell dysfunction, both of which are pivotal in the pathogenesis of T2DM (13).
In addition to triglyceride levels, several triglyceride-related indices are increasingly used in clinical practice and research as predictors of CVD and IR (14–16).
The triglyceride-glucose index (TyG), a surrogate marker of IR, has emerged as a potential predictor of T2DM. Although it is associated with the development of T2DM, its relationship appears to be non-linear, suggesting possible thresholds influencing its predictive value (14, 17, 18).
The triglyceride-to-high-density lipoprotein cholesterol ratio (TG/HDL-C), another triglyceride-related index, has demonstrated a linear association with the incidence of T2DM, making it a straightforward risk indicator of risk escalation (19, 20, 115).
In addition, the hypertriglyceridemic waist (HTGW) phenotype, characterized by elevated triglyceride levels and abdominal obesity, has been linked to IR and is investigated as a potential indicator of T2DM. This phenotype underscores the interplay between dyslipidemia and central obesity in metabolic dysfunction (16, 21, 22).
Triglyceride itself, a simple and accessible biomarker, offers significant utility in daily clinical practice without requiring complex calculations. Similarly, triglyceride-related indices (e.g., TyG and TG/HDL-C ratio) are easily computed and available for routine screening.
However, despite extensive research into the relationship between HTG and T2DM, the dose-dependent role of triglycerides in T2DM development has not been comprehensively evaluated. The existing literature predominantly focuses on dyslipidemia as a consequence of IR or diabetes, leaving a gap in understanding the causal and dose–response relationships in the prediabetic state (23, 24).
By identifying thresholds and dose-dependent relations, clinicians could better estimate the risk of T2DM and implement targeted interventions, such as scheduling screening visits with optimal frequency and tailoring preventive measures. We hypothesize that HTG may be a dose-dependent risk factor for T2DM, and its associated indices may be predictors of T2DM. Therefore, we aimed to investigate the dose-dependent effect of HTG on the development of T2DM.
Methods
Our systematic review and meta-analysis followed the recommendations of the Preferred Reporting Items for Systematic Reviews and Meta-Analyses (PRISMA) 2020 guidelines (25) (Supplementary Table S1) and the Cochrane Handbook (26). The study protocol was registered with PROSPERO (27) under accession number CRD42023471288. The protocol deviation related to the PROSPERO registration is also reported in detail in the Supplementary Materials (Methods S1). The investigation was conducted under the Systems Education education-research model run by the Centre for Translational Medicine at Semmelweis University, Budapest (28).
Eligibility criteria and definitions
Our research aimed to investigate the effect of different triglyceride levels on the development of T2DM. We used the PEO framework to define eligibility criteria (29).
Population (P): adult patients without DM at baseline. Exposure (E): different levels of TG and triglyceride-related indices, such as TyG index, TG/HDL-C ratio, and HTGW phenotype. We used the definition of HTG, as reported in the guidelines and the articles included: >1.7 mmol/L (>150 mg/dL) (3, 4). TyG was calculated as the natural logarithm of [fasting glucose (mg/dL) × fasting triglycerides (mg/dL)/2]. Different cutoff values were used in the cohorts to categorize HTGW phenotypes; therefore, we used the category established based on the research for our analysis. In the case of HTGW, the population is divided into four groups: (1) normal TG level and normal waist circumference (control); (2) high TG level and normal waist circumference (HTNW); (3) normal TG and elevated waist circumference (NTGW); and (4) high TG level and elevated waist circumference.
Outcome (O): development of T2DM or prediabetes. Most studies used the following criteria to diagnose T2DM: fasting plasma glucose ≥7.0 mmol/L (126 mg/dL) and/or HbA1c ≥6.5% and/or the use of insulin or oral hypoglycemic agents. In some cases, the definition of newly diagnosed T2DM was different or missing; this uncertainty was taken into account during the risk of bias assessment.
Studies conducted in all publication years and all languages were included. Conference abstracts, reviews, case reports, and case series were excluded during the selection.
Information sources
Our systematic search was conducted on 9 November 2023 in three primary databases: MEDLINE (via Pubmed), Embase, and Cochrane (CENTRAL) without filters or restrictions. We used three domains: one for T2DM, one for TG, and a third for the required study types. For each database, we used a specific search key, which can be found in Supplementary Table S2.
Selection process
To remove duplicate records, we used the duplication removal tools of Endnote, followed by manual duplicate removal. We dealt with duplicate-free articles using the Rayyan tool. During the selection process, each article was reviewed by two independent authors (LH and DD/MB/AM/LV). Selection disagreements were resolved by consensus after discussion. First, title and abstract selection was performed, and then the studies included were screened by full text, where the reason for exclusion was recorded. Cohen’s kappa was calculated for each step to demonstrate the inter-rater agreement. Finally, we used the citation chaser tool for backward citation chase (Reference Chase) and dealt with the newly found articles similarly.
Data collection process
Data were extracted independently from the eligible articles by two authors (LH and DD/AM/LV) and entered into standardized Excel spreadsheets. In case of disagreement, the conflict was resolved by discussion. If an article lacked relevant data, a letter of inquiry was sent to the corresponding author for further information.
The following data were extracted: information on the publication [e.g., year and digital object identifier (DOI) number], country, study period, number of centers, study design, and follow-up time; information on the population (e.g., sex distribution, age, and BMI), the factor measured (e.g., TyG and HTGW), the outcome investigated (e.g., prediabetes and T2DM), and their definitions and assessment methods; the value of the factor as exposure and comparator factor; the statistical results reported [e.g., multivariate hazard ratios (HRs) and univariate odds ratios (ORs)]; and methods.
Study risk of bias assessment
Two co-authors (LH and DD/MB/AM/LV) independently assessed the risk of bias using the Quality In Prognosis Studies (QUIPS) tool (30). Disagreements were resolved by discussion, conducted separately for each outcome and factor. Further details on the Risk of Bias assessment methodology can be found in the Supplementary Materials (Methods S4).
Data synthesis
As we assumed considerable heterogeneity among the underlying population of the reported study results by the nature of the question under investigation, random-effects models were used in a frequentist framework.
Crude and adjusted OR were used as effect size measures for categorical outcomes. To calculate the crude ORs, we extracted the total number of patients and those with the event of interest in each group separately from the studies (called “raw data”). For adjusted OR and when the studies reported the crude OR directly, we used the published value with its confidence interval (CI) in the analysis. The difference between the means (MD) was used as an effect size measure for continuous outcomes. To calculate the study MDs and pooled MD, we extracted or estimated the sample size, the mean, and the corresponding standard deviation (SD) from each study (separately for each group). For time-to-event data, we used adjusted HR with 95% CI as the main measure of effect between the two groups of interest. We summarized the findings in forest plots.
Between-study heterogeneity was also described by the between-study variance (τ2) and Higgins and Thompson’s I (2–31) statistics. We directly reported the prediction interval only if the study number was over eight to ensure a meaningful estimation.
Small study publication bias was assessed by visual inspection of funnel plots and calculating Egger (for continuous, time-to-event data) or Harbord (for dichotomous) test p-value (32). However, we kept in mind that the diagnostic assessment of the test was limited, with less than 10 studies.
Potential outlier publications were explored using different influence measures and plots as recommended by Harrer et al. (33).
All statistical analyses were calculated by R software (34) using the meta (35) (v7.0.0) package for basic meta-analysis calculations and plots, and the dmetar (36) (v0.1.0) package for additional influental analysis calculations and plots. The package metafor (37) (v4.6.0) was used for the multilevel model.
For more details on calculations, data synthesis, publication bias assessment, and influential analyses, please read the detailed description in Supplementary Methods S3.
Results
Search and selection
Altogether, 31,098 articles were identified by searching three databases. After the selection process and reference checking, we included 145 studies, but only 101 articles were eligible for quantitative analysis. Because of overlapping populations, insufficient data for statistical analysis, and lack of poolable categories, the other 44 articles were included in the systematic review section and/or were used in forest plots only for visualization purposes. In the case of overlapping populations, the larger population and more recent publications were preferred, as described in more detail in the Supplementary Materials (Methods S2).
The PRISMA flow diagram with the calculated Cohen’s kappa values (Figure 1) provides detailed information on the selection (25).
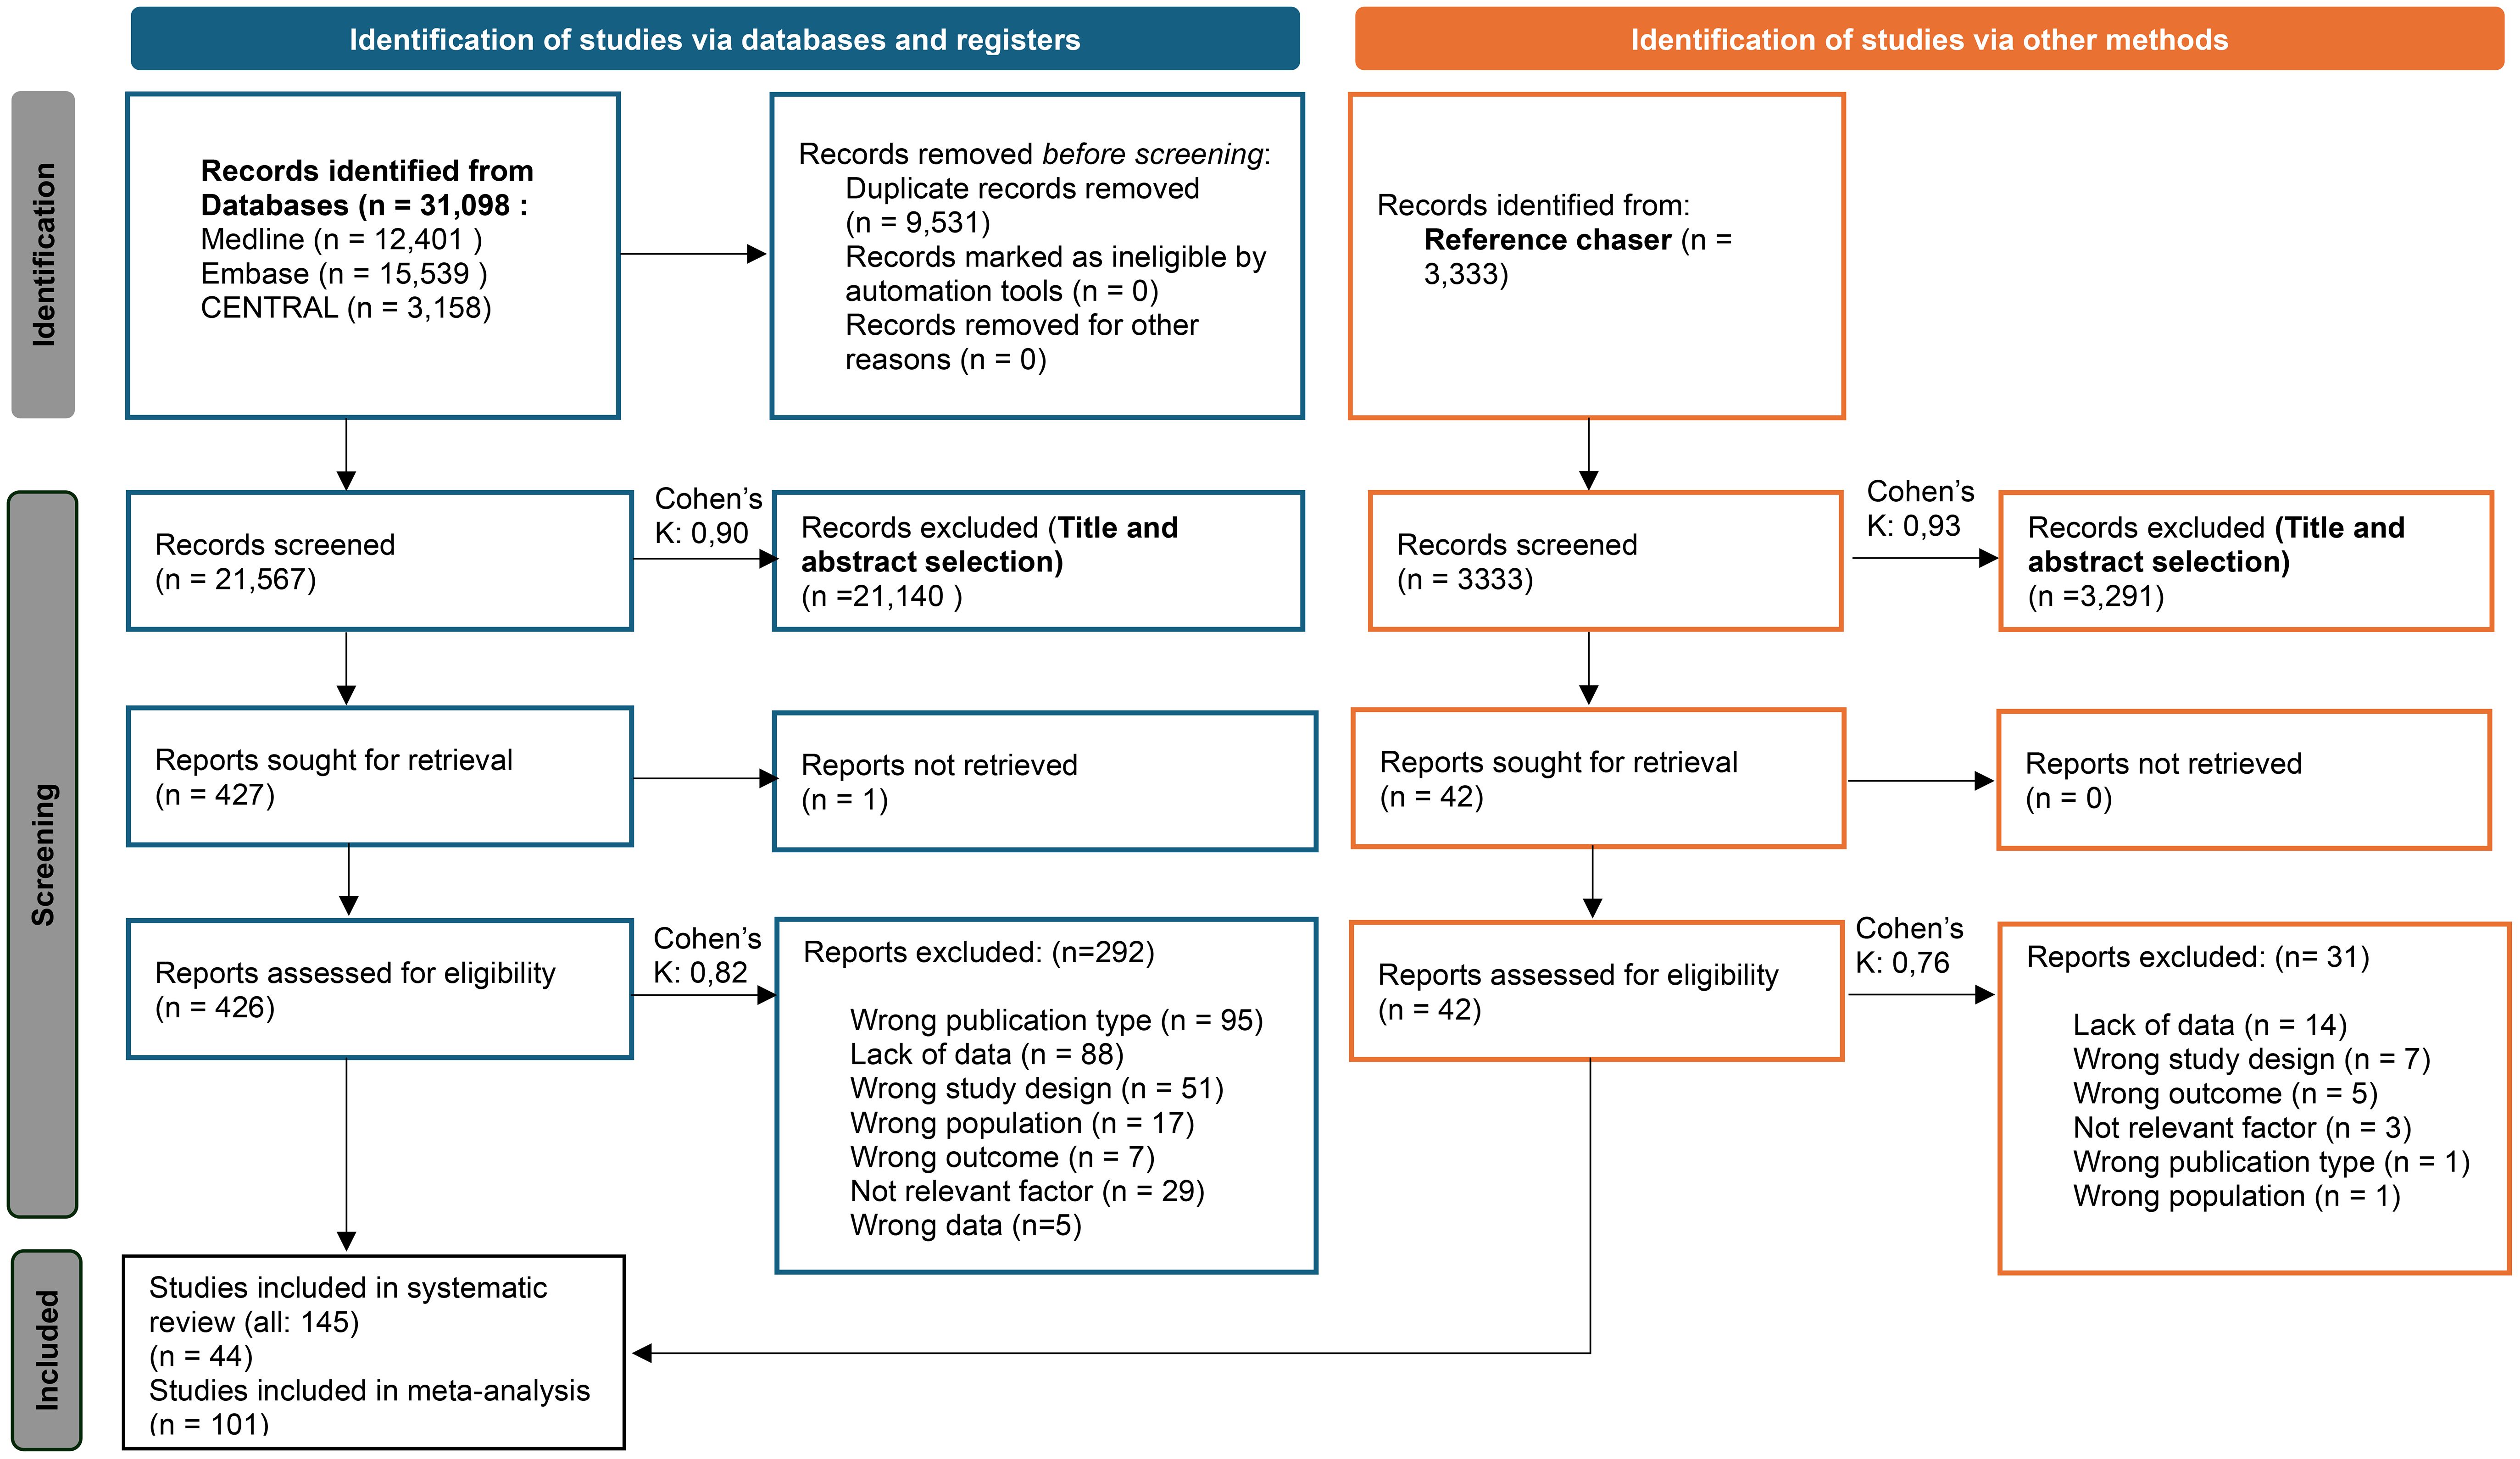
Figure 1. PRISMA 2020 flow diagram for new systematic reviews that included searches of databases, registers, and other sources (25).
Basic characteristics of studies included
The basic characteristics of the studies included are provided in the Supplementary Materials (Supplementary Tables S3A, B), separately for articles included in the quantitative synthesis and separately for articles included only in the qualitative synthesis.
Triglyceride level
First, we analyzed patient groups with and without HTG (>1.7 mmol/L or = 150 mg/dL cutoff value). We found that according to our eight included (38–45) cohort studies with a total population of 19,525,661 participants, those with HTG at baseline had a more than 1.5-fold higher risk (HR: 1.73 [1.31; 2.29]) of the development of T2DM during the follow-up period (Figure 2). As we aimed to investigate the dose-dependent effect of TG level, we further analyzed two different TG level groups. According to the three included studies with a sample size of 29,485, participants with TG levels of 1.7–2.3 mmol/L had an almost 1.5-fold higher risk of incident diabetes (HR: 1.42 [1.13; 1.79]) and those with even higher TG levels (>2.3 mmol/L) had an even higher risk of developing diabetes (HR: 1.84 [1.18; 2.87]) compared with patients with TG levels below 1.7 mmol/L (Figure 2) (12, 46). This trend was also observed in the articles reporting OR (1.7–2.3 mmol/L: OR: 1.5 [1.01; 2.22], >2.3 mmol/L: OR: 2.44 [1.56; 3.80]) (Supplementary Figure S2) (47–57).
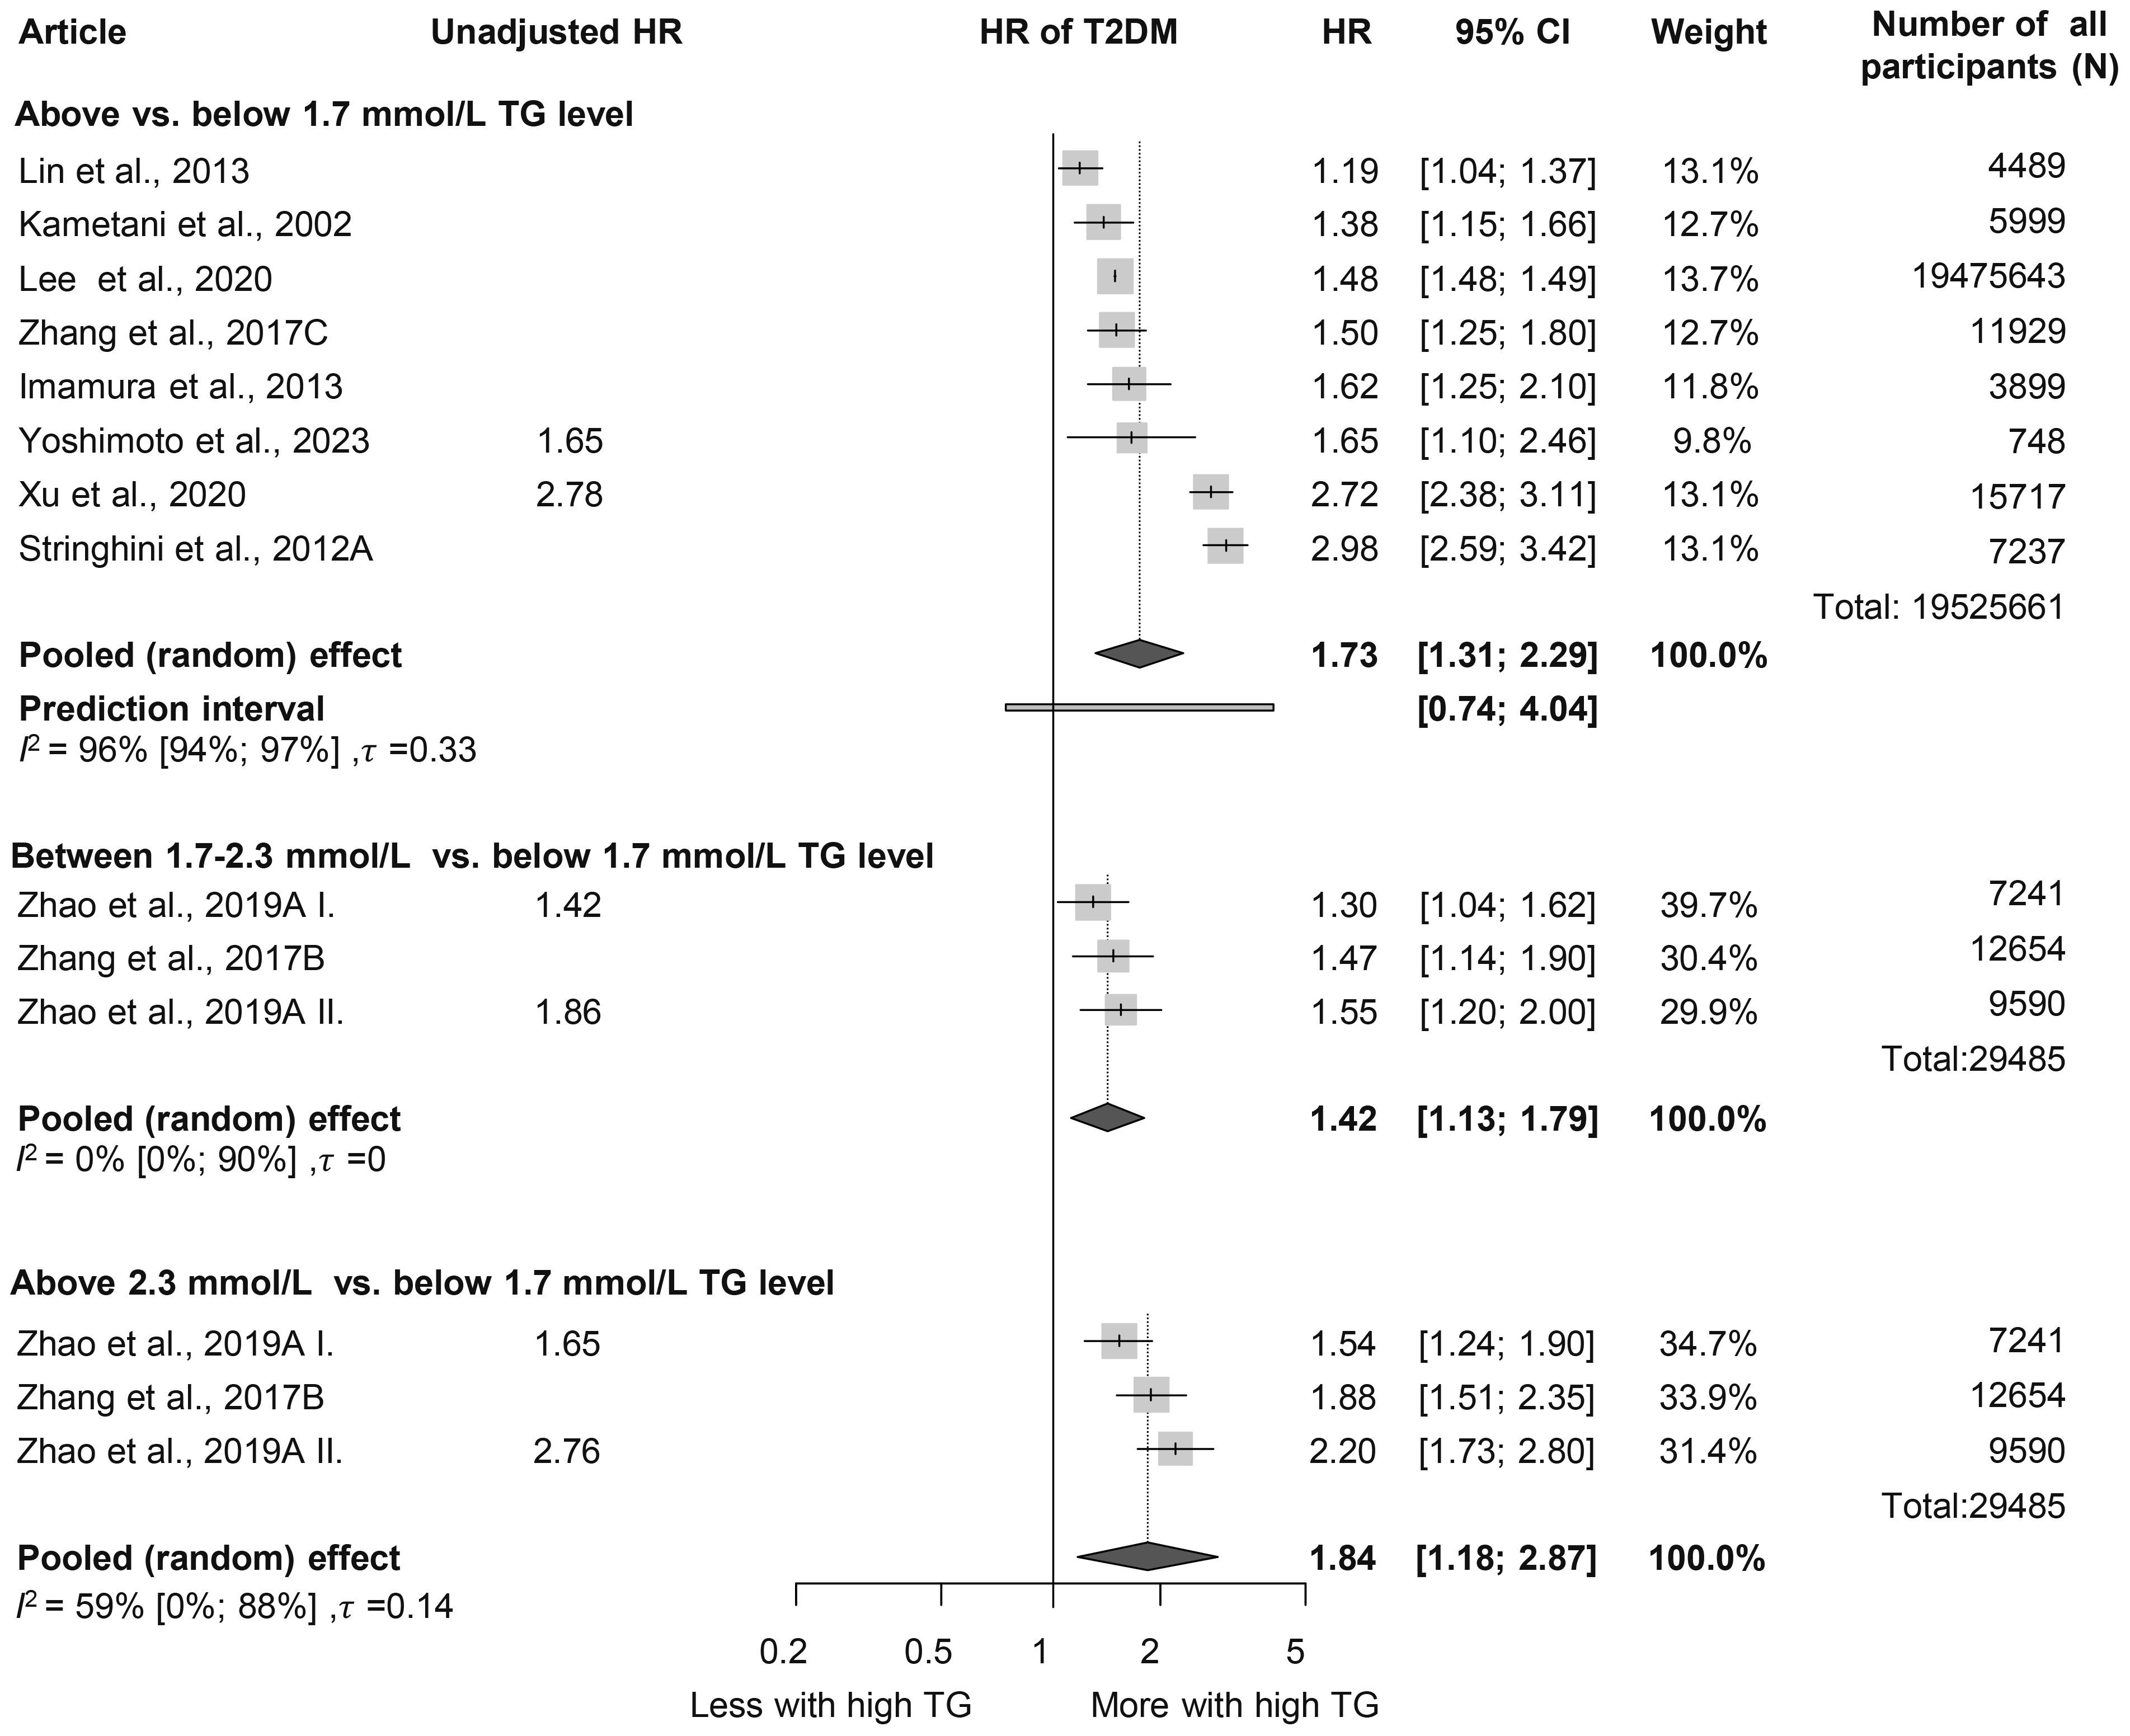
Figure 2. Hazard ratios for incident diabetes comparing groups with different baseline TG levels; results of three separate analyses (HR, hazard ratios; TG, triglyceride; T2DM, type 2 diabetes mellitus).
Analysis of baseline TG levels revealed that participants who developed diabetes had significantly higher TG levels, by nearly 0.5 mmol/L on average, compared to those who did not develop diabetes (MD: 0.46 mmol/L [0.41; 0.52 mmol/L]) (Figure 3, Supplementary Figure S3) (45, 47–50, 52, 54, 58–108). Those who developed prediabetes during follow-up had 0.31 mmol/L [0.06; 0.56 mmol/L] higher TG levels at baseline, which is a smaller difference than in those who developed T2DM (Supplementary Figure S4) (50, 58, 61, 89, 100, 109, 110). We also performed a subgroup analysis on the MD of TG levels in men and women; the MD was 0.50 mmol/L [0.37; 0.64 mmol/L] in women and 0.45 mmol/L [0.32; 0.58 mmol/L] in men (Supplementary Figure S5) (54, 63, 64, 68, 75, 80–82, 87, 90, 94, 104).
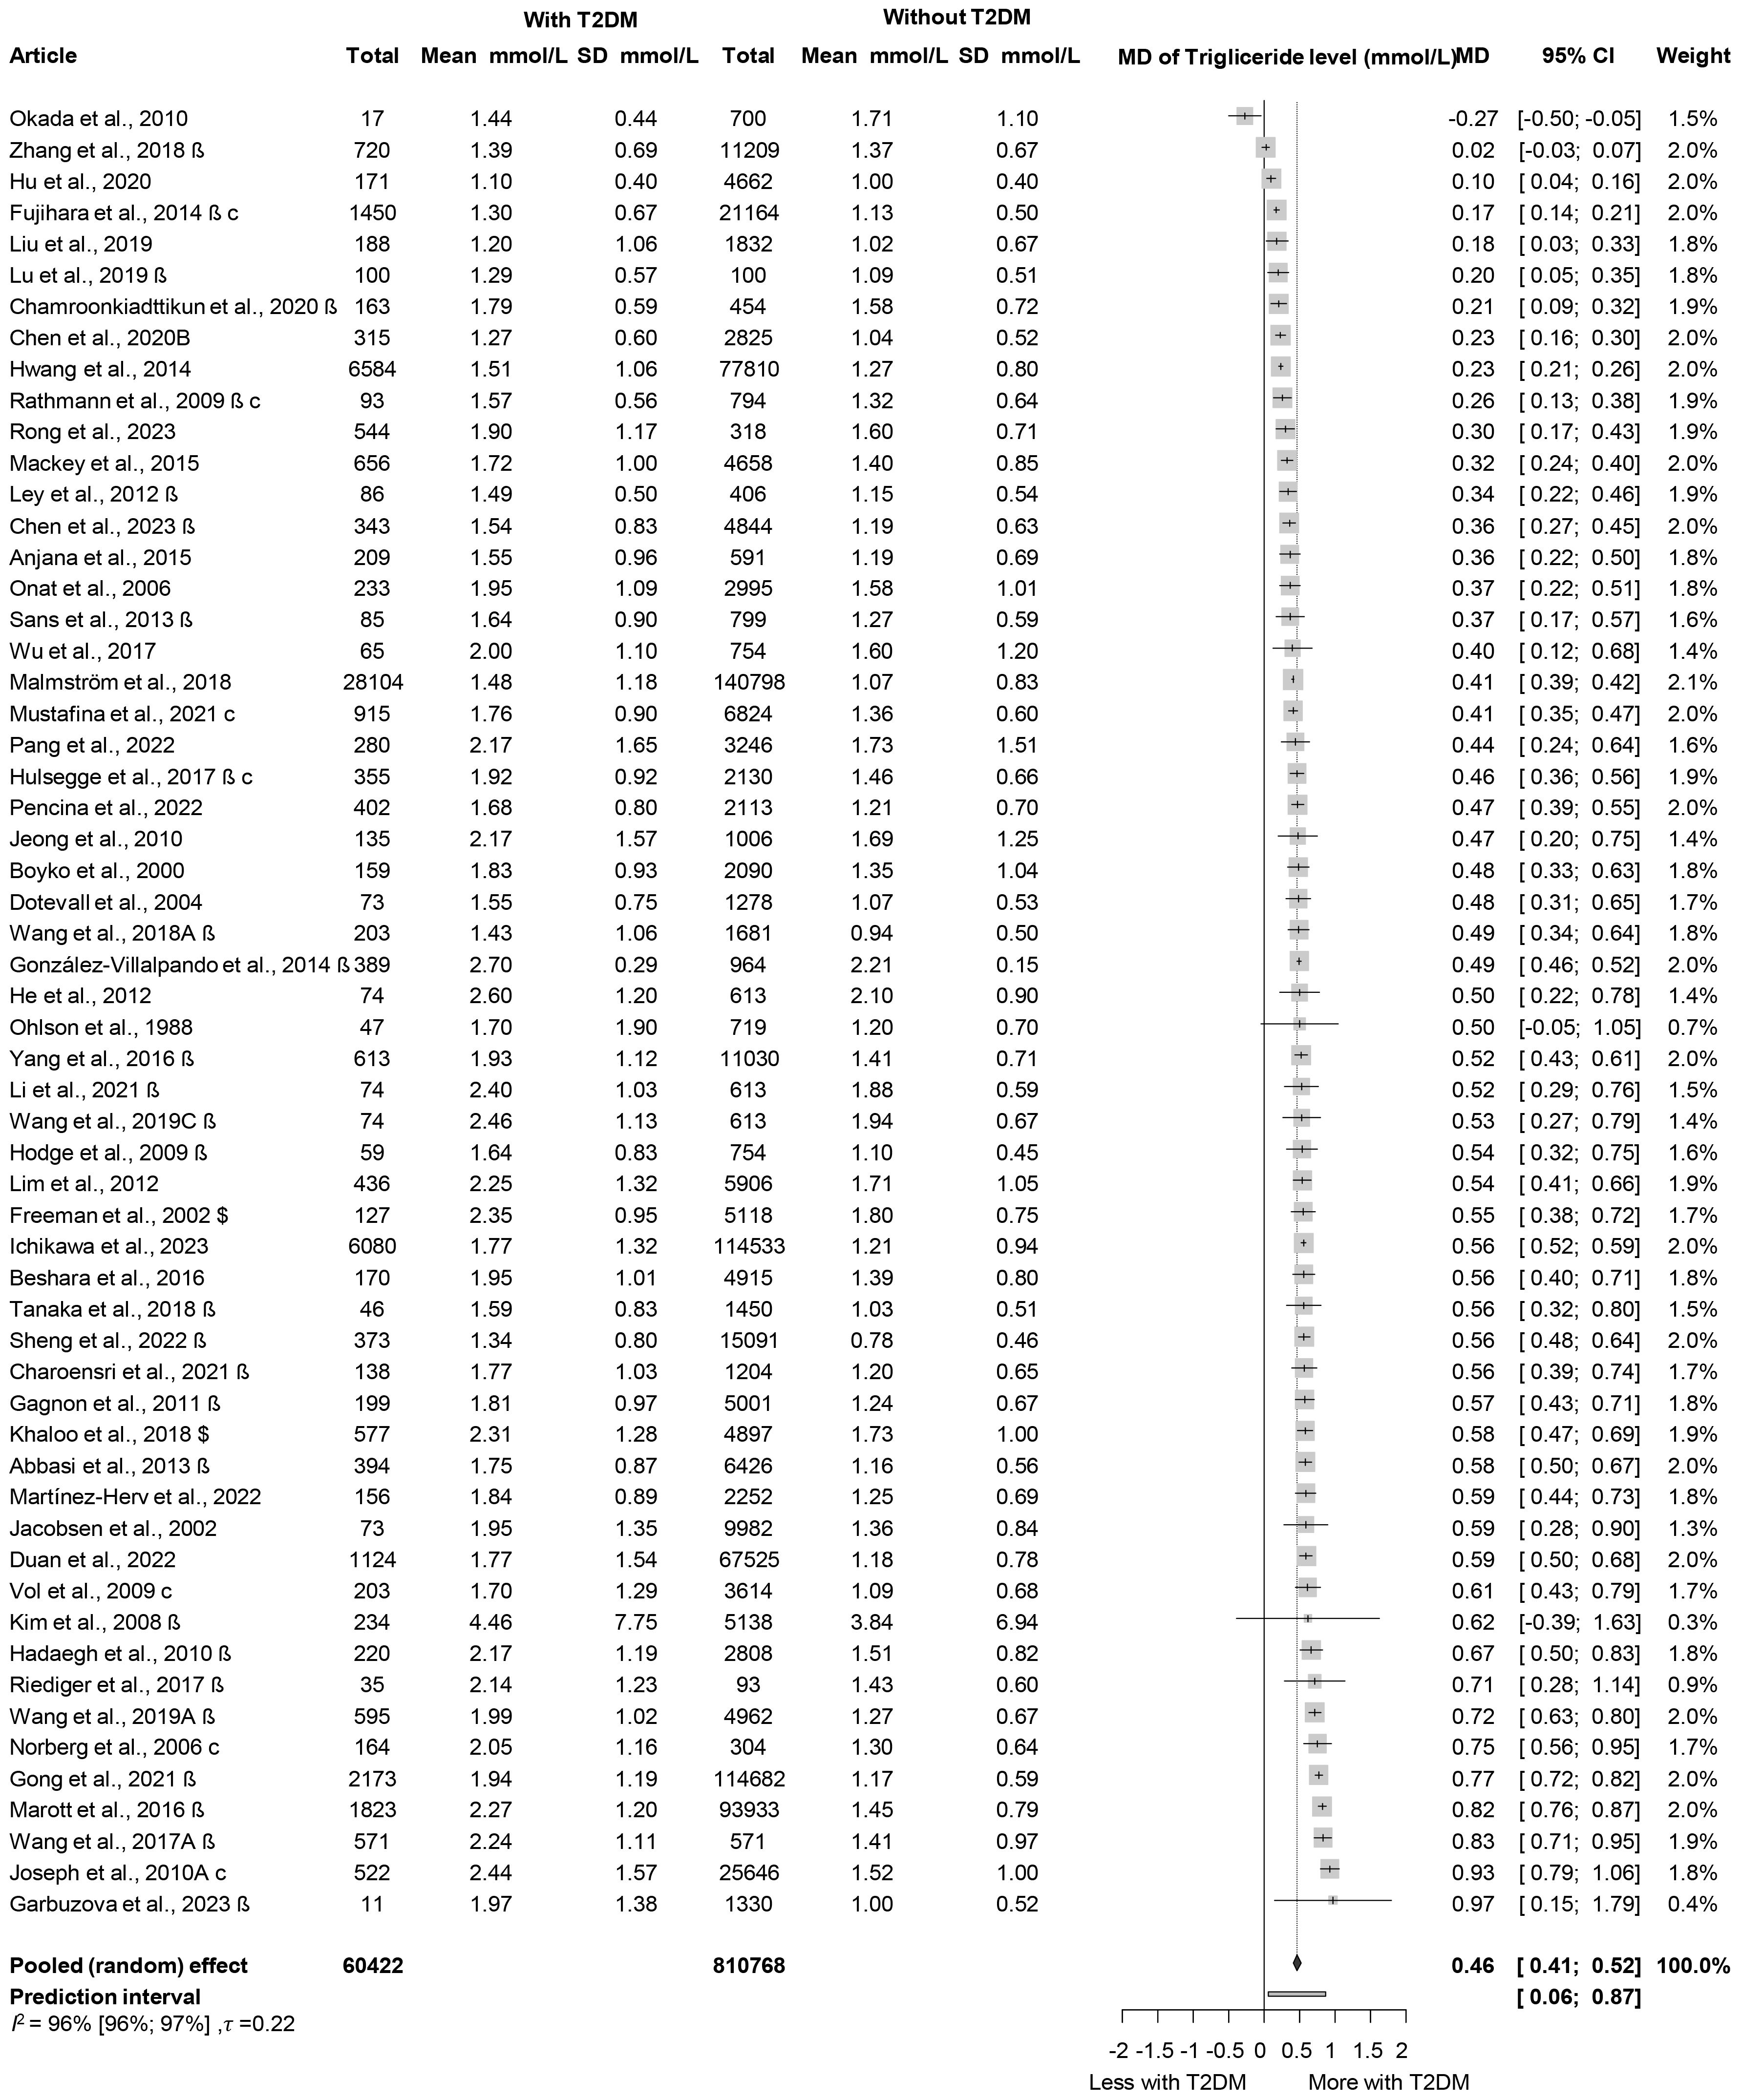
Figure 3. Mean differences (MD) in baseline TG levels, between patient groups with and without T2DM developed in the follow-up periods (MD, mean difference; TG, triglyceride; T2DM, type 2 diabetes mellitus; β, mean and SD are estimated mean and SD based on the quartiles in that study; c, male and female data from the same study were combined; $, mean and SD are estimated mean and SD based on the mean and SD given on the log scale variable in that study).
For every 50 mg/dL (0.56 mmol/L) increase in TG levels, the HR for incident diabetes was 1.08 [1.04; 1.13] based on six studies (Supplementary Figure S6) (39, 92, 97, 102, 111, 112) and we also visualized HRs corresponding to the SD increase in TG level in Supplementary Figure S6 (67, 79, 81, 87, 94, 95, 113, 114). The results of articles reporting OR also suggest that a 50-mg/dL increase in TG is a risk factor for T2DM (Supplementary Figure S7) (47, 66, 70, 71, 84, 90, 93, 99, 106, 115–119).
Hypertriglyceridemic waist phenotype
When assessing the HTGW phenotype, we found that participants with increased waist circumference but normal TG levels had a significantly elevated HR for diabetes in both sexes (women: HR: 2.86 [1.59; 5.14]; men: HR: 3.31 [1.51; 7.27]). Among those with HTG but normal waist circumference, HRs were lower (women: HR: 2.30 [0.66; 7.95]; men: HR: 1.82 [0.95; 3.48]). Participants with both elevated TG levels and waist circumference exhibited the highest risk, with more than a 3.5-fold increased risk in both sexes; however, these results were not significant (women: HR: 3.54 [0.52; 23.94]; men: HR: 3.51 [0.59; 20.84]) (Figure 4) (16, 21, 43).
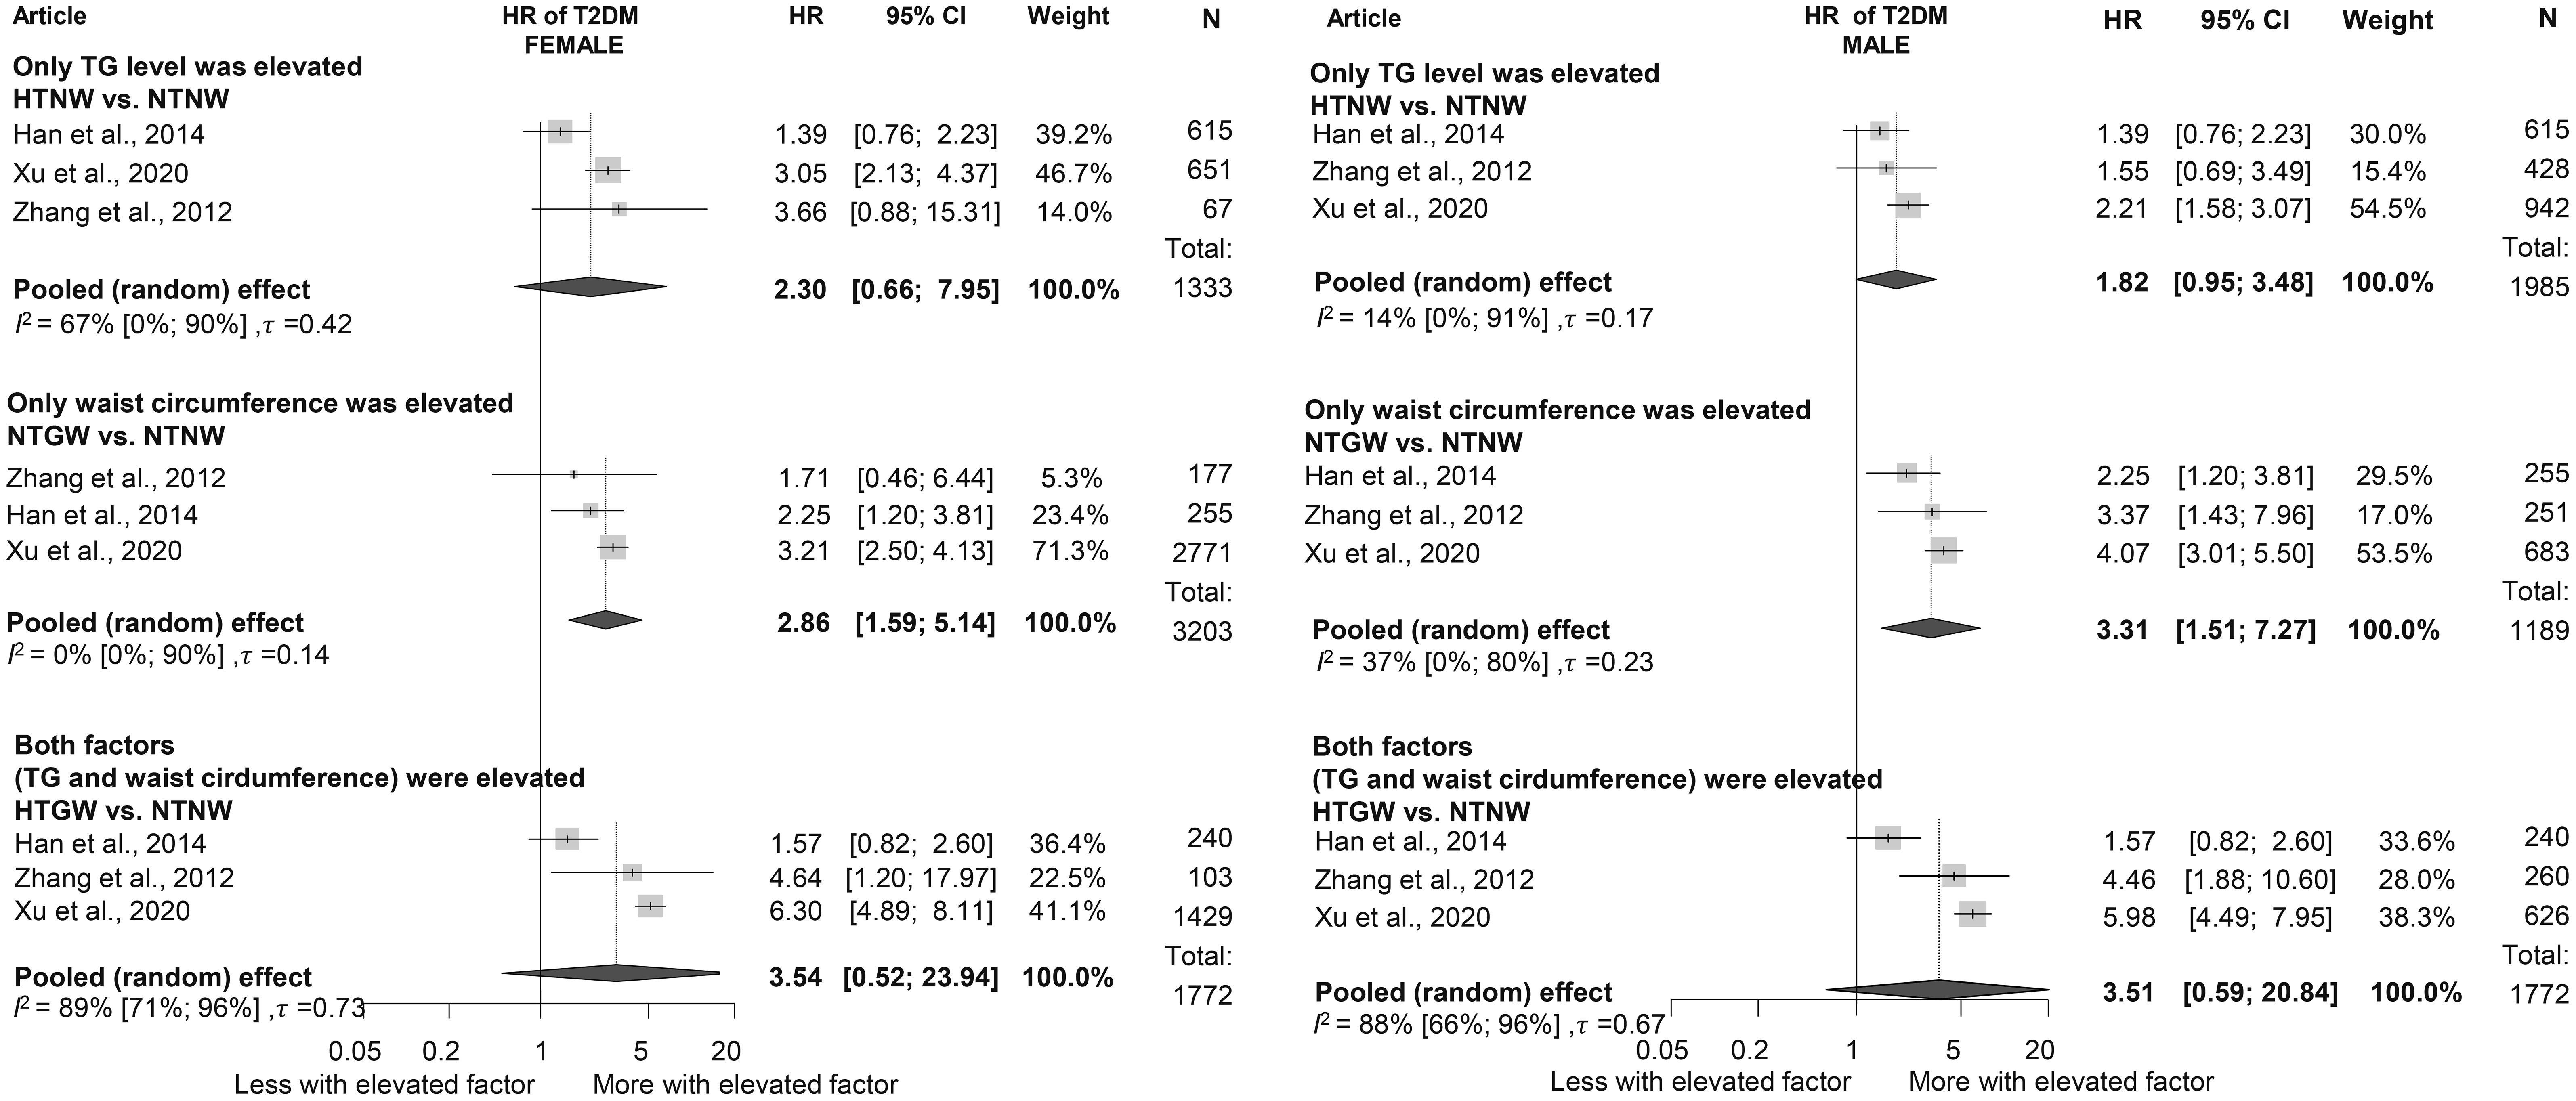
Figure 4. Hazard ratios for incident diabetes in groups with elevated triglyceride or/and waist circumference compared to neither elevated group [within hypertriglyceridemic waist (HTGW) phenotype groups], divided by sex (female/male); results of six separate analyses (HR, hazard ratios; TG, triglyceride; T2DM, type 2 diabetes mellitus; NTNW, normal triglyceride level and waist circumference; HTNW, elevated triglyceride level and normal waist circumference; NTGW, normal triglyceride level and elevated waist circumference; HTGW, elevated triglyceride level and waist circumference; N, number of men or women in that phenotype group).
Triglyceride/high-density lipoprotein ratio
We evaluated the TG/HDL-C ratio as a risk factor for diabetes. Participants in the highest TG/HDL-C quartile (Q4) had a significantly higher HR for diabetes compared to those in the lowest quartile (Q1) (HR: 2.17 [1.53; 3.09]). This finding was consistent across sex groups (women: HR: 1.91 [1.08; 3.38]; men: HR: 1.65 [1.16; 2.35]) (Figure 5) (3, 15, 19, 64, 96, 120–126). Baseline TG/HDL-C ratios were also significantly higher among those with diabetes (MD: 0.65 [0.20; 1.10]) (Supplementary Figure S8) (64, 66, 102, 120, 127). Our results show that for a one-unit increase in TG/HDL-C ratio, the risk of developing diabetes is 1.14 [1.00; 1.31] (Supplementary Figure S9) (15, 102, 114, 125, 128).
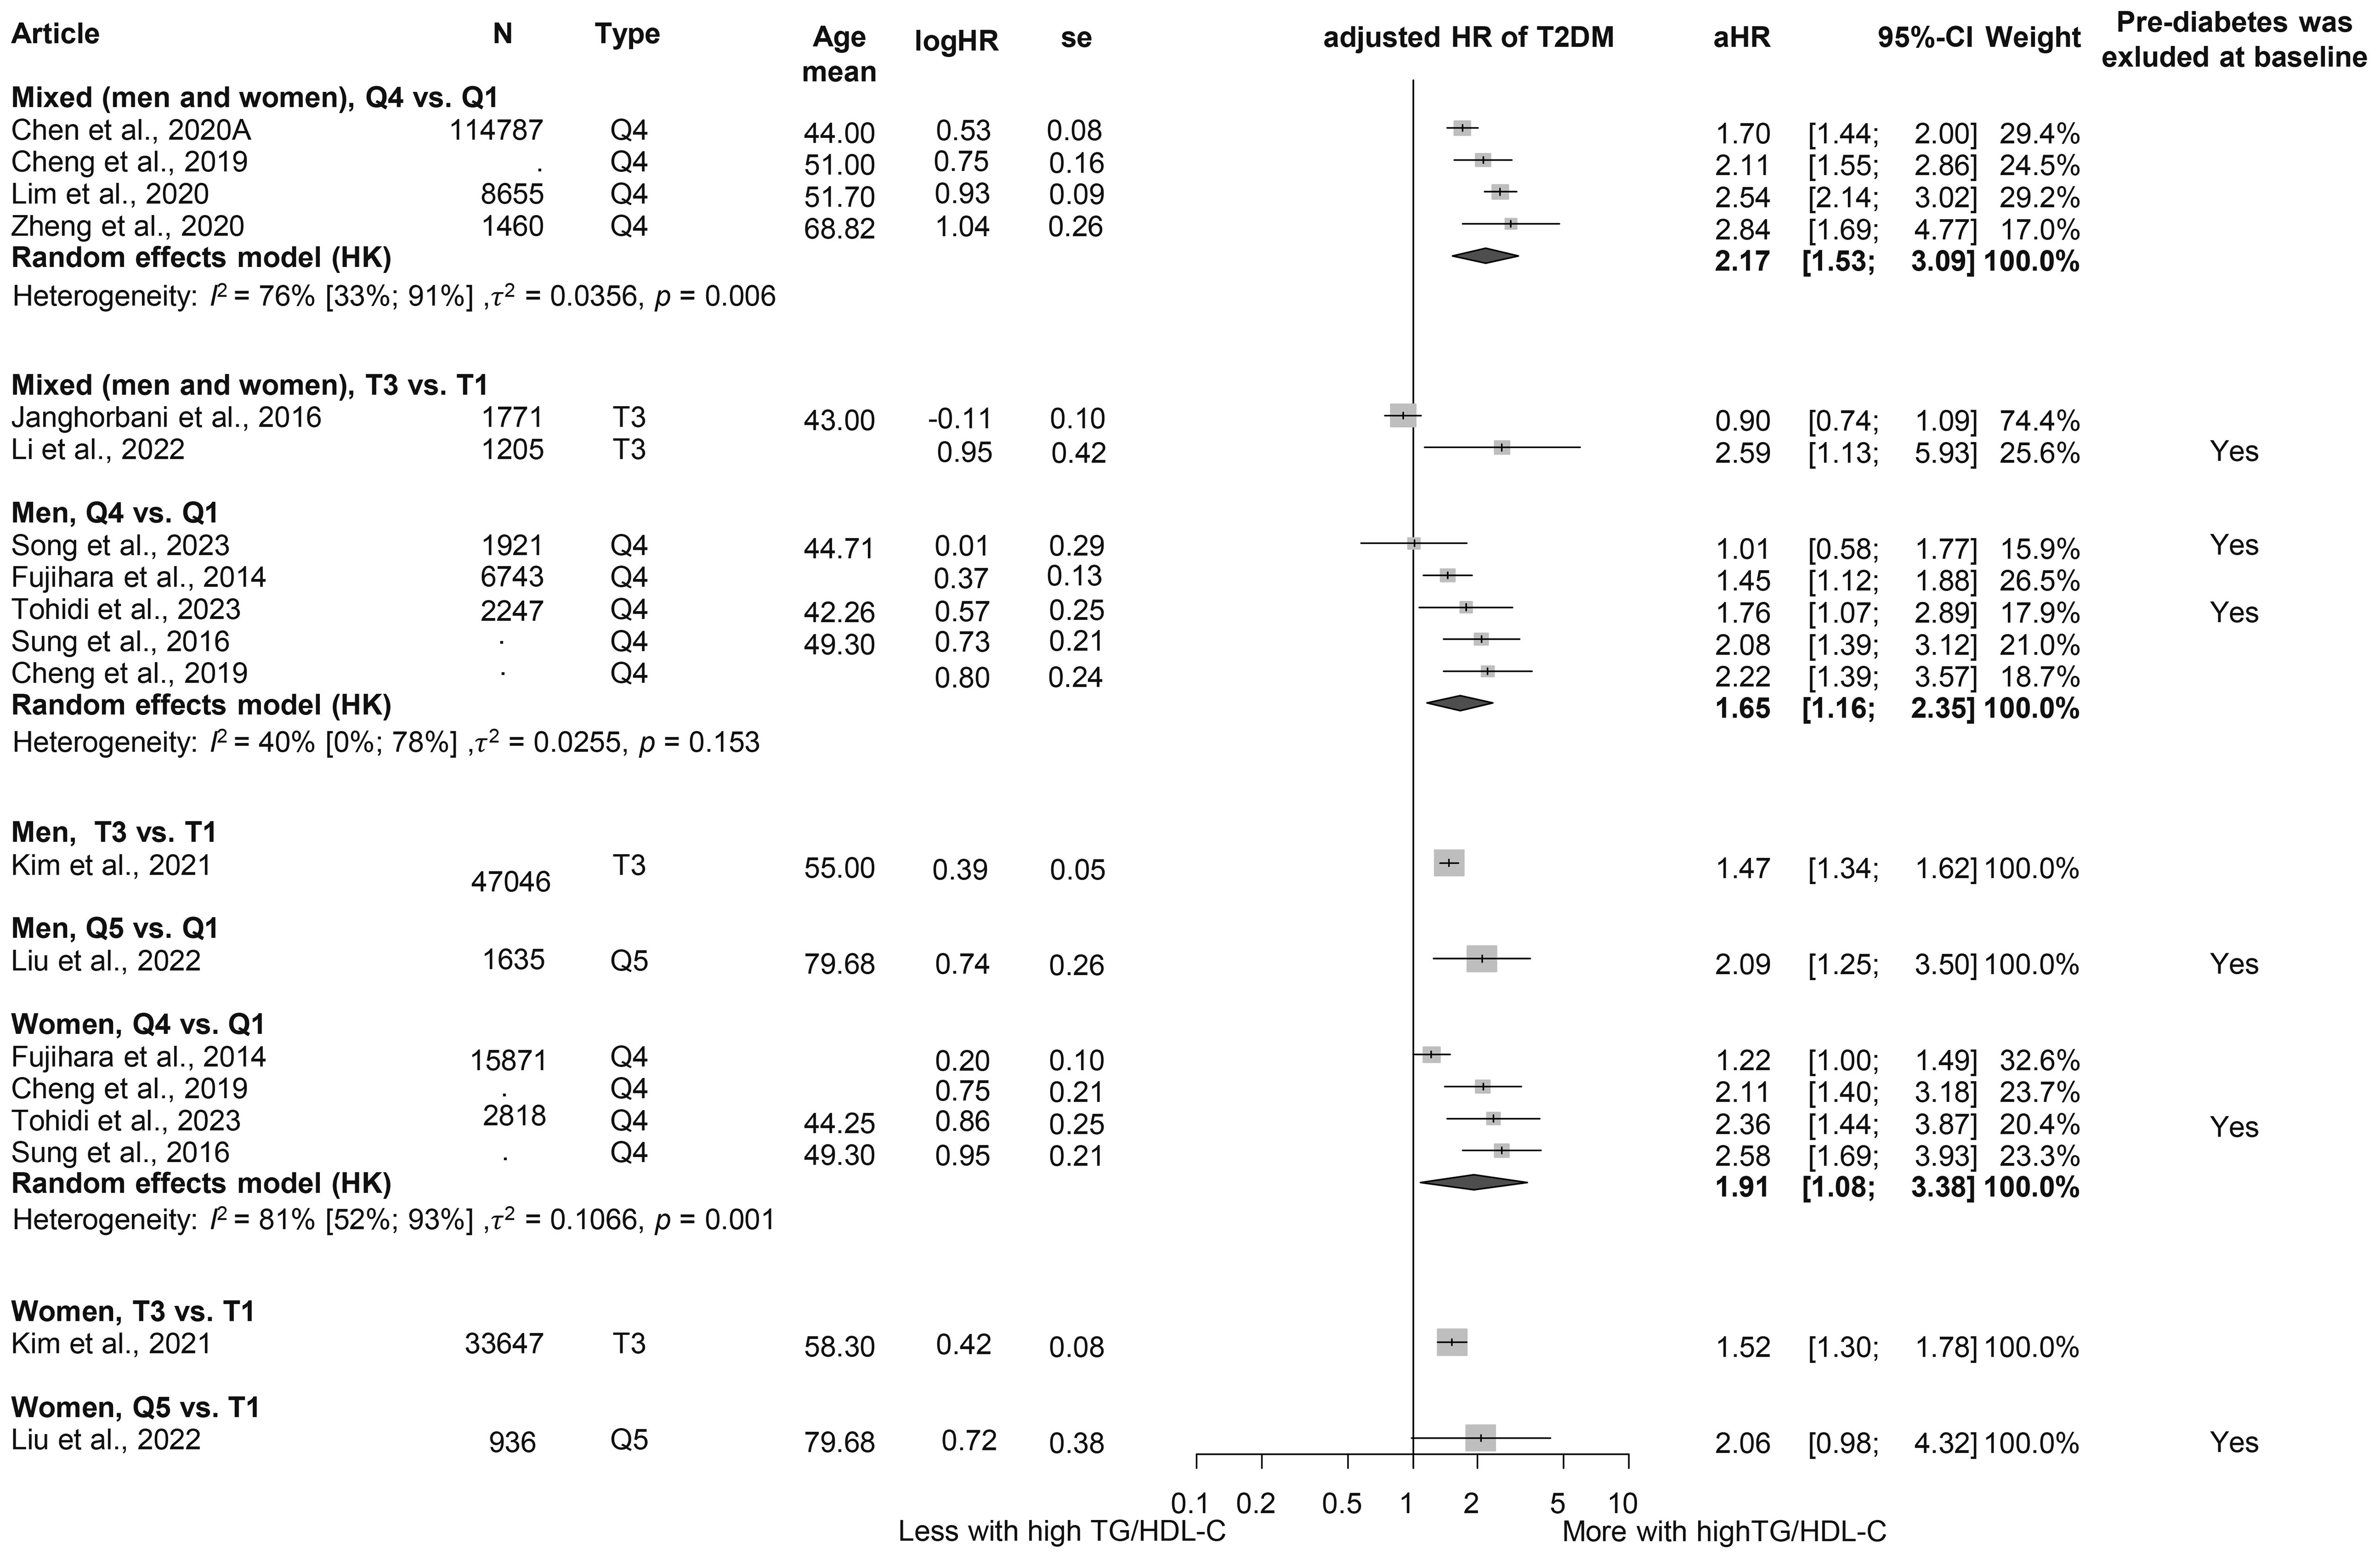
Figure 5. Hazard ratios for incident T2DM in groups with the highest triglyceride/high-density lipoprotein cholesterol (TG/HDL-C) ratio compared with the lowest TG/HDL-C ratio (HR, hazard ratio; T2DM, type 2 diabetes mellitus; TG/HDL-C, triglyceride/high-density lipoprotein cholesterol ratio; T1, 1st tertile; Q1, 1st quartile/1st quintile; T3, 3rd tertile; Q4, 4th quartile; Q5, 5th quintile; N, number of all participants or all male or all female participants in case of different sex groups).
Triglyceride-glucose index
When examining TyG, we obtained similar results as for the TG/HDL-C ratio. Those in the highest TyG group by population (quartile 4) had a higher HR for diabetes than those in the lowest TyG group (Q1), with more than a threefold increased risk (HR: 3.25 [1.91; 5.52]) (Figure 6) (3, 17, 18, 81, 121, 127, 129–133). This risk was higher than that observed for the TG/HDL-C ratio. The MD in baseline TyG between those who did and those who did not develop T2DM was 0.30 [0.21; 0.40] (Supplementary Figure S10) (3, 17, 18, 60, 81, 127, 134–136). An SD increase in the Tyg index was identified as a risk factor for developing T2DM (HR: 1.36 [1.15; 1.60]), whereas for a one-unit increase in this index, the HR was 1.91 [0.61; 5.98] (Supplementary Figure S11 (3, 18, 134, 137) and Supplementary Figure S12 (129, 132, 133, 138)).
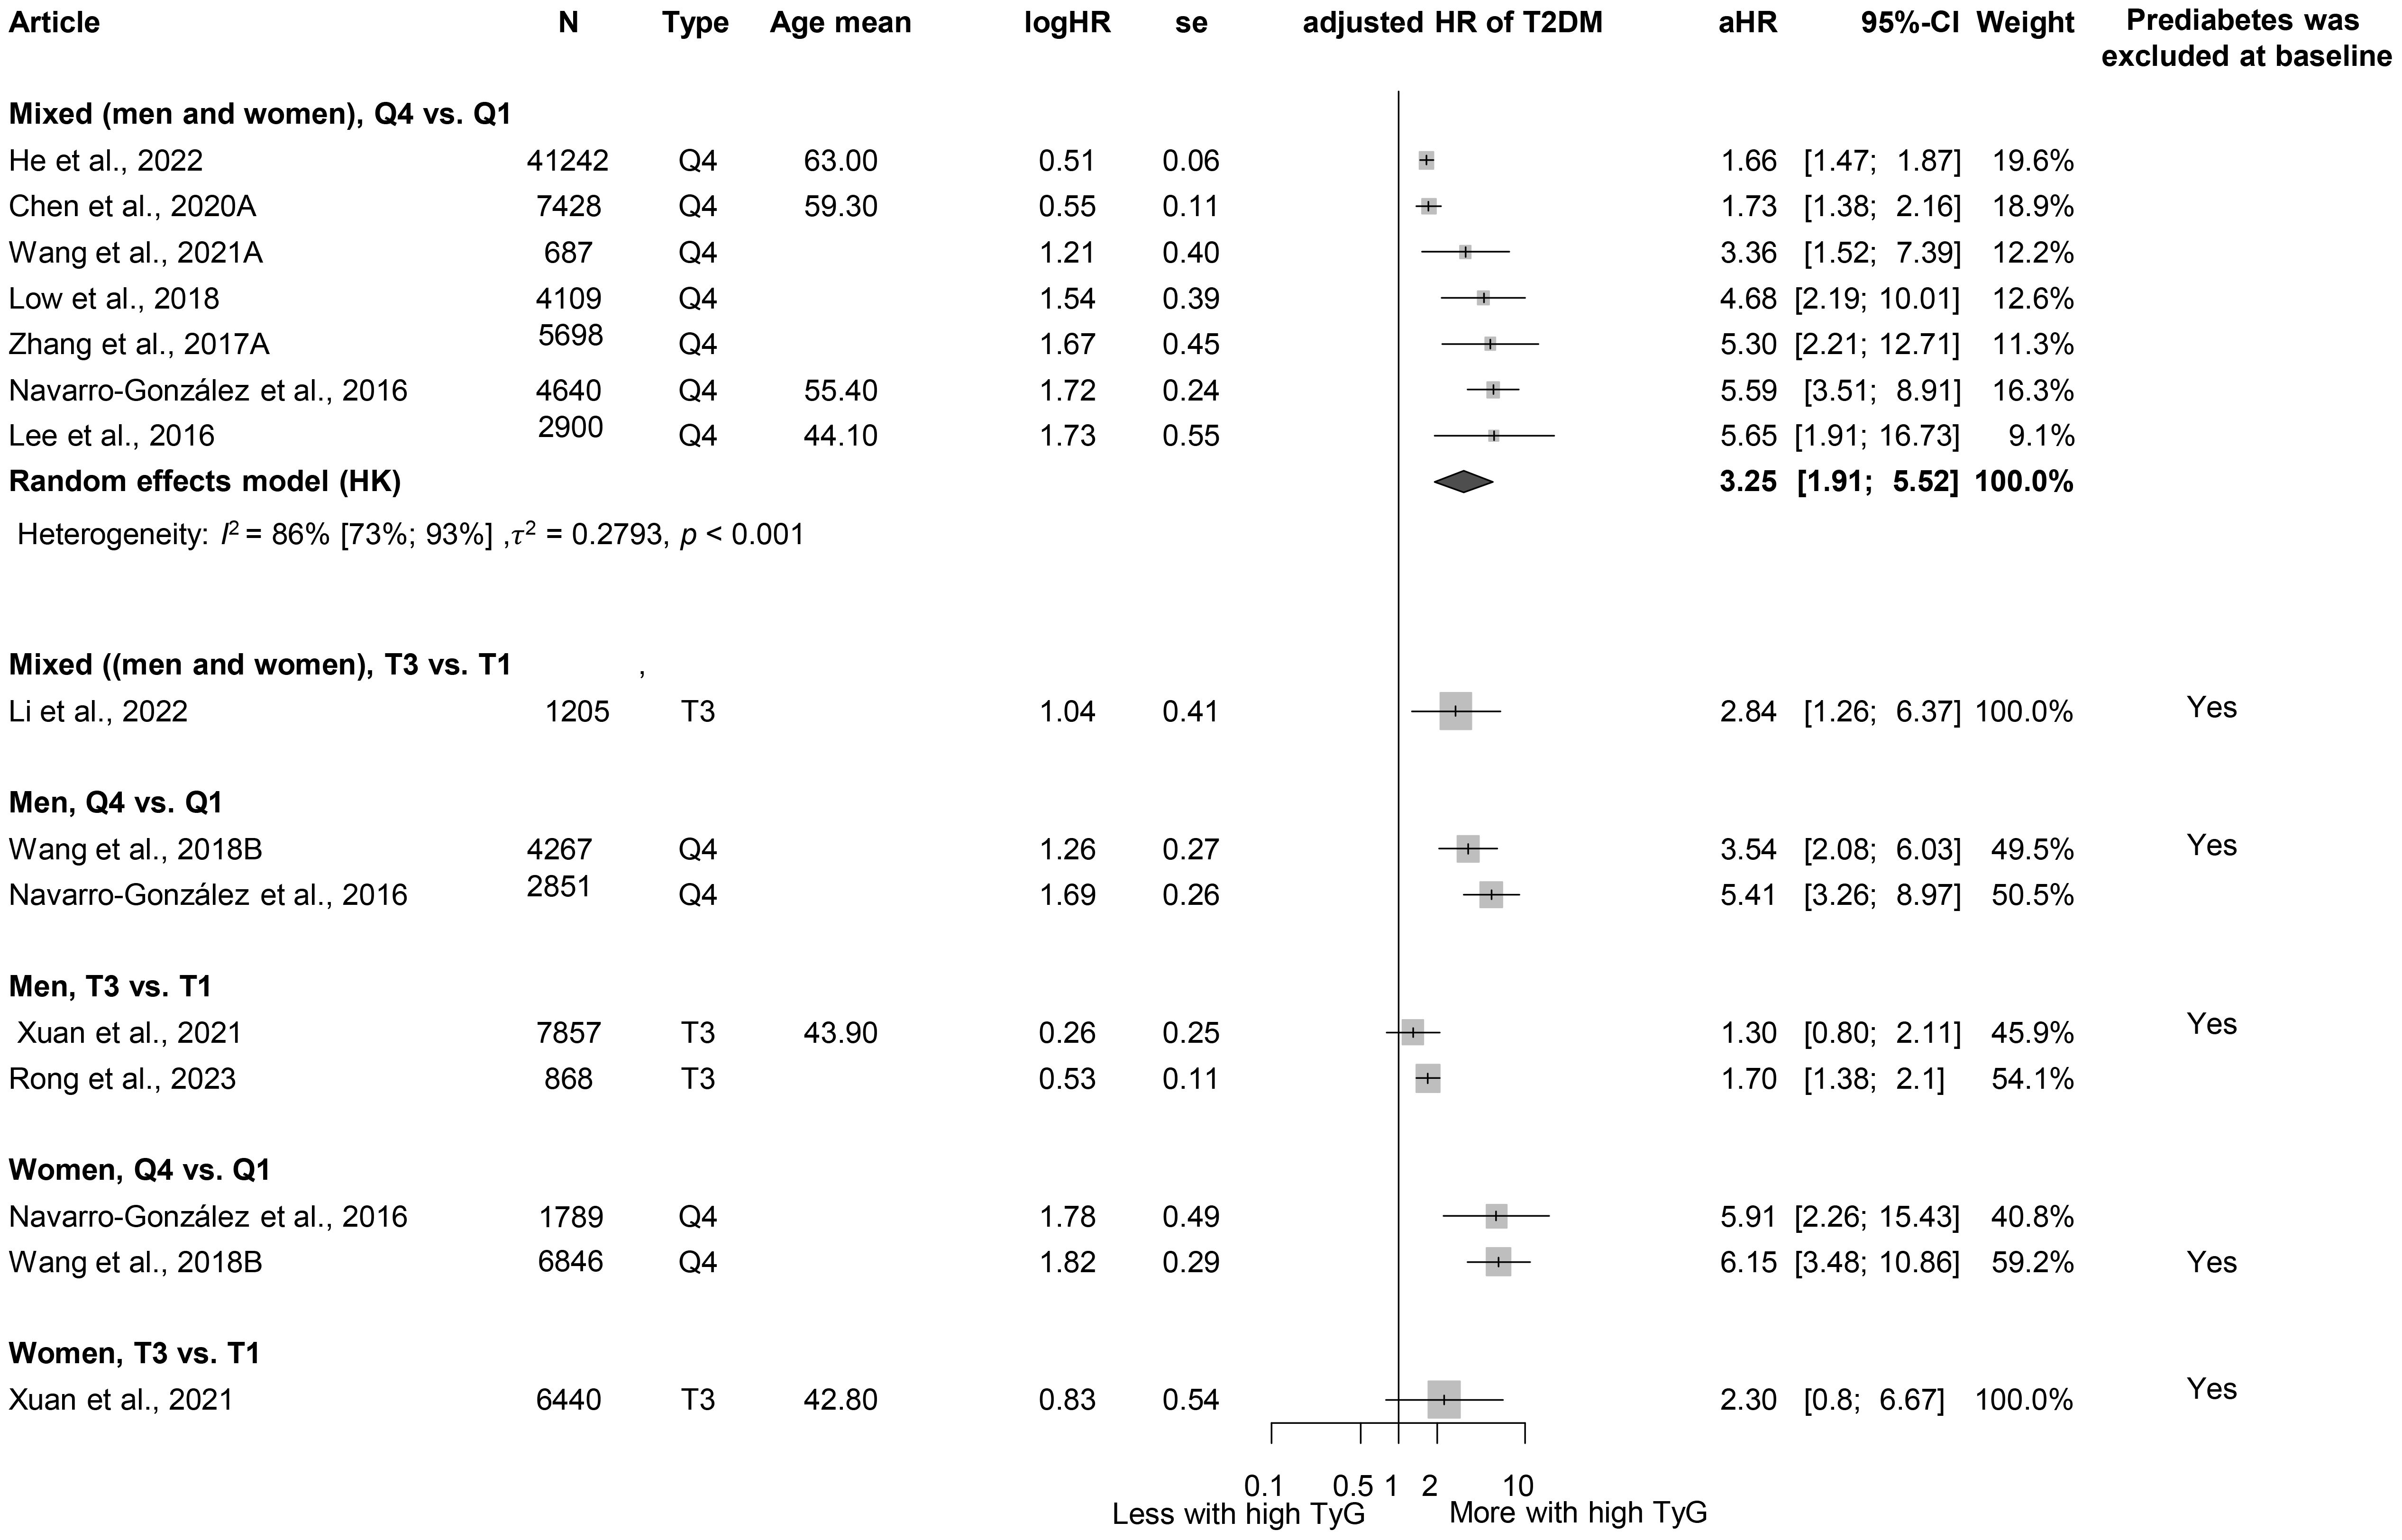
Figure 6. Hazard ratios for incident T2DM in groups with the highest triglyceride-glucose index (TyG) compared with groups with the lowest TyG index (HR, hazard ratio; T2DM, type 2 diabetes mellitus; TyG, triglyceride-glucose index; T1, 1st tertile; Q1, 1st quartile/1st quintile; T3, 3rd tertile; Q4, 4th quartile; N, number of all participants or all male or all female participants in case of different sex groups).
Heterogeneity, risk of bias assessment, and sensitivity analysis
Heterogeneity was generally high due to the large but diverse population and different follow-up durations of the relatively large number of cohorts included. The risk of study participation, outcome definition, and statistical analysis reporting was generally low, and potential bias was observed in terms of study attrition, prognostic factor measurement, and study confounding. The detailed results for risk of bias assessment separately for articles included in the quantitative analysis and qualitative analysis are available in the Supplementary Materials (Supplementary Figures S1A, B). There was no evidence of publication bias, and the leave-one-out analyses (where it was a meaningful enough study) showed either no statistically “influential” article or the effect of the statistically “influential” article was not clinically relevant.
Discussion
This is the first meta-analysis to examine not only individual TG levels and values but also several TG-related indices to explore the risk of diabetes in more depth. Our results suggest that triglyceride levels have a significant impact on the development of T2DM and highlight the role of different TG-related indices in this process. Our analysis suggests that the relation between TG levels and T2DM risk is dose-dependent. Although the link between HTG and T2DM has been extensively studied, most research has focused on dyslipidemia as a complication of IR or T2DM (23, 24). However, recently, with the emergence of more prediction models and research exploring T2DM risk factors, TG levels have been investigated from another perspective (139–144). In line with our own research findings, several previous and recent studies have found that higher triglyceride levels are associated with the development of DM and that HTG may act as a risk factor for T2DM (110, 145–158).
The underlying mechanisms potentially disrupt the metabolic pathways of free fatty acids (FFAs). Excess FFAs, along with resistin, tumor necrosis factor-α (TNF-α), interleukin-6, and other compounds released by enlarged adipose tissue, contribute to the development of IR, but elevated FFA levels can be triggered by increased TG production as well, further exacerbating IR (159, 160). Lipotoxicity, endoplasmic reticulum stress, and inflammation induced by dyslipidemia represent additional mechanisms that link TG abnormalities to IR (161).
Despite significant research efforts, the complex interactions between these conditions and their bidirectional influence remain to be further investigated.
While analyzing the HTGW phenotype, we found, based on the results of three cohorts, that only elevated waist circumference without HTG was a significant risk factor for T2DM in both sexes, and the highest HR was detected when both factors were elevated, consistent with previous publications (162–165). Prior studies also highlight the crucial importance of obesity and elevated adipose tissue in the development of IR and T2DM, which is partly due to the production of FFA and TNF-α and interleukins by the adipose tissue (159, 166, 167).
The TG/HDL-C ratio—an established marker of cardiovascular risk—has been shown to be associated with the incidence of IR, prediabetes, and even T2DM in previous studies (168–170). Consistent with our findings, a 2018 meta-analysis identified the TG/HDL-C ratio as an independent predictor of T2DM. The meta-analysis highlighted a dose–response relationship and reported a stronger association in female than in male patients, underscoring the importance of considering sex-specific differences in prevention strategies (15). Similarly, our analysis observed sex differences, with female patients demonstrating a higher risk of T2DM, aligning with these previous findings. In addition to the pathways already listed that lead to T2DM (such as lipotoxicity and inflammation), low HDL may directly mediate glucose, resulting in IR and T2DM (171, 172).
The TyG index has also emerged as a significant risk factor for T2DM, with an HR exceeding the HR of elevated TG/HDL-C ratio. This difference may be attributed to the inclusion of glucose—a direct marker of glucose metabolism—in the TyG index, making it a more specific indicator of glucose metabolism. The primary utility of the TyG index has previously been the risk of IR, but more recently, several studies have investigated and identified it as a risk factor for T2DM (173–176). Similar to our findings, in a previous meta-analysis, Pranata et al. also proved its impact on the development of T2DM; in their case, they found a non-linear association (14).
HTG management necessitates a multifaceted approach encompassing both lifestyle and pharmacological interventions. Lifestyle modifications, including a modest weight reduction of 5%–10%, dietary adjustments to reduce saturated fat intake, and increased dietary fiber consumption, have been shown to favorably influence triglyceride levels (177). In more severe cases, pharmacotherapy becomes essential. Statins, by inhibiting HMG-CoA reductase, limit hepatic cholesterol biosynthesis, thereby reducing triglyceride-rich lipoproteins. Fibrates activate peroxisome proliferator-activated receptors (PPARs), enhancing lipid metabolism and decreasing triglyceride levels. In addition, several novel therapeutic targets—such as apolipoprotein C3 and C2 inhibition, angiopoietin-like protein inhibition, and fibroblast growth factor analogs—emerge as promising future strategies for lowering triglycerides (8, 177).
In summary, our findings suggest that TG and TG-related indices have a strong impact on the development of T2DM. These metrics offer the advantage of being inexpensive and readily accessible; TG levels can be measured with routine blood tests, and other indices can be easily calculated using laboratory parameters. Although further research is warranted to explore their role in predicting T2DM, these markers hold promise for both healthcare systems and patients. Interventions targeting these pathways and the reduction of TG levels—such as dietary modifications, lifestyle interventions, or pharmacological agents such as fibrates—may mitigate the risk of elevated TG levels and, thus, also play a role in reducing T2DM risk.
Strengths and limitations
The strengths of our research include the transparent methodology, the large number of patients, and the fact that we were also able to analyze different TG levels and TG-related indices as well. One of our limitations related to generalization is the high heterogeneity. Our research aimed to examine the impact of TG on the development of T2DM, with an emphasis on the exclusion of both diabetic and prediabetic populations. However, most included studies lacked this distinction, which prevents separate analyses. Owing to the limited number of studies, publication bias and influence assessment of individual studies are of limited diagnostic value.
Implications for practice and research
Our research provides valuable insights with the potential to influence everyday clinical practices. As a result, it aligns with the principles of translational medicine, bridging the gap between scientific discovery and practical implementation (178, 179). Our results emphasize the importance of regular monitoring of accessible laboratory markers. On the basis of our findings, we recommend follow-ups to patients with elevated triglyceride levels and waist circumference to prevent diabetes. Further research should focus on effective lifestyle strategies to reduce TG levels and combat central obesity. Preventive programs are crucial to reducing the prevalence of chronic disease, and future studies should validate these markers in different populations and integrate them into risk guidelines for T2DM.
Conclusion
HTG is a dose-dependent risk factor for T2DM. Elevated waist circumference may play an even more important role in the development of T2DM than HTG. Both high TG-HDL-C ratio and high TyG index may be predictors of T2DM.
Data availability statement
The original contributions presented in the study are included in the article/Supplementary Material. Further inquiries can be directed to the corresponding author.
Author contributions
LH: Conceptualization, Methodology, Project administration, Writing – original draft. ES: Methodology, Writing – review & editing. MO: Methodology, Writing – review & editing. DD: Data curation, Writing – review & editing. DV: Data curation, Formal Analysis, Writing – review & editing. TK: Data curation, Formal Analysis, Writing – review & editing. ES: Writing – review & editing. SV: Writing – review & editing. PH: Writing – review & editing. MB: Data curation, Writing – review & editing. AM: Data curation, Writing – review & editing. KV: Data curation, Writing – review & editing. PH: Conceptualization, Supervision, Writing – review & editing. AS: Conceptualization, Supervision, Writing – original draft.
Funding
The author(s) declare financial support was received for the research and/or publication of this article. The project was supported by the Centre for Translational Medicine, Semmelweis University, Hungarian Ministry of Innovation and Technology, National Research, Development and Innovation Fund (TKP2021-EGA-23 to Péter Hegyi), NKFIH project grants K131996 and K147265 (to Péter Hegyi), the University of Pécs Medical School Research Fund (300909 to Andrea Szentesi), and EKÖP-2024–11 New National Excellence Program of the Ministry for Culture and Innovation from the source of the National Research, Development and Innovation Fund (to Szilárd Váncsa). The sponsors had no role in the design, data collection, analysis, interpretation, and manuscript preparation.
Conflict of interest
The authors declare that the research was conducted in the absence of any commercial or financial relationships that could be construed as a potential conflict of interest.
Generative AI statement
The author(s) declare that no Generative AI was used in the creation of this manuscript.
Any alternative text (alt text) provided alongside figures in this article has been generated by Frontiers with the support of artificial intelligence and reasonable efforts have been made to ensure accuracy, including review by the authors wherever possible. If you identify any issues, please contact us.
Publisher’s note
All claims expressed in this article are solely those of the authors and do not necessarily represent those of their affiliated organizations, or those of the publisher, the editors and the reviewers. Any product that may be evaluated in this article, or claim that may be made by its manufacturer, is not guaranteed or endorsed by the publisher.
Supplementary material
The Supplementary Material for this article can be found online at: https://www.frontiersin.org/articles/10.3389/fendo.2025.1710007/full#supplementary-material
References
1. Federation ID. IDF Diabetes Atlas (2021). Brussels, Belgium. Available online at: https://www.diabetesatlas.org (Accessed December 15, 2024).
2. Ong KL, Stafford LK, McLaughlin SA, Boyko EJ, Vollset SE, Smith AE, et al. Global, regional, and national burden of diabetes from 1990 to 2021, with projections of prevalence to 2050: a systematic analysis for the Global Burden of Disease Study 2021. Lancet. (2023) 402:203–34. doi: 10.1016/S0140-6736(23)01301-6
3. Chen CL, Liu L, Lo K, Huang JY, Yu YL, Huang YQ, et al. Association between triglyceride glucose index and risk of new-onset diabetes among Chinese adults: findings from the China health and retirement longitudinal study. Front Cardiovasc Med. (2020) 7. doi: 10.3389/fcvm.2020.610322
4. Steinbrecher A, Morimoto Y, Heak S, Ollberding NJ, Geller KS, Grandinetti A, et al. The preventable proportion of type 2 diabetes by ethnicity: the multiethnic cohort. Ann Epidemiol. (2011) 21:526–35. doi: 10.1016/j.annepidem.2011.03.009
5. Saklayen MG. The global epidemic of the metabolic syndrome. Curr Hypertens Rep. (2018) 20:12. doi: 10.1007/s11906-018-0812-z
6. Galassi A, Reynolds K, and He J. Metabolic syndrome and risk of cardiovascular disease: a meta-analysis. Am J Med. (2006) 119:812–9. doi: 10.1016/j.amjmed.2006.02.031
7. Grundy SM. Hypertriglyceridemia, atherogenic dyslipidemia, and the metabolic syndrome. Am J Cardiol. (1998) 81:18b–25b. doi: 10.1016/S0002-9149(98)00033-2
8. Scicchitano P, Amati F, Ciccone MM, D’Ascenzi F, Imbalzano E, Liga R, et al. Hypertriglyceridemia: molecular and genetic landscapes. Int J Mol Sci. (2024) 25:6364. doi: 10.3390/ijms25126364
9. de Pretis N, Amodio A, and Frulloni L. Hypertriglyceridemic pancreatitis: Epidemiology, pathophysiology and clinical management. U Eur Gastroenterol J. (2018) 6:649–55. doi: 10.1177/2050640618755002
10. Burchfiel CM, Curb JD, Rodriguez BL, Yano K, Hwang LJ, Fong KO, et al. Incidence and predictors of diabetes in Japanese-American men the Honolulu heart program. Ann Epidemiol. (1995) 5:33–43. doi: 10.1016/1047-2797(94)00038-U
11. Harati H, Hadaegh F, Saadat N, and Azizi F. Population-based incidence of type 2 diabetes and its associated risk factors: results from a six-year cohort study in Iran. BMC Public Health. (2009) 9:186. doi: 10.1186/1471-2458-9-186
12. Zhao J, Zhang Y, Wei F, Song J, Cao Z, Chen C, et al. Triglyceride is an independent predictor of type 2 diabetes among middle-aged and older adults: a prospective study with 8-year follow-ups in two cohorts. J Trans Med. (2019) 17:403. doi: 10.1186/s12967-019-02156-3
13. Ma M, Liu H, Yu J, He S, Li P, Ma C, et al. Triglyceride is independently correlated with insulin resistance and islet beta cell function: a study in population with different glucose and lipid metabolism states. Lipids Health Disease. (2020) 19:121. doi: 10.1186/s12944-020-01303-w
14. Pranata R, Huang I, Irvan, Lim MA, and Vania R. The association between triglyceride-glucose index and the incidence of type 2 diabetes mellitus-a systematic review and dose-response meta-analysis of cohort studies. Endocrine. (2021) 74:254–62. doi: 10.1007/s12020-021-02780-4
15. Cheng C, Liu Y, Sun X, Yin Z, Li H, Zhang M, et al. Dose–response association between the triglycerides: High-density lipoprotein cholesterol ratio and type 2 diabetes mellitus risk: The rural Chinese cohort study and meta-analysis. J Diabetes. (2019) 11:183–92. doi: 10.1111/1753-0407.12836
16. Han KJ, Lee SY, Kim NH, Chae HB, Lee TH, Jang CM, et al. Increased risk of diabetes development in subjects with the hypertriglyceridemic waist phenotype: a 4-year longitudinal study. Endocrinol Metab (Seoul). (2014) 29:514–21. doi: 10.3803/EnM.2014.29.4.514
17. Low S, Khoo KCJ, Irwan B, Sum CF, Subramaniam T, Lim SC, et al. The role of triglyceride glucose index in development of Type 2 diabetes mellitus. Diabetes Res Clin Pract. (2018) 143:43–9. doi: 10.1016/j.diabres.2018.06.006
18. Wang Z, Zhao L, and He S. Triglyceride–glucose index as predictor for future type 2 diabetes mellitus in a Chinese population in southwest China: a 15-year prospective study. Endocrine. (2021) 72:124–31. doi: 10.1007/s12020-020-02589-7
19. Song B, Wang K, Lu W, Zhao X, Yao T, Liu T, et al. A U-shaped association between the triglyceride to high-density lipoprotein cholesterol ratio and the risk of incident type 2 diabetes mellitus in Japanese men with normal glycemic levels: a population-based longitudinal cohort study. Front Endocrinol (Lausanne). (2023) 14:1180910. doi: 10.3389/fendo.2023.1180910
20. Kosmas CE, Rodriguez Polanco S, Bousvarou MD, Papakonstantinou EJ, Peña Genao E, Guzman E, et al. The triglyceride/high-density lipoprotein cholesterol (TG/HDL-C) ratio as a risk marker for metabolic syndrome and cardiovascular disease. Diagnostics (Basel). (2023) 13:929. doi: 10.3390/diagnostics13050929
21. Zhang M, Gao Y, Chang H, Wang X, Liu D, Zhu Z, et al. Hypertriglyceridemic-waist phenotype predicts diabetes: a cohort study in Chinese urban adults. BMC Public Health. (2012) 12:1081. doi: 10.1186/1471-2458-12-1081
22. Ribeiro FB, de Cássia da Silva C, Vasques ACJ, Zambon MP, De Bernardi Rodrigues AM, Camilo DF, et al. Hypertriglyceridemic waist phenotype indicates insulin resistance in adolescents: validation study front hyperglycemic clamp-Brazilian Metabolic Syndrome Study (BRAMS). Diabetol Metab Syndrome. (2015) 7:A145. doi: 10.1186/1758-5996-7-S1-A145
23. Seghieri M, Tricò D, and Natali A. The impact of triglycerides on glucose tolerance: Lipotoxicity revisited. Diabetes Metab. (2017) 43:314–22. doi: 10.1016/j.diabet.2017.04.010
24. Zhu XW, Deng FY, and Lei SF. Meta-analysis of Atherogenic Index of Plasma and other lipid parameters in relation to risk of type 2 diabetes mellitus. Prim Care Diabetes. (2015) 9:60–7. doi: 10.1016/j.pcd.2014.03.007
25. Page MJ, McKenzie JE, Bossuyt PM, Boutron I, Hoffmann TC, Mulrow CD, et al. The PRISMA 2020 statement: an updated guideline for reporting systematic reviews. BMJ. (2021) 372:n71. doi: 10.1136/bmj.n71
26. Chandler J and Hopewell S. Cochrane methods–twenty years experience in developing systematic review methods. Syst Rev. (2013) 2:76. doi: 10.1186/2046-4053-2-76
27. Booth A, Clarke M, Dooley G, Ghersi D, Moher D, Petticrew M, et al. PROSPERO at one year: an evaluation of its utility. Syst Rev. (2013) 2:4. doi: 10.1186/2046-4053-2-4
28. Hegyi P and Varró A. Systems education can train the next generation of scientists and clinicians. Nat Med. (2024) 30:3399–400. doi: 10.1038/s41591-024-03315-w
29. Munn Z, Stern C, Aromataris E, Lockwood C, and Jordan Z. What kind of systematic review should I conduct? A proposed typology and guidance for systematic reviewers in the medical and health sciences. BMC Med Res Methodol. (2018) 18:5. doi: 10.1186/s12874-017-0468-4
30. Hayden JA, van der Windt DA, Cartwright JL, Côté P, and Bombardier C. Assessing bias in studies of prognostic factors. Ann Intern Med. (2013) 158:280–6. doi: 10.7326/0003-4819-158-4-201302190-00009
31. Higgins JPT and Thompson SG. Quantifying heterogeneity in a meta-analysis. Stat Med. (2002) 21:1539–58. doi: 10.1002/sim.1186
32. Harbord RM, Harris RJ, and Sterne JAC. Updated tests for small-study effects in meta-analyses. Stata J. (2009) 9:197–210. doi: 10.1177/1536867X0900900202
33. Harrer M CP, Furukawa T, and Ebert D. Doing Meta-Analysis with R: A Hands-On Guide. New York: Chapman and Hall/CRC (2021).
34. Team RC. A language and environment for statistical computing (2024). Vienna, Austria: R Foundation for Statistical Computing. Available online at: https://www.R-project.org/ (Accessed January 10, 2025).
35. Meta SG. General package for meta-analysis(2024). Available online at: https://github.com/guido-s/meta/ (Accessed January 10, 2025).
36. Cuijpers P, Furukawa T, and Ebert DD. Dmetar: Companion R Package For The Guide ‘Doing Meta-Analysis in R’ (2024). Available online at: http://dmetar.protectlab.org/ (Accessed January 10, 2025).
37. Metafor VW. Meta-analysis package for r(2024). Available online at: https://www.metafor-project.org (Accessed January 10, 2025).
38. Imamura F, Mukamal KJ, Meigs JB, Luchsinger JA, Ix JH, Siscovick DS, et al. Risk factors for type 2 diabetes mellitus preceded by β-cell dysfunction, insulin resistance, or both: The cardiovascular health study. Am J Epidemiol. (2013) 177(12):1418–29. doi: 10.1093/aje/kws440
39. Kametani T, Koshida H, Nagaoka T, and Miyakoshi H. Hypertriglyceridemia is an independent risk factor for development of impaired fasting glucose and diabetes mellitus: A 9-year longitudinal study in Japanese. Internal Med. (2002) 41:516–21. doi: 10.2169/internalmedicine.41.516
40. Lee MK, Han K, Kim MK, Koh ES, Kim ES, Nam GE, et al. Combinations of metabolic syndrome components and the risk of type 2 diabetes mellitus: A nationwide cohort study. Diabetes Res Clin Pract. (2020) 165:108237. doi: 10.1016/j.diabres.2020.108237
41. Lin SX, Berlin I, Younge R, Jin Z, Sibley CT, Schreiner P, et al. Does elevated plasma triglyceride level independently predict impaired fasting glucose? the Multi-Ethnic Study of Atherosclerosis (MESA). Diabetes Care. (2013) 36:342–7. doi: 10.2337/dc12-0355
42. Stringhini S, Tabak AG, Akbaraly TN, Sabia S, Shipley MJ, Marmot MG, et al. Contribution of modifiable risk factors to social inequalities in type 2 diabetes: Prospective Whitehall II cohort study. BMJ (Online). (2012) 345:e5452. doi: 10.1136/bmj.e5452
43. Xu M, Huang M, Qiang D, Gu J, Li Y, Pan Y, et al. Hypertriglyceridemic waist phenotype and lipid accumulation product: Two comprehensive obese indicators of waist circumference and triglyceride to predict type 2 diabetes mellitus in Chinese population. J Diabetes Res. (2020) 2020:9157430. doi: 10.1155/2020/9157430
44. Yoshimoto M, Sakuma Y, Ogino J, Iwai R, Watanabe S, Inoue T, et al. Sex differences in predictive factors for onset of type 2 diabetes in Japanese individuals: A 15-year follow-up study. J Diabetes Invest. (2023) 14:37–47. doi: 10.1111/jdi.13918
45. Zhang M, Zhou J, Liu Y, Sun X, Luo X, Han C, et al. Risk of type 2 diabetes mellitus associated with plasma lipid levels: The rural Chinese cohort study. Diabetes Res Clin Practice. (2018) 135:150–7. doi: 10.1016/j.diabres.2017.11.011
46. Zhang H, Wang C, Ren Y, Wang B, Yang X, Zhao Y, et al. A risk-score model for predicting risk of type 2 diabetes mellitus in a rural Chinese adult population: A cohort study with a 6-year follow-up. Diabetes/Metabolism Res Rev. (2017) 33:e2911. doi: 10.1002/dmrr.2911
47. Beshara A, Cohen E, Goldberg E, Lilos P, Garty M, and Krause I. Triglyceride levels and risk of type 2 diabetes mellitus: A longitudinal large study. J Invest Med. (2016) 64:383–7. doi: 10.1136/jim-2015-000025
48. Charoensri S, Turnsaket S, and Pongchaiyakul C. Hypertriglyceridemia as an independent predictor for ten-year incidence of diabetes in thais. Vasc Health Risk Management. (2021) 17:519–25. doi: 10.2147/VHRM.S326500
49. Garbuzova EV, Shcherbakova LV, Rymar OD, Khudiakova AD, Shramko VS, and Ragino YI. Triglycerides, obesity and education status are associated with the risk of developing type 2 diabetes in young adults, cohort study. J Personalized Med. (2023) 13:1403. doi: 10.3390/jpm13091403
50. Liu L, Guan X, Yuan Z, Zhao M, Li Q, Zhang X, et al. Different contributions of dyslipidemia and obesity to the natural history of type 2 diabetes: 3-year cohort study in China. J Diabetes Res. (2019) 2019:4328975. doi: 10.1155/2019/4328975
51. Liu M, Pan C, and Jin M. A Chinese diabetes risk score for screening of undiagnosed diabetes and abnormal glucose tolerance. Diabetes Technol Ther. (2011) 13:501–7. doi: 10.1089/dia.2010.0106
52. Marott SCW, Nordestgaard BG, Tybjaerg-Hansen A, and Benn M. Components of the metabolic syndrome and risk of type 2 diabetes. J Clin Endocrinol Metab. (2016) 101:3212–21. doi: 10.1210/jc.2015-3777
53. Nishikawa T, Okamura T, Shima A, Kawatsu Y, Sugiyama D, Kadota A, et al. Casual serum triglyceride as a predictor of premature type 2 diabetes mellitus: an 8-year cohort study of middle-aged Japanese workers. Diabetol Int. (2016) 7:252–8. doi: 10.1007/s13340-015-0241-z
54. Norberg M, Eriksson JW, Lindahl B, Andersson C, Rolandsson O, Stenlund H, et al. A combination of HbA1c, fasting glucose and BMI is effective in screening for individuals at risk of future type 2 diabetes: OGTT is not needed. J Internal Med. (2006) 260:263–71. doi: 10.1111/j.1365-2796.2006.01689.x
55. Sadeghi M, Talaei M, Parvaresh Rizi E, Dianatkhah M, Oveisgharan S, and Sarrafzadegan N. Determinants of incident prediabetes and type 2 diabetes in a 7-year cohort in a developing country: the Isfahan Cohort Study. J diabetes. (2015) 7:633–41. doi: 10.1111/1753-0407.12236
56. Wang W, Liu J, Sun JY, Wang M, Liu J, Qi Y, et al. The association between the changes in triglyceride levels and the risk of incident type 2 diabetes mellitus: a 15 years followed-up results from the Chinese Multi-provincial Cohort Study. Zhonghua nei ke za zhi [Chinese J Internal medicine]. (2012) 51:516–9.
57. Wannamethee SG, Papacosta O, Whincup PH, Thomas MC, Carson C, Lawlor DA, et al. The potential for a two-stage diabetes risk algorithm combining non-laboratory-based scores with subsequent routine non-fasting blood tests: results from prospective studies in older men and women. Diabetes Med. (2011) 28:23–30. doi: 10.1111/j.1464-5491.2010.03171.x
58. Anjana RM, Shanthi Rani CS, Deepa M, Pradeepa R, Sudha V, Divya Nair H, et al. Incidence of diabetes and prediabetes and predictors of progression among Asian Indians: 10-year follow-up of the chennai urban rural epidemiology study (CURES). Diabetes Care. (2015) 38:1441–8. doi: 10.2337/dc14-2814
59. Boyko EJ, De Courten M, Zimmet PZ, Chitson P, Tuomilehto J, and Alberti KGMM. Features of the metabolic syndrome predict higher risk of diabetes and impaired glucose tolerance: A prospective study in Mauritius. Diabetes Care. (2000) 23:1242–8. doi: 10.2337/diacare.23.9.1242
60. Chamroonkiadtikun P, Ananchaisarp T, and Wanichanon W. The triglyceride-glucose index, a predictor of type 2 diabetes development: A retrospective cohort study. Primary Care Diabetes. (2020) 14:161–7. doi: 10.1016/j.pcd.2019.08.004
61. Chen N, Hu LK, Sun Y, Dong J, Chu X, Lu YK, et al. Associations of waist-to-height ratio with the incidence of type 2 diabetes and mediation analysis: Two independent cohort studies. Obes Res Clin Practice. (2023) 17:9–15. doi: 10.1016/j.orcp.2022.12.005
62. Chen N, Muhammad IF, Li Z, Nilsson PM, and Borné Y. Sex-specific associations of circulating uric acid with risk of diabetes incidence: A population-based cohort study from Sweden. Diabetes Metab Syndrome Obes. (2020) 13:4323–31. doi: 10.2147/DMSO.S273387
63. Dotevall A, Johansson S, Wilhelmsen L, and Rosengren A. Increased levels of triglycerides, BMI and blood pressure and low physical activity increase the risk of diabetes in Swedish women. A prospective 18-year follow-up of the BEDA study. Diabetic Med. (2004) 21:615–22. doi: 10.1111/j.1464-5491.2004.01189.x
64. Fujihara K, Sugawara A, Heianza Y, Sairenchi T, Irie F, Iso H, et al. Utility of the triglyceride level for predicting incident diabetes mellitus according to the fasting status and body mass index category: the Ibaraki Prefectural Health Study. J Atheroscler Thromb. (2014) 21:1152–69. doi: 10.5551/jat.22913
65. González-Villalpando C, Dávila-Cervantes CA, Zamora-Macorra M, Trejo-Valdivia B, and González-Villalpando ME. Risk factors associated to diabetes in Mexican population and phenotype of the individuals who will convert to diabetes. Salud Publica Mex. (2014) 56:317–22. doi: 10.21149/spm.v56i4.7351
66. He S, Wang S, Chen X, Jiang L, Peng Y, Li L, et al. Higher ratio of triglyceride to high-density lipoprotein cholesterol may predispose to diabetes mellitus: 15-year prospective study in a general population. Metabolism: Clin Experimental. (2012) 61:30–6. doi: 10.1016/j.metabol.2011.05.007
67. Hu H, Wang J, Han X, Li Y, Miao X, Yuan J, et al. Prediction of 5-year risk of diabetes mellitus in relatively low risk middle-aged and elderly adults. Acta Diabetologica. (2020) 57:63–70. doi: 10.1007/s00592-019-01375-w
68. Hulsegge G, Spijkerman AMW, van der Schouw YT, Bakker SJL, Gansevoort RT, Smit HA, et al. Trajectories of metabolic risk factors and biochemical markers prior to the onset of type 2 diabetes: The population-based longitudinal Doetinchem study. Nutr Diabetes. (2017) 7:e270. doi: 10.1038/nutd.2017.23
69. Hwang YC, Ahn HY, Park SW, and Park CY. Apolipoprotein B and non-HDL cholesterol are more powerful predictors for incident type 2 diabetes than fasting glucose or glycated hemoglobin in subjects with normal glucose tolerance: a 3.3-year retrospective longitudinal study. Acta Diabetologica. (2014) 51:941–6. doi: 10.1007/s00592-014-0587-x
70. Jeong JY, Kim JG, Kim BW, Moon SS, Kim HS, Park KG, et al. Trend analysis of diabetic prevalence and incidence in a rural area of South Korea between 2003-2008. J Diabetes Invest. (2010) 1:184–90. doi: 10.1111/j.2040-1124.2010.00045.x
71. Ley SH, Harris SB, Connelly PW, Mamakeesick M, Gittelsohn J, Wolever TM, et al. Utility of non-high-density lipoprotein cholesterol in assessing incident type 2 diabetes risk. Diabetes Obes Metab. (2012) 14:821–5. doi: 10.1111/j.1463-1326.2012.01607.x
72. Lu J, ManLam S, Wan Q, Shi L, Huo Y, Chen L, et al. High-coverage targeted lipidomics reveals novel serum lipid predictors and lipid pathway dysregulation antecedent to type 2 diabetes onset in normoglycemic Chinese adults. Diabetes Care. (2019) 42:2117–26. doi: 10.2337/dc19-0100
73. Mackey RH, Mora S, Bertoni AG, Wassel CL, Carnethon MR, Sibley CT, et al. Lipoprotein particles and incident type 2 diabetes in the multi-ethnic study of atherosclerosis. Diabetes Care. (2015) 38:628–36. doi: 10.2337/dc14-0645
74. Malmström H, Walldius G, Carlsson S, Grill V, Jungner I, Gudbjörnsdottir S, et al. Elevations of metabolic risk factors 20 years or more before diagnosis of type 2 diabetes: Experience from the AMORIS study. Diabetes Obes Metab. (2018) 20:1419–26. doi: 10.1111/dom.13241
75. Mustafina SV, Rymar OD, Shcherbakova LV, Verevkin EG, Pikhart H, Sazonova OV, et al. The risk of type 2 diabetes mellitus in a Russian population cohort according to data from the hapiee project. J Personalized Med. (2021) 11:1–15. doi: 10.3390/jpm11020119
76. Okada K, Furusyo N, Sawayama Y, Kanamoto Y, Murata M, and Hayashi J. Prevalence and risk factors for diabetes: a ten year follow-up study of the Yaeyama district of Okinawa. Fukuoka igaku zasshi = Hukuoka Acta medica. (2010) 101:215–24. doi: 10.1016/S1567-5688(10)70786-8
77. Onat A, Hergenç G, Uyarel H, Can G, and Özhan H. Prevalence, incidence, predictors and outcome of type 2 diabetes in Turkey. Anadolu Kardiyoloji Dergisi. (2006) 6:314–21.
78. Pang X, Yang S, Guo X, Li H, Zhang Y, Wei C, et al. The association and mediating biomarkers of serum retinol in influencing the development of type 2 diabetes: A prospective cohort study in middle-aged and elderly population. Front Nutr. (2022) 9:831950. doi: 10.3389/fnut.2022.831950
79. Pencina KM, Pencina MJ, Dufresne L, Holmes M, Thanassoulis G, and Sniderman AD. An adverse lipoprotein phenotype—hypertriglyceridaemic hyperapolipoprotein B—and the long-term risk of type 2 diabetes: a prospective, longitudinal, observational cohort study. Lancet Healthy Longevity. (2022) 3:e339–e46. doi: 10.1016/S2666-7568(22)00079-4
80. Rathmann W, Strassburger K, Heier M, Holle R, Thorand B, Giani G, et al. Incidence of type 2 diabetes in the elderly German population and the effect of clinical and lifestyle risk factors: KORA S4/F4 cohort study. Diabetic Med. (2009) 26:1212–9. doi: 10.1111/j.1464-5491.2009.02863.x
81. Rong L, Hou N, Hu J, Gong Y, Yan S, Li C, et al. The role of TyG index in predicting the incidence of diabetes in Chinese elderly men: a 20-year retrospective study. Front Endocrinol. (2023) 14. doi: 10.3389/fendo.2023.1191090
82. Sans S, Padró T, Tuomilehto J, and Badimon L. Incidence of diabetes and serum adipokines in Catalonian men: the ADIPOCAT study. Ann Med. (2013) 45:97–102. doi: 10.3109/07853890.2012.679958
83. Wang TT, Lin B, Cui WX, Zhang MZ, Zhang YH, and Zhang SY. Clustering of cardiovascular risk factors and diabetes: A prospective cohort study on the inner Mongolian population in China. Biomed Environ sciences: BES. (2018) 31:749–56. doi: 10.3967/bes2018.100
84. Wu X, Yu Z, Su W, Isquith DA, Neradilek MB, Lu N, et al. Low levels of ApoA1 improve risk prediction of type 2 diabetes mellitus. J Clin Lipidol. (2017) 11:362–8. doi: 10.1016/j.jacl.2017.01.009
85. Abbasi A, Corpeleijn E, Gansevoort RT, Gans ROB, Hillege HL, Stolk RP, et al. Role of HDL cholesterol and estimates of HDL particle composition in future development of type 2 diabetes in the general population: The PREVEND study. J Clin Endocrinol Metab. (2013) 98:E1352–E9. doi: 10.1210/jc.2013-1680
86. Duan MJ, Dekker LH, Carrero JJ, and Navis G. Using structural equation modeling to untangle pathways of risk factors associated with incident type 2 diabetes: the lifelines cohort study. Prev Sci. (2022) 23:1090–100. doi: 10.1007/s11121-022-01357-5
87. Freeman DJ, Norrie J, Caslake MJ, Gaw A, Ford I, Lowe GDO, et al. C-reactive protein is an independent predictor of risk for the development of diabetes in the west of Scotland coronary prevention study. Diabetes. (2002) 51:1596–600. doi: 10.2337/diabetes.51.5.1596
88. Gagnon C, Lu ZX, Magliano DJ, Dunstan DW, Shaw JE, Zimmet PZ, et al. Serum 25-hydroxyvitamin D, calcium intake, and risk of type 2 diabetes after 5 years: Results from a national, population-based prospective study (the Australian diabetes, obesity and lifestyle study). Diabetes Care. (2011) 34:1133–8. doi: 10.2337/dc10-2167
89. Gong R, Liu Y, Luo G, Liu W, Jin Z, Xu Z, et al. Associations of TG/HDL ratio with the risk of prediabetes and diabetes in Chinese adults: A Chinese population cohort study based on open data. Int J Endocrinol. (2021) 2021:9949579. doi: 10.1155/2021/9949579
90. Hadaegh F, Hatami M, Tohidi M, Sarbakhsh P, Saadat N, and Azizi F. Lipid ratios and appropriate cut off values for prediction of diabetes: A cohort of Iranian men and women. Lipids Health Dis. (2010) 9:85. doi: 10.1186/1476-511X-9-85
91. Hodge AM, Jenkins AJ, English DR, O’Dea K, and Giles GG. NMR-determined lipoprotein subclass profile predicts type 2 diabetes. Diabetes Res Clin Practice. (2009) 83:132–9. doi: 10.1016/j.diabres.2008.11.007
92. Ichikawa T, Okada H, Hamaguchi M, Kurogi K, Murata H, Ito M, et al. Estimated small dense low-density lipoprotein-cholesterol and incident type 2 diabetes in Japanese people: Population-based Panasonic cohort study 13. Diabetes Res Clin Pract. (2023) 199:110665. doi: 10.1016/j.diabres.2023.110665
93. Jacobsen BK, Bonaa KH, and Njolstad I. Cardiovascular risk factors, change in risk factors over 7 years, and the risk of clinical diabetes mellitus type 2: The Tromsø study. J Clin Epidemiol. (2002) 55:647–53. doi: 10.1016/S0895-4356(02)00404-3
94. Joseph J, Svartberg J, Njølstad I, and Schirmer H. Incidence of and risk factors for type-2 diabetes in a general population: the Tromsø Study. Scandinavian J Public Health. (2010) 38:768–75. doi: 10.1177/1403494810380299
95. Khaloo P, Hasheminia M, Tohidi M, Abdi H, Mansournia MA, Azizi F, et al. Impact of 3-year changes in lipid parameters and their ratios on incident type 2 diabetes: Tehran lipid and glucose study. Nutr Metab. (2018) 15:50. doi: 10.1186/s12986-018-0287-6
96. Kim J, Shin SJ, Kim YS, and Kang HT. Positive association between the ratio of triglycerides to high-density lipoprotein cholesterol and diabetes incidence in Korean adults. Cardiovasc Diabetol. (2021) 20:183. doi: 10.1186/s12933-021-01377-5
97. Li L, Wang Z, Zhang M, Ruan H, Zhou L, Wei X, et al. New risk score model for identifying individuals at risk for diabetes in southwest China. Prev Med Rep. (2021) 24101618. doi: 10.1016/j.pmedr.2021.101618
98. Lim NK, Park SH, Choi SJ, Lee KS, and Park HY. A risk score for predicting the incidence of type 2 diabetes in a middle-aged Korean cohort: the Korean genome and epidemiology study. Circ J. (2012) 76:1904–10. doi: 10.1253/circj.CJ-11-1236
99. Martínez-Hervás S, Morales-Suarez-Varela MM, Andrés-Blasco I, Lara-Hernández F, Peraita-Costa I, Real JT, et al. Developing a simple and practical decision model to predict the risk of incident type 2 diabetes among the general population: TheRGlAYmV0LmVzStudy. Eur J Internal Med. (2022) 102:80–7. doi: 10.1016/j.ejim.2022.05.005
100. Ohlson LO, Larsson B, Bjorntorp P, Eriksson H, Svardsudd K, Welin L, et al. Risk factors for Type 2 (non-insulin-dependent) diabetes mellitus. Thirteen and one-half years of follow-up of the participants in a study of Swedish men born in 1913. Diabetologia. (1988) 31:798–805. doi: 10.1007/BF00277480
101. Riediger ND, Clark K, Lukianchuk V, Roulette J, and Bruce S. Fasting triglycerides as a predictor of incident diabetes, insulin resistance and β-cell function in a Canadian First Nation. Int J circumpolar Health. (2017) 76:1310444. doi: 10.1080/22423982.2017.1310444
102. Sheng G, Kuang M, Yang R, Zhong Y, Zhang S, and Zou Y. Evaluation of the value of conventional and unconventional lipid parameters for predicting the risk of diabetes in a non-diabetic population. J Trans Med. (2022) 20:266. doi: 10.1186/s12967-022-03470-z
103. Tanaka SI, Fujioka Y, Tsujino T, Ishida T, and Hirata KI. Impact of serum cholesterol esterification rates on the development of diabetes mellitus in a general population. Lipids Health Dis. (2018) 17:180. doi: 10.1186/s12944-018-0822-5
104. Vol S, Balkau B, Lange C, Cailleau M, Cogneau J, Lantieri O, et al. Who should be screened for type 2 diabetes in France? A predictive score from the D.E.S.I.R. prospective study. Medecine Des Maladies Metaboliques. (2009) 3:198–202. doi: 10.1016/S1957-2557(09)71645-1
105. Wang Y, Koh WP, Sim X, Yuan JM, and Pan A. Multiple biomarkers improved prediction for the risk of type 2 diabetes mellitus in Singapore Chinese men and women. Diabetes Metab J. (2019) 43:295–306. doi: 10.4093/dmj.2019.0020
106. Wang YL, Koh WP, Talaei M, Yuan JM, and Pan A. Association between the ratio of triglyceride to high-density lipoprotein cholesterol and incident type 2 diabetes in Singapore Chinese men and women. J Diabetes. (2017) 9:689–98. doi: 10.1111/1753-0407.12477
107. Wang Z, He S, and Chen X. Capacity of different anthropometric measures to predict diabetes in a Chinese population in southwest China: a 15-year prospective study. Diabetic Med. (2019) 36:1261–7. doi: 10.1111/dme.14055
108. Yang XY, Zhang M, Luo XP, Wang JJ, Yin L, Pang C, et al. Body mass index, waist circumference and waist-to-height ratio associated with the incidence of type 2 diabetes mellitus: a cohort study. Zhonghua yu fang yi xue za zhi [Chinese J Prev medicine]. (2016) 50:328–33. doi: 10.3760/cma.j.issn.0253-9624.2016.04.009
109. Orisaka M, Nakai K, Tominaga M, and Suwabe A. Risk factors for development of pre-diabetic state from normal glucose regulation. Tohoku J Exp Med. (2006) 210:279–83. doi: 10.1620/tjem.210.279
110. Wang Y, Wang L, Su Y, Zhong L, and Peng B. Prediction model for the onset risk of impaired fasting glucose: a 10-year longitudinal retrospective cohort health check-up study. BMC Endocrine Disord. (2021) 21:211. doi: 10.1186/s12902-021-00878-4
111. Nichols GA, Hillier TA, and Brown JB. Normal fasting plasma glucose and risk of type 2 diabetes diagnosis. Am J Med. (2008) 121:519–24. doi: 10.1016/j.amjmed.2008.02.026
112. Qin H, Chen Z, Zhang Y, Wang L, Ouyang P, Cheng L, et al. Triglyceride to high-density lipoprotein cholesterol ratio is associated with incident diabetes in men: A retrospective study of Chinese individuals. J Diabetes Invest. (2020) 11:192–8. doi: 10.1111/jdi.13087
113. Skretteberg PT, Grytten AN, Gjertsen K, Grundvold I, Kjeldsen SE, Erikssen J, et al. Triglycerides-diabetes association in healthy middle-aged men: modified by physical fitness? A long term follow-up of 1962 Norwegian men in the Oslo Ischemia Study. Diabetes Res Clin Pract. (2013) 101:201–9. doi: 10.1016/j.diabres.2013.06.001
114. Yuge H, Okada H, Hamaguchi M, Kurogi K, Murata H, Ito M, et al. Triglycerides/HDL cholesterol ratio and type 2 diabetes incidence: Panasonic Cohort Study 10. Cardiovasc Diabetol. (2023) 22:308. doi: 10.1186/s12933-023-02046-5
115. Carvalho LSF, Benseñor IM, Nogueira ACC, Duncan BB, Schmidt MI, Blaha MJ, et al. Increased particle size of triacylglycerol-enriched remnant lipoproteins, but not their plasma concentration or lipid content, augments risk prediction of incident type 2 diabetes. Diabetologia. (2021) 64:385–96. doi: 10.1007/s00125-020-05322-1
116. Ley SH, Harris SB, Connelly PW, Mamakeesick M, Gittelsohn J, Wolever TM, et al. Association of apolipoprotein B with incident type 2 diabetes in an aboriginal Canadian population. Clin Chem. (2010) 56:666–70. doi: 10.1373/clinchem.2009.136994
117. Seo MH, Bae JC, Park SE, Rhee EJ, Park CY, Oh KW, et al. Association of lipid and lipoprotein profiles with future development of type 2 diabetes in nondiabetic Korean subjects: A 4-year retrospective, longitudinal study. J Clin Endocrinol Metab. (2011) 96:E2050–E4. doi: 10.1210/jc.2011-1857
118. Sung J, Lee K, Song YM, Lee M, and Kim J. Genetic and baseline metabolic factors for incident diabetes and HbA1c at follow-up: The healthy twin study. Diabetes/Metabolism Res Rev. (2015) 31:376–84. doi: 10.1002/dmrr.2619
119. Wang K, Gong M, Xie S, Zhang M, Zheng H, Zhao XF, et al. Nomogram prediction for the 3-year risk of type 2 diabetes in healthy mainland China residents. EPMA J. (2019) 10:227–37. doi: 10.1007/s13167-019-00181-2
120. Janghorbani M and Amini M. Utility of serum lipid ratios for predicting incident type 2 diabetes: the Isfahan Diabetes Prevention Study. Diabetes Metab Res Rev. (2016) 32:572–80. doi: 10.1002/dmrr.2770
121. Li X, Xue Y, Dang Y, Liu W, Wang Q, Zhao Y, et al. Association of non-insulin-based insulin resistance indices with risk of incident prediabetes and diabetes in a Chinese rural population: A 12-year prospective study. Diabetes Metab Syndrome Obes. (2022) 15:3809–19. doi: 10.2147/DMSO.S385906
122. Lim TK, Lee HS, and Lee YJ. Triglyceride to HDL-cholesterol ratio and the incidence risk of type 2 diabetes in community dwelling adults: A longitudinal 12-year analysis of the Korean Genome and Epidemiology Study. Diabetes Res Clin Practice. (2020) 163:108150. doi: 10.1016/j.diabres.2020.108150
123. Liu H, Liu J, Liu J, Xin S, Lyu Z, and Fu X. Triglyceride to high-density lipoprotein cholesterol (TG/HDL-C) ratio, a simple but effective indicator in predicting type 2 diabetes mellitus in older adults. Front Endocrinol. (2022) 13. doi: 10.3389/fendo.2022.828581
124. Sung KC, Park HY, Kim MJ, and Reaven G. Metabolic markers associated with insulin resistance predict type 2 diabetes in Koreans with normal blood pressure or prehypertension. Cardiovasc Diabetol. (2016) 15:47. doi: 10.1186/s12933-016-0368-7
125. Tohidi M, Asgari S, Chary A, Safiee S, Azizi F, and Hadaegh F. Association of triglycerides to high-density lipoprotein cholesterol ratio to identify future prediabetes and type 2 diabetes mellitus: over one-decade follow-up in the Iranian population. Diabetol Metab Syndrome. (2023) 15:13. doi: 10.1186/s13098-023-00988-0
126. Zheng D, Li H, Ai F, Sun F, Singh M, Cao X, et al. Association between the triglyceride to high-density lipoprotein cholesterol ratio and the risk of type 2 diabetes mellitus among Chinese elderly: The Beijing Longitudinal Study of Aging. BMJ Open Diabetes Res Care. (2020) 8. doi: 10.1136/bmjdrc-2019-000811
127. Wang B, Zhang M, Liu Y, Sun X, Zhang L, Wang C, et al. Utility of three novel insulin resistance-related lipid indices for predicting type 2 diabetes mellitus among people with normal fasting glucose in rural China. J Diabetes. (2018) 10:641–52. doi: 10.1111/1753-0407.12642
128. Chen Z, Hu H, Chen M, Luo X, Yao W, Liang Q, et al. Association of Triglyceride to high-density lipoprotein cholesterol ratio and incident of diabetes mellitus: A secondary retrospective analysis based on a Chinese cohort study. Lipids Health Dis. (2020) 19:33. doi: 10.1186/s12944-020-01213-x
129. He K, Zhang W, Hu X, Zhao H, Song R, Bai K, et al. Stronger associations of body mass index and waist circumference with diabetes than waist-height ratio and triglyceride glucose index in the middle-aged and elderly population: A retrospective cohort study. J Diabetes Res. (2022) 2022:9982390. doi: 10.1155/2022/9982390
130. Lee DY, Lee ES, Kim JH, Park SE, Park CY, Oh KW, et al. Predictive value of triglyceride glucose index for the risk of incident diabetes: A 4-year retrospective longitudinal study. PloS One. (2016) 11:e0163465. doi: 10.1371/journal.pone.0163465
131. Navarro-González D, Sánchez-Íñigo L, Pastrana-Delgado J, Fernández-Montero A, and Martinez JA. Triglyceride-glucose index (TyG index) in comparison with fasting plasma glucose improved diabetes prediction in patients with normal fasting glucose: The Vascular-Metabolic CUN cohort. Prev Med. (2016) 86:99–105. doi: 10.1016/j.ypmed.2016.01.022
132. Xuan X, Hamaguchi M, Cao Q, Okamura T, Hashimoto Y, Obora A, et al. U-shaped association between the triglyceride-glucose index and the risk of incident diabetes in people with normal glycemic level: A population-base longitudinal cohort study. Clin Nutr. (2021) 40:1555–61. doi: 10.1016/j.clnu.2021.02.037
133. Zhang M, Wang B, Liu Y, Sun X, Luo X, Wang C, et al. Cumulative increased risk of incident type 2 diabetes mellitus with increasing triglyceride glucose index in normal-weight people: The Rural Chinese Cohort Study. Cardiovasc Diabetol. (2017) 16:30. doi: 10.1186/s12933-017-0514-x
134. Kuang M, Yang R, Huang X, Wang C, Sheng G, Xie G, et al. Assessing temporal differences in the predictive power of baseline TyG-related parameters for future diabetes: an analysis using time-dependent receiver operating characteristics. J Trans Med. (2023) 21:299. doi: 10.1186/s12967-023-04159-7
135. Lee SH, Kwon HS, Park YM, Ha HS, Jeong SH, Yang HK, et al. Predicting the development of diabetes using the product of triglycerides and glucose: The chungju metabolic disease cohort (CMC) study. PloS One. (2014) 9:e90430. doi: 10.1371/journal.pone.0090430
136. Park HM, Lee HS, Lee YJ, and Lee JH. The triglyceride-glucose index is a more powerful surrogate marker for predicting the prevalence and incidence of type 2 diabetes mellitus than the homeostatic model assessment of insulin resistance. Diabetes Res Clin Pract. (2021) 180:109042. doi: 10.1016/j.diabres.2021.109042
137. Tohidi M, Baghbani-Oskouei A, Ahanchi NS, Azizi F, and Hadaegh F. Fasting plasma glucose is a stronger predictor of diabetes than triglyceride–glucose index, triglycerides/high-density lipoprotein cholesterol, and homeostasis model assessment of insulin resistance: Tehran Lipid and Glucose Study. Acta Diabetologica. (2018) 55:1067–74. doi: 10.1007/s00592-018-1195-y
138. Fu X, Liu H, Liu J, Li N, Li L, Ke D, et al. Association between triglyceride-glucose index and the risk of type 2 diabetes mellitus in an older Chinese population aged over 75 years. Front Public Health. (2021) 9:796663.
139. Asgari S, Khalili D, Azizi F, and Hadaegh F. External validation of the American prediction model for incident type 2 diabetes in the Iranian population. BMC Med Res methodol. (2023) 23:77. doi: 10.1186/s12874-023-01891-y
140. Balkau B, Lange Cl, Fezeu L, Tichet J, de Lauzon-Guillain B, Czernichow S, et al. Predicting diabetes: clinical, biological, and genetic approaches: data from the epidemiological study on the insulin resistance syndrome (DESIR). Diabetes Care. (2008) 31:2056–61. doi: 10.2337/dc08-0368
141. Mann DM, Bertoni AG, Shimbo D, Carnethon MR, Chen H, Jenny NS, et al. Comparative validity of 3 diabetes mellitus risk prediction scoring models in a multiethnic US cohort. Am J Epidemiol. (2010) 171:980–8. doi: 10.1093/aje/kwq030
142. Yatsuya H, Li Y, Hirakawa Y, Ota A, Matsunaga M, Haregot HE, et al. A point system for predicting 10-year risk of developing type 2 diabetes mellitus in Japanese men: aichi workers’ Cohort study. J Epidemiol. (2018) 28:347–52. doi: 10.2188/jea.JE20170048
143. Zhang M, Zhang H, Wang C, Ren Y, Wang B, Zhang L, et al. Development and validation of a risk-score model for type 2 diabetes: A cohort study of a rural adult Chinese population. PloS One. (2016) 11:e0152054. doi: 10.1371/journal.pone.0152054
144. Zhou F, Zhao Z, Tian L, Zheng T, Gao Y, Chen T, et al. Association of serum ferritin level with risk of incident abnormal glucose metabolism in southwestern China: a prospective cohort study. Biol Trace Element Res. (2016) 169:27–33. doi: 10.1007/s12011-015-0393-5
145. Joseph J, Svartberg J, Njølstad I, and Schirmer H. Risk factors for type 2 diabetes in groups stratified according to metabolic syndrome: a 10-year follow-up of the Tromsø Study. Eur J Epidemiol. (2011) 26:117–24. doi: 10.1007/s10654-010-9540-7
146. Ley SH, Harris SB, Connelly PW, Mamakeesick M, Gittelsohn J, Hegele RA, et al. Adipokines and incident type 2 diabetes in an Aboriginal Canadian [corrected] population: the Sandy Lake Health and Diabetes Project. Diabetes Care. (2008) 31:1410–5. doi: 10.2337/dc08-0036
147. Magliano DJ, Barr ELM, Zimmet PZ, Cameron AJ, Dunstan DW, Colagiuri S, et al. Glucose indices, health behaviors, and incidence of diabetes in Australia: The Australian diabetes, obesity and lifestyle study. Diabetes Care. (2008) 31:267–72. doi: 10.2337/dc07-0912
148. Owei I, Umekwe N, Wan J, and Dagogo-Jack S. Plasma lipid levels predict dysglycemia in a biracial cohort of nondiabetic subjects: Potential mechanisms. Exp Biol Med. (2016) 241:1961–7. doi: 10.1177/1535370216659946
149. Peng J, Zhao F, Yang X, Pan X, Xin J, Wu M, et al. Association between dyslipidemia and risk of type 2 diabetes mellitus in middle-aged and older Chinese adults: A secondary analysis of a nationwide cohort. BMJ Open. (2021) 11:e042821. doi: 10.1136/bmjopen-2020-042821
150. Perry IJ, Wannamethee SG, Walker MK, Thomson AG, Whincup PH, and Shaper AG. Prospective study of risk factors for development of non-insulin dependent diabetes in middle aged British men. Br Med J. (1995) 310:560–4. doi: 10.1136/bmj.310.6979.560
151. Saijo Y, Okada H, Hamaguchi M, Habu M, Kurogi K, Murata H, et al. The risk factors for development of type 2 diabetes: panasonic cohort study 4. Int J Environ Res Public Health. (2022) 19:571. doi: 10.3390/ijerph19010571
152. Tirosh A, Shai I, Bitzur R, Kochba I, Tekes-Manova D, Israeli E, et al. Changes in triglyceride levels over time and risk of type 2 diabetes in young men. Diabetes Care. (2008) 31:2032–7. doi: 10.2337/dc08-0825
153. Valdés S, Botas P, Delgado E, Álvarez F, and Cadórniga FD. Does the new American Diabetes Association definition for impaired fasting glucose improve its ability to predict type 2 diabetes mellitus in Spanish persons? The Asturias study. Metabolism: Clin experimental. (2008) 57:399–403. doi: 10.1016/j.metabol.2007.10.017
154. Yang W, Xing X, and Lin H. Baseline hypertriglyceridemia, a risk factor for non-insulin dependent diabetes mellitus: a 6-year follow-up study of 432 nondiabetics. Zhonghua Nei Ke Za Zhi. (1995) 34:583–6.
155. Miljkovic I, Cvejkus R, An P, Thyagarajan B, Christensen K, Wojczynski M, et al. Low risk for developing diabetes among the offspring of individuals with exceptional longevity and their spouses. Front Clin Diabetes Healthc. (2022) 3:753986. doi: 10.3389/fcdhc.2022.753986
156. Olafsdottir E, Aspelund T, Sigurdsson G, Thorsson B, Benediktsson R, Harris TB, et al. Unfavourable risk factors for type 2 diabetes mellitus are already apparent more than a decade before onset in a population-based study of older persons: From the Age, Gene/Environment Susceptibility-Reykjavik Study (AGES-Reykjavik). Eur J Epidemiol. (2009) 24:307–14. doi: 10.1007/s10654-009-9343-x
157. Valdes S, Botas P, Delgado E, Alvarez F, and Cadorniga FD. Population-based incidence of type 2 diabetes in northern Spain: the Asturias study. Diabetes Care. (2007) 30:2258–63. doi: 10.2337/dc06-2461
158. Szili-Torok T, Bakker SJL, and Tietge UJF. Normal fasting triglyceride levels and incident type 2 diabetes in the general population. Cardiovasc Diabetol. (2022) 21:111. doi: 10.1186/s12933-022-01530-8
159. Boden G. Obesity and free fatty acids. Endocrinol Metab Clin North Am. (2008) 37:635–46, viii-ix. doi: 10.1016/j.ecl.2008.06.007
160. Tenenbaum A, Klempfner R, and Fisman EZ. Hypertriglyceridemia: a too long unfairly neglected major cardiovascular risk factor. Cardiovasc Diabetol. (2014) 13:159. doi: 10.1186/s12933-014-0159-y
161. Li N, Fu J, Koonen DP, Kuivenhoven JA, Snieder H, and Hofker MH. Are hypertriglyceridemia and low HDL causal factors in the development of insulin resistance? Atherosclerosis. (2014) 233:130–8. doi: 10.1016/j.atherosclerosis.2013.12.013
162. Carlsson AC, Risérus U, and Ärnlöv J. Hypertriglyceridemic waist phenotype is associated with decreased insulin sensitivity and incident diabetes in elderly men. Obesity. (2014) 22:526–9. doi: 10.1002/oby.20434
163. Chen D, Liang Z, Sun H, Lu C, Chen W, Wang HHX, et al. Association between hypertriglyceridemic–waist phenotype and risk of type 2 diabetes mellitus in middle-aged and older chinese population: A longitudinal cohort study. Int J Environ Res Public Health. (2021) 18:9618. doi: 10.3390/ijerph18189618
164. He S, Zheng Y, Shu Y, He J, Wang Y, and Chen X. Hypertriglyceridemic waist might be an alternative to metabolic syndrome for predicting future diabetes mellitus. PloS One. (2013) 8:e73292. doi: 10.1371/journal.pone.0073292
165. Ren Y, Liu Y, Sun X, Deng K, Wang C, Li L, et al. Hypertriglyceridemia-waist and risk of developing type 2 diabetes: The Rural Chinese Cohort Study. Sci Rep. (2017) 7:9072. doi: 10.1038/s41598-017-09136-x
166. Després JP. Intra-abdominal obesity: an untreated risk factor for Type 2 diabetes and cardiovascular disease. J Endocrinol Invest. (2006) 29:77–82.
167. Freemantle N, Holmes J, Hockey A, and Kumar S. How strong is the association between abdominal obesity and the incidence of type 2 diabetes? Int J Clin Pract. (2008) 62:1391–6. doi: 10.1111/j.1742-1241.2008.01805.x
168. Liu H, Yan S, Chen G, Li B, Zhao L, Wang Y, et al. Association of the ratio of triglycerides to high-density lipoprotein cholesterol levels with the risk of type 2 diabetes: A retrospective cohort study in Beijing. J Diabetes Res. (2021) 2021:5524728. doi: 10.1155/2021/5524728
169. Shimodaira M, Minemura Y, and Nakayama T. Elevated triglyceride/high-density lipoprotein-cholesterol ratio as a risk factor for progression to prediabetes: a 5-year retrospective cohort study in Japan. J Diabetes Metab Disord. (2023) 23:655–64. doi: 10.1007/s40200-023-01329-8
170. Young KA, Maturu A, Lorenzo C, Langefeld CD, Wagenknecht LE, Chen YI, et al. The triglyceride to high-density lipoprotein cholesterol (TG/HDL-C) ratio as a predictor of insulin resistance, β-cell function, and diabetes in Hispanics and African Americans. J Diabetes Complications. (2019) 33:118–22. doi: 10.1016/j.jdiacomp.2018.10.018
171. Hwang YC, Hayashi T, Fujimoto WY, Kahn SE, Leonetti DL, McNeely MJ, et al. Differential association between HDL subclasses and the development of type 2 diabetes in a prospective study of Japanese Americans. Diabetes Care. (2015) 38:2100–5. doi: 10.2337/dc15-0625
172. Drew BG, Rye KA, Duffy SJ, Barter P, and Kingwell BA. The emerging role of HDL in glucose metabolism. Nat Rev Endocrinol. (2012) 8:237–45. doi: 10.1038/nrendo.2011.235
173. Janghorbani M, Almasi SZ, and Amini M. The product of triglycerides and glucose in comparison with fasting plasma glucose did not improve diabetes prediction. Acta Diabetol. (2015) 52:781–8. doi: 10.1007/s00592-014-0709-5
174. Lee JW, Lim NK, and Park HY. The product of fasting plasma glucose and triglycerides improves risk prediction of type 2 diabetes in middle-aged Koreans. BMC Endocr Disord. (2018) 18:33. doi: 10.1186/s12902-018-0259-x
175. Li X, Li G, Cheng T, Liu J, Song G, and Ma H. Association between triglyceride-glucose index and risk of incident diabetes: a secondary analysis based on a Chinese cohort study: TyG index and incident diabetes. Lipids Health Dis. (2020) 19:236. doi: 10.1186/s12944-020-01403-7
176. Park B, Lee HS, and Lee YJ. Triglyceride glucose (TyG) index as a predictor of incident type 2 diabetes among nonobese adults: a 12-year longitudinal study of the Korean Genome and Epidemiology Study cohort. Trans Res. (2021) 228:42–51. doi: 10.1016/j.trsl.2020.08.003
177. Filtz A, Parihar S, Greenberg GS, Park CM, Scotti A, Lorenzatti D, et al. New approaches to triglyceride reduction: Is there any hope left? Am J Prev Cardiol. (2024) 18:100648. doi: 10.1016/j.ajpc.2024.100648
178. Hegyi P, Erőss B, Izbéki F, Párniczky A, and Szentesi A. Accelerating the translational medicine cycle: the Academia Europaea pilot. Nat Med. (2021) 27:1317–9. doi: 10.1038/s41591-021-01458-8
Keywords: hypertriglyceridemia, HTG, type 2 diabetes mellitus, T2DM, risk factor
Citation: Havelda L, Szalai EÁ, Obeidat M, Dobszai D, Veres DS, Kói T, Sipter E, Váncsa S, Hegyi PJ, Bucur M, Molnár A, Vámossy KL, Hegyi P and Szentesi A (2025) Hypertriglyceridemia is a dose-dependent risk factor for type 2 diabetes mellitus: a systematic review and meta-analysis. Front. Endocrinol. 16:1710007. doi: 10.3389/fendo.2025.1710007
Received: 21 September 2025; Accepted: 20 October 2025;
Published: 05 November 2025.
Edited by:
Hidetaka Hamasaki, Japanese Academy of Health and Practice, JapanReviewed by:
Pietro Scicchitano, ASLBari - Azienda Sanitaria Localedella provincia di Bari (ASL BA), ItalyRonald Pratama Adiwinoto, Hang Tuah University, Indonesia
Copyright © 2025 Havelda, Szalai, Obeidat, Dobszai, Veres, Kói, Sipter, Váncsa, Hegyi, Bucur, Molnár, Vámossy, Hegyi and Szentesi. This is an open-access article distributed under the terms of the Creative Commons Attribution License (CC BY). The use, distribution or reproduction in other forums is permitted, provided the original author(s) and the copyright owner(s) are credited and that the original publication in this journal is cited, in accordance with accepted academic practice. No use, distribution or reproduction is permitted which does not comply with these terms.
*Correspondence: Andrea Szentesi, c3plbnRlc2lhaUBnbWFpbC5jb20=
†These authors have contributed equally to this work