 Jim Félix-Faure1*
 Christian Walter2
 Jerome Balesdent3
 Vincent Chanudet4Jean-Noël Avrillier5Christian Hossann6J.-M. Baudoin7Etienne Dambrine1
- 1Univ. Savoie Mont Blanc, INRA, CARRTEL, Thonon-les-Bains, France
- 2UMR SAS, INRA, Agrocampus Ouest, Rennes, France
- 3Aix Marseille Univ, CNRS, IRD, INRA, Coll France, CEREGE, Aix-en-Provence, France
- 4EDF-CIH, Le Bourget-du-Lac, France
- 5University of Savoie Mont-Blanc, Le Bourget-du-Lac, France
- 6INRA, AgroParisTech, University of Lorraine, SILVA, Champenoux, France
- 7Agence Française pour la Biodiversité, Aix-en-Provence, France
Water impoundments have major impacts on biogeochemical cycles at the local and global scales. However, although reservoirs flood soils, their biogeochemical evolution below water and its ecological consequences are very poorly documented. We took advantage of the complete emptying of the Guerlédan Reservoir (Brittany, France) to compare the composition of soils flooded for 84 years with that of adjacent non-flooded soils used as reference, in 3 situations contrasted by their soil type (Cambisol and Podzol) and initial land-use (forest or grassland). In the annual drawdown zone, upper horizons of submerged soils are eroded, especially near the upper shore and on slopes. In the permanently drowned area, silty sediments cover drowned soils. Compared to reference soils, forest soils drowned for 84 years maintain their original morphological differentiation, but colors are dull, and the humus (O horizons) have virtually disappeared. Spodic horizons are depleted in poorly crystallized iron minerals while the accumulation of amorphous aluminum compounds remains unchanged. Soil bulk density increases as well as pH while total phosphorus content is almost unchanged. On the other hand, the pH of drowned grassland soils is lower by almost one unit, and the total phosphorus content was halved compared to reference soils. In this context, in addition to the effects of flooding, differences are attributed to post-1950 changes in agricultural practices i.e., liming and fertilization. Organic matter stocks decrease by almost 40%. This rate is similar in Cambisols and Podzols. Assuming that carbon was lost as CO2 and CH4, the corresponding flux averaged over the reservoir's life is close to global areal estimates of CO2 emissions in temperate reservoirs and offsets a significant proportion of the carbon burial in reservoir sediments. Hence, flooded soils contribute significantly to the GHG budget of reservoirs, provide original long-term experimental sites to measure the effects of anoxia on soils and contain archives of past soil properties.
Introduction
Since ancient times, water reservoirs have been built to supply cities with drinking water, irrigate agricultural land, prevent devastating floods, facilitate navigation or produce mechanical or electrical energy (Bordes, 2010; French Committee on Dams and Reservoirs (CFBR), 2013). The major rivers of Europe and the United States were dammed during the twentieth century. In addition, small dams are extremely numerous. As a result, the present land area flooded in reservoirs and ponds is about 340,000 km2 (Downing et al., 2006). Many dams are presently being completed in Canada, Asia, Africa, and South America, and it is planned that the number of large reservoirs will double by 2040 (Zarfl et al., 2015) collecting about 90% of the world's stream and river flow (Van Cappellen and Maavara, 2016). With the prospect of a warming climate, the construction of many additional small ponds is currently being considered for irrigation, fish farming, drinking water supply, snow production, etc…
Because they increase water residence time (Vörösmarty et al., 1997), decrease oxygen concentration (Friedl and Wüest, 2002), store sediment (Vörösmarty et al., 2003), carbon (Dean and Gorham, 1998; Cole et al., 2007) and nutrients (Maavara et al., 2014, 2015), and release GHG (Deemer et al., 2016), impoundments have major impacts on biogeochemical cycles at the local and global scales (Billen et al., 1991; Maavara et al., 2017). In addition, water reservoirs flood soils, which are gradually covered with sediments. Properties of soils temporarily submerged have been thoroughly studied (Ponnamperuma, 1972; Sahrawat, 2003). But very few studies have been focused on the soils drowned below meters of water in reservoirs. Yet the study of such soils raises new scientific questions and has ecological applications.
Drowned soils could provide information about soils of the past, if the morphology and properties of the original soils are preserved. The challenge is to explore these archives from varied ages and to compare them with the properties of present soils, as has been done with buried soils for instance (Valentine and Dalrymple, 1976).
However, flooding drastically changes the soil environment. Soils drowned below water become anoxic and get gradually covered by sediments. This drastically reduces the input of biological carbon to the soil, as well as bioturbation. When oxygen is available, decomposition of organic matter (OM) in water is faster than in air, because microbial growth is not limited by drought (Kristensen et al., 1995). In the absence of oxygen, labile carbon is mineralized as rapidly as in the presence of oxygen (Kristensen et al., 1995; Bastviken et al., 2004). But complex macromolecules such as lignins are more slowly degraded (Canfeild, 1994; Kristensen et al., 1995; Bastviken et al., 2004) especially because the activity of white rot fungi is reduced (Medeiros et al., 2009; Cornut et al., 2010). In the absence of oxygen, Fe and Mn become more labile, as do compounds that are chemically bound to them, such as phosphorus and organic matter. Due to the major role of poorly crystallized minerals in OM stabilization (Rasmussen et al., 2018), this might a major driver of flooding impact on soil carbon balance. The mobility of these compounds and bioproducts are influenced by the chemical properties of the water in the reservoir and by the movements of water at the water-sediment-soil interface, which depend on reservoir management.
The evolution of flooded soils may have consequences on the ecological dynamics of reservoirs: (a) the observation of emptied reservoirs shows that soils are eroded in the drawdown zone, and contribute to sediment accumulation (Maleval, 2010; Félix-Faure et al., 2018); (b) carbon and nutrients contained in flooded soils (and vegetation) may contribute to the trophic upsurge phase (Turgeon et al., 2016), which leads to an increase in the biological productivity of the reservoir following flooding; (c) this evolution may also lead to the anoxia of deep layers in the reservoir and to a pulse in greenhouse gas (GHG) emissions (Barros et al., 2011; Prairie et al., 2017) after impoundment.
To evaluate the fate and ecological impact of flooded soils, we took advantage of the exceptional emptying of the Guerlédan Reservoir, which is located on the Blavet River (Brittany, France). This reservoir covers different geological substrates and land uses, with specific soil types, within the same topographic and climatic context.
Our objectives were: (1) to compare the morphology and geochemistry of flooded soils in the different drawdown zones, in comparison to non-flooded reference soils located in the immediate vicinity of the reservoir. (2) To quantify the change in soil organic matter and nutrient stocks after flooding. (3) To evaluate the potential release of carbon from drowned soils in reservoirs, at the local and global scale.
Materials and Methods
Study Site
General Characteristics
The reservoir of Guerlédan is located in Brittany, Northeastern France, in the Blavet valley. The elevation of the reservoir is 124 m asl. The average air temperature is 12°C, and the average annual rainfall is 1,060 mm. The local watershed is mainly covered with meadows, crops, and a few forests.
A 45-meter-high dam was built and the reservoir was impounded in 1931. Its main tributary, the Blavet, has a mean annual discharge of 10.7 m3.s−1. The reservoir is 7 km long and floods the Blavet valley and the old canal from Nantes to Brest in the bottom. The main physical characteristics of the reservoir are presented in Table 1.
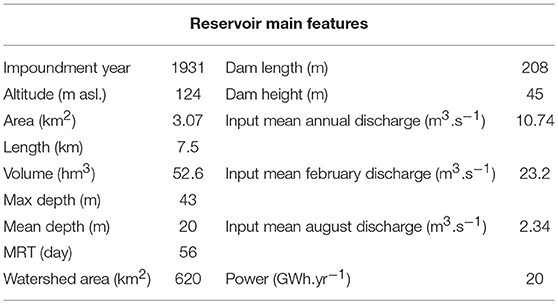
Table 1. Main features of the Guerlédan reservoir.
The reservoir consists of two parts (Figure 1A):
- A main basin formed by the Blavet valley, from the hamlet of Bonrepos (downstream of Gouarec) to the dam. The vegetation is mainly composed by oak coppices, with Pteridium aquilinum and Polytrichum formosum, on gentle slopes (<15%). On the southern shore, soils are Albic Podzols developed on quarzitic sandstone. The geological basement of the northern shore, is formed of shale (Middle or late Ordovician). The soils are Entic Podzols below forest areas, while Cambisols are associated with grasslands and crops.
- A shallow bay (maximum depth: 16 m), connected by a narrow arm to the main basin, northeast of the dam. This bay collects water from small tributaries that drain meadows and crops with a gentle slope (<10%). The littoral soils are Cambisols developed from shale.
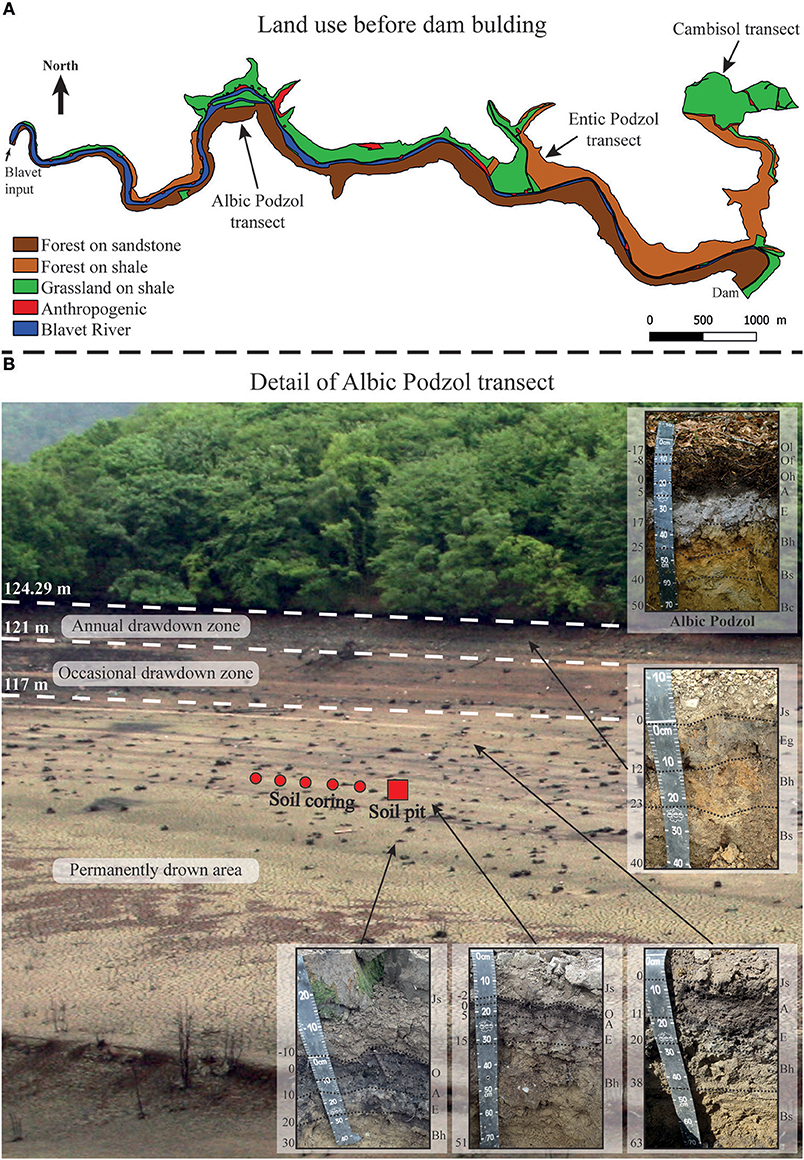
Figure 1. (A) Former land use and geological setting inside the Guerlédan Reservoir. (B) Detail of the Albic Podzol transect.
Based on the criteria of Hakanson (1980), the Guerlédan Reservoir is meso-eutrophic. In 2013, the average annual DOC, nitrate and total phosphorus concentrations were 4.4 mg C.l−1, 6.66 mg N-NO3.l−1, and 0.036 mg P.l−1, respectively. The average concentration of chlorophyll a was 7.75 μg.l−1, and the depth of the Secchi disc varied seasonally between 1.6 and 3.5 m. Surface water pH varied seasonally from 6.8 in winter to 8.4 in summer, and bottom water pH varied from 6.8 to 8.0 (Agence de l'Eau Loire-Bretagne, 2018).
Water Level Variations
Three drawdown zones have been defined according to the variations in the water level in the reservoir:
- The annual drawdown zone is between the maximum water level in the reservoir (124.3 m asl.) and the elevation of 121 m. Between 1986 and 2016, water level fluctuations occurred in this zone for 89% of the time.
- The occasional drawdown zone is the area between 121 and 117 m asl. Between 1986 and 2016, water level fluctuations occurred in this zone for 7% of the time.
- The permanently drowned area is located between the elevation of 117 and 81 m asl. The water level fell within this zone only during the complete emptying of the reservoir, which took place in 1951, 1966, 1975, 1985, and 2015.
Sampling
We selected toposequences on the same geological basement, with similar former land use inside the reservoir and present land use outside the reservoir. Land use data before the impoundment of the reservoir, in 1931, was obtained from the land cadastre of 1920 (Council of the department of Côtes-d'Armor, 2015; Department of Morbihan, 2015). This information, and the geological map (scale 1:50,000), allowed three main landscape units to be selected: forest on sandstone, forest on shale, and meadow on shale. The streambed area and areas strongly modified by man (canal and banks, quarries, houses, roads, etc.…) were avoided (Figure 1A).
To cover the diversity of geological substrates, soil types, and land use, three transects perpendicular to the littoral slope were chosen: one transect covering forests on Albic Podzol (sandstone), one transect covering forests on Entic Podzol (shale) and one transect covering grassland on Cambisol (shale). Each transect started with a reference site 10–20 m upstream from the reservoir and continued with sites in the annual drawdown zone (0–1 depending on the transect) and permanently drowned zone (one in the Cambisol and the Entic Podzol transects, and three in the Albic Podzol transect).
Soil sampling was done in the summer of 2015, during the complete emptying of the reservoir. The soil at each site was described and sampled horizon-by-horizon from a soil pit (except for the reference site of the Cambisol which was sampled with the root auger). At the same elevation, five soil cores were collected along a 10 m-long transect arranged perpendicular to the slope, but only two of the three flooded sites of the Albic Podzol transect were investigated. The root auger used (8 cm in diameter and 15 cm long, for a total collection volume of 754 cm3) allowed soil bulk density and stone content to be measured down to a depth of 30 cm or 45 cm below the O horizon (for reference soils) and below the sediment cover for the drowned soils.
The sediments deposited on the surface of the flooded soils were sampled separately using the root auger. The distinction between sediments and the superficial horizon of flooded soils was clear in terms of color, texture and soil structure.
The O horizons (OL + OF + OH) of forest soils on shale (Entic Podzol) and sandstone (Albic Podzol) were sampled entirely using a 0.04 m2 frame (20 * 20 cm square). Five replicates were made at each site, along a line perpendicular to the general slope.
The locations and details of the samples are summarized in Figures 1A,B and in Table 2, respectively.
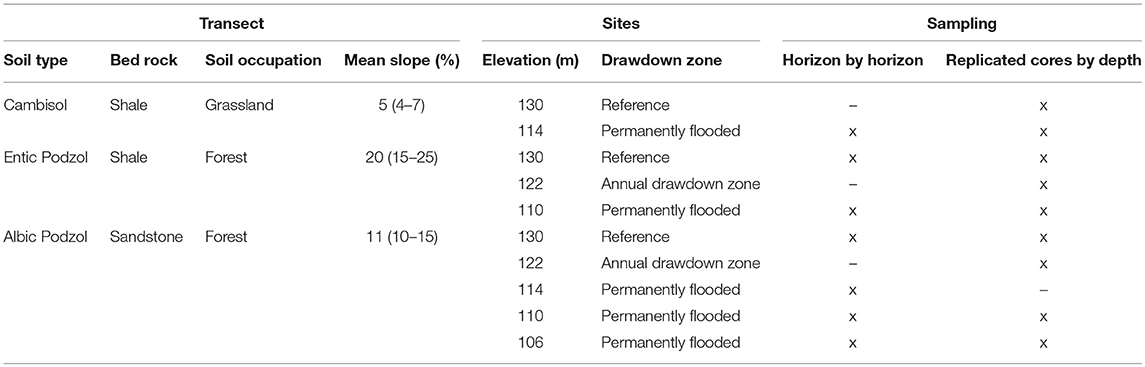
Table 2. Main features of transects, sites and associated sampling effort.
Analysis
Soil and sediment samples were air-dried and sieved to measure the weight of coarse elements (>2 mm). Humus samples (O horizons) were dried and weighed after removing large roots (Ø >5 mm).
With few exceptions, soil samples collected by horizon followed the same analytical protocol performed at the central soil analysis laboratory of INRA, following ISO or French standards: 5 fractions particle-size analysis (NF X 31-107); pH in water (ISO 10390); total phosphorus (NF X 31-147); total organic carbon (ISO 10694); total nitrogen (ISO 13878); amorphous iron (Amorph-Fe) and aluminum (Amorph-Al) extracted by oxalate, following (Tamm, 1922); and iron not bound to silicates, extracted by a dithionite-citrate system buffered by sodium bicarbonate (DCB-Fe), following (Mehra and Jackson, 1960). The iron oxide (Fe-oxide) content was computed by subtracting Amorph-Fe from DCB-Fe. Measurements of cation exchange capacity and base saturation by the cobaltihexamine method (NF X 31-130) were performed on 15 samples.
Soil cores sampled by depth were used to measure the bulk density and coarse element content after drying (40°C for 24 h) and sieving (<2 mm); it was assumed that the coarse elements had a density of 2.6. After grinding in an agate mortar, the total carbon and nitrogen contents of the fine earth as well as their isotopic composition (δ13C and δ15N) were measured with an elemental analyser (vario Isotope cube, Elementar,) connected to an isotope ratio mass spectrometer (IsoPrime 100) at the isotope analysis platform of INRA Nancy.
From soil analyses carried out on the samples according to depth (5 replicates per depth), carbon and nitrogen stocks in the 0–15, 15–30, and 30–45 cm soil layers (except for the Albic Podzol where the layer 30–45 cm was not sampled) at each site were computed according to the following equation:
Da: bulk density of the fine soil (g.cm−3); [C]: total organic carbon (or total nitrogen) content of the sample (%); VolCE: volume (m3) of coarse elements (>2 mm) of the sample, obtained from the mass and a theoretical density of 2.6; Volsample: total volume of the sample (m3); Hsample: height (m) of the sampled core. Only three measurements of coarse element content were performed at the drowned Albic Podzol sites. When values were missing, stocks were computed with reference soil values.
Carbon stocks of flooded soils were also calculated using a mass of mineral soil (soil mass corrected by subtracting the OM mass) equivalent to the reference soil. The deepest layer of the flooded soil was artificially truncated or extended to reach an equivalent total mineral soil mass of reference soil.
Results
Soil Morphology in Relation to the Drawdown Zones
Figure 1B shows the Albic Podzol transect on sandstone, as well as the morphology of the soils in the reference zone, the annual drawdown zone and the permanently drowned area.
In the reference littoral zone, the slope is ~15%. The soil presents the characteristic sequence of Albic Podzol horizons: Mor-type humus (O), thick (20 cm); A horizon (5 cm thick), very dark brown (7.5YR2.5/2); E horizon (12 cm), grayish brown (10YR5/2); Bh horizon (8 cm), black (5YR2/1); Bs horizon (15 cm), yellowish red (5YR4/6), and strong brown (7.5YR5/8); and Bc horizon (10 cm), light brown (7.5YR6/3).
The transition between the forest area and the reservoir is marked by a vertical step, ~1 m high.
In the annual drawdown zone, at the elevation of 122 m asl, on a slope of ~15%, the soil surface is paved with a few centimeters of gravel. Below this horizon occurs a small discontinuous Eg horizon (possible ghost of the former E horizon). The Bh and Bs horizons can still be identified, but have bleached colors.
In the permanently drowned area, drowned soils are covered by dark grayish brown silty sediments (Js) (10YR4/2) with a lamellar structure. This layer, 10–30 cm thick, lies over an organic horizon consisting of a darker upper part [O, black (10YR2/1), rich in organic fragments (roots, twigs)] and a lower part [A, dark grayish brown (10YR4/2)]. The E horizon is identifiable, but of gray color (10YR6/1). The spodic horizons are brown (10YR5/3) to brownish yellow (10YR6/8).
Observations along the other transects on Entic Podzol and Cambisol confirm these evolutions: the upper part of soils (O and A at least) in the annual drawdown zone is truncated; soils in the permanently drowned area are discolored compared to references. Pseudogley spots are absent or very discrete.
Particle-Size and Texture Classes
The texture (Figure 2) of the soils in the different transects is silt-loam (USDA). The clay content varies between 26.5 and 9.8%, with an average of 16.5 ± 3.5%. No change was observed along the slopes. The Albic Podzol horizons developed from sandstone are slightly sandier (mean: 25.9 ± 5.3%, min: 19.2%, max: 32%). The upper horizon of the soils of the annual drawdown zone is characterized by a higher content of coarse sand, 16 and 24% for the sites on Entic Podzol and Albic Podzol, respectively.
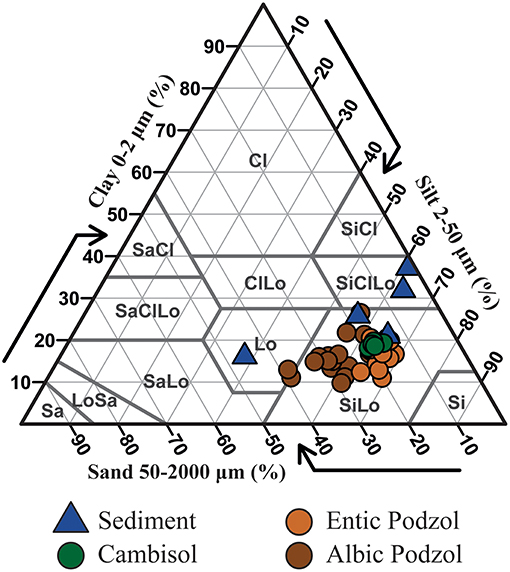
Figure 2. Texture of the soil horizons and the sediment.
In the transects on Entic Podzol and Cambisol, the content of coarse elements (>2 mm) is higher in the reference soils upstream than in the submerged profiles located in the middle or lower slopes. In the Albic Podzol, the coarse element content of drowned soils is unknown in the 0–15 cm layer, and slightly higher in the 15–30 cm layer than in the reference soil (Table 3).
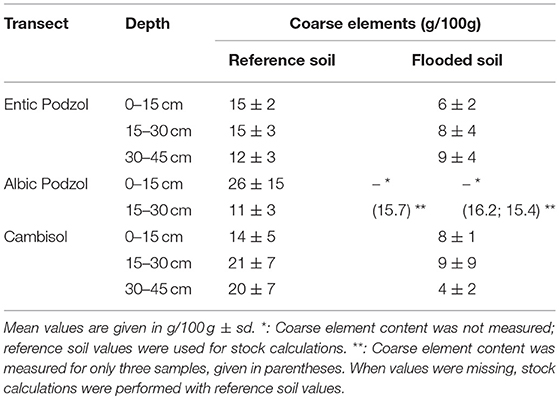
Table 3. Average coarse element content in reference and drowned soils by depth for each transect.
By comparison, the sediment texture in the permanently drowned area varies between loam upstream and silt-clay-loam downstream. The sediments do not contain coarse elements.
Bulk Density
In the transects under forest, the fine earth bulk density of the reference soils increases from 0.6 in the 0–15 cm layer (Entic Podzol: 0.6 ± 0.1, Albic Podzol: 0.7 ± 0.2) to 1 in the spodic horizons (1.0 ± 0.1 in the 30–45 cm layer of the Entic Podzol and 1.1 ± 0.3 in the 15–30 cm layer of the Albic Podzol). In drowned soils, the bulk density is on average slightly higher: 0.7 ± 0.2 and 1.0 ± 0.1 in the 0–15 cm layers; and 0.9 ± 0.1 and 1.3 ± 0.0 in the spodic horizons of the Entic and Albic Podzols, respectively.
Under grassland, the bulk density of the reference Cambisol varies from 1.0 ± 0.1 at 0–15 cm to 1.2 ± 0.1 at 15–30 cm and 30–45 cm. By comparison, the drowned soil bulk density is 1.2 ± 0.1 in the 0–15 cm layer, but 1.1 ± 0.1 in the 15–30 cm and 30–45 cm layers.
Organic Matter
Carbon Content (Figures 3A,B)
The carbon contents of the reference forest soils are 9.7, 3.6, and 2%, respectively, in the A, Bh, and Bs horizons of the Entic Podzol and 13.9, 3.0, and 2.6%, respectively, in the A, Bh, and Bs horizons of the Albic Podzol. The carbon contents of the O horizons are close to 40% (not shown on the graph).
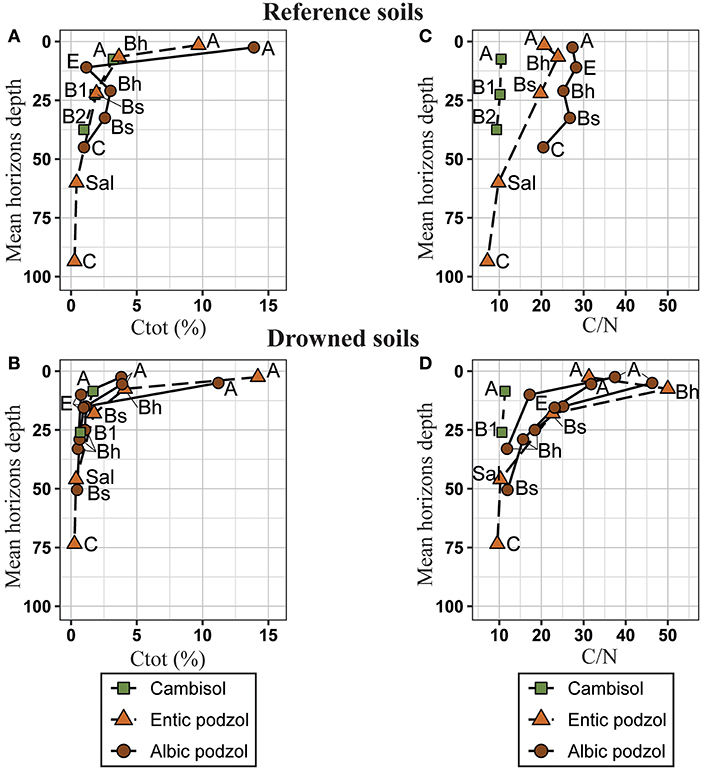
Figure 3. Total organic content (Ctot) of the horizons of reference soils (A) and drowned soils (B). Carbon/nitrogen (C/N) ratio (wt/wt) of the horizons of reference soils (C) and drowned soils (D). Holorganic horizons are not shown. Green square: Cambisol. Orange triangle: Entic Podzol. Brown dot: Albic Podzol. Horizon names are specified beside each point.
In the drowned soils, the evolutions diverge. For the Entic Podzol, the carbon content in the A horizon (14.2%) is higher than that in the reference, whereas the carbon content has changed little in the spodic horizons (Bh: 4.1% and Bs: 1.8%). However, comparing the 5 replicates sampled by depth, differences between drowned (0–15 cm: C = 5.2 ± 2.0%) and reference (0–15 cm: C = 6.0 ± 1.0%) soils are not significant, because of high variability especially in the drowned soils.
For the Albic Podzol, the carbon content is much lower in drowned soils than in the reference, in the A horizon (6.3%) and in the spodic horizons (Bh: 0.8%, Bs: 0.5%). However, differences between drowned and reference soils are not significant in the 5 replicates sampled by depth, because of high variability especially in the reference area.
The carbon contents of the grassland reference soil are lower (3.2, 1.8, and 1.0% in the 0–15, 15–30, and 30–45 cm layers, respectively) than in reference forest soils. The carbon contents of drowned soils are significantly lower (1.7, 1.1, and 0.7% in the 0–15, 15–30, and 30–45 cm layers, respectively) than in the reference soils.
C/N Ratio
The C/N ratios of the reference soils differ widely in relation to soil type and land use (Figures 3C,D), with values of ~10 in the Cambisol, 20 in the Entic Podzol and 27 in the Albic Podzol. The C/N ratio of the O horizon is above 40 (46 ± 2 and 41 ± 2 for the Entic and Albic Podzol, respectively).
Under forest, in the Entic Podzol, the C/N ratios of the drowned site (A horizon: 31; Bh: 50; Bs: 23) are higher than in the reference. In the three Albic Podzol drowned sites, the C/N ratio of the A horizons (39 ± 7) is higher, while the C/N ratio of the spodic horizons (Bh: 15 ± 3 and Bs: 12) is lower than that of the reference. However, differences between drowned and reference soils are not significant in the 5 replicates sampled by depth (except a higher value at depth 15–30 cm of the Entic Podzol), because of high variability especially in the drowned area.
The C/N ratio in the drowned Cambisols is significantly higher by about one unit at all depths than in the reference.
Soil δ13C and δ15N
Under forest, in the Entic Podzol, the average δ13C is −28.3 ± 0.2%0 in the O horizon and increases from −27.4 ± 0.3%0 to −26.2 ± 0.1%0 with increased depth. The δ13C of drowned soils follows a parallel pattern but is shifted by ~1 unit downward. Conversely, the δ15N values of the reference and drowned soils are very close and increase from ~3.5 to 4.5%0 with increased depth. In comparison, the δ15N of the O horizon is −6.2 ± 0.7%0 (Figures 4A,B).
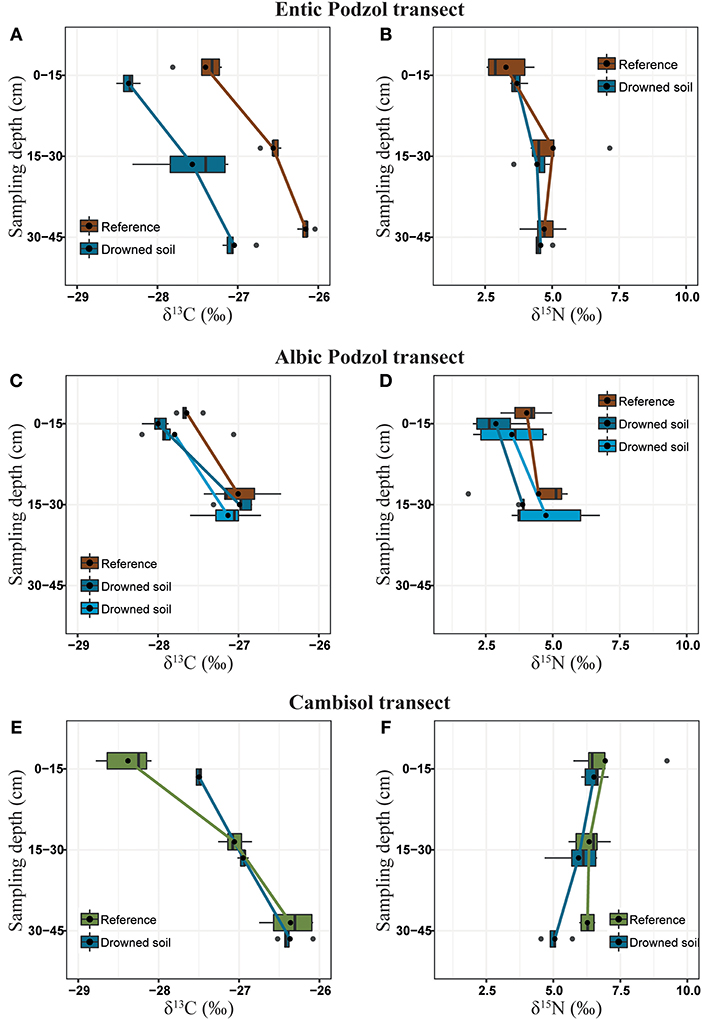
Figure 4. Boxplot of the isotopic ratios (δ13C and δ15N) of soil sections. (A,B) Entic Podzol transect. (C,D) Albic Podzol transect. (E,F) Cambisol transect. At each depth, gray dots are outliers and black dots are averages; data for the same soil are connected by lines.
The evolution of soil δ13C in the Albic Podzol is rather similar, but the difference between the reference soil and drowned soils is much less (~-0.3%0). The depth variation in soil δ15N is also rather similar (4.0 ± 0.7%0 at 0–15 cm to 4.5 ± 1.5%0 at 15–30 cm), but the δ15N of drowned soil is lower by 0.5 to 1%0 (Figures 4C,D).
Under grassland, the Cambisol δ13C increases from −28.4 ± 0.3%0 to −26.4 ± 0.3%0 with increased depth. The evolution is similar in the drowned soil, but the δ13C of the 0–15 cm layer is one unit higher (−27.5 ± 0.0%0). The δ15N values of the reference and drowned soils are similar and close to 6.5%0, except in the 30–45 cm layer of the drowned soil, where δ15N is lower (5.1 ± 0.4%0) (Figures 4E,F).
Soil Carbon Stocks
The carbon stocks (Cstock) in the O horizons of the Entic and Albic Podzols are 44 ± 8 tC.ha−1 and 41 ± 17 tC.ha−1, respectively. Below the O horizons, the Cstock values measured down to 45 and 30 cm depths in the Entic and Albic Podzols are 97 ± 4 and 83 ± 19 tC.ha−1, respectively. In total, the Cstock values are estimated at 141 ± 10 and 124 ± 29 tC.ha−1, respectively. In comparison, Cstock values in the drowned soils are 87 ± 18 tC.ha−1 for the Entic Podzol and 81 ± 7 tC.ha−1 (0–30 cm) and 77 ± 16 tC.ha−1 (0–30 cm) for the two Albic Podzol sites (Figures 5A,C).
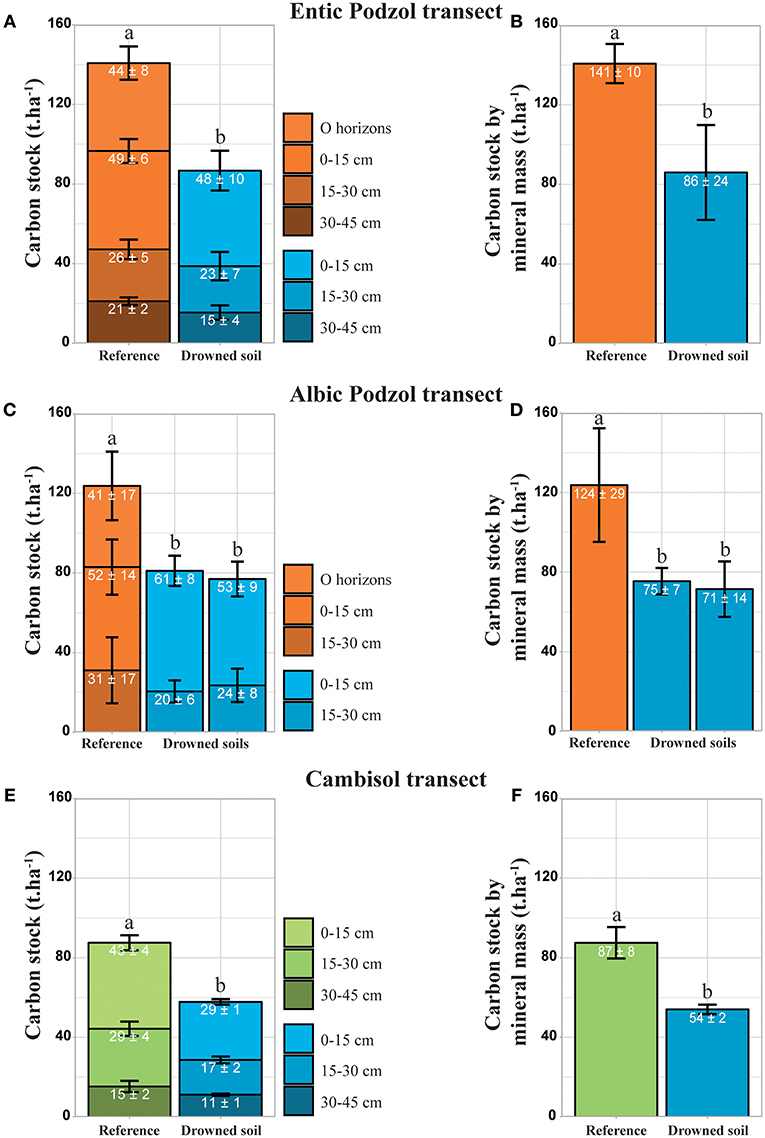
Figure 5. (A,C,E): Bar plots of the average total organic carbon stocks (t.ha−1) by depth, down to 45 cm for Entic Podzol and Cambisol and 30 cm for Albic Podzol (see text). Error bars represent ± 1 sd. Average stock values at each depth are given ± 1 sd. (B,D,F): Bar plots of average organic carbon stocks (t.ha−1) calculated for a mass of mineral soil equivalent to the reference soil. Error bars represent ± 1 sd. Average stock values at each depth are given ± 1 sd. Statistical differences were calculated by transect using TukeyHSD test. Entic Podzol: p-values < 0.01. Albic Podzol: p-values < 0.01. Cambisol: p-values < 0.01.
In the grassland, Cstock down to the depth of 45 cm is 88 ± 8 tC.ha−1 in the reference soil and 58 ± 3 tC.ha−1 in the drowned soil (0–45 cm) (Figure 5E).
Computing stocks in drowned soils for a mass of mineral soil equivalent to that of the reference soil does not change much the results: 86 ± 24 tC.ha−1 in the Entic Podzol, 75 ± 7 tC.ha−1 and 71 ± 14 tC.ha−1 for the two Albic Podzol sites respectively and 54 ± 2 tC.ha−1 in the Cambisol (Figures 5B,D,F).
By comparison, the sediment Cstock calculated on a layer of 15 cm was 6 ± 2 tC.ha−1.
Nitrogen Stocks (Figures 6A–C)
The total nitrogen stocks in the O horizon are 1.0 ± 0.2 tN.ha−1 and 1.0 ± 0.5 tN.ha−1 for the Entic and Albic Podzols, respectively.
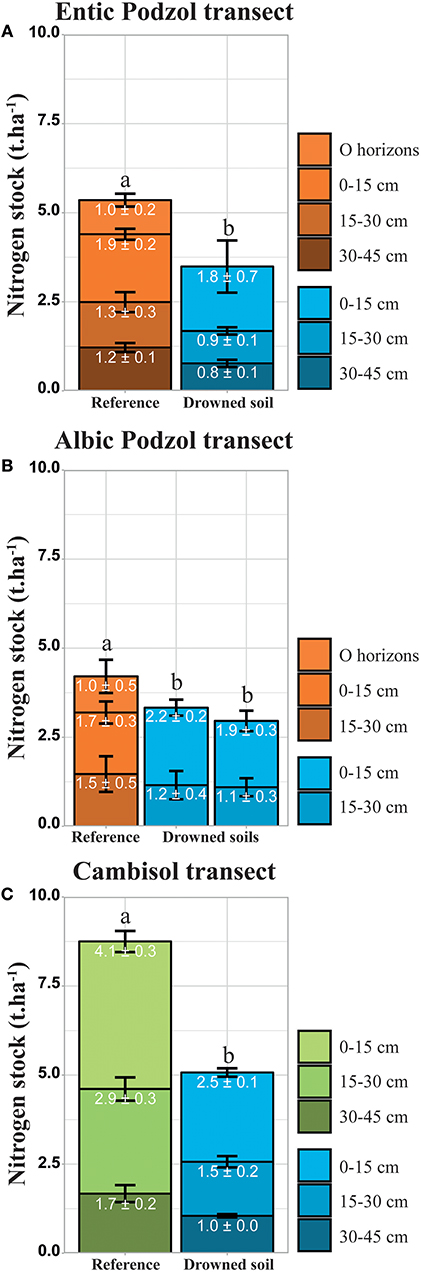
Figure 6. Bar plots of the average nitrogen stocks (t.ha−1) by depth, down to 45 cm for Entic Podzol (A) and Cambisol (C) and 30 cm for Albic Podzol (B) (see text). Error bars represent ± 1 sd. Average stock values at each depth are given ± 1 sd. Statistical differences were calculated by transect using TukeyHSD test. Entic Podzol: p-values < 0.05. Albic Podzol: p-values < 0.05. Cambisol: p-values < 0.01.
Below the O horizons, the cumulative nitrogen stocks measured down to 45 and 30 cm depths in the Entic and Albic Podzols are 4.4 ± 0.3 tN.ha−1 and 3.2 ± 0.6 tN.ha−1, respectively. Including the O horizons, the stocks are 5.4 ± 0.4 tN.ha−1 and 4.2 ± 0.8 tN.ha−1, respectively. In comparison, the cumulative nitrogen stocks in the drowned soils are 3.5 ± 0.9 tN.ha−1 for the Entic Podzol and 3.3 ± 0.3 tN.ha−1 and 2.9 ± 0.4 tN.ha−1 for the two Albic Podzol sites.
In grassland, the nitrogen stocks down to the depth of 45 cm in the reference and drowned soils are 8.8 ± 0.7 tN.ha−1 and 5.1 ± 0.3 tN.ha−1, respectively.
Geochemical Evolution
pH
The reference soil pH decreases from the Cambisol to the Albic Podzol (Figures 7A,B). Under forest, soil pH increases with depth, from ~4 in the A horizon to 5 in the BC horizon. Under grassland, pH increases from 5.6 to 6.2 with depth.
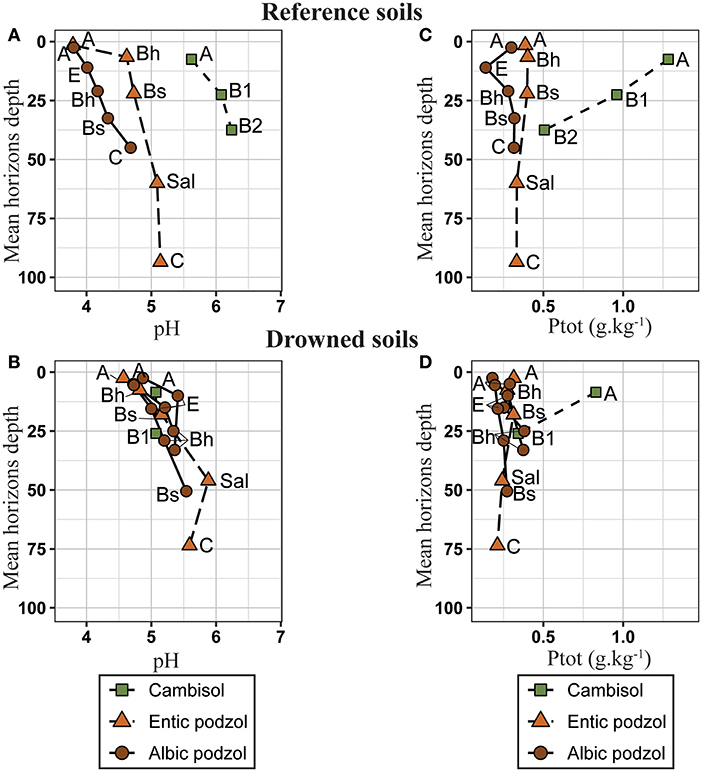
Figure 7. pHwater of the horizons of reference soils (A) and drowned soils (B). Ptot (g.kg−1) of the horizons of reference soils (C) and drowned soils (D). Holorganic horizons are not shown. Green square: Cambisol. Orange triangle: Entic Podzol. Brown dot: Albic Podzol. Horizon names are specified beside each point.
The pH of all drowned soils is between 4.5 and 5 in the upper layer and between 5.5 and 6 at depth. Under forest, the pH of drowned soils is approximately one unit higher than that for reference soils. Conversely, under grassland, the pH of the drowned soil is nearly one unit lower than that for the reference: this higher pH of the reference soils is confirmed by the level of exchangeable calcium relative to the cation exchange capacity (CEC) in the 0–15 cm layer: 4.7 cmolCa.kg−1 for a CEC of 5.7 cmolCa.kg−1 in the reference, but 1.4 cmolCa.kg−1 for a CEC of 2.2 cmolCa.kg−1 in the drowned soil.
Total Phosphorus
In reference soils, the total phosphorus (Ptot) content differs widely depending on land use and soil type (Figures 7C,D). Concentrations are 3 to 5 times higher under grassland (1.3% to 0.9%) than under forest, and in forest soils, values are the lowest in the Albic Podzol.
In drowned soils under grassland, Ptot concentrations are half that in the reference, while concentrations in soils under forest do not differ from those of reference soils.
Amorphous Iron and Crystallized Iron Oxides
The evolution of oxalate-extracted iron (Amorph-Fe) in reference soils follows the redistribution of amorphous iron associated with the podzolization process (Figure 8A). In the Albic Podzol, the Amorph-Fe content is lowest in the A and E horizons (<0.1%) and highest in the Bh and Bs horizons (1.3 and 2.5%, respectively). This vertical differentiation is less marked in the Entic Podzol (A: 0.6%, Bh: 1.3%, and Bs: 0.9%) and is lacking in the Cambisol (A: 0.7%, B1: 0.7%, and B2: 0.5%). The CDB-Fe content follows a similar distribution with lowest values in the A horizons of Podzols (Albic: A: 0.2% and Entic: A: 2.1%) and highest values in spodic horizons (Albic: Bh: 1.6%, Bs: 3.1%, and Entic: Bh: 3.2%, Bs: 3.2%). The CDB-Fe content in the Cambisol is homogenous down to 45 cm (A: 1.7%, B1: 1.9%, and B2: 1.8%). The contents in iron oxides (CDB-Fe–Amorph-Fe) (Figure 8C) is depleted in the A and E horizons. The iron oxide content of deep horizons in the Albic Podzol derived from sandstone (0.5%) is much lower than that of Cambisol and Entic Podzol derived from shale (1.5%).
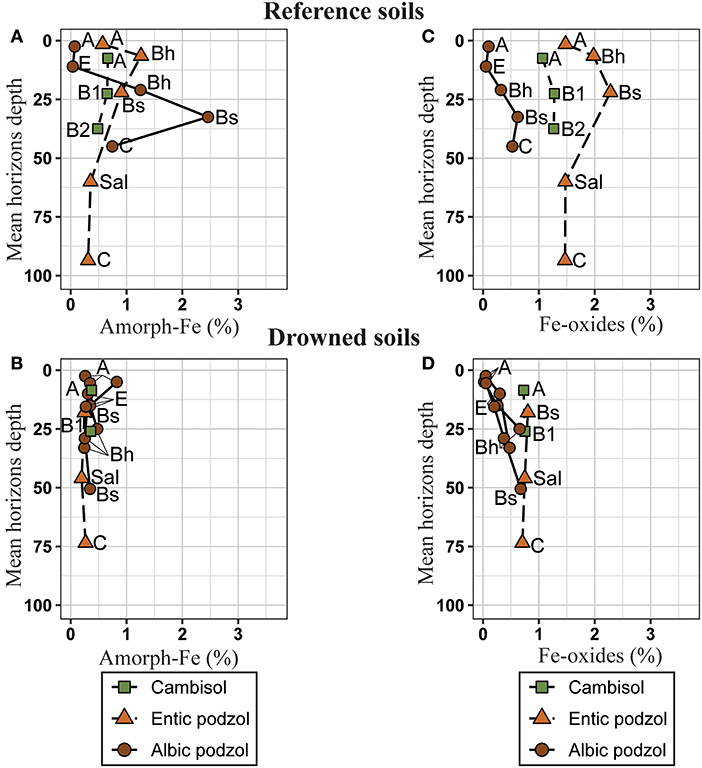
Figure 8. Oxalate-extracted iron (Amorph-Fe) (%) of the horizons of reference soils (A) and drowned soils (B). Iron oxides (Fe-oxides) (%) of the horizons of reference soils (C) and drowned soils (D). Holorganic horizons are not shown. Green square: Cambisol. Orange triangle: Entic Podzol. Brown dot: Albic Podzol. Horizon names are specified beside each point.
For comparison, the Amorph-Fe and CDB-Fe contents of the fine sediment covering the soils are 1.0 ± 0.2% and 1.5 ± 0.1%, respectively.
In drowned soils, the amorphous Fe content of all soil (Figure 8B) horizons converges to values between 0.2 and 0.5% without vertical differentiation (except one Albic Podzol site with a content of 0.8% in the A horizon). In the Albic Podzol, compared to the reference, contents slightly increased in the A and E and strongly decreased in Bh and Bs. The iron oxide contents of the drowned and reference Albic Podzol are low and very close. The contents in the drowned soils on shale (0.8%) are lower (Cambisol) and much lower (Entic Podzol) than in the reference (Figure 8D).
Oxalate-Extracted Aluminum
In the reference soils, the evolution of oxalate-extracted aluminum (Amorph-Al) follows the redistribution of iron associated with the podzolization process. Horizon A samples in the forest soils are poor in Amorph-Al, with values of 0.1 and 0.3% in the Albic Podzol and Entic Podzol, respectively. Spodic horizons are richer, with values of 0.3 and 0.6% for Bh and 0.7 and 0.7% for Bs in the Albic Podzol and Entic Podzol, respectively. The Cambisol Amorph-Al contents are 0.25, 0.25, and 0.27% in horizons A, B1, and B2, respectively.
In general, the content of Amorph-Al in drowned soils has changed little, apart from a notable decrease in the Bs horizon of Albic Podzol at one site.
Discussion
Soil Erosion in the Annual Drawdown Zone
In the annual drawdown zone, along the three transects and independent of slope, all O and A horizons have disappeared. Soils are truncated down to a depth that we could reconstruct from the surface soil level around tree stumps and for the height of the soil step surrounding the reservoir. An average soil loss of about 40 centimetres' depth may have affected weak slopes (<10%). On steeper slopes, and especially near the maximum water level, all soil down to the C horizon has been eroded by waves. Residual coarse elements from soils in the annual drawdown zone cover the surface of soils downstream and slow their erosion. In the occasional drawdown zone, superficial horizons are reworked and mixed with sandy sediment originating from upstream.
Evolution of Drowned Soils
Organic Matter Changes and GES Emission
The O horizons of drowned soils have almost entirely disappeared. The spatial homogeneity of the A horizons of drowned soils suggests that they were not eroded. Erosion would most likely have left ghosts, protected by stumps or roots, which we did not observe. In addition, we found fragments of small roots or branches on the upper limit of the A horizon in the Podzol profiles. These fragments suggested relicts of O horizons. Partial dispersion and erosion of the litter layer (OL horizon) when the reservoir was flooded cannot be excluded. But it should be kept in mind that the OF and OH layers are densely prospected by roots, which certainly prevents erosion. The higher C/N of the drowned Podzol A horizons compared to that of the reference soil might be explained by a carbon input from the original O horizon. Lateral variability in C content and C/N was very high, both in the drowned and reference areas, and within horizons and depths. Because of this high variability, the difference in carbon contents between control and drowned sites were not significant. Changes in carbon stocks were mostly related to the disappearance of the O layer. However, comparing total C stocks, differences were highly significant.
After being drowned for 84 years under water, and considering a mass of mineral soil equivalent to that in the {O horizon + 0–45 cm} layer of the reference soil, the Cambisol, and Entic Podzol have lost 36 and 39%, respectively, of their initial carbon stock, that is between 3.3 and 5.5 kgC.m−2, respectively. Calculated over a thickness of 30 cm, the Albic Podzol has lost on average 41% of its initial carbon stock, that is 5.4 kgC.m−2.
Although of lower magnitude, these proportions are comparable to that (50%) measured using the same method in Cambisols under meadows drowned for 80 years in another reservoir of the Massif Central (Félix-Faure et al., 2018). The rate measured in the Cambisol might also be compared to that measured in long-term terrestrial experiments. Menichetti et al. (2014) showed in five 30- to 80-years-long bare fallows that soils kept with no vegetation had lost 33–65% of their carbon. It suggests that permanent submersion of soils, in probably anoxic conditions, does not drastically reduce long-term carbon mineralization rates.
In drowned forest soils, decreases in carbon stocks are greatest in the upper layers: O horizon + 0–15 cm: 48 and 39% on average for Entic Podzol and Albic Podzol, respectively. The most likely reason of this important decrease is a relatively high content of labile organic matter in O and A horizons. The increase in the C/N ratio of the A horizons may be related to (i) the input of organic matter with a C/N > 40 from the O horizons. Carbon loss from the spodic horizons of the Podzols could be facilitated by the removal of iron associated with illuvial organic matter. On the other hand, for the Cambisol, the lower C/N of current grasslands is likely related to their high level of nitrogen fertilization.
The surprising fact that almost similar organic matter losses were measured in Podzols and Cambisols may be explained by the rise in pH of acid soils in contact with the waterbody. In fact, carbon and nitrogen mineralisation might have been directly affected by the change in pH (Rousk et al., 2009), indirectly by the alteration of the mineral phases that protect carbon (Rasmussen et al., 2018). It may be noticed that most of the carbon lost from Podzols is from the humus layers, that is from relatively fresh organic matter, whereas the Cambisol loses carbon from all depths.
Another explanation is related to the availability of oxygen. Oxygen saturation profiles in water in relation to depth measured close to the dam (Electricité De France, 2014) show that the water column is oxic in winter and spring. In summer and autumn the oxygen content decreases to almost 0 mg.l−1 in the thermocline (depth between 7 and 12 m, that is approximately at the elevation of 115–110 m asl). Most of our drowned soil samplings are within this zone. The oxygen content increases below the thermocline in relation to the entry of oxic water from the main stream (Blavet). This means that for the Albic Podzol, which is located upstream, water might be oxic all year round, whereas water might be anoxic in autumn in the Entic Podzol area (see Figure 1A). In the shallow bay, where the Cambisol transect is located, the oxygen content might also be higher in relation to water level fluctuations.
In addition, sediment interstitial water composition was measured (Electricité De France, 2014). In the area of the Albic Podzol, the NH4/NO3 ratio in sediment water varies between 0.35 upstream and 11.4 downstream. In the area of the Entic Podzol, nitrate is almost absent (NH4/NO3 = 26). Hence oxygen availability might explain why mineralization went deeper in the profile in the Albic Podzol (C losses from the Bs) compared to the Entic Podzol. The same process might have influenced decomposition in the Cambisol area.
The evolution of δ13C is paradoxical. Indeed, atmospheric δ13C has decreased for the past century as a result of the combustion of fossil fuel (Suess effect). Hence, independent of all other processes, the surface horizons of present soils should be depleted by approximately one delta unit relative to their equivalents 80 years ago (Graven et al., 2017). If one adds to this the isotopic enrichment associated with the loss of young organic matter (Balesdent and Mariotti, 1996; Menichetti et al., 2014), an enrichment of more than one delta unit in favor of the drowned soils is foreseeable. The observation made on the 0–15 cm layer of the Cambisol is consistent with this, although the difference is <1 unit, and agrees with previous observation of (Félix-Faure et al., 2018) in drowned Cambisols below grasslands. On the other hand, the δ13C values of the 15–30 and 30–45 cm layers are not different from those of the drowned soils. It should be kept in mind that the historical change of organic fertilization practices may contribute to these figures. We know that silage corn has been widely used as livestock feed by Breton farmers for the past 30 years: this could lead to manures, and soils, enriched in 13C. In addition, δ15N values are very high for all the profiles, which could be attributed to high manure fertilization for the current grassland and potentially to nitrogen mineralization for the drowned soil.
However, under forest, we observe the opposite of what the Suess effect should produce. The δ13C of drowned soils is less than that of the current forest profile, with a value of more than one unit over the entire profile of Entic Podzol and less than half a unit in Albic Podzol. Several factors could be involved in reducing the δ13C of drowned soils. (1) The reference soil upstream of the toposequence is richer in coarse elements and therefore drier. Balesdent et al. (1993) showed a decrease of two units in δ13C in tree leaves and soils along a toposequence of the Paris basin ranging from a drier plateau to a wetter bottom. Applied to the studied toposequence, a difference in moisture along the slope could account for some of the observed difference. (2) In addition, it is known that lignin is particularly conserved during anaerobic mineralization because the activity of white rot fungi is depressed in the absence of oxygen. As lignin is depleted in 13C compared to bulk organic matter (Benner et al., 1987), this could lead to a lower δ13C in drowned soils subjected to differential mineralization of their organic matter. And a difference in oxygen availability (see above) might explain the larger Δ13C in the Entic Podzol. However, this pattern was not observed by Oelbermann and Schiff (2008) during their flooded soil mineralization experiment. This “anomalous” isotope pattern would deserve further investigation.
These figures provide a framework for considering the effects of soil flooding on greenhouse gas emissions by reservoirs. Flooded soils provide carbon to the water body, most likely in the form of CO2 and CH4, which finally reaches the atmosphere. The time dynamic of carbon release is not known, but it is likely that most of the losses occur before the soils are covered by a continuous layer of sediment, that is, during the first 25 years following impoundment. We did not compute precisely the loss of carbon from eroded soils in the drawdown area, but we may conservatively assume a similar loss than in the permanently drowned soils (± 40%) even if the loss rate is probably much faster, especially for the organic horizons (Blodau and Moore, 2003). This flux may explain the statistical (Barros et al., 2011) and experimentally measured (Abril et al., 2005) peak in GHG emissions and further decline following the flooding of reservoirs. In fact, if we divide the weighted average soil carbon losses measured on a reservoir area basis (3.9 kgC.m−2) by 25 years, and assume that the losses correspond to a gaseous emissions, this would lead to an average emission, by flooded soils, of about 430 mgC.m−2.d−1. In comparison, the mean CO2 emission rate of temperate reservoirs given by Barros et al. (2011) is about 350 mgC.m−2.d−1, and, globally, young (<20 years) reservoirs emit about 4 times more than old ones. From the process point of view, Kim et al. (2016) used a terrestrial biochemistry model (DNDC), modified to take into account redox conditions in drowned soils, to simulate C emissions from a forest Podzol in Canada. They computed an average emission of 1.4 gC.m−2.d−1 for the first 5 years after flooding. Our data and samples could be used to experimentally calibrate this model over the long term.
On the other hand, the global carbon sink associated to reservoir sediment, given by Mendonça et al. (2017) is 0.06 Pg.yr−1 for a global area of 3.5 105 km2, that is about 400 mgC.m−2.day−1. Although crude, this comparison suggests that the carbon storage in reservoir sediments may be balanced by the carbon released form drowned soils during the first decades after flooding.
Geochemical Evolution, Legacies, and Historical Change
Compared to current podzolized forest soils, the drowned soils maintain morphological podzolic differentiation, but the colors are dull. The redistribution of amorphous Al, characteristic of the podzolization process, is preserved. On the other hand, the vertical redistribution of amorphous iron disappears. The release of most of the amorphous iron under low redox conditions probably explains the absence of characteristic colors and spots of gley. Redox conditions in drowned soils may also explain the decrease in iron present in the form of oxide (CDB-Fe minus Amorph-Fe) in the soil profiles developed from shale, under forest or meadow. This decline was not observed in the Albic Podzol developed on sandstone, but the initial concentrations were much lower than those in other soils.
What is the fate of the iron removed from soil profiles? A fraction might accumulate in the A and possibly E horizons, in the vicinity of the soil-sediment interface, as suggested by the observed increase in the Amorph-Fe content of these horizons. This redistribution would be responsible for the homogenization of the contents in the drowned soil profiles. Another fraction of this Amorph-Fe would migrate to the reservoir water body through the sediment. The Amorph-Fe content of the sediment is in fact on average twice as high as those of the drowned soils. The monitoring of the complete emptying of the Guerlédan Reservoir in 1985 indicated high levels of dissolved iron (0.1 to 3 mg.l−1) in the water collected at the end of the complete emptying (Electricité De France, 2014). The discharge of red-colored water containing soluble iron during the first years after reservoir filling as well as after complete reservoir emptying has already been described in tropical reservoirs (Chanudet et al., 2016).
The higher pH of drowned forest soils in relation to that of the reference is most likely related to loss of organic matter and to the contact with reservoir water, whose pH varies between pH 6.6 and 7.4 near the bottom (Electricité De France, 2014). The higher pH in the “reference” Cambisol under meadow is most likely linked to the evolution of agricultural practices in the past 70 years. Liming of agricultural land, especially grassland, is extremely unlikely before the 1960s (Coppenet, 1983), as there is no limestone in the bedrocks of Brittany. Only marl collected from sea shores was used. Large scale liming was initiated in the eighties, and soil pH was regionally raised since 3 then. Hence, before 1931, soils were certainly more acidic than nowadays. The low Ptot contents of forest soils vary very little in relation to flooding. However, as observed for carbon, an increase in the Ptot content in the A horizon should be seen if some phosphorus originally present in the O horizons of soils accumulates in the A horizon. This was not observed, which suggests that the organic phosphorus present in the O horizon was released to the water body, or to the sediment. Under grassland, total phosphorus levels in the drowned soil are low relative to those in the reference grassland, and the difference is mostly in the 0–15 and 15–30 cm layers. As regards liming, P fertilization of grasslands in Brittany before the 1950s is highly unlikely. The meadow soils drowned in 1931 had most likely never been fertilized, while the current grassland used as a reference has most likely been fertilized. In the same way, the high density of the 15–30 cm layer of present grassland, which is not found in flooded soils, could be due to a plow sole. These examples provide a glimpse of the type of information that can be expected from such underwater archives but also the difficulties inherent in this exercise.
Hence, drowned soils contribute significantly to the GHG budget of reservoirs, provide original long-term experimental sites to measure the effects of anoxia on soils and contain archives of past soil properties. For these reasons, they deserve extra attention.
Author Contributions
JF-F, CW, VC, and ED conceived and planned the experiments. JF-F, CW, VC, J-NA, CH, and ED contributed to sample preparation. JF-F performed the calculations. CW, JB, VC, and J-MB aided in interpreting the results. JF-F and ED wrote the manuscript with input from all authors.
Conflict of Interest Statement
The authors declare that the research was conducted in the absence of any commercial or financial relationships that could be construed as a potential conflict of interest.
Acknowledgments
The authors would like to thank Stéphane Descloux from EDF-CIH who initiated this topic, and Alexandre Gauvain for his Master work in Rennes.
References
Abril, G., Guérin, F., Richard, S., Delmas, R., Galy-Lacaux, C., Gosse, P., et al. (2005). Carbon dioxide and methane emissions and the carbon budget of a 10-year old tropical reservoir (Petit Saut, French Guiana): CO2 and CH4 emissions at Petit Saut. Glob. Biogeochem. Cycles 19, GB4005. doi: 10.1029/2005GB002457
Agence de l'Eau Loire-Bretagne (2018). Base de Données de Bassin : OSUR. Available online at: http://osur.eau-loire-bretagne.fr/exportosur/Accueil (accessed August 1, 2018).
Balesdent, J., Girardin, C., and Mariotti, A. (1993). Site-related 13C of tree leaves and soil organic matter in a temperate forest. Ecology 74, 1713–1721. doi: 10.2307/1939930
Balesdent, J., and Mariotti, A. (1996). “Measurement of soil organic matter turnover using 13C natural abundance,” in Mass Spectrometry of Soils, eds T. W. Boutton and S. Yamasaki (New York: Marcel Dekker Inc.), 83–111.
Barros, N., Cole, J. J., Tranvik, L. J., Prairie, Y. T., Bastviken, D., Huszar, V. L. M., et al. (2011). Carbon emission from hydroelectric reservoirs linked to reservoir age and latitude. Nat. Geosci. 4, 593–596. doi: 10.1038/ngeo1211
Bastviken, D., Persson, L., Odham, G., and Tranvik, L. (2004). Degradation of dissolved organic matter in oxic and anoxic lake water. Limnol. Oceanogr. 49, 109–116. doi: 10.4319/lo.2004.49.1.0109
Benner, R., Fogel, M. L., Sprague, E. K., and Hodson, R. E. (1987). Depletion of 13C in lignin and its implications for stable carbon isotope studies. Nature 329, 708–710. doi: 10.1038/329708a0
Billen, G., Lancelot, C., and Meybeck, M. (1991). “N, P, and Si retention along the aquatic continuum from land to ocean,” in Ocean Margin Processes in Global Change. Dahlem Workshop on Ocean Margin Processes in Global Change, eds R. F. C. Mantoura, J.-M. Martin, and R. Wollast (Berlin: John Wiley and Sons), 19–44.
Blodau, C., and Moore, T. R. (2003). Experimental response of peatland carbon dynamics to a water table fluctuation. Aquat. Sci. Res. Boundaries 65, 47–62. doi: 10.1007/s000270300004
Bordes, J.-L. (2010). Les barrages en France du XVIIIème à la fin du XXème siècle. Histoire, évolution technique et transmission du savoir. Pour Mém. 9, 70–120. Available online at: https://www.ecologique-solidaire.gouv.fr/sites/default/files/Pourmémoiren°9.Hiver2010.Basesaèriennes.Energiehydraulique.pdf
Canfeild, D. E. (1994). Factors influencing organic carbon preservation in marine sediments. Chem. Geol. 114, 315–329. doi: 10.1016/0009-2541(94)90061-2
Chanudet, V., Guédant, P., Rode, W., Godon, A., Guérin, F., Serça, D., et al. (2016). Evolution of the physico-chemical water quality in the Nam Theun 2 Reservoir and downstream rivers for the first 5 years after impoundment. Hydroécol. Appl. 19, 27–61. doi: 10.1051/hydro/2015001
Cole, J. J., Prairie, Y. T., Caraco, N. F., McDowell, W. H., Tranvik, L. J., Striegl, R. G., et al. (2007). Plumbing the global carbon cycle: integrating inland waters into the terrestrial carbon budget. Ecosystems 10, 172–185. doi: 10.1007/s10021-006-9013-8
Coppenet, M. (1983). “Considerations generales sur l'acidité des sols et sur les problèmes agronomiques qui en resultent. L'exemple de la Bretagne,” in Comptes rendus (Perpignan). Available online at: https://prodinra.inra.fr/record/78440~10–15.
Cornut, J., Elger, A., Lambrigot, D., Marmonier, P., and Chauvet, E. (2010). Early stages of leaf decomposition are mediated by aquatic fungi in the hyporheic zone of woodland streams: leaf litter decomposition in the hyporheic zone. Freshw. Biol. 55, 2541–2556. doi: 10.1111/j.1365-2427.2010.02483.x
Council of the department of Côtes-d'Armor (2015). Arch. Dép. Côtes Armor. Available online at: http://archives.cotesdarmor.fr (accessed February 2, 2015).
Dean, W. E., and Gorham, E. (1998). Magnitude and significance of carbon burial in lakes, reservoirs, and peatlands. Geology 26, 535–538. doi: 10.1130/0091-7613(1998)026<0535:MASOCB>2.3.CO;2
Deemer, B. R., Harrison, J. A., Li, S., Beaulieu, J. J., DelSontro, T., Barros, N., et al. (2016). Greenhouse gas emissions from reservoir water surfaces: a new global synthesis. BioScience 66, 949–964. doi: 10.1093/biosci/biw117
Department of Morbihan (2015). Arch. Morbihan. Available online at: https://archives.morbihan.fr (accessed February 2, 2015).
Downing, J. A., Prairie, Y. T., Cole, J. J., Duarte, C. M., Tranvik, L. J., Striegl, R. G., et al. (2006). The global abundance and size distribution of lakes, ponds, and impoundments. Limnol. Oceanogr. 51, 2388–2397. doi: 10.4319/lo.2006.51.5.2388
Electricité De France (2014). Dossier d'exécution Avec Notice Environnementale : Vidange de la Retenue de Guerlédan et Travaux Associés. Electricité De France, Unité de Production Centre, Groupe d'Exploitation hydraulique Lot-Truyère.
Félix-Faure, J., Gaillard, J., Descloux, S., Chanudet, V., Poirel, A., Baudoin, J.-M., et al. (2018). Contribution of flooded soils to sediment and nutrient fluxes in a hydropower reservoir (Sarrans, Central France). Ecosystems 22, 1–19. doi: 10.1007/s10021-018-0274-9
French Committee on Dams and Reservoirs (CFBR) (2013). L'histoire des Barrages. French Committee on Dams and Reservoirs (CFBR).
Friedl, G., and Wüest, A. (2002). Disrupting biogeochemical cycles-Consequences of damming. Aquat. Sci. 64, 55–65. doi: 10.1007/s00027-002-8054-0
Graven, H., Allison, C. E., Etheridge, D. M., Hammer, S., Keeling, R. F., Levin, I., et al. (2017). Compiled records of carbon isotopes in atmospheric CO2 for historical simulations in CMIP6. Geosci. Model Dev. 10, 4405–4417. doi: 10.5194/gmd-10-4405-2017
Hakanson, L. (1980). An ecological risk index for aquatic pollution control. A sedimentological approach. Water Res. 14, 975–1001. doi: 10.1016/0043-1354(80)90143-8
Kim, Y., Roulet, N. T., Li, C., Frolking, S., Strachan, I. B., Peng, C., et al. (2016). Simulating carbon dioxide exchange in boreal ecosystems flooded by reservoirs. Ecol. Model. 327, 1–17. doi: 10.1016/j.ecolmodel.2016.01.006
Kristensen, E., Ahmed, S. I., and Devol, A. H. (1995). Aerobic and anaerobic decomposition of organic matter in marine sediment: which is fastest? Limnol. Oceanogr. 40, 1430–1437. doi: 10.4319/lo.1995.40.8.1430
Maavara, T., Dürr, H. H., and Van Cappellen, P. (2014). Worldwide retention of nutrient silicon by river damming: from sparse data set to global estimate. Glob. Biogeochem. Cycles 28, 842–855. doi: 10.1002/2014GB004875
Maavara, T., Lauerwald, R., Regnier, P., and Van Cappellen, P. (2017). Global perturbation of organic carbon cycling by river damming. Nat. Commun. 8:15347. doi: 10.1038/ncomms15347
Maavara, T., Parsons, C. T., Ridenour, C., Stojanovic, S., Dürr, H. H., Powley, H. R., et al. (2015). Global phosphorus retention by river damming. Proc. Natl. Acad. Sci. U.S.A. 112, 15603–15608. doi: 10.1073/pnas.1511797112
Maleval, V. (2010). Le Lac de Saint-Pardoux. Evolution du Littoral et Sédimentation Lacustre. Première édition. Clermont-Ferrand: Presses Universitaires Blaise Pascal.
Medeiros, A. O., Pascoal, C., and Graça, M. A. S. (2009). Diversity and activity of aquatic fungi under low oxygen conditions. Freshw. Biol. 54, 142–149. doi: 10.1111/j.1365-2427.2008.02101.x
Mehra, O. P., and Jackson, M. L. (1960). Iron oxide removal from soils and clays by a Dithionite-Citrat system buffered with Sodium Bicarbonate. Clays Clay Miner. 2013, 317–327. doi: 10.1016/B978-0-08-009235-5.50026-7
Mendonça, R., Müller, R. A., Clow, D., Verpoorter, C., Raymond, P., Tranvik, L. J., et al. (2017). Organic carbon burial in global lakes and reservoirs. Nat. Commun. 8:6. doi: 10.1038/s41467-017-01789-6
Menichetti, L., Houot, S., van Oort, F., Kätterer, T., Christensen, B. T., Chenu, C., et al. (2014). Increase in soil stable carbon isotope ratio relates to loss of organic carbon: results from five long-term bare fallow experiments. Oecologia 177, 811–821. doi: 10.1007/s00442-014-3114-4
Oelbermann, M., and Schiff, S. L. (2008). Quantifying carbon dioxide and methane emissions and carbon dynamics from flooded boreal forest soil. J. Environ. Qual. 37:2037. doi: 10.2134/jeq2008.0027
Ponnamperuma, F.-N. (1972). The chemistry of submerged soils. Adv. Agronom. 24, 29–96. doi: 10.1016/S0065-2113(08)60633-1
Prairie, Y. T., Alm, J., Beaulieu, J., Barros, N., Battin, T., Cole, J., et al. (2017). Greenhouse gas emissions from freshwater reservoirs: what does the atmosphere see? Ecosystems 21, 1058–1071. doi: 10.1007/s10021-017-0198-9
Rasmussen, C., Heckman, K., Wieder, W. R., Keiluweit, M., Lawrence, C. R., Berhe, A. A., et al. (2018). Beyond clay: towards an improved set of variables for predicting soil organic matter content. Biogeochemistry 137, 297–306. doi: 10.1007/s10533-018-0424-3
Rousk, J., Brookes, P. C., and Baath, E. (2009). Contrasting soil pH effects on fungal and bacterial growth suggest functional redundancy in carbon mineralization. Appl. Environ. Microbiol. 75, 1589–1596. doi: 10.1128/AEM.02775-08
Sahrawat, K. L. (2003). Organic matter accumulation in submerged soils. Adv. Agronom. 81, 169–201. doi: 10.1016/S0065-2113(03)81004-0
Tamm, O. (1922). Eine Method zur Bestimmung der anorganischen Komponenten des Gelkomplex in Boden. Medd Statens Skogforsoksanst 19, 385–404.
Turgeon, K., Solomon, C. T., Nozais, C., and Gregory-Eaves, I. (2016). Do novel ecosystems follow predictable trajectories? Testing the trophic surge hypothesis in reservoirs using fish. Ecosphere 7, 1–17. doi: 10.1002/ecs2.1617
Valentine, K. W. G., and Dalrymple, J. B. (1976). Quaternary buried paleosols: a critical review. Quat. Res. 6, 209–222. doi: 10.1016/0033-5894(76)90051-X
Van Cappellen, P., and Maavara, T. (2016). Rivers in the anthropocene: global scale modifications of riverine nutrient fluxes by damming. Ecohydrol. Hydrobiol. 16, 106–111. doi: 10.1016/j.ecohyd.2016.04.001
Vörösmarty, C. J., Meybeck, M., Fekete, B., Sharma, K., Green, P., and Syvitski, J. P. (2003). Anthropogenic sediment retention: major global impact from registered river impoundments. Glob. Planet. Change 39, 169–190. doi: 10.1016/S0921-8181(03)00023-7
Vörösmarty, C. J., Sharma, K. P., Fekete, B. M., Copeland, A. H., Holden, J., Marble, J., et al. (1997). The storage and aging of continental runoff in large reservoir systems of the world. Ambio 26, 210–219.
Keywords: drowned soils, water reservoir, carbon budget, greenhouse gas, archive
Citation: Félix-Faure J, Walter C, Balesdent J, Chanudet V, Avrillier J-N, Hossann C, Baudoin J-M and Dambrine E (2019) Soils Drowned in Water Impoundments: A New Frontier. Front. Environ. Sci. 7:53. doi: 10.3389/fenvs.2019.00053
Received: 21 December 2018; Accepted: 04 April 2019;
Published: 24 April 2019.
Edited by:
Philippe C. Baveye, AgroParisTech Institut des Sciences et Industries du Vivant et de L'environnement, FranceReviewed by:
Ichiro Tayasu, Research Institute for Humanity and Nature, JapanPhilippe Cambier, Institut National de la Recherche Agronomique (INRA), France
Copyright © 2019 Félix-Faure, Walter, Balesdent, Chanudet, Avrillier, Hossann, Baudoin and Dambrine. This is an open-access article distributed under the terms of the Creative Commons Attribution License (CC BY). The use, distribution or reproduction in other forums is permitted, provided the original author(s) and the copyright owner(s) are credited and that the original publication in this journal is cited, in accordance with accepted academic practice. No use, distribution or reproduction is permitted which does not comply with these terms.
*Correspondence: Jim Félix-Faure, amltLmZlbGl4LmZhdXJlQGhvdG1haWwuZnI=