 Viktor Sebestyén
 Tímea Czvetkó
 János Abonyi
- 1MTA-PE “Lendület” Complex Systems Monitoring Research Group, University of Pannonia, Veszprém, Hungary
- 2Sustainability Solutions Research Lab, University of Pannonia, Veszprém, Hungary
We developed a digital water management toolkit to evaluate the importance of the connections between water bodies and the impacts caused by pollution sources. By representing water bodies in a topological network, the relationship between point loads and basic water quality parameters is examined as a labelled network. The labels are defined based on the classification of the water bodies and pollution sources. The analysis of the topology of the network can provide information on how the possible paths of the surface water network influence the water quality. The extracted information can be used to develop a monitoring- and evidence-based decision support system. The methodological development is presented through the analysis of the physical-chemical parameters of all surface water bodies in Hungary, using the emissions of industrial plants and wastewater treatment plants. Changes in water quality are comprehensively assessed based on the water quality data recorded over the past 10 years. The results illustrate that the developed method can identify critical surface water bodies where the impact of local pollution sources is more significant. One hundred six critical water bodies have been identified, where special attention should be given to water quality improvement.
1 Introduction
The Water Framework Directive, adopted in 2000, was a pioneering approach to water protection that provides a good water status at river basin level based on a precise timetable (Directive, 2000). However, in the case of this ambitious goal, many countries are far from achieving good ecological statuses. Therefore, the monitoring- and evaluation systems need to be further improved and integrated (Carvalho et al., 2019). The results of the previous 21 years show a paradigm shift towards integrated thinking (Voulvoulis et al., 2017). Tools for root cause analysis and integrated strategy management should focus on effect-based triggers (Brack et al., 2017). In this research, we deal with the integrated analysis of the status of surface water bodies in Hungary, for which we use the tools of data- and network science.
Although the deadline of reaching the water policy target issued by the Water Framework Directive (WFD) was modified from 2015 to 2027, in 2019, more than half of the water bodies were in a degraded condition (Zingraff-Hamed et al., 2020). One of the main culprits of this is nutrient enrichment (Poikane et al., 2019), which is why we focus on nutrient sources in this study. It should be added that the assessment and management of diffuse pollution from agriculture is a key challenge, but the integration and coordination of effective measures to combat diffuse pollution remains an ongoing issue (De Vito et al., 2020). Ecosystems in river floodplains are particularly vulnerable and need to be given high priority for their restoration. However, trade-offs between rheophilic and stagnophilic aquatic organisms may prevent a compromise between ecological objectives with regard to restoration (Weigelhofer et al., 2020). This fact also underlines the need to support existing monitoring efforts with new types of monitoring tools (e.g., eDNA, impact-based tools, and functional tools) (Hunting et al., 2017). Monitoring campaigns designated based on expertise should be reviewed in the light of new scientific findings. One solution to this is to identify critical water bodies in water systems using network science tools. In Section 3, the basics of this methodological development will be presented. In addition to the trade-offs inherent in water management, synergistic effects can also be identified, such as improvements in water quality causing statistically significant, non-linear changes in recreational property values (Artell and Huhtala, 2017).
The watershed nutrient model MONERIS (MOdelling Nutrient Emissions in River Systems) was applied to the Hungarian part of the Danube River Basin, which examined the pollution pathways. Despite being a promising approach to estimating total diffuse load its development requires an overview of monitoring stations. Although this is a promising approach to better estimate the total diffuse loads, it requires a review of monitoring stations due to flow calibration (Jolánkai et al., 2020). The average annual evaporation rate is expected to increase slightly over the 21st century (Csáki et al., 2020), while in the case of runoff, a significant decrease is expected, which will involve changes in loads from urban areas. The long-term impacts on river basins, e.g., changes in flood patterns or ecological consequences and differences in assessment systems at the national level, justify the need for more integrated approaches. Following the WFD agenda, an emphasis should be placed on major impacts such as climate change impact analysis and resilient ecosystem-based management of water bodies (Hein et al., 2019).
This research looks for patterns in network data representation in Big Data on water quality and pollutant point sources. It is simply not possible to manage the growing volume/types of data in environmental and water management using traditional workflows (Sun and Scanlon, 2019). The outline of our proposed methodological development is summarized in Figure 1. Big data is already being used successfully in water management; typically, smart water meters report water quality and usage as well as alert a water company to leaks or potential contamination (Nie et al., 2020). In fact, it affects all the data we currently have and transforms it into knowledge that can be used directly to better manage treatment facilities. It follows that a Big data-based link between water quality and pollutant sources helps to build water management knowledge and develop strategies for achieving good ecological status according to the WFD.
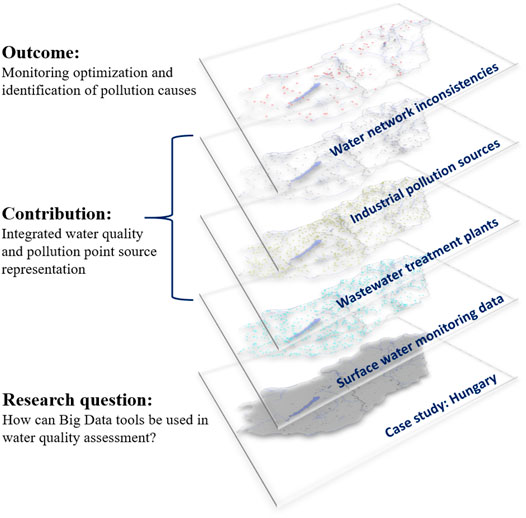
FIGURE 1. The workflow of the proposed network science based water quality evaluation method.
Figure 1 shows that an integrated water network has been created that includes surface water bodies (watercourses and lakes), municipal wastewater treatment plants, and industrial sources that are analyzed in a system by following a new holistic approach.
The Water Quality Index (WQI), of which the presented analysis covers a significant part of the variable set, is often used to characterize water quality by aggregation methods (Kachroud et al., 2019). Although aggregation methods provide concise information for monitoring and controlling the quality of water bodies, which is understandable as far as stakeholders are concerned (De Paul Obade and Moore, 2018), but it must be pointed out that there is a loss of information in the aggregation step. Reconciling model data into consistent data sets is an important requirement, as our knowledge of interactions between river pollutants on the larger scale is limited. Furthermore, we need to better link the results of multi-pollutant river modeling with other areas of research and integrate the results into policy (Strokal et al., 2019). This recognition and the foundation of multi-pollutant models are aided by this research, which addresses different water quality variables in an integrated manner. Romero et al. presented the possibility of applying big data tools in the water quality sector, exploring new links between chemicals, the environment and human health, moreover, it was highlighted that a better understanding of pollutants (origins, pathways and persistence) can be achieved by using Big Data (Ponce Romero et al., 2017), which we also aimed to apply in this analysis.
Water quality studies highlight the anthropogenic impact through diffuse loading of streets, domestic as well as industrial wastewater, and even drainage water from agricultural areas of the basin as the main drivers of eutrophication. The results of a study by Oliver et al. (2019) study confirm that informal settlements without health infrastructure exacerbate the deterioration of water quality in urban water resources, thereby posing several risks to public health (Oliver et al., 2019).
Three different sources of pollution determine the status of water bodies. Point and/or diffuse pollutants from municipal, industrial and agricultural activities (General Directorate for Water Management, 2021). An important factor is missing from this grouping, namely the pollutant material transport from adjacent—hydraulically connected—water bodies. In this research, using the system-level network-based approach, neighbouring water bodies are also taken into account when identifying causal relationships, which cannot be achieved with classical water quality analysis methods.
The proposed method is based on data extracted from Geographic Information Systems (GIS). GISs have been utilized in several studies to analyze and monitor surface water quality networks. GIS coupled with remote sensing has been used to assess the urbanization impact of surface water bodies (Sridhar and Sathyanathan, 2020). Furthermore, the quality of groundwater and surface water regarding its main hydrochemical features and processes has been characterized by combining Positive Matrix Factorization with GIS (Zanotti et al., 2019). Water quality models have recently been combined with network design methods (Jiang et al., 2020). Spatially correlated patterns have been defined between water bodies and the frost risk (Louka et al., 2020), spatial correlations with epidemiological data about time and the space distribution of water-borne diseases to support disease monitoring and define pollution sources and their impacts (Karuppaiah et al., 2021).
Accurate and efficient monitoring point location identification and selection are required to design water quality monitoring networks. To improve water quality, the benefits of network-based integrated management of water bodies and monitoring points have been demonstrated previously, using multivariate statistical methods in the Paraopeba River Basin (Calazans et al., 2018). Alilou et al. recommended a practical methodology for critical sampling points of the non-point sources (Alilou et al., 2018), that can be complemented by our network-based point source impact identification approach.
A spatial autocorrelation-based model has been applied to study the distribution pattern of pollutants across the catchment of a river (Ginebreda et al., 2018). Autocorrelation was already applied for 235 emerging contaminants measured at 55 sampling sites in the Danube River (Mainali et al., 2019). The study quantified the spatial autocorrelation of pollutants at a catchment scale of a river, developed spatial auto-regressive models for the measured compounds, estimated their correlation lengths, and assessed the applicability of the method in terms of monitoring. Geostatistical predictive models of microbial water quality were also developed based on spatio-temporal autocorrelation (Holcomb et al., 2018).
Network-based monitoring is essential to resolve the spatial and temporal variations in water quality (Chen et al., 2012). Studies have been performed to identify and monitor water quality as well as pollution sources of natural water bodies in addition to optimizing sampling points and frequencies (Chen et al., 2012). An emergency monitoring network for river chemical spills has been proposed by combining discrete entropy theory and spectral analysis with contaminant transport modelling (Shi et al., 2018). A water quality monitoring network was built using a spatially referenced water quality model and a genetic algorithm to assess E. coli loads in the basins of the Guadalupe River and San Antonio Rivers (Puri et al., 2017). The regional connectivity of surface water bodies in Western Australia has been analyzed based on the temporal analysis of water body connectivity using graph theory to support conservation planning Tulbure et al. (2014). Furthermore, an ecological network model was established that identifies the integrity and complexity of the urban water metabolism system-integrated metabolic process of physical and virtual water (Cui et al., 2021).
The aim of this work is to provide a framework for the examination of water quality parameters of surface water bodies by integrating the benefits of the networked-based and spatial autocorrelation-based analyses. The key idea of the proposed method is that the identification of neighbourhood-type (direct or indirect) relationships in water networks facilitates the design of optimal monitoring points and water quality improvement actions. The method explores the impact of the connections between hydraulically connected water bodies by the statistical analysis of a labeled directed network, which is one of the main novelties and benefits of this research.
In the following, the reader is guided through the methodology of the network-based topological analysis of water bodies in Section 2. While in Section 3, the proposed approach is applied for Hungarian water bodies, followed by the analysis and discussion of the results in Section 4.
2 NETWORK-BASED TOPOLOGICAL ANALYSIS OF WATER BODIES
This section discusses the developed methodology that enables the network of water bodies to be analysed systematically. The network is built as follows:
Nodes represent the network of water bodies and resources, i = 1, … , N. The structure of the network is defined by an N × N-sized adjacency matrix, where ai,j = 1 if water body i flows into water body j. The structural distance of the water bodies is included in matrix D, where di,j denotes how many steps it takes to get from water body i to water body j. The measurements of the ith water body are in an nt × nm-sized matrix Xi, where the number of measurements is denoted by ny.
Our study includes annual measurements from 2010 to 2020. The number of water quality parameters is nm = 11. These parameters are the following: “Chemical oxygen demand (CODCr)” “Chlorophyll-a” “Oxygen saturation” “Ammonium nitrogen (NH4-N)” “Conductivity” “Nitrate-nitrogen (NO3-N)” “Dissolved Oxygen” “Biological oxygen demand (BOD5)” “Total phosphorus” “Total nitrogen” “Orthophosphate”.
The measurements of the ith water body taken at a given time are indicated by xi,t, mth element of its column vector is the m = 1, … , nm measured data, xi,t,m. Missing data were imputed by linear interpolation.
The method is based on the modification of Geary’s C, a measure of spatial autocorrelation that is used to determine if adjacent measurements are correlated. The Geary’s C technique has already been utilized in water management, e.g., it has been used to identify and monitor areas of river plume caused by heavy rainfall in Lake Taihu from MODIS 250 m imagery (Zhang et al., 2016). The measures of spatial autocorrelations, Geary’s C and Moran’s I were also used between pairs of points of groundwater levels to identify their spatial and temporal behaviour in Western India, the study of which underlined that spatial statistics are efficient tools for geostatistical modeling (Machiwal et al., 2012).
We adopted Geary’s C spatial autocorrelation measure to handle the proposed water network model as follows:
where Ct,m represents the autocorrelation at the tth time of the mth variable,
Similarly, we also adapted Moran’s I spatial autocorrelation (Moran, 1950), which assesses the pattern of a data set spatially and determines if it is dispersed, clustered, or random based on the locations:
where N denotes the number of spatial units indexed by i and j, W stands for the sum of all wij, while
The Moran’s I correlation is inversely related to Geary’s C measure as It,m values below −1/(N − 1) refer to negative spatial autocorrelations, while It,m values above −1/(N − 1) indicate positive spatial autocorrelations. It has to be noted, there is no direct relationship between the two measures, so it is beneficial to use both information sources in combination. Geary’s C measures the correlation at the local level, while Moran’s I provides information at the global level.
Further novelty of the proposed method is that contributions of the water bodies to the autocorrelation measure are calculated to evaluate their dependency.
The contribution of the interactions between two water bodies to the autocorrelation can be calculated based on their standardized concentration difference:
where
The water network can be evaluated based on the aggregation of multiple time periods, so the proposed values can be averaged in time:
The values can also be aggregated according to the studied water quality measurements, so the general indicators of the spatial dependence can be calculated as:
By sorting the variables Cm, at the beginning of the sequence, the placed variables will have a greater spatial correlation, which means that their values are less influenced by external factors. Going backwards in this specific order, this correlation decreases, which shows that the effect of local external factors is increasing or indicates a crisp water body type boundary.
The dependence of the water bodies can also be evaluated by calculating the local spatial autocorrelation around them:
when there is no inflow, and
The water bodies can be ranked according to this value. Our assumption is that this value represents how the water body is isolated, as
In this work, we study the position of these water bodies in the network. Our assumption is that these nodes will be closer to the pollution sources, especially they are the recipient water bodies of them.
3 FORMATION OF THE NETWORK OF HUNGARIAN WATER BODIES
The applicability of the proposed method is tested based on a network of Hungarian water bodies. The number of analysed watercourses, lakes, wastewater treatment plants and industrial pollution sources are indicated in Figure 2. 18,373 watercourses are found in Hungary, of which 1,117 water bodies have been designated in the River Basin Management Plan (General Directorate for Water Management, 2021). At the time of designation, 10 km2 was the lower limit of the catchment area. The length of the designated water bodies covers 27% of the length of all watercourses. In this analysis, 923 watercourses are analyzed based on the data available in the water management map (General Directorate for Water Management, 2015).
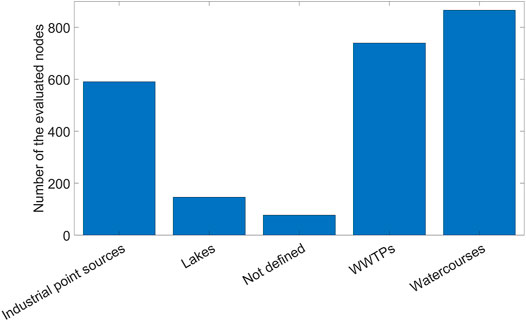
FIGURE 2. The number of analyzed watercourses, lakes, municipal wastewater treatment plants and industrial pollution sources.
With regard to lakes and wetlands, 9,123 registered elements can be identified in Hungary with a total area of 2,100 km2, of which 188 water bodies with a cumulated water surface of 1,190 km2 were formed after the mergers. An interesting hydrogeographical feature is that Lake Balaton—the largest natural shallow lake in Central Europe—alone accounts for 596 km2 (Sebestyén et al., 2017). In this analysis, 188 stagnant water bodies are examined in detail based on the data available on the water management map (General Directorate for Water Management, 2015).
For problems and challenges concerning water quality in Hungary to be comprehensively assessed, in our digital science approach, the water bodies are evaluated in the form of a network. Based on the water management map database (General Directorate for Water Management, 2015), surface water bodies (watercourses and stagnant waterbodies) can be described by a directed acyclic graph (DAC). The nodes of the network i = 1 … , N are represented by different surface water bodies. The water quality measurement data in the National Environmental Information System (NEIS) database are assigned to the nodes. Physical-chemical water quality parameters such as Ammonium Nitrogen (NH4-N), Biochemical Oxygen Demand (BOD5), Chemical Oxygen Demand (CODCr), Electrical Conductivity, Dissolved Oxygen, Nitrate Nitrogen (NO3-N), Orthophosphate (PO4-P), Oxygen Saturation, Phytoplankton (Chlorophyll-a), Total Nitrogen, Total Phosphorus and Turbidity will be evaluated from the last 10 years to establish the robustness of the relationships.
As one of the main causes of water quality deterioration, eutrophication is the manifestation of toxic cyanobacteria blooms, and it is mainly driven by nitrogen and phosphorus forms. In the modern interpretation, a great emphasis is placed on diffuse sources and treatment across the entire continuum (Le Moal et al., 2019). Climate change is not conducive to eutrophication management, as precipitation changes alone can significantly increase the nitrogen load in rivers. According to the analysis of Sinha et al., 2017) of the continental United States, this increase could be 19 ± 14% by the end of the century (Sinha et al., 2017). Climate change is accelerating eutrophication, and vice versa, as lakes and impoundments are important sources of methane (CH4), a powerful greenhouse gas. With increased eutrophication, CH4 emissions from these systems are expected to increase by 30–90%, corresponding to 18–33% of annual C O 2 emissions resulting from the burning of fossil fuels. (Beaulieu et al., 2019). Nitrogen exports are growing faster than the global nutrient load of phosphorus and this needs to be controlled based on an integrated approach, where the broader complexity of nutrient effects must be interpreted on a scale ranging from physiology to ecology (Glibert, 2017).
Although dissolved oxygen (DO) is one of the most commonly measured water quality parameters, its sources and sinks (atmospheric exchange, photosynthesis, respiration, etc.) are often unknown (Mader et al., 2017). The water quality parameters influencing dissolved oxygen, e.g., temperature, pH, BOD and phosphorus concentrations, are usually the most significant, however, under extreme conditions, the importance of alkalinity and bicarbonates increases (Tomić et al., 2018). According to future climate scenarios, an increase in the average surface water temperature of 4 °C will lead to a decrease in DO of 1 mg/L, which will be important in terms of managing fish habitats (Missaghi et al., 2017). Waterflow DO concentrations are affected by upstream environmental conditions, where an adequate upstream water quality has improved downstream conditions and vice versa (Null et al., 2017). Therefore, the interconnection with adjacent water bodies, which we also cover in this research, is an apparent analytical aspect. Water turbidity is an important parameter that influences the surface temperature of lakes, and thus the surface energy balance (Potes et al., 2012), which is closely related to changes in DO.
604 industrial pollution sources (point sources) and 772 municipal wastewater treatment plants (WWTP) are integrated into the model to identify the effects influencing the water quality of the Hungarian surface water bodies. The complex water management network model is shown in Figure 3.
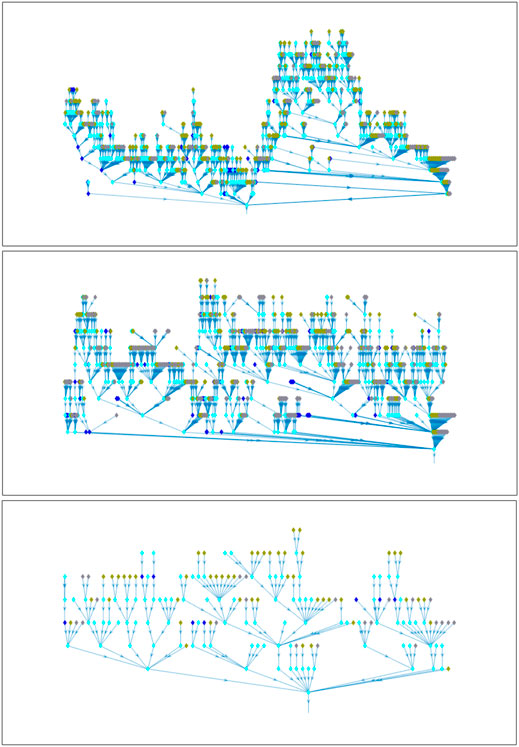
FIGURE 3. The three largest subnetworks of the Hungarian surface water bodies and pollution sources. The nodes of the directed graphs are coloured according to the node-types. Cyan blue nodes represent the watercourses, the dark blue nodes denotes the standing water, nodes marked in green are the municipal wastewater treatment plants (WWTPs) and grey nodes are the industrial emission sources.
In Figure 3, the cyan blue nodes indicate the watercourses, and the dark blue nodes are the standing water bodies. Municipal WWTPs are marked in green and industrial emissions in grey. One of the main novels approaches in the Water Framework Directive takes into consideration natural river basins. It follows that water bodies have also been designated according to specific basins. As the network of water bodies and pollution sources shown in Figure 3 is divided into three subnetworks, there is not always a direct relationship between water bodies located in separate river basins in the case of surface waters. This feature of the approach is crucial for water quality management.
Point sources and water bodies can be described by a total of 2,487 nodes. Given taht WWTPs or industrial sources whose primary recipient is not a surface water body but, for example, are discharged directly into the soil were neglected in the analysis; 32 wastewater treatment plants and 13 industrial sources were deleted. The three subnets shown in Figure 3 represent 1,090, 1,085, and 179 nodes. The remaining 67 nodes form an additional nine small detached subnetworks that are neglected in this comprehensive analysis. As a result, our proposed network-based water quality planning tool is presented through 2,354 nodes.
The spatial location of surface water bodies, wastewater treatment plants, and industrial sources examined in this analysis is shown in Figure 4.
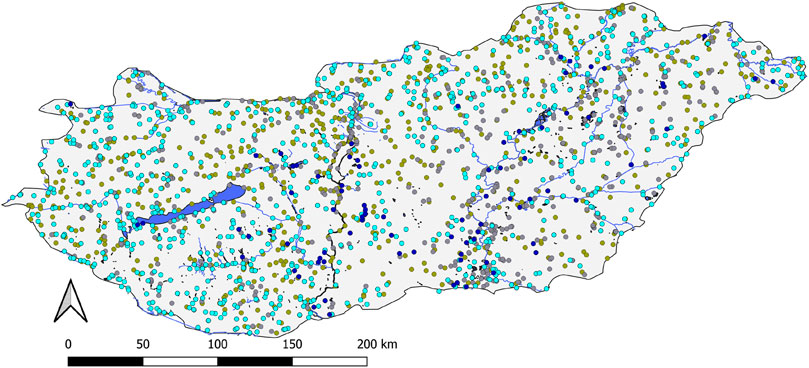
FIGURE 4. The location of the monitoring points and pollution sources - cyan blue nodes represent the monitoring points of watercourses, dark blue nodes refer to the location of monitoring points of lakes, nodes marked in green denote the location of the municipal wastewater treatment plants (WWTPs), and grey nodes show the locations of industrial emission sources.
Figure 4 shows that water quality monitoring points cover the entire territory of the country, so the proposed methodological approach facilitates decision support at the national basin level, sub-basin level and sub-unit level. The entire territory of Hungary lies in the Danube River Basin, the second largest river basin in Europe. The Danube River Basin is shared by 19 countries. The total area of the Danube River Basin District is 807, 827 km2, of which 11.52% belongs to Hungary (General Directorate for Water Management, 2021). Extending the water network topology to include international river basin districts would significantly support the unified management of transboundary river basins as well as the coordination of measures and monitoring activities.
As a result of our work, an integrated water management network is identified, where the 10-year time series of physical-chemical water quality data from 923 watercourses and 189 lakes (62,121 measurement point data) are compared with the emissions data of 772 municipal wastewater treatment plants and 604 industrial point sources according to the official data of the Hungarian River Basin Management Plan (RBMP).
4 Results and Discussion
Figure 5 shows the distribution of measurement data for watercourses and lakes. This overview contains all the time series data for each water body, thereby providing a comprehensive picture of the range and frequency of water quality parameters in Hungarian surface waters, which is a good indication of our remaining Water Framework Directive good ecological status tasks.
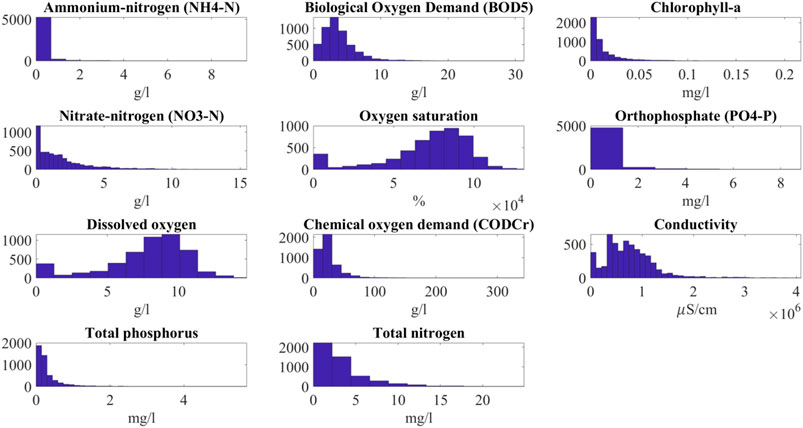
FIGURE 5. The distribution of the water quality parameters in the Hungarian surface water bodies.
Figure 5 shows that Ammonium-nitrogen (NH4-N) occurs in most cases at concentrations below 0.001 g/L, with a Biological Oxygen Demand (BOD5) below 0.015 g/L in the majority of cases, followed nicely by the distribution of the Chemical Oxygen Demand (CODCr). The concentration of Chlorophyll-a is typically around 1 mg/L. The Nitrate-nitrogen (NO3-N) load of water bodies is below 0.01 g/L in most cases. However, the values of Oxygen saturation and Dissolved oxygen vary as can be seen in Figure 5. Orthophosphate (PO4-P) is found in very low concentrations, while Total phosphorus and Total nitrogen follow each other in a similar pattern according to the differences in their orders of magnitude. In terms of conductivity, the condition of water bodies varies from very low to high (
The exploratory analysis of the network topology of Hungarian water bodies (lakes and watercourses) according to water quality parameters is summarized in Figures 6, 7. In this representation, the difference in water quality between water bodies can be examined on the basis of their neighbourhood (hydraulically connected water bodies), from which the causal questions of the different pollution can be answered.
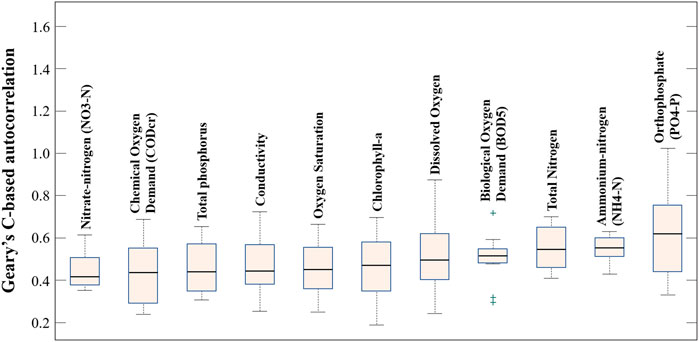
FIGURE 6. Geary’s C neighbouring dependence of the water quality parameters of Hungarian water bodies. Smaller values indicate higher local spatial autocorrelation.
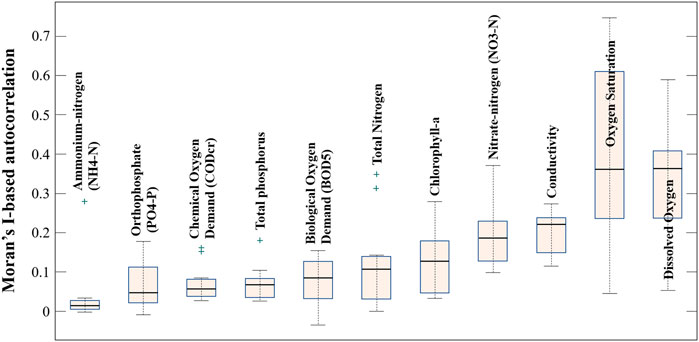
FIGURE 7. The Moran’s I neighbouring dependence of the water quality parameters of Hungarian water bodies. Higher values indicate higher global spatial autocorrelation.
In Figure 6, the physical-chemical water quality parameters of the Hungarian water bodies were sorted in ascending order from left to right based on their Geary’s C measure of spatial autocorrelation. Values close to one denote no spatial autocorrelation, while those above one indicate a negative spatial autocorrelation. Therefore, from left to right, values become more independent from the local effects. The boxplot indicates the standard deviation over the last 10 years. Based on the network of time series data, it can be seen that the dynamics of the Nitrate-nitrogen (NO3-N), Chemical oxygen demand (CODCr) and Total phosphorus parameters differ the most from the network as a whole, i.e. these water quality parameters are determined mainly by the local environment. In contrast, the Total nitrogen, Ammonium-nitrogen (NH4-N) and Orthophosphate (PO4-P) parameters were least influenced by local effects, i.e., their dynamics match those observed in other water bodies. Differences in the dynamics of water quality parameters are crucial with regard to the design of water quality monitoring systems, as one monitoring point that observes several water bodies is sufficient for consistent sections of the water network (exploratory monitoring), while more detailed or continuous monitoring activities are recommended for inconsistent sections.
In Figure 7, the physical-chemical water quality parameters of the Hungarian water bodies were sorted in ascending order from left to right based on their Moran’s I measure of spatial autocorrelation as well. The values of I were usually between -1 and +1. Values closer to one refers to positive spatial autocorrelation, while lower ones indicate more negative spatial autocorrelation. Since Moran’s I and Geary’s C are inversely related but not identical, from left to right, values become more dependent on external factors. Based on Figure 7, Ammonium-nitrogen (NH4-N), Orthophosphate (PO4-P), and Chemical oxygen demand (CODCr) are the least dependent parameters, while the parameters of Dissolved oxygen, Oxygen saturation and Conductivity are more determined by local factors. The boxplot indicates the standard deviation of the measured immission values over 10 years.
In Figure 8, the interconnectedness of Moran’s I and Geary’s C measures of spatial autocorrelation are visualized. The Moran’s I-based spatial autocorrelation is on the horizontal axis, while the Geary’s C-based spatial autocorrelation is on the vertical axis. Water quality parameters approaching the bottom right-hand corner indicate positive spatial autocorrelation. Note that Moran’s I is a measure of global spatial autocorrelation, while Geary’s C is more sensitive to local spatial autocorrelation. It should be noted that Dissolved oxygen, and Oxygen saturation are local features. Similar environmental effects, which affect larger areas spatially correlates better according to Moran’s I than Geary’s C. However, Geary’s C is more sensitive to local spatial autocorrelation parameters such as Total phosphorus and Chemical oxygen demand (CODCr).
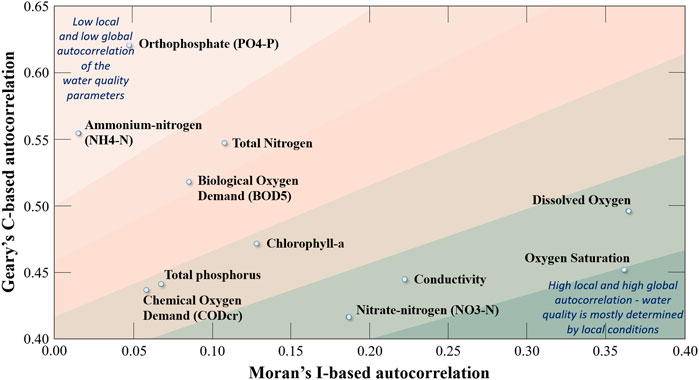
FIGURE 8. The integrated interpretation of the Moran’s I and Geary’s C spatial autocorrelation measures of the water quality parameters of Hungarian surface water bodies (spatial autocorrelation decreases from darker green to light brown in the bivariate representation, taking into account the different characteristics of the proposed new combined Geary’s and Moran’s measures).
The spatial correlation of point pollution sources on water quality parameters of hydraulically connected water bodies (neighborhood) has been explored in researches. Water quality parameters are evenly related to the water bodies’ structure and connectivity (Deng, 2019). At the same time, areas with different degrees of pollution affect the extent and range of water quality concentration in varying degrees (Zhang et al., 2018). A study on the water quality monitoring of Western Bug River (Ukraine) identified points of pollution loads and pollution pathways (Hagemann et al., 2014). It shows that the inflow of water bodies with different water quality parameters significantly impacts its physical-chemical parameters. The inflow of the Poltva River (lowest quality) decreased the oxygen content to 40% or less at the confluence and increased Phosphate concentration which indicates the pollution load from the wastewater treatment plant near the Poltva River. However, self-purification processes were observed along Dobrotvir Reservoir, which on the other hand, is the most significant discontinuity in the hydromorphology of the Western Bug River. It resulted in a decrease in Ammonium-nitrogen, Nitrate-nitrogen, Orthophosphate phosphorous, while the concentration of, e.g., Biochemical oxygen demand increased (Hagemann et al., 2014). The study of Kuczynska et al. also underlines that external pollution sources, e.g., wastewater treatment plants and drainage systems located close to the river, highly affect the concentration of nitrate and ammonium at the inflow and also downstream (Kuczyńska et al., 2021).
Figure 9 represents the distribution of the spatial dependence of surface water bodies. On the horizontal axis, the Geary’s C-based
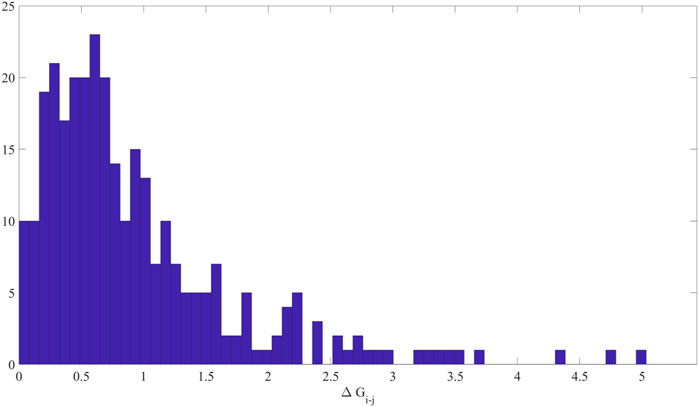
FIGURE 9. Distribution of the proposed local dependency measure for the improvement and monitoring planning of surface water bodies.
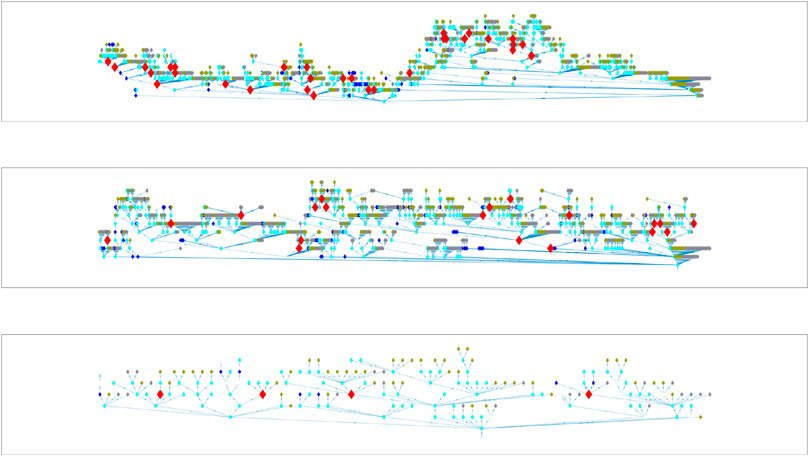
FIGURE 10. The location of the critical water bodies in the network according to their influent dependencies.
In Figure 10, the labeled directed-graph of Hungarian surface water bodies and pollution sources is represented. Furthermore, water bodies with
In the case of water bodies with a higher local impact identified by the proposed methodology, it is advisable to examine the sources in their immediate vicinity, which are summarized on the map (Figure 11).
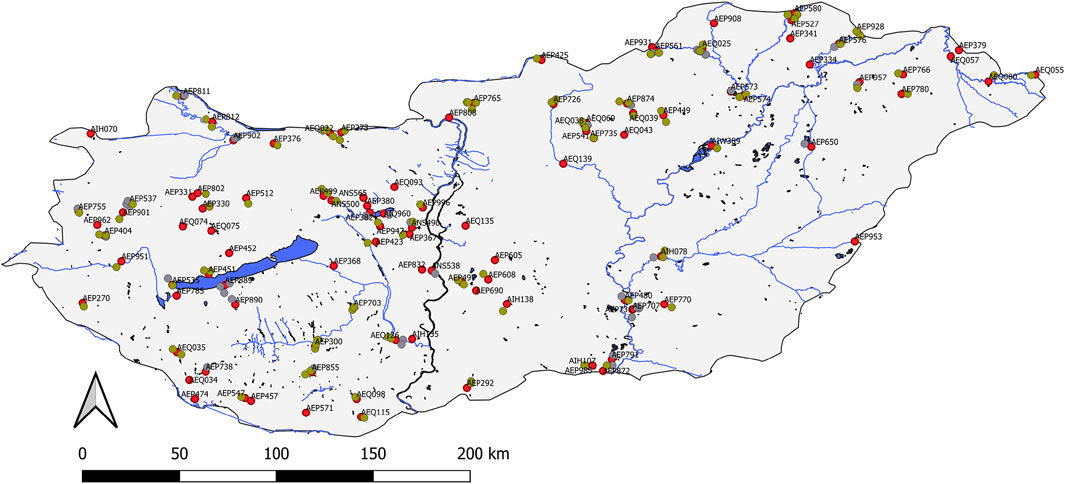
FIGURE 11. The critical nodes of the water network and their pollution sources within the 5 km buffer area.
In Figure 11, red circles denote water bodies that exhibit different dynamics by analysing time series data for water quality parameters. As the analyses also take into consideration the status of neighbouring nodes, it is appropriate to examine the pollution sources for which these water bodies are the recipient water bodies. In Hungary, the distance between the polluting point sources and the recipient water bodies is usually less than 5 km, so the range of sources within 5 km of the inconsistent water bodies has been filtered out. Within this 5 km radius of the 106 critical monitoring points shown in Figure 11, 101 WWTPs and 61 industrial sources are found.
Based on the physical-chemical classification intervals defined in the River Basin Management Plan (General Directorate for Water Management, 2021), the physical-chemical statuses of water bodies according to the Water Framework Directive were assessed for the entire time series, which is summarized in Figure 12 for each water quality parameter.
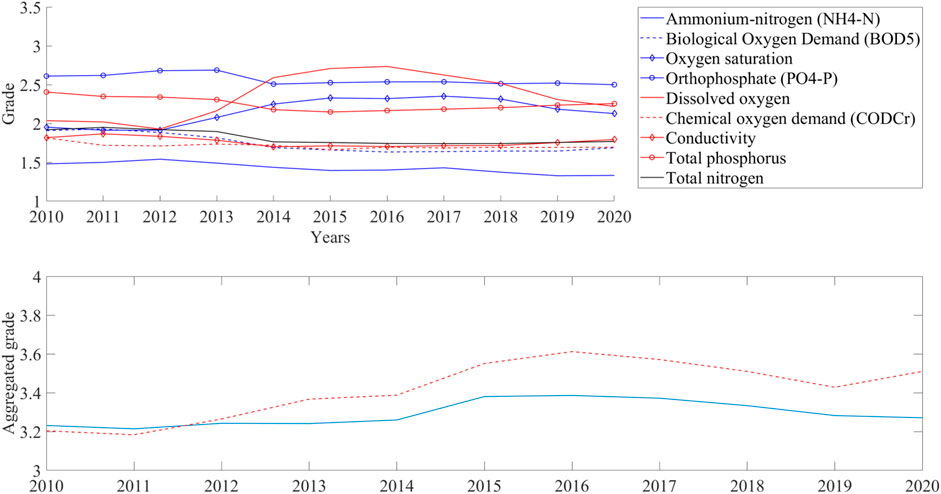
FIGURE 12. The annual average quality of watercourses (1-Excellent/Good, 2-Good/Moderate, 3-Moderate/Weak, 4-Weak/Bad) according to the Hungarian RBMP.
Figure 12 represents the global annual change in physical-chemical water quality parameters. The labelling of each water quality parameter is indicated in this figure. On the upper plot, the vertical axis shows how good the parameters are. Four categories are distinguished: 1-Excellent/Good, 2-Good/Moderate, 3-Moderate/Weak, 4-Weak/Bad. Generally, in the case of water bodies, the best status observed is the Ammonium-nitrogen (NH4-N) water quality parameter, which has not changed significantly over the last 10 years. In terms of Chemical oxygen demand (CODCr), Total nitrogen and Conductivity, water bodies are found among the good and excellent quality classes. Dissolved oxygen and Oxygen saturation are the two water quality parameters that most hinder the achievement of good a ecological status according to the WFD at the national level. The lower coordinate system denotes the annual change in the average of the total water quality parameters with a blue line. The red dashed line shows the average change in the aggregated state of the identified 106 critical water bodies, which is better determined by local effects. As is shown in Figure 12, the status of these water bodies typically lags behind that of the national trend, thereby supporting our assumption that identifying the impact of neighbouring nodes (water bodies and pollution point sources) is an important task in achieving the good ecological status set by the Water Framework Directive. Since the WFD classification is based on the weakest class, the role of oxygen balance indicators in the physical-chemical status of water bodies is prominent, as is shown in Figure 12. Therefore, the aggregated quality class follows the pattern of these parameters. In addition to the characteristic changes in the physical-chemical status of water bodies, it is also important to identify their current status, which is shown in detail in Figure 13.
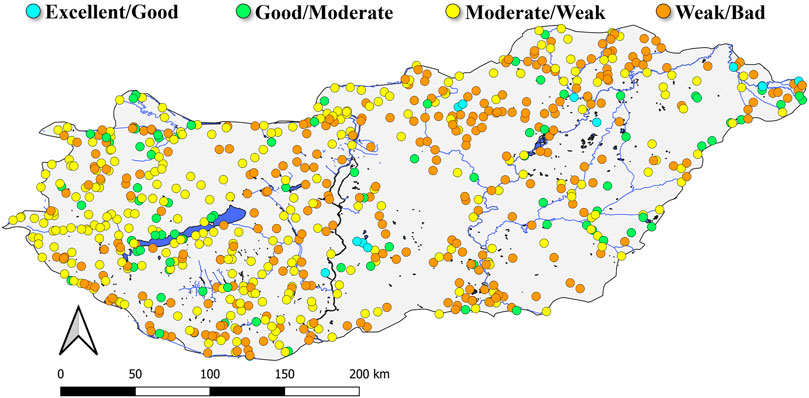
FIGURE 13. The quality classes of water bodies based on the physical-chemical parameters in 2020.
In Figure 13, the monitoring points of the water bodies were classified based on the measurement results recorded in 2020, thereby providing an overview of the latest physical-chemical status of surface watercourses using the classification of the Hungarian River Basin Management Plan. Based on the 2020 measurement data, 13 water bodies belong to the quality class Excellent/Good, 83 can be classified as Good/Moderate, 308 fall into the quality class of Moderate/Weak and 300 are categorized as Weak/Bad.
As the physical-chemical status of water bodies is typically determined by oxygen balance parameters (Figure 12), it is important to consider the “ex-ante” impacts of climate change on water quality improvement strategic planning. The amount of dissolved oxygen decreases as the temperature increases (Stefan and Fang, 1994), which is not expected to favour the improvement of these water quality parameters. Potential impacts of climate change on surface water quality and water bodies have been studied considering the average increase in global temperature, extreme events, heavy rainfall and floods, sea-level rise, droughts, etc. Changes in water quality parameters can reflect the effects of climate change on chemistry and water ecology (Salila et al., 2020). Extreme heat and increased global temperatures will likely cause an increase in the water temperature and biochemical reactions in streams (Yang et al., 2019), (Nguyen et al., 2017) as well as a reduction in Dissolved oxygen leading to the disappearance of some microspecies (Du et al., 2019), (Mehdi et al., 2018). In addition to the extreme heat, heavy rainfall and floods, hurricanes, wildfires, droughts cyclones as well as superstorms are likely to lead to an increase in Chlorophyll-a concentrations, as well as change the dynamics of nutrient loading, e.g. Total nitrogen and Total phosphorous, in water bodies (Yang et al., 2019), (Nguyen et al., 2017), (Mehdi et al., 2018), (Wang et al., 2018). Furthermore, these extreme events may accelerate the sedimentation process in water bodies, leading to an increase in Biochemical oxygen demand (BOD5), Chemical oxygen demand (CODCr), Dissolved organic carbon (DOC) and other pollutants. Due to dissolution processes, these pollutants can affect water quality and facilitate the spread of waterborne diseases (Yang et al., 2019), (Nguyen et al., 2017), (Mehdi et al., 2018), (Moshtaghi et al., 2018). Therefore, efficient design for water management must be designed efficiently to address the impacts of climate change on water quality parameters, which requires sectoral and institutional cooperation across the board (Whitehead et al., 2009). Furthermore, water quality monitoring protocols, environmental standards, compliance and reporting must take into consideration climate change scenarios (Crane et al., 2005). Greater emphasis should be placed on enhancing the simulation and optimization of future water resources management and planning in the context of climate change and socio-economic development (Phan et al., 2021), in particular the biological quality elements (Molina-Navarro et al., 2020), one of the supporting tools of which is the methodological development presented in this research.
In the future planning of surface water quality monitoring networks (WQMN), cost-effective solutions are needed for sustainable operation, which requires the rethinking of the existing stations. Identifying critical parameters is crucial for data-driven model development (Chen et al., 2020). The impacts of climate change must also be considered in the planning of WQMNs. Gamma Test theory (GTT) can be used to simplify the water quality monitoring network (Azadi et al., 2021); however, the identification of critical water bodies is essential, which this methodological development proposes by defining a new type of indicator. The proposed algorithm can support the development of WQMN at the selection of the measurement places and the critical parameters, but the details of the system, like sampling frequencies, should be determined based on design experiences and model-based analysis and optimization (Jiang et al., 2020).
5 Conclusion
This research has laid the foundations of a network analysis-based water quality assessment framework. The applicability of the method was demonstrated through a comprehensive analysis of surface water bodies in Hungary. The Water Framework Directive (WFD) has set a tight Agenda for achieving a good ecological status, which requires an understanding of water quality contexts and targeted water quality improvement measures.
The time series physical-chemical water quality parameters of Hungarian surface water bodies were integrated in the form of a network with the pollution point sources identified by the River Basin Management Plan (RBMP), where the impact of municipal wastewater treatment plants and industrial point sources were analyzed.
The results highlight that with the help of the proposed network-based autocorrelation measure, it is possible to identify the sensitivity of the water quality to the neighbouring pollution sources, for which most of the applied water quality assessment methodologies are unsuitable.
Since the integrated pollutant-reachability-water quality representation reveals system-level inconsistencies in water quality, the developed approach supports the targeted review of monitoring points. In the case of the Hungarian water network, 106 critical water bodies were identified based on this approach. The results confirmed that the water quality of the identified water bodies is more critical than the average.
Based on the physical-chemical quality classes of the River Basin Management Plan, the classification of water bodies was performed over time, indicating that one of the main obstacles to achieving a good ecological status is oxygen homeostasis. Furthermore, the average deterioration in the status of water bodies that are more dependent on the identified local impacts draws attention to the importance of the systemic identification of impacts, which may be further hampered by the effects of climate change. Therefore, this should be given high priority in the planning of water quality improvement measures.
This proposed method contributes to the design of water quality monitoring networks (WQMN), which will need to be addressed in the future through the integration of modern sensor technologies, modeling, machine learning, big data, and remote sensing solutions.
Data Availability Statement
The raw data supporting the conclusion of this article will be made available by the authors, without undue reservation.
Author Contributions
VS and JA contributed to the conception and design of this study as well as performed material preparation, data collection and analysis. The results were visualized and validated by VS and JA, who also supervised the research activity. The original draft of the manuscript was written by VS, TC, and JA. All authors read and approved the manuscript.
Funding
This research was funded by project NKFIH-471-3/2 021 of the National Laboratory for Climate Change.
Conflict of Interest
The authors declare that the research was conducted in the absence of any commercial or financial relationships that could be construed as a potential conflict of interest.
Publisher’s Note
All claims expressed in this article are solely those of the authors and do not necessarily represent those of their affiliated organizations, or those of the publisher, the editors and the reviewers. Any product that may be evaluated in this article, or claim that may be made by its manufacturer, is not guaranteed or endorsed by the publisher.
References
Alilou, H., Moghaddam Nia, A., Keshtkar, H., Han, D., and Bray, M. (2018). A Cost-Effective and Efficient Framework to Determine Water Quality Monitoring Network Locations. Sci. Total Environ. 624, 283–293. doi:10.1016/j.scitotenv.2017.12.121
Artell, J., and Huhtala, A. (2017). What Are the Benefits of the Water Framework Directive? Lessons Learned for Policy Design from Preference Revelation. Environ. Resource Econ. 68, 847–873.
Azadi, S., Amiri, H., Mooselu, M. G., Liltved, H., Castro-Muñoz, R., Sun, X., et al. (2021). Network Design for Surface Water Quality Monitoring in a Road Construction Project Using Gamma Test Theory. Water Resour. Industry 26, 100162. doi:10.1016/j.wri.2021.100162
Beaulieu, J. J., DelSontro, T., and Downing, J. A. (2019). Eutrophication Will Increase Methane Emissions from Lakes and Impoundments during the 21st century. Nat. Commun. 10, 1375–5. doi:10.1038/s41467-019-09100-5
Brack, W., Dulio, V., Ågerstrand, M., Allan, I., Altenburger, R., Brinkmann, M., et al. (2017). Towards the Review of the European Union Water Framework Directive: Recommendations for More Efficient Assessment and Management of Chemical Contamination in European Surface Water Resources. Sci. Total Environ. 576, 720–737. doi:10.1016/j.scitotenv.2016.10.104
Calazans, G. M., Pinto, C. C., da Costa, E. P., Perini, A. F., and Oliveira, S. C. (2018). The Use of Multivariate Statistical Methods for Optimization of the Surface Water Quality Network Monitoring in the Paraopeba River basin, brazil. Environ. Monit. Assess. 190, 1–17. doi:10.1007/s10661-018-6873-2
Carvalho, L., Mackay, E. B., Cardoso, A. C., Baattrup-Pedersen, A., Birk, S., Blackstock, K. L., et al. (2019). Protecting and Restoring Europe's Waters: An Analysis of the Future Development Needs of the Water Framework Directive. Sci. Total Environ. 658, 1228–1238. doi:10.1016/j.scitotenv.2018.12.255
Chen, K., Chen, H., Zhou, C., Huang, Y., Qi, X., Shen, R., et al. (2020). Comparative Analysis of Surface Water Quality Prediction Performance and Identification of Key Water Parameters Using Different Machine Learning Models Based on Big Data. Water Res. 171, 115454. doi:10.1016/j.watres.2019.115454
Chen, Q., Wu, W., Blanckaert, K., Ma, J., and Huang, G. (2012). Optimization of Water Quality Monitoring Network in a Large River by Combining Measurements, a Numerical Model and Matter-Element Analyses. J. Environ. Manage. 110, 116–124. doi:10.1016/j.jenvman.2012.05.024
Crane, M., Whitehouse, P., Comber, S., Ellis, J., and Wilby, R. (2005). Climate Change Influences on Environmental and Human Health Chemical Standards. Hum. Ecol. Risk Assess. Int. J. 11, 289–318. doi:10.1080/10807030590925740
Csáki, P., Gyimóthy, K., Kalicz, P., Szolgay, J., Zagyvai-Kiss, K. A., and Gribovszki, Z. (2020). Multi-model Climatic Water Balance Prediction in the Zala River Basin (Hungary) Based on a Modified Budyko Framework. J. Hydrol. Hydromechanics 68, 200–210.
Cui, D., Zeng, W., Ma, B., Zhuo, Y., and Xie, Y. (2021). Ecological Network Analysis of an Urban Water Metabolic System: Integrated Metabolic Processes of Physical and Virtual Water. Sci. Total Environ. 787, 147432. doi:10.1016/j.scitotenv.2021.147432
De Paul Obade, V., and Moore, R. (2018). Synthesizing Water Quality Indicators from Standardized Geospatial Information to Remedy Water Security Challenges: a Review. Environ. Int. 119, 220–231. doi:10.1016/j.envint.2018.06.026
De Vito, L., Fairbrother, M., and Russel, D. (2020). Implementing the Water Framework Directive and Tackling Diffuse Pollution from Agriculture: Lessons from England and Scotland. Water 12, 244. doi:10.3390/w12010244
Deng, X. (2019). Correlations between Water Quality and the Structure and Connectivity of the River Network in the Southern Jiangsu plain, Eastern china. Sci. Total Environ. 664, 583–594. doi:10.1016/j.scitotenv.2019.02.048
Du, X., Shrestha, N. K., and Wang, J. (2019). Assessing Climate Change Impacts on Stream Temperature in the Athabasca River Basin Using SWAT Equilibrium Temperature Model and its Potential Impacts on Stream Ecosystem. Sci. Total Environ. 650, 1872–1881. doi:10.1016/j.scitotenv.2018.09.344
General Directorate for Water Management (2021). River Basin Management Plan Hungary - 2021 Discussion Material. in Hungarian. Availableat: http://vizeink.hu/wp-content/uploads/2020/12/VGT_Vitaanyag_1222.pdf. Online (Accessed January 9, 2021).
General Directorate for Water Management (2015). Water Geoinformatics Portal - Water Management Map. in Hungarian. Availableat: https://geoportal.vizugy.hu/atlasz/. Online (Accessed January 9, 2021).
Ginebreda, A., Sabater-Liesa, L., Rico, A., Focks, A., and Barceló, D. (2018). Reconciling Monitoring and Modeling: An Appraisal of River Monitoring Networks Based on a Spatial Autocorrelation Approach - Emerging Pollutants in the Danube River as a Case Study. Sci. Total Environ. 618, 323–335. doi:10.1016/j.scitotenv.2017.11.020
Glibert, P. M. (2017). Eutrophication, Harmful Algae and Biodiversity - Challenging Paradigms in a World of Complex Nutrient Changes. Mar. Pollut. Bull. 124, 591–606. doi:10.1016/j.marpolbul.2017.04.027
Hagemann, N., Blumensaat, F., Tavares Wahren, F., Trümper, J., Burmeister, C., Moynihan, R., et al. (2014). The Long Road to Improving the Water Quality of the Western Bug River (Ukraine) - A Multi-Scale Analysis. J. Hydrol. 519, 2436–2447. doi:10.1016/j.jhydrol.2014.01.013
Hein, T., Funk, A., Pletterbauer, F., Graf, W., Zsuffa, I., Haidvogl, G., et al. (2019). Management Challenges Related to Long‐term Ecological Impacts, Complex Stressor Interactions, and Different Assessment Approaches in the Danube River Basin. River Res. Applic 35, 500–509. doi:10.1002/rra.3243
Holcomb, D. A., Messier, K. P., Serre, M. L., Rowny, J. G., and Stewart, J. R. (2018). Geostatistical Prediction of Microbial Water Quality throughout a Stream Network Using Meteorology, Land Cover, and Spatiotemporal Autocorrelation. Environ. Sci. Technol. 52, 7775–7784. doi:10.1021/acs.est.8b01178
Hunting, E. R., de Jong, S., and Vijver, M. G. (2017). Assessment of Monitoring Tools and Strategies Safeguarding Aquatic Ecosystems within the European Water Framework Directive. Leiden, Netherlands: Leiden University Institute of Environmental Sciences, 35.
Jiang, J., Tang, S., Han, D., Fu, G., Solomatine, D., and Zheng, Y. (2020). A Comprehensive Review on the Design and Optimization of Surface Water Quality Monitoring Networks. Environ. Model. Softw. 132, 104792. doi:10.1016/j.envsoft.2020.104792
Jolánkai, Z., Kardos, M. K., and Clement, A. (2020). Modification of the MONERIS Nutrient Emission Model for a Lowland Country (Hungary) to Support River Basin Management Planning in the Danube River Basin. Water 12, 859.
Kachroud, M., Trolard, F., Kefi, M., Jebari, S., and Bourrié, G. (2019). Water Quality Indices: Challenges and Application Limits in the Literature. Water 11, 361. doi:10.3390/w11020361
Karuppaiah, C., Ramachandran, V., and Muthuraju, S. (2021). Role of Geographical Information System and Principal Component Analysis for Identifying Vulnerable Zone of Surface Water Epidemiology. doi:10.3390/ECERPH-3-08984
Kuczyńska, A., Jarnuszewski, G., Nowakowska, M., Wexler, S. K., Wiśniowski, Z., Burczyk, P., et al. (2021). Identifying Causes of Poor Water Quality in a Polish Agricultural Catchment for Designing Effective and Targeted Mitigation Measures. Sci. Total Environ. 765, 144125.
Le Moal, M., Gascuel-Odoux, C., Ménesguen, A., Souchon, Y., Étrillard, C., Levain, A., et al. (2019). Eutrophication: a New Wine in an Old Bottle? Sci. Total Environ. 651, 1–11. doi:10.1016/j.scitotenv.2018.09.139
Louka, P., Papanikolaou, I., Petropoulos, G. P., Kalogeropoulos, K., and Stathopoulos, N. (2020). Identifying Spatially Correlated Patterns between Surface Water and Frost Risk Using EO Data and Geospatial Indices. Water 12, 700. doi:10.3390/w12030700
Machiwal, D., Mishra, A., Jha, M. K., Sharma, A., and Sisodia, S. S. (2012). Modeling Short-Term Spatial and Temporal Variability of Groundwater Level Using Geostatistics and GIS. Nat. Resour. Res. 21, 117–136. doi:10.1007/s11053-011-9167-8
Mader, M., Schmidt, C., van Geldern, R., and Barth, J. A. C. (2017). Dissolved Oxygen in Water and its Stable Isotope Effects: a Review. Chem. Geology. 473, 10–21. doi:10.1016/j.chemgeo.2017.10.003
Mainali, J., Chang, H., and Chun, Y. (2019). A Review of Spatial Statistical Approaches to Modeling Water Quality. Prog. Phys. Geogr. Earth Environ. 43, 801–826. doi:10.1177/0309133319852003
Mehdi, B., Schulz, K., Ludwig, R., Ferber, F., and Lehner, B. (2018). Evaluating the Importance of Non-unique Behavioural Parameter Sets on Surface Water Quality Variables under Climate Change Conditions in a Mesoscale Agricultural Watershed. Water Resour. Manage. 32, 619–639. doi:10.1007/s11269-017-1830-3
Missaghi, S., Hondzo, M., and Herb, W. (2017). Prediction of lake Water Temperature, Dissolved Oxygen, and Fish Habitat under Changing Climate. Climatic Change 141, 747–757. doi:10.1007/s10584-017-1916-1
Molina-Navarro, E., Segurado, P., Branco, P., Almeida, C., and Andersen, H. E. (2020). Predicting the Ecological Status of Rivers and Streams under Different Climatic and Socioeconomic Scenarios Using Bayesian Belief Networks. Limnologica 80, 125742. doi:10.1016/j.limno.2019.125742
Moran, P. A. P. (1950). Notes on Continuous Stochastic Phenomena. Biometrika 37, 17–23. doi:10.1093/biomet/37.1-2.17
Moshtaghi, B., Niksokhan, M. H., Ghazban, F., and Dalilsafaee, S. (2018). Assessing the Impacts of Climate Change on the Quantity and Quality of Agricultural Runoff (Case Study: Golgol River Basin). Irrig. Drain. 67, 17–28. doi:10.1002/ird.2211
Nguyen, H. H., Recknagel, F., Meyer, W., Frizenschaf, J., and Shrestha, M. K. (2017). Modelling the Impacts of Altered Management Practices, Land Use and Climate Changes on the Water Quality of the Millbrook Catchment-Reservoir System in South Australia. J. Environ. Manage. 202, 1–11. doi:10.1016/j.jenvman.2017.07.014
Nie, X., Fan, T., Wang, B., Li, Z., Shankar, A., and Manickam, A. (2020). Big Data Analytics and IoT in Operation Safety Management in under Water Management. Computer Commun. 154, 188–196. doi:10.1016/j.comcom.2020.02.052
Null, S. E., Mouzon, N. R., and Elmore, L. R. (2017). Dissolved Oxygen, Stream Temperature, and Fish Habitat Response to Environmental Water Purchases. J. Environ. Manage. 197, 559–570. doi:10.1016/j.jenvman.2017.04.016
O'Grady, J., Zhang, D., O'Connor, N., and Regan, F. (2021). A Comprehensive Review of Catchment Water Quality Monitoring Using a Tiered Framework of Integrated Sensing Technologies. Sci. Total Environ. 765, 142766. doi:10.1016/j.scitotenv.2020.142766
Oliver, S., Corburn, J., and Ribeiro, H. (2019). Challenges Regarding Water Quality of Eutrophic Reservoirs in Urban Landscapes: a Mapping Literature Review. Int. J. Environ. Res. Public Health 16, 40. doi:10.3390/ijerph16010040
Phan, T. D., Bertone, E., and Stewart, R. A. (2021). Critical Review of System Dynamics Modelling Applications for Water Resources Planning and Management. Clean. Environ. Syst. 2, 100031. doi:10.1016/j.cesys.2021.100031
Poikane, S., Kelly, M. G., Salas Herrero, F., Pitt, J.-A., Jarvie, H. P., Claussen, U., et al. (2019). Nutrient Criteria for Surface Waters under the European Water Framework Directive: Current State-Of-The-Art, Challenges and Future Outlook. Sci. Total Environ. 695, 133888. doi:10.1016/j.scitotenv.2019.133888
Ponce Romero, J., Hallett, S., and Jude, S. (2017). Leveraging Big Data Tools and Technologies: Addressing the Challenges of the Water Quality Sector. Sustainability 9, 2160. doi:10.3390/su9122160
Potes, M., Costa, M. J., and Salgado, R. (2012). Satellite Remote Sensing of Water Turbidity in Alqueva Reservoir and Implications on lake Modelling. Hydrol. Earth Syst. Sci. 16, 1623–1633. doi:10.5194/hess-16-1623-2012
Puri, D., Borel, K., Vance, C., and Karthikeyan, R. (2017). Optimization of a Water Quality Monitoring Network Using a Spatially Referenced Water Quality Model and a Genetic Algorithm. Water 9, 704. doi:10.3390/w9090704
Salila, E., Sharma, M. P., and Singh, R. (2020). Climate Change Impacts on Water Quality of Water Bodies-A Review. Ijecc 10, 26–37. doi:10.9734/ijecc/2020/v10i330185
Sebestyén, V., Németh, J., Juzsakova, T., Domokos, E., Kovács, Z., and Rédey, Á. (2017). Aquatic Environmental Assessment of Lake Balaton in the Light of Physical-Chemical Water Parameters. Environ. Sci. Pollut. Res. 24, 25355–25371.
Shi, B., Jiang, J., Sivakumar, B., Zheng, Y., and Wang, P. (2018). Quantitative Design of Emergency Monitoring Network for River Chemical Spills Based on Discrete Entropy Theory. Water Res. 134, 140–152. doi:10.1016/j.watres.2018.01.057
Sinha, E., Michalak, A. M., and Balaji, V. (2017). Eutrophication Will Increase during the 21st century as a Result of Precipitation Changes. Science 357, 405–408. doi:10.1126/science.aan2409
Sridhar, M. B., and Sathyanathan, R. (2020). Assessing the Spatial Impact of Urbanization on Surface Water Bodies Using Remote Sensing and GIS. IOP Conf. Ser. Mater. Sci. Eng. 912, 062069. doi:10.1088/1757-899x/912/6/062069
Stefan, H. G., and Fang, X. (1994). Dissolved Oxygen Model for Regional lake Analysis. Ecol. Model. 71, 37–68. doi:10.1016/0304-3800(94)90075-2
Strokal, M., Spanier, J. E., Kroeze, C., Koelmans, A. A., Flörke, M., Franssen, W., et al. (2019). Global Multi-Pollutant Modelling of Water Quality: Scientific Challenges and Future Directions. Curr. Opin. Environ. Sustainability 36, 116–125. doi:10.1016/j.cosust.2018.11.004
Sun, A. Y., and Scanlon, B. R. (2019). How Can Big Data and Machine Learning Benefit Environment and Water Management: a Survey of Methods, Applications, and Future Directions. Environ. Res. Lett. 14, 073001. doi:10.1088/1748-9326/ab1b7d
Tomić, A. Š., Antanasijević, D., Ristić, M., Perić-Grujić, A., and Pocajt, V. (2018). A Linear and Non-linear Polynomial Neural Network Modeling of Dissolved Oxygen Content in Surface Water: Inter- and Extrapolation Performance with Inputs’ Significance Analysis. Sci. Total Environ. 610, 1038–1046.
Tulbure, M. G., Kininmonth, S., and Broich, M. (2014). Spatiotemporal Dynamics of Surface Water Networks across a Global Biodiversity Hotspot-Implications for Conservation. Environ. Res. Lett. 9, 114012. doi:10.1088/1748-9326/9/11/114012
Voulvoulis, N., Arpon, K. D., and Giakoumis, T. (2017). The EU Water Framework Directive: From Great Expectations to Problems with Implementation. Sci. Total Environ. 575, 358–366. doi:10.1016/j.scitotenv.2016.09.228
Wang, X., Li, Z., and Li, M. (2018). Impacts of Climate Change on Stream Flow and Water Quality in a Drinking Water Source Area, Northern China. Environ. Earth Sci. 77, 1–14. doi:10.1007/s12665-018-7581-5
Weigelhofer, G., Feldbacher, E., Trauner, D., Pölz, E., Hein, T., and Funk, A. (2020). Integrating Conflicting Goals of the EC Water Framework Directive and the EC Habitats Directives into Floodplain Restoration Schemes. Front. Environ. Sci. 8, 225. doi:10.3389/fenvs.2020.538139
Whitehead, P. G., Wilby, R. L., Battarbee, R. W., Kernan, M., and Wade, A. J. (2009). A Review of the Potential Impacts of Climate Change on Surface Water Quality. Hydrological Sci. J. 54, 101–123. doi:10.1623/hysj.54.1.101
Yang, Q., Zhang, X., Almendinger, J. E., Huang, M., Chen, X., Leng, G., et al. (2019). Climate Change Will Pose Challenges to Water Quality Management in the St. Croix River basin. Environ. Pollut. 251, 302–311. doi:10.1016/j.envpol.2019.04.129
Zanotti, C., Rotiroti, M., Fumagalli, L., Stefania, G. A., Canonaco, F., Stefenelli, G., et al. (2019). Groundwater and Surface Water Quality Characterization through Positive Matrix Factorization Combined with GIS Approach. Water Res. 159, 122–134. doi:10.1016/j.watres.2019.04.058
Zhang, X., Luo, J., Zhao, J., Xie, J., Yan, L., and Yu, Z. (2018). Simulation of the Transboundary Water Quality Transfer Effect in the Mainstream of the Yellow River. Water 10, 974. doi:10.3390/w10080974
Zhang, Y., Shi, K., Zhou, Y., Liu, X., and Qin, B. (2016). Monitoring the River Plume Induced by Heavy Rainfall Events in Large, Shallow, Lake Taihu Using MODIS 250m Imagery. Remote Sensing Environ. 173, 109–121. doi:10.1016/j.rse.2015.11.020
Keywords: water quality, topological network, pollution control, water framework directive, digital water management
Citation: Sebestyén V, Czvetkó T and Abonyi J (2022) Network-Based Topological Exploration of the Impact of Pollution Sources on Surface Water Bodies. Front. Environ. Sci. 9:723997. doi: 10.3389/fenvs.2021.723997
Received: 11 June 2021; Accepted: 15 December 2021;
Published: 13 January 2022.
Edited by:
Anik Bhaduri, Griffith University, AustraliaReviewed by:
Mohamed Hassaan, National Institute of Oceanography and Fisheries (NIOF), EgyptIgor Cretescu, Gheorghe Asachi Technical University of Iași, Romania
Copyright © 2022 Sebestyén, Czvetkó and Abonyi. This is an open-access article distributed under the terms of the Creative Commons Attribution License (CC BY). The use, distribution or reproduction in other forums is permitted, provided the original author(s) and the copyright owner(s) are credited and that the original publication in this journal is cited, in accordance with accepted academic practice. No use, distribution or reproduction is permitted which does not comply with these terms.
*Correspondence: János Abonyi, janos@abonyilab.com