 Junhua Zhang1,2,3
 Guodong Li1,2,3*Shengyan Ding1,2,3*
 Huiwen Tian1,2Xiaojuan Ren1,2Man Liu1,2Yaping Zheng1,2
- 1Key Laboratory of Geospatial Technology for the Middle and Lower Yellow River Regions (Henan University), Ministry of Education, Kaifeng, China
- 2College of Geography and Environmental Science, Henan University, Kaifeng, China
- 3National Demonstration Center for Experimental Environment and Planning Education, Henan University, Kaifeng, China
Land use and sediment alluviation/deposition are the main factors influencing the vertical distributions of particles with different sizes and soil organic carbon (SOC) forms. Based on field investigation, experimental analysis, data analysis, soil particle characteristics, and the relationships with SOC compositions are studied in the typical alluviation/deposition area of Kaifeng–Zhoukou. In the soil profile, the particulate matter is mainly 10–50 μm and 50–250 μm in size with an average content of approximately 65%, the content difference within the same size particle range is small. There is a large content range of <1,000 μm particles, which is the main factor affecting the change in soil properties. The fractal dimension (D) of soil particles ranges from 2.21 to 2.78. The value of D of each layer in farmland is higher than that of each layer in woodland, and it has been observed that DNF(farmland in the nonflooded area) > DF(farmland in the flooded area) and DNW(woodland in the nonflooded area) > DW(farmland in the nonflooded area). The contents of particles smaller than 50 μm have a positive effect on D, and the particles exceeding 50 μm have a negative effect. The contents of 10–50 μm, <2 μm, 2–5 μm, and 5–10 μm particles and their dynamic variances are the root causes of the D differences in the farmland/woodland soil in the FA (the flooded area) and NFA (the nonflooded area). SOC components combine to a greater extent with silt and clay that are <10 μm in size in the NF, and the stability is relatively high. The contents of the 10–50 μm and <10 μm particles are the main reasons for the differences in the soil active and nonactive organic carbon (AOC and NOC, respectively) contents in the FA and the NFA. The difference in D can reflect the change in SOC and its components and can be used as an index to characterize the variance in soil properties and quality. This study revealed the influences of the different particle sizes in the SOC components, which will expand and enrich the current area of study and further provide a basis to increase SOC and improve soil quality.
1 Introduction
Soil organic carbon is the carrier of different kinds of elements that support life; its decomposition and transformation products affect the cycles of nutrient elements (Duru et al., 2015; Jharna et al., 2018) and life processes in Earth surface systems, thus playing an important role in maintaining soil quality (Stockmann et al., 2015; Giulia et al., 2019) and stabilizing the ecosystem structure. At the same time, as the largest organic carbon storage source in terrestrial ecosystems, minute changes can negate the carbon balance and release processes among living systems and affect the CO2 content in the atmosphere, which can result in climate change (Wynn et al., 2006). The dynamic change and influence mechanisms of SOC have become a hot topic in recent years.
Soil particulate matter with different particle sizes constitutes the skeleton of structure formation, and the interaction with soil organic matter (SOM) can promote aggregate formation (Bottinelli et al., 2017) and SOC accumulation (Zheng et al., 2017), which is the dominant form of organic carbon. The turnover rate of SOC in aggregates is faster than that of the inorganic matter in the mineral particles, and the combination modes between the SOC components and different-sized particles and their conversion process affect the release or fixation of SOC and nutrient elements (Yılmaz et al., 2019; Sun et al., 2016). The content and particle size distribution (PSD) of particulate matter are the main controlling factors of SOC variation. At present, numerous studies on the distribution characteristics of clay, silt, and sand particles (Meysam, et al., 2019; Tian, et al., 2022) as well as the soil matter content and biological properties (Zhang et al., 2019; Yao et al., 2019; Stuart et al., 2009; Li et al., 2019; Racheal et al., 2019) have been carried out. Achievements have been made on the sources, structural characteristics, and stability of the SOC components and their relationship with the contents of clay, silt, and sand particles (Hang et al., 2014; Li et al., 2015; Zheng et al., 2011), and the results are obtained based on a coarse classification system of the particle size. Due to the complex dynamic relationship between the different size particles and every substance in soil, actual existing characteristics or mechanisms may be overlooked. The particle size was further subdivided on the basis of clay, silt, and sand classifications and was applied to the relationship between the Quaternary loess deposit or lake sequence stratigraphy characteristics and the paleoenvironment (Yang and Ding, 2017; Xu et al., 2006; Dong et al., 2014), but there are relatively few studies on the relationship between soil particles and SOC components based on subdivision classification. Since the size, shape, and stability of soil particles affect many ecological processes, the description and overall quantitative study of soil particle characteristics is of great importance by means of the fractal dimension method (Ma et al., 2020; Wang et al., 2019), which has become an effective path to analyze the relationships between soil physical properties and chemical/biological properties (Xu et al., 2021). Whether the relationships between the fractal dimension of the particle size and soil organic carbon can reflect the difference of each particle size and its relationship with soil organic carbon, it needs to be further verified for the simplified analysis and revealed internal mechanism.
The lower reach of the Yellow River is a silt alluviation/deposition plain formed by Yellow River flooding, and the plain is an important grain production area in China Agricultural production activity dominated by tillage is the main characteristic of the area. There is a prominent contradiction between the agricultural soils developed on the basis of Yellow River silt alluvium and the sustainable development of regional agriculture. How to increase the SOC content to improve soil fertility and comprehensive quality characteristics and alleviate the SOC consumption from high-intensity farming processes and the negative effects of climate change on sandy soil are the important problems in the development of agriculture in this region. In this study, based on a further subdivision of the size of clay, silt, and sand particles, taking the soil of the sediment alluviation and deposition region in the lower reach of the Yellow River as an example, the content and distribution of particles with different sizes are examined, and the dynamic relationships between the SOC components and each size particle are explored. The influence mechanisms of the different particle sizes on SOC ant its components will be revealed. It will be verified whether the fractal dimension can be a quantitative index reflecting the relationship between the soil particle size and soil organic carbon, thereby enriching the present research area and providing the basis for regional SOC enhancement and soil quality improvement.
2 Materials and Methods
2.1 The Study Area
The study area is located in the eastern plain in Henan province (32°10′-35°10′N, 114°-116°39′E). The terrain in the plain region is flat with an altitude of 40–100 m, belonging to the warm temperate zone and has a continental monsoon climate with four distinct seasons; the rainy season is hot, and the annual average temperature ranges from 13.93°C to 14.81°C, while the annual precipitation ranges from 600 to 874 mm. Affected by the sediment of the Yellow River, a mosaic distribution of sandy, loamy, and clay textures is formed, and sandy soil is dominant, accounting for 68% of the total sediments (Meng et al., 1998). After the Yellow River breached the riverbank at Huayuankou in 1938, water burst out the dyke. In the following 9 years, the Yellow River became a tributary of the Huai River, the river channel silted up and the fertile farmland was flooded. The Yellow River flooded an area larger than 20,000 m2 and passed through the three provinces of Henan, Anhui, and Jiangsu. The area flooded by the Yellow River in Henan province is located below Huayuankou and is located along the Jialu River and the Ying River from northwest to southeast, covering an area of 9,000 km2. The area accounts for 60% of the total area flooded by the Yellow River. The land use types are mainly dry land, urban and rural areas, residential and industrial land, woodland, and water bodies; crops grow twice a year, and the area is an important grain production area of China.
2.2 Sample Collection and Experiments
Soil samples are collected by the grid method. Based on the regional topographic map and the land use map, the spatial locations of sampling points are selected on the map. A 10 × 10 km grid is used during sampling, and various factors of land use distribution, planting mode, fertilization method, soil type, planting history, and accessibility are considered in the field when sampling; the preset sampling point positions are adjusted accordingly on the map. The soil profile depth is 100 cm, the interval is 20 cm, and there are five samples for each sample point in the profile. Finally, 237 samples were obtained. Among the samples, 18 woodland samples (W) and 78 farmland samples (F) were collected in the flooded area (FA), and 10 woodland samples (NW) and 131 farmland samples (NF) were collected in the nonflooded area (NFA).
The soil samples are air-dried and sieved indoors. Total organic carbon (TOC) is determined by the oil bath heating-K2Cr2O7 volumetric method (Huo and Li, 1986). The soil active organic carbon (AOC) is determined by KMnO4 oxidation (Loginow et al., 1987; Lefroy et al., 1993). The difference between TOC and AOC is the nonactive organic carbon (NOC). The contents of the particles with different sizes were measured using a laser particle analyzer (Mastersizer 3000, Malvern Company, United Kingdom) (Zhang et al., 2012a). A 15-ml 10% H2O2 solution was added to each 0.5 g soil sample to remove the soil organic matter, and a 20-ml 10% HCl solution was added to remove carbonate salts. Deionized water was added, and the liquid supernatant was then removed. Then, the pH was adjusted to 6.5–7. The 10-ml 0.05 ml/L sodium hexametaphosphate was added, and after ultrasonic vibration for 10 min, the percentage volume of particles was measured.
2.3 Data Analysis and Processing
The fractal dimension of the soil particle size is calculated as Eq. 1 (Tyler and Wheatcraft, 1992; Wang et al., 2005):
where D is the fractal dimension of the soil particle volume, VT is the total volume of soil particles, r is the soil particle diameter, V is the cumulative volume of the soil particles with a size smaller than R, R is the arithmetic mean of upper and lower limits within a graded range (μm), and λv is the maximum size of all particles (μm). SPSS 24.0 is used to generate data statistics and correlation analysis.
3 Results and Analysis
3.1 Distribution Characteristics of the Particles With Different Sizes Under the Influence of Land Uses
3.1.1 Distribution of the Particles With Different Sizes in the Soil Profile
In accordance with international and Chinese soil grading standards, the clay, silt, and sand are further subdivided into <2 μm, 2–5 μm, 5–10 μm, 10–50 μm, 50–250 μm, 250–500 μm, 500–1,000 μm, and 1,000–3,000 μm particles (Figure 1). The average content of the 10–50 μm and 50–250 μm fractions is approximately 65%, and the contents of the 2–5 μm, 5–10 μm, and 250–500 μm fractions are similar and range from 7 to 10%, while the content of the <2 μm particles ranges from 4.08 to 4.80%; the 1,000–3,000 μm particle content is less than 1%. The Fisher’s least significant difference method was used for multiple comparison, the content difference within the same size particle range is small in the soil profile except for the <2 μm particle size. It can be seen that the content range of the particles that are <1,000 μm in size is high, which is the main reason affecting the change in soil properties.
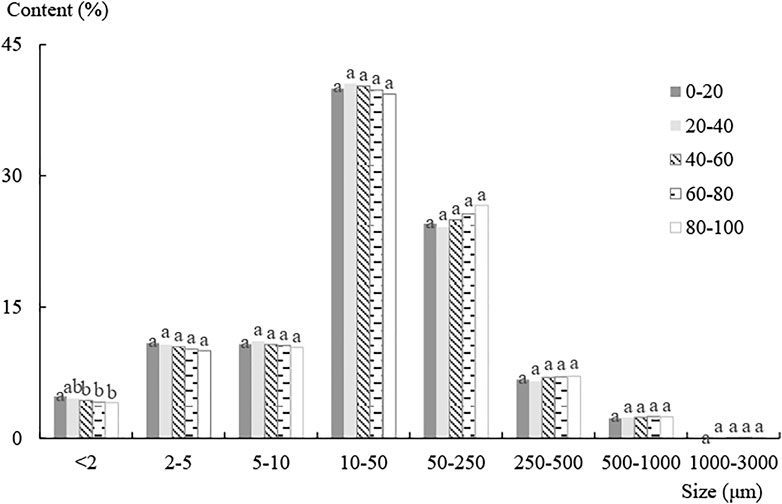
FIGURE 1. Average percentage distribution of the soil particles in the region. [Different lowercase letters indicate significant difference in the content of the same particle size in the soil profile (p < 0.05)].
In each layer of the 0–100 cm soil depth range in farmland (Figure 2), the average content of each particle size (<50 μm) is higher than that in woodland, while the 50–250 μm content (>50 μm) is lower; the difference between the other particle size contents (250–500 μm, 500–1,000 μm, and 1,000–3,000 μm) is small. Comparing the farmland/woodland soil in the FA with that in the NFA, the content of each particle size (<50 μm) in the farmland/woodland soil in the FA is lower than that in the farmland/forestland soil in the NFA, the average content of the <50 μm particles in FA and NFA is 66.34 and 52.29%, respectively. The contents of 50–250 μm and 250–500 μm (>50 μm) in the farmland/woodland soil in the FA are higher than those in the farmland/forestland soil in the NFA, the average content of the >50 μm particles in the FA and the NFA is 33.67 and 47.71%, respectively. There is no difference between the other particle sizes.
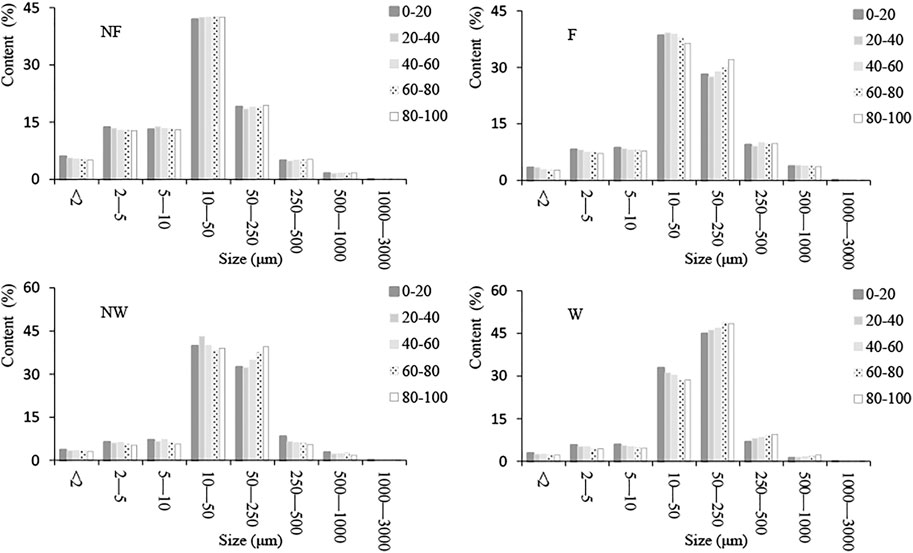
FIGURE 2. Average content distribution of the soil particles in the soil profile. (NW/NF is the woodland/farmland in the nonflooded area, and W/F is the woodland/farmland in the flooded area).
Whether in the FA or the NFA, in the soil profile for the same land use, the content of the same size particle has a certain difference from the surface layer to lower layers. These show that land uses and the sediment alluviation/deposition process are the main factors affecting the vertical distribution and spatial variability characteristics of the particles with different sizes.
3.1.2 D Characteristics of the Soil Particles in the Soil Profile
D ranged from 2.21 to 2.78, and the average value was approximately 2.50 (Table 1). For the same land use, D of the 0–40 cm layer is higher than that of the 40–100 cm layer, and the degree of variation in D is low in each layer in the soil profile. Based on the average values, D of each layer in farmland is higher than that of each layer in woodland, showing that DNF > DF and DNW > DW.
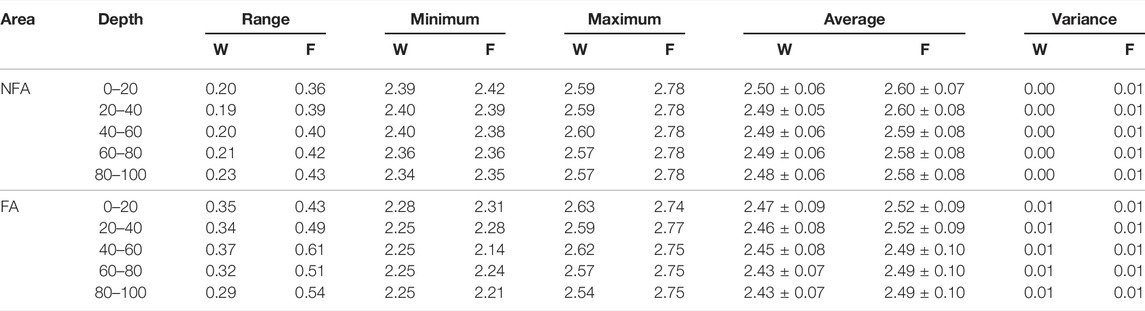
TABLE 1. D statistical characteristic of the particles in the woodland (W) and farmland (F) in the flooded area (FA) and the nonflooded area (NFA).
3.1.3 Relationship Between the Different Particle Sizes and D Characteristics
1) Correlation analysis between the soil particles and D
In the farmland profile, D of each layer is positively correlated with the <50 μm particle content, among which D is significantly positively correlated with the <2 μm, 2–5 μm, and 5–10 μm particle contents and significantly negatively correlated with the >50 μm particle content (except the 1,000–3,000 μm particle content) (Table 2). The difference is that the degree of significance and the correlation coefficient of positive correlation between D and the 10–50 μm particle content of each layer of the flooded farmland profile are greater than those of each layer of the nonflooded farmland profile; the results show that the contribution of the 10–50 μm particle content to D in the FA is greater than that in the NFA, which is also the main reason for the D difference in the flooded and nonflooded farmlands.
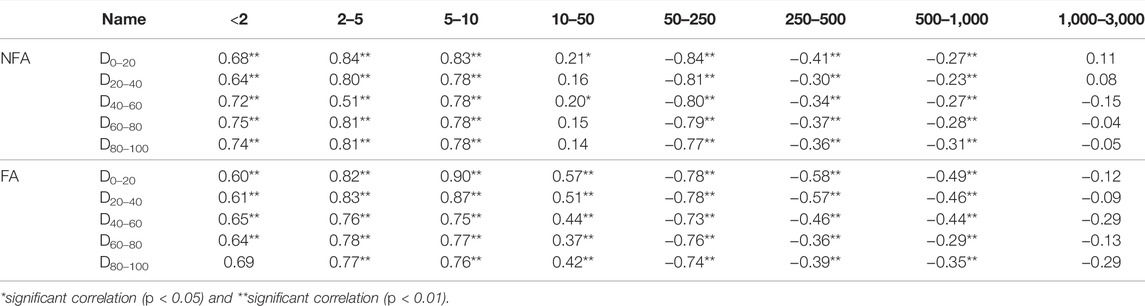
TABLE 2. Correlation analysis between the soil particles and D in the farmland in the flooded area (FA) and the nonflooded area (NFA).
For each layer of the woodland profile, the positive and negative relationships between D and the particles are consistent with those for each layer of the farmland profile. The relationships are separated by 50 μm as a boundary, where D is positively correlated with the <50 μm particles, among which D is significantly positively correlated with the <2 μm, 2–5 μm, and 5–10 μm particle size contents and significantly negatively correlated with the >50 μm particle size content (Table 3). The difference is that the degree of significance and correlation coefficient of the negative correlation between D and the 10–50 μm and 250–500 μm particle size contents of each layer of the flooded woodland profile are all greater than those of each layer of the nonflooded woodland profile, which indicates that the 10–50 μm and 250–500 μm particle contents are the main reasons for the fractal dimension difference between the flooded and nonflooded woodlands.
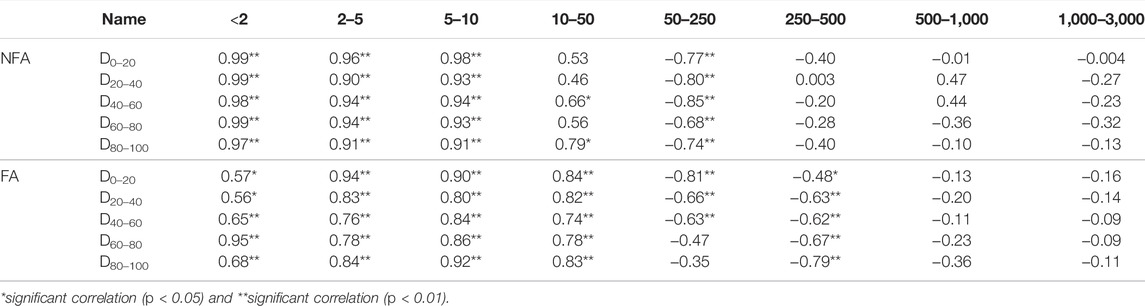
TABLE 3. Correlation analysis between the soil particles and D in the woodland in the flooded area (FA) and the nonflooded area (NFA).
The 50 μm size particle size can be used as a demarcation point to distinguish the D changes. The <50 μm particles have a positive effect on D, while the >50 μm particles have a negative effect on D. In farmland and woodland of the FA and the NFA, the 10–50 μm content is significantly higher than those of the other particle sizes, but the positive correlation of the 10–50 μm particles with D is lower than that of the <10 μm particles with D, which indicates that the contributions of the clay, fine, and medium silt particles <10 μm to D are higher than that of the 10–50 μm particles.
2) Content relationship between D and the different particle sizes
In each layer from 0–100 cm, there is a consistent change rule between D and the particle content in the FA and the NFA. Only the 0–20 cm and 20–40 cm layers are taken as examples, and the relationships are analyzed as shown in Figures 3–6. The dotted line is the trend line. The effect may not be considered because the 1,000–3,000 μm content is less than 1%. In the farmland and woodland, the <2 μm, 2–5 μm, and 5–10 μm contents show linearly increasing trends, and the 50–250 μm, 250–500 μm, and 500–1,000 μm contents exhibit linearly decreasing trends with increasing D, while the negative effect gradually decreases with an increasing particle size. The relationship between D and the 10–50 μm particles is affected by the content of the <2 μm, 2–5 μm, and 5–10 μm particles. When D is lower than 2.55, the content of the <2 μm, 2–5 μm, 5–10 μm, and 10–50 μm particles consistently increases with increasing D. When D exceeds 2.55, the positive relation with D increases with an increasing content of the <2 μm, 2–5 μm, and 5–10 μm particles, but the content of 10–50 μm exhibits an opposite change with D, namely, a decreasing trend.
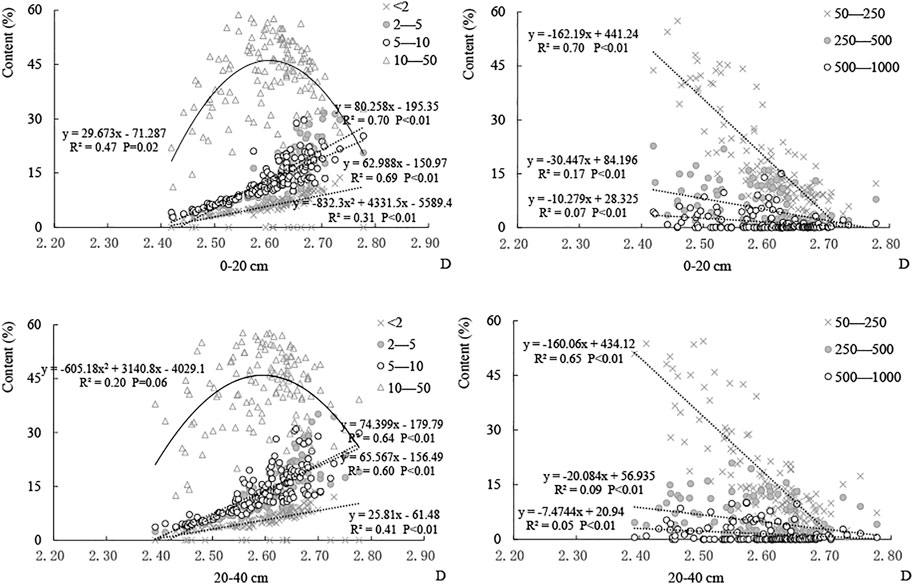
FIGURE 3. Content relationship between D and the particle size in the farmland (NF) in the nonflooded area.
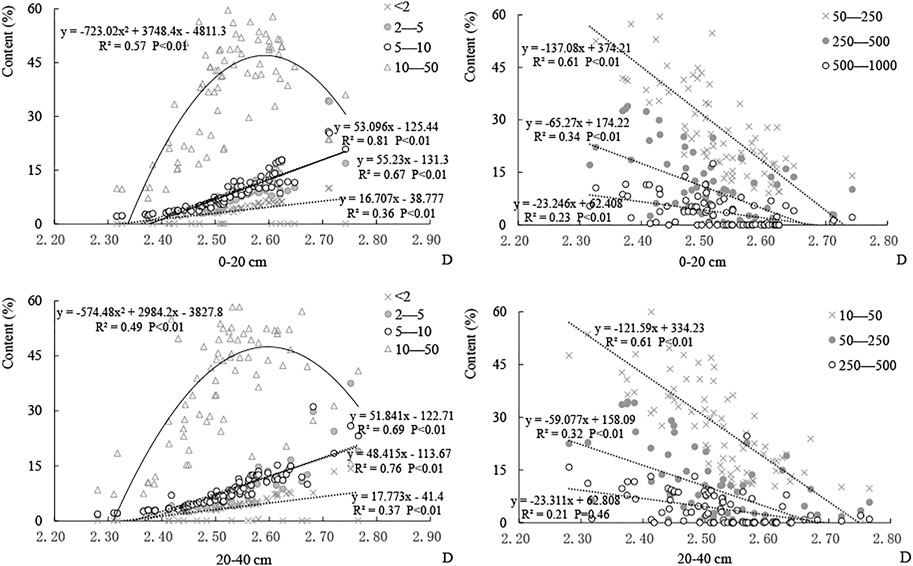
FIGURE 4. Content relationship between D and the particle size in the farmland (F) in the flooded area.
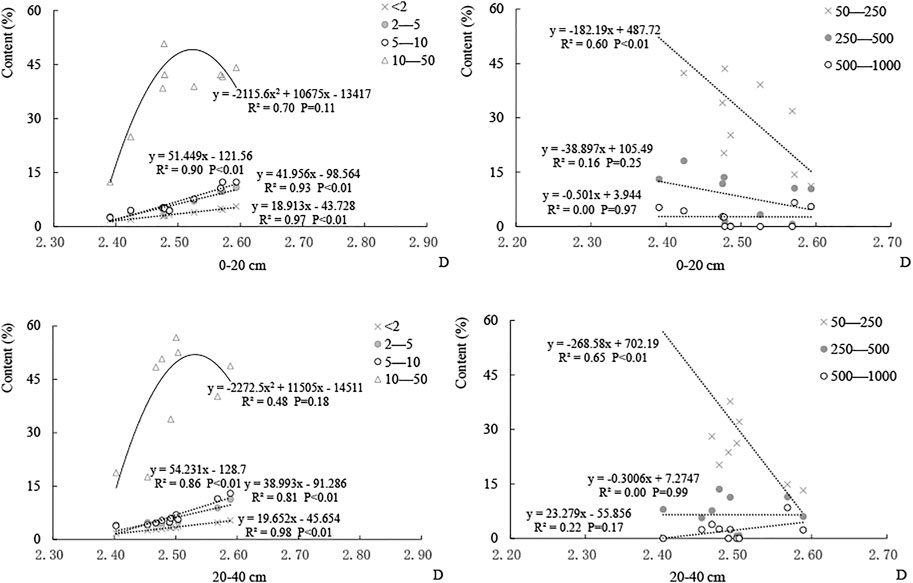
FIGURE 5. Content relationship between D and the particle size in the woodland (NW) in the nonflooded area.
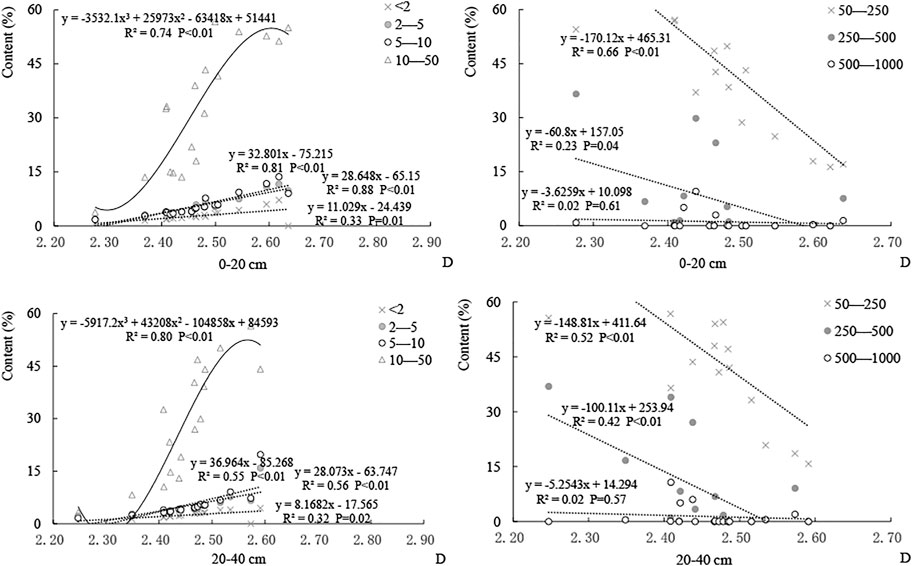
FIGURE 6. Content relationship between D and the particle size in the woodland (W) in the flooded area.
Although there are few soil sample points in the woodlands, the aforementioned rules also apply. Therefore, the 10–50 μm, <2 μm, 2–5 μm, and 5–10 μm particle contents and their dynamic variances are the root causes of the D difference in farmland/woodland in the FA and the NFA.
3.2 Relationship Between the SOC Components and the Different Particle Sizes Under the Influence of Land Use
3.2.1 Content Characteristics of the SOC and Its Components in the Profile
At depths of 0–100 cm, the TOC, AOC, and NOC contents were 0.05–30.03 g/kg, 0.01–8.86 g/kg, and 0.02–23.36 g/kg, respectively. In the same soil layer, the content and range showed a trend of TOC > NOC > AOC. From the surface layer to the bottom, the contents of TOC, AOC, and NOC decreased, and the gap narrowed. In each layer of the farmland and woodland profiles, the average contents of TOC, AOC, and NOC show trends of NF>F and NF>NW > F. The results show that farming management has increased the SOC content and its components, and the SOC content in farmland and woodland in the FA can still be improved.
3.2.2 Relationship Between the SOC Components and Particles Under the Influence of Land Use
The mineral composition and specific surface of the particles with different sizes are different, which can affect the SOC content and combination mode with the SOC components and reflect the surface material processes influenced by multiple factors. Therefore, there is a certain corresponding relationship between particle distribution and the SOC content. In the profile, the contents of TOC, AOC, and NOC in farmland and woodland are positively correlated with D; there is a significant correlation with D in farmland but no significant correlation with D in woodland is observed. This result indicates that the content and distribution characteristics of the particles with different sizes affect the SOC active and inactive components as shown in Table 4, Table 5, Table 6, Table 7.
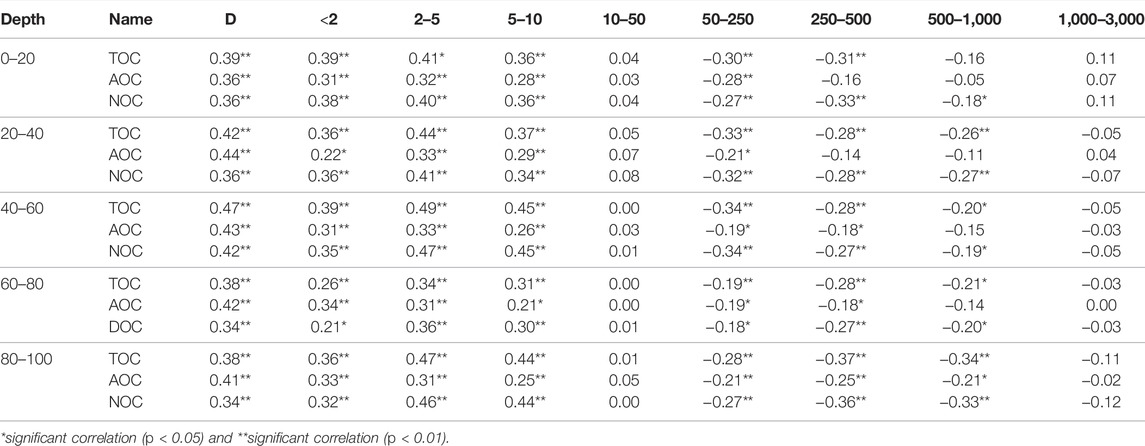
TABLE 4. Correlation analysis between the soil particles and SOC in the farmland in the nonflooded area.
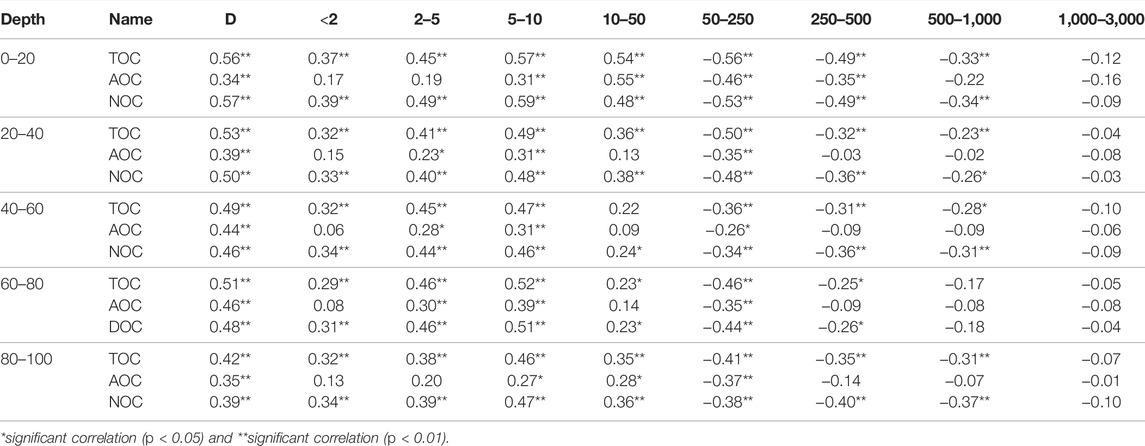
TABLE 5. Correlation analysis between the soil particles and SOC in the farmland in the flooded area.
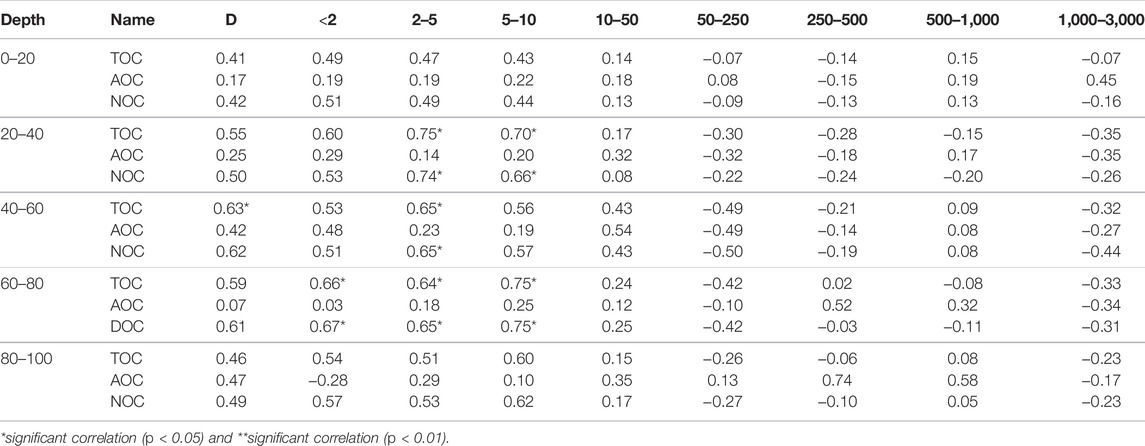
TABLE 6. Correlation analysis between the soil particles and SOC in the woodland in the nonflooded area.
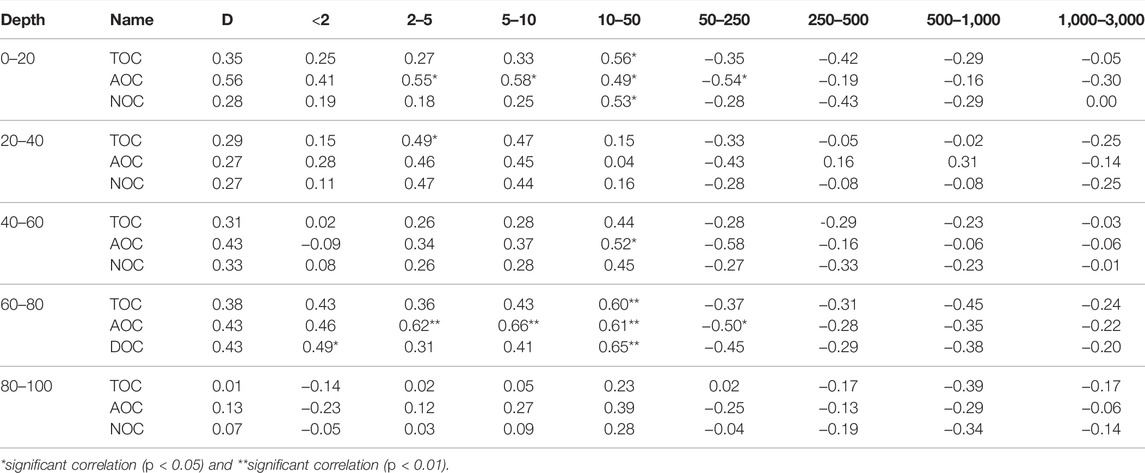
TABLE 7. Correlation analysis between the soil particles and SOC in the woodland in the flooded area.
The 50 μm size as the demarcation point in the relationships between the SOC components and different particle sizes, namely, the TOC, AOC, and NOC contents are positively correlated with the <50 μm particles and negatively or weakly correlated with the >50 μm particles (1,000–3,000 μm). In the farmland profile in the NFA, the contents of TOC, AOC, and NOC have a significant positive correlation with the <2 μm, 2–5 μm, and 5–10 μm particles in the <50 μm range, a weak positive correlation with the 10–50 μm particles, and a significant negative correlation with the 50–250 μm and 250–500 μm particles in the >50 μm range. When comparing flooded farmland to nonflooded farmland, similarities and differences are observed. A similarity is that the SOC components are significantly correlated with the <2 μm, 2–5 μm, 5–10 μm, 50–250 μm, and 250–500 μm contents. The difference is that the correlation degree and the correlation coefficient of the relations of the SOC components with the 10–50 μm and 500–1,000 μm contents in flooded farmland are higher than those in nonflooded farmland, which is an important reason affecting D and the content of SOC components and causes high TOC, NOC, and AOC contents in nonflooded farmland and low contents in flooded farmland in the soil profile. In terms of the particle size and properties, clays, and fine silt that are <2 μm, 2–5 μm, and 5–10 μm in size are the main factors affecting the NOC content and its stability, while the 50–250 μm, 250–500 μm, and 500–1,000 μm particles cause the changes in the biological and SOC turnover processes. In the nonflooded farmland, the content of <2 μm, 2–5 μm, and 5–10 μm particles is higher than those in the FA, where more stable SOC can be retained, which increases the NOC content. The functions of the 50–250 μm, 250–500 μm, and 500–1,000 μm particles are reflected in the increase in soil porosity, oxygen, and moisture, which is beneficial to SOM decomposition by soil fauna and microorganisms. In the farmland in the NFA and the FA, the correlation differences among the 10–50 μm particles and the contents of TOC, AOC, and NOC indicate that the SOC components in nonflooded farmland combine to a greater extent with silt and clay smaller than 10 μm, which results in a high activity and high stability. The SOC components in the flooded farmland combine to a greater extent with the silt and clay particles that are <10 μm and 10–50 μm in size. Due to the influence of the 10–50 μm particles, the retention of the SOC components is relatively weak and more likely to change. This phenomenon is the main reason for the difference in the TOC, NOC, and AOC contents in the NFA and the FA.
In the soil profile of the woodlands in the NFA and the FA, the relationships between the TOC, AOC, and NOC contents and each particle size show a consistent behavior, but the correlation is not strong. This result may be related to the fewer sampling points and a low content of SOC components.
In farmland and woodland, the relationships among the TOC, AOC, and NOC contents and the content of each particle size show consistent rules compared to those with D, but there exist certain differences. This finding indicates that the different particle sizes are the key factors that affect the content and distribution of the SOC components, control the SOC turnover processes, stability characteristics and release of various elements, and affect soil quality and regional agricultural development.
4 Discussion
4.1 The Silt Alluviation/Deposition and Land Use Type Affect Particle Distribution and Fractal Dimension
The contents of the different soil particle sizes affect D, SOM turnover processes, and soil properties. The study area is located in the alluvial plain in the lower reach of the Yellow River, and silt alleviation from the loess plateau is the main material source of soil formation. Due to the different degrees of the sediment influence, the thickness of sandy soil and the particle size vary, and the combinations of different sizes of particulate matter and SOM affect the fractal dimension characteristics and the turnover processes of organic matter. In the study area, D is between 2.21 and 2.78, where the farmland value is higher than that of woodland, and the NFA value is higher than that of the FA (DNF > DF and DNW > DW) (Table 1). D is positively correlated with the clay and silt contents and negatively correlated with the sand content (Tables 2, 3), our results consistent with studies in wetland, farmland, and woodland at the loess plateau, in which D is between 2.24 and 2.70 (Liu et al., 2009; Shi et al., 2011; Ding et al., 2010), and show the land use type is an important influencing factor. The essential difference is that land use type causes the change of SOC component and the aggregate stability (Hassink, 1997), and then affect the distribution of different particle sizes (Zhang et al., 2012b). According to the relationship between D and the particle content, D increases with an increase in the <10 μm particles and a decrease in the >50 μm particles in farmland and woodland (Figures 3–6). With the increase in the 50–250 μm, 250–500 μm, and 500–1,000 μm particles in the >50 μm range, the negative correlation gradually decreases. The content of 10–50 μm, <2 μm, 2–5 μm, and 5–10 μm particles and their synthetic actions are the root causes of the fractal dimension differences in farmland/forestland in the flooded and nonflooded areas.
4.2 Difference of Soil Fractal Dimension and Particle Content Reflect the Variation of SOC and Its Components
The relationship between the SOC components and D is consistent with that of the particulate matter, showing that the D difference can reflect the change in SOC and its components and can be used as an index to characterize the variance in soil properties and quality. The cementation of SOM and particulate matter with different particle sizes is the main factor controlling the formation of soil aggregates, and their relationships affect the SOC content (Spohn, and Giani, 2010; Gao et al., 2021). Particulate matter with different sizes is the result of the long term weathering of soil parent material, and the content and chemical composition of each particle size in soil are different due to the influences of the mineral composition and the soil forming process, and these can reflect the particle resource and external interference factors (Zhang et al., 2016; Liu et al., 2018). The specific surface area of clay and fine silt per unit volume is larger than those of coarse silt and sand, and the positive charges on the particle surface easily combine with the negative charges on organic colloids to form the organic–inorganic complexes. When the SOC content is low, aggregate formation depends on the adhesion of inorganic colloids, but with increasing surface organic matter input, organics participate in the formation of macroaggregates (Zhang and He, 1997). The results show that SOM cementation is the main factor for macroaggregate formation; the larger the aggregate size, the higher the SOC content is (Chen et al., 2019). In this study, the SOC content in farmland is higher than that in woodland, and the main reason is that each particle content below 50 μm in farmland is higher than that in woodland (Figure 2), while the correlation degree of the relation between each particle size content below 50 μm and the TOC, AOC, and NOC contents in farmland is higher than that in woodland, which is conductive to macroaggregate formation and SOC component accumulation.
The contents of inorganic colloids (clay and silt) and SOM and their strong or weak cementation also affect the chemical forms of SOC and its components. More than 70% of the SOC in forest mineral soils is protected in silt and clay aggregates (Garten et al., 1999). In wasteland soil with a low SOC content, the stable carbon pool is mainly composed of mineral-bound organic matter (Liu et al., 2019). Fine particulate matter more easily forms stable organic carbon that is resistant to decomposition. A larger aggregate size is more conducive to a lower decomposition degree of SOC, and the ratio of active carbon with an alkoxide carbon structure is high, while a smaller aggregate size results in a higher ratio of stable carbon with an antidecomposition alkyl carbon structure (Guo et al., 2013). These findings fully explain that the content of SOC and each particle size affect the interaction between them and the stability of the SOC components. Cambardella and Elliott (1992) used SOM combined with >53 μm particles as the active carbon pool, it is susceptible to both environmental factors and vegetation growth (Six et al., 1999; Liu et al., 2019). AOC is more susceptible to environmental change and human disturbance than TOC (Li et al., 2021), and AOC is also an important material source of soil nutrient supply, soil quality maintenance, and soil function (Pu et al., 2017). The <53 μm mineral-bound organics protected by clay and silt with a high degree of decay are inert carbon pools (Tang et al., 2010; Lugato et al., 2021).
In the farmland of the FA and the NFA, the 10–50 μm particles are compared with each particle size in the <10 μm range, and the 10–50 μm particulate matter is more likely to be combined with SOC to form macroaggregates; the humification degree is relatively low, and the activity of SOC is higher than that of the organic carbon combined with size <10 μm particles; thus, the difference and stability of AOC and NOC in soil are mainly affected by the 10–50 μm and <10 μm particles.
The content of each particle size in the <10 μm range and its correlation with the SOC in farmland in the NFA are higher than those in farmland in the FA, which indicates that SOC in farmland in the NFA is highly stable compared with that in the FA. In comparing woodland with farmland, it is observed that the contents of each particle size below 10 μm and the 10–50 μm particles are low. This phenomenon is also the main reason causing the content and stability of SOC in farmland to be higher than those of SOC in woodland.
5 Conclusion
Land use and sediment alluviation/deposition are the main factors influencing the vertical distribution and spatial variability characteristics of particles with different sizes. The particulate matter in the soil profile is mainly 10–50 μm and 50–250 μm in size with an average content of approximately 65%. The contents of the 2–5 μm, 5–10 μm, and 250–500 μm particles are similar, ranging from 7% to 10%; the <2 μm particle content is 4.08%–4.80%, and the 1,000–3,000 μm content is lower than 1%. The content difference within the same size particle range is small in the soil profile. Soil D is between 2.21 and 2.78. In the soil profile, the average D value of each layer in farmland is higher than that of each layer in woodland. The 50 μm particle size can be used as the demarcation point to describe D changes. The <50 μm particles have a positive effect on D, and the >50 μm particles have a negative effect on D. The contents of the 10–50 μm, <2 μm, 2–5 μm, and 5–10 μm particles and their dynamic variances are the root causes of the D differences in the farmland/woodland soils in the FA and the NFA.
The 50 μm particle size is the demarcation point in the relationships between the SOC components and different particle sizes, in which the contents of TOC, AOC, and NOC are positively correlated with the particle size of <50 μm and negatively or weakly correlated with the particle size of >50 μm (1,000–3,000 μm). When comparing farmland with woodland, it can be observed that the correlation degree with the particle size of <50 μm is higher in farmland than in woodland, which is the main reason why the SOC content in farmland is higher than that in woodland. Analysis shows that contents of the 10–50 μm and <10 μm particles are the main reasons for the differences in the AOC and NOC contents and SOC stability in soil.
The relationships among the SOC components and different particle sizes are consistent with those between D and the different particle sizes, showing that the D difference can reflect the change in SOC and its components and can be used as an index to characterize the variance in soil properties and quality. In this article, the distribution characteristics of the soil particle size and their relationship with SOC are examined, but the structural characteristics and formation of aggregates by particles and SOC have not been discussed. It is of great significance to examine the change and stabilization mechanism of SOC, which will be reflected in future work.
Data Availability Statement
The original contributions presented in the study are included in the article/Supplementary Material, further inquiries can be directed to the corresponding authors.
Author Contributions
JZ designed the research, undertook the field work, and wrote the manuscript. GL conducted data processing and statistical analysis and wrote the manuscript. SD conceived the research and collected the data and materials. HT conducted survey investigation and processed the data and plotted. XR conducted laboratory test and analysis and collected the data and materials. ML processed the data and plotted. YZ conducted laboratory test and analysis.
Funding
This work was supported by the National Natural Science Foundation of China (Nos. 42171112 and 41771202), the Key Research and Development Project in Henan province (Nos. 212102310415 and 222102320322), the National Demonstration Center for Experimental Environment and Planning Education (Henan University) Funding Project (No. 2020HGSYJX005), and the Henan University Postgraduate Talents Project (No. SYL20060133).
Conflict of Interest
The authors declare that the research was conducted in the absence of any commercial or financial relationships that could be construed as a potential conflict of interest.
Publisher’s Note
All claims expressed in this article are solely those of the authors and do not necessarily represent those of their affiliated organizations, or those of the publisher, the editors, and the reviewers. Any product that may be evaluated in this article, or claim that may be made by its manufacturer, is not guaranteed or endorsed by the publisher.
Acknowledgments
We also thank Senior Editor Ruiz P. from American Journal Experts (AJE) for assistance with English language and grammatical editing.
References
Bottinelli, N., Angers, D. A., Hallaire, V., Michot, D., Le Guillou, C., Cluzeau, D., et al. (2017). Tillage and Fertilization Practices Affect Soil Aggregate Stability in a Humic Cambisol of Northwest France. Soil Tillage Res. 170, 14–17. doi:10.1016/j.still.2017.02.008
Cambardella, C. A., and Elliott, E. T. (1992). Particulate Soil Organic‐Matter Changes across a Grassland Cultivation Sequence. Soil Sci. Soc. Am. J. 56 (3), 777–783. doi:10.2136/sssaj1992.03615995005600030017x
Cao, S., Zhou, Y., Zhou, Y., Zhou, X., and Zhou, W. (2021). Soil Organic Carbon and Soil Aggregate Stability Associated with Aggregate Fractions in a Chronosequence of Citrus Orchards Plantations. J. Environ. Manage. 293, 112847. doi:10.1016/j.jenvman.2021.112847
Chen, X. F., Liu, M., Jiang, C. Y., Wu, M., Jia, Z. J., and Li, P. Z. (2019). Mineralization of Soil Organic Carbon and its Censitivity to Temperature in Soil Aggregates, Relative to Particle Size in Red Paddy Soil. Acta Pedologica Sinica 56 (5), 1118–1127. doi:10.11766/trxb201805300285
Ding, M., Pang, J. L., Liu, Y. X., and Chu, Y. B. (2010). Fractal Characteristics of Soil Particle Volume Size Distribution under Different Land Use on the Loess Plateau. J. Arid Land Resour. Environ. 24 (11), 161–165. doi:10.13448/j.cnki.jalre.2010.11.024
Dong, J., Wang, Y., Zhang, S. H., Fu, X. M., and Yao, D. L. (2014). Grain Size Analysis of Holocene Lacustrine Sediments in the Huangqihai Lake of Inner Mongolia and its Sedimentological Significance. Geol. Bull. China 10, 1514–1522. [in Chinese].
Duru, M., Therond, O., Martin, G., Martin-Clouaire, R., Magne, M.-A., Justes, E., et al. (2015). How to Implement Biodiversity-Based Agriculture to Enhance Ecosystem Services: a Review. Agron. Sustain. Dev. 35, 1259–1281. doi:10.1007/s13593-015-0306-1
Garten, C. T., Post, W. M., Hanson, P. J., and Cooper, L. W. (1999). Forest Soil Carbon Inventories and Dynamics along an Elevation Gradient in the Southern Appalachian Mountains. Biogeochemistry 45 (2), 115–145. doi:10.1007/bf01106778
Giulia, B., Else, K. B., Chidinma, U. O., Meier, J., Gort, G., Comans, R., et al. (2019). Sensitivity of Labile Carbon Fractions to Tillage and Organic Matter Management and Their Potential as Comprehensive Soil Quality Indicator across Pedoclimatic Conditions in Europe. Ecol. Indicators 99, 38–50. doi:10.1016/j.ecolind.2018.12.008
Guo, S. C., Yu, H. Y., Zhu, X. Z., Gao, Y. Z., and Ding, W. X. (2013). Effect of Long-Term Fertilization on Molecular Structure of Organic Carbon in Soil Aggregates in Fluvo-Aquic Soil. Acta Pedologica Sinica 50 (5), 922–930. [in Chinese].
Hang, Z. Q., Guo, X., Wang, G. X., Liu, J. E., Wang, G., Wang, H., et al. (2014). Characterization of Soil Organic Carbon Fractions at Spartina Alterniflora Saltmarsh in North Jiangsu. Acta Ecologica Sinica 34 (15), 4175–4182. doi:10.5846/stxb201212141802
Hassink, J. (1997). The Capacity of Soils to Preserve Organic C and N by Their Association with clay and silt. Plant and Soil 191 (1), 77–87. doi:10.1023/a:1004213929699
Huo, Y. Z., and Li, T. J. (1986). Experiment and Practice of Soil Geography. Beijing: Higher Education Press.
Jharna, R. S., Bhupinder, P. S., Annette, L. C., Fang, Y., Collins, D., Badgery, W., et al. (2018). Agricultural Management Practices Impacted Carbon and Nutrient Concentrations in Soil Aggregates, with Minimal Influence on Aggregate Stability and Total Carbon and Nutrient Stocks in Contrasting Soils. Soil Tillage Res. 178, 209–223. doi:10.1016/j.still.2017.12.019
Lefroy, R. D. B., Blair, G. J., and Strong, W. M. (1993). Changes in Soil Organic Matter with Cropping as Measured by Organic Carbon Fractions and 13C Natural Isotope Abundance. Plant Soil 155-156 (1), 399–402. doi:10.1007/bf00025067
Li, R., Jiang, C. S., and Hao, Q. J. (2015). Impact of Land Utilization Pattern on Distributing Characters of Labile Organic Carbon in Soil Aggregates in Jinyun Mountain. Environ. Sci. 36 (9), 3429–3437. doi:10.13227/j.hjkx.2015.09.039
Li, F., Qiu, P., Shen, B., and Shen, Q. (2019). Soil Aggregate Size Modifies the Impacts of Fertilization on Microbial Communities. Geoderma 343, 205–214. doi:10.1016/j.geoderma.2019.02.039
Li, G., Zhang, J., Zhu, L., Tian, H., Shi, J., and Ren, X. (2021). Spatial Variation and Driving Mechanism of Soil Organic Carbon Components in the Alluvial/sedimentary Zone of the Yellow River. J. Geogr. Sci. 31 (4), 535–550. doi:10.1007/s11442-021-1857-5
Liu, Y. P., Zhang, S. Q., Dang, Y. A., et al. (2009). Research on the Soil Volume Fractal Characteristics of Yellow River Wetland in Heyang of Shaanxi. J. Water Resour. Water Eng. 20 (5), 82–85. [in chinese].
Liu, Z. J., Huang, L., Li, F., Ndzana, G. M., Zhou, F. L., Li, X. K., et al. (2018). Effect of Long-Term Fertilization on the Composition and Evolution of clay Minerals in Soil Particles. Acta Mineralogica Sinica 39 (5), 563–571. doi:10.16461/j.cnki.10004734.2018.38.200
Liu, X. H., Zhang, H. B., Li, Y., Dai, Z. F., Fu, C. C., and Luo, Y. M. (2019). Variation of Organic Matter in Soil Aggregates with the Succession of Tidal Flatland from Barren Land-Saltmarsh-Upland in the Yellow River Delta. Acta Pedologica Sinica 56 (2), 374–385. doi:10.11766/trxb201803190082
Loginow, W., Wisniweski, W., Gonet, S. S., and Ciescinska, B. (1987). Fractionation of Organic Carbon Based on Susceptibility to Oxidation. Polish J. Soil Sci. 20 (1), 47–52.
Lugato, E., Lavallee, J. M., Haddix, M. L., Panagos, P., and Cotrufo, M. F. (2021). Different Climate Sensitivity of Particulate and mineral-associated Soil Organic Matter. Nat. Geosci. 14, 295–300. doi:10.1038/s41561-021-00744-x
Ma, L., Wang, Q., and Shen, S. T. (2020). Response of Soil Aggregate Stability and Distribution of Organic Carbon to alpine Grassland Degradation in Northwest Sichuan. Geoderma Reg. 22, e00309. doi:10.1016/j.geodrs.2020.e00309
Meng, Z. J., Liu, A. N., Wu, H. Q., Yang, C. F., Jia, D. L., and Si, T. S. (1998). Mathematical Model of Water-Fertilizer Interaction for Water-Saving and High-Yield winter Wheat in East Area of Henan Province. Trans. CSAE 1, 86–90. [in Chinese].
Meysam, M., Mahmoud, S., Mohammad, H. M., and Davatgar, N. (2019). Characterizing Spatial Variability of Soil Textural Fractions and Fractal Parameters Derived from Particle Size Distributions. Pedosphere 29 (2), 224–234. doi:10.1016/S1002-0160(17)60425-9
Pu, Y. L., Ye, C., Zhang, S. R., Long, G., Yang, L., Jia, Y., et al. (2017). Effects of Different Ecological Restoration Patterns on Labile Organic Carbon and Carbon Pool Management index of Desertification Grassland Soil in Zoige. Acta Ecologica Sinica 37 (2), 367–377. doi:10.5846/stxb201508031635
Racheal, N. U., Elizabeth, M. B., and Kirsten, S. H. (2019). Spatio-temporal Microbial Community Dynamics within Soil Aggregates. Soil Biol. Biochem. 132, 58–68. doi:10.1016/j.soilbio.2019.01.016
Shi, Z. F., Wang, L., and Wang, J. G. (2011). Volume Fractal Characteristics and Significance of Soil Particles in the Shenmu Colliery in North Shaanxi Province. Arid Zone Res. 28 (3), 394–400. doi:10.13866/j.azr.2011.03.003
Six, J., Elliott, E. T., and Paustian, K. (1999). Aggregate and Soil Organic Matter Dynamics under Conventional and No‐Tillage Systems. Soil Sci. Soc. Am. J. 63 (5), 1350–1358. doi:10.2136/sssaj1999.6351350x
Spohn, M., and Giani, L. (2010). Water-stable Aggregates, Glomalin-Related Soil Protein, and Carbohydrates in a Chronosequence of sandy Hydromorphic Soils. Soil Biol. Biochem. 42 (9), 1505–1511. doi:10.1016/j.soilbio.2010.05.015
Stockmann, U., Padarian, J., McBratney, A., Minasny, B., de Brogniez, D., Montanarella, L., et al. (2015). Global Soil Organic Carbon Assessment. Glob. Food Security 6, 9–16. doi:10.1016/j.gfs.2015.07.001
Stuart, G. A., Michael, S. S., and Christian, L. L. (2009). The Influence of Microbial Communities, Management, and Soil Texture on Soil Organic Matter Chemistry. Geoderma 150 (3-4), 278–286. doi:10.1016/j.geoderma.2009.02.007
Sun, C., Liu, G., and Xue, S. (2016). Natural Succession of Grassland on the Loess Plateau of China Affects Multifractal Characteristics of Soil Particle-Size Distribution and Soil Nutrients. Ecol. Res. 31, 891–902. doi:10.1007/s11284-016-1399-y
Tang, G. M., Xu, W. L., Sheng, J. D., Liang, Z., Zhou, B., and Zhu, M. (2010). The Variation of Soil Organic Carbon and Soil Particle-Size in XinJang Oasis farmland of Different Years. Acta Pedologica Sinica 47 (2), 279–328. [in Chinese].
Tian, H., Zhang, J., Zhu, L., Qin, J., Liu, M., Shi, J., et al. (2022). Revealing the Scale- and Location-specific Relationship between Soil Organic Carbon and Environmental Factors in China's north-south Transition Zone. Geoderma 409, 115600. doi:10.1016/j.geoderma.2021.115600
Tyler, S. W., and Wheatcraft, S. W. (1992). Fractal Scaling of Soil Particle-Size Distributions: Analysis and Limitations. Soil Sci. Soc. America J. 56 (2), 362–369. doi:10.2136/sssaj1992.03615995005600020005x
Wang, G. L., Zhou, S. L., and Zhao, Q. G. (2005). Volume Fractal Dimension of Soil Particles and its Applications to Land Use. Acta Pedologica Sinica 42 (4), 545–550. doi:10.1360/aps030075
Wang, J., Zhang, J., and Feng, Y. (2019). Characterizing the Spatial Variability of Soil Particle Size Distribution in an Underground Coal Mining Area: An Approach Combining Multi-Fractal Theory and Geostatistics. Catena 176, 94–103. doi:10.1016/j.catena.2019.01.011
Wynn, J. G, Bird, M. I., Vellen, L., Grand-Clement, E., Carter, J., and Berry, S. L. (2006). Continental-Scale Measurement of the Soil Organic Carbon Pool With Climatic, Edaphic, and Biotic Controls. Global Biogeochem. Cycles 20, GB1007. doi:10.1029/2005GB002576
Xu, S. T., Pan, B. T., Gao, H. S., Wang, J. P., Guan, Q. Y., and Hu, C. S. (2006). Analysis of Grain-Size Population with Environmentally Sensitive Components of Loess during the Last Interglacial-Glacial Cycle and Their Implications. Acta Pedologica Sinica 2, 183–189. [in Chinese].
Xu, Q., Xiong, K., and Chi, Y. (2021). Effects of Intercropping on Fractal Dimension and Physicochemical Properties of Soil in Karst Areas. Forests 12, 1422. doi:10.3390/f12101422
Yang, S. L., and Ding, Z. L. (2017). Spatial Changes in Grain Size of Loess Deposits in the Chinese Loess Platenu and Implications for Palaeoenvironment. Quat. Sci. 37 (5), 934–944. doi:10.11928/j.issn.1001-7410.2017.05.02
Yao, Y., Ge, N., Yu, S., Wei, X., Wang, X., Jin, J., et al. (2019). Response of Aggregate Associated Organic Carbon, Nitrogen and Phosphorous to Re-vegetation in Agro-Pastoral Ecotone of Northern China. Geoderma 341, 172–180. doi:10.1016/j.geoderma.2019.01.036
Yılmaz, E., Çanakcı, M., Topakcı, M., Sönmez, S., Ağsaran, B., Alagöz, Z., et al. (2019). Effect of Vineyard Pruning Residue Application on Soil Aggregate Formation, Aggregate Stability and Carbon Content in Different Aggregate Sizes. Catena 183, 1–9. doi:10.1016/j.catena.2019.104219
Zhang, M. K., and He, Z. L. (1997). Effect of Parent Materials on Formation of Soil Aggregates. Trop. Subtrop Soil Sci. 6 (3), 198–202. doi:10.16258/j.cnki.1674-5906.1997.03.009
Zhang, J., Li, G., and Nan, Z. (2012a). Soil Particle Size Distribution and its Relationship with Soil Organic Carbons under Different Land Uses in the Middle of Heihe River. Acta Eco Sin 32 (12), 3745–3753. doi:10.5846/stxb201110091473
Zhang, J. H., Li, G. D., Nan, Z. R., and Xiao, H. L. (2012b). Research on Soil Particle Size Distribution and its Relationship with Soil Organic Carbon under the Effects of Tillage in the Heihe Oasis. Geographical Res. 31 (4), 608–618. doi:10.11821/yj2012040004
Zhang, Z. Y., Huang, L., Liu, F., Wang, M. K., Fu, Q. L., and Zhu, J. (2016). Characteristics of clay Minerals in Soil Particles of Two Alfisols in China. Appl. Clay Sci. 120, 51–60. doi:10.1016/j.clay.2015.11.018
Zhang, Q., Shao, M., Jia, X., and Wei, X. (2019). Changes in Soil Physical and Chemical Properties after Short Drought Stress in Semi-humid Forests. Geoderma 338, 170–177. doi:10.1016/j.geoderma.2018.11.051
Zheng, Z. C., Wang, Y. D., Li, T. X., and Yang, Y. (2011). Effect of Abandoned Cropland on Stability and Distributions of Organic Carbon in Soil Aggregates. J. Nat. Resour. 1, 119–127. doi:10.11849/zrzyxb.2011.01.012
Keywords: particle size distribution, SOC components, fractal dimension, Yellow River sediment, the lower reaches of the Yellow River
Citation: Zhang J, Li G, Ding S, Tian H, Ren X, Liu M and Zheng Y (2022) Distribution Characteristics of Soil Particles and Their Relationships With Soil Organic Carbon Components in the Alluvial/Sedimentary Zone in the Lower Reaches of the Yellow River. Front. Environ. Sci. 10:849565. doi: 10.3389/fenvs.2022.849565
Received: 09 January 2022; Accepted: 05 April 2022;
Published: 17 May 2022.
Edited by:
Dima Chen, China Three Gorges University, ChinaReviewed by:
Yuhui Meng, China Three Gorges University, ChinaJie Yu, Institute of Grassland Research (CAAS), China
Copyright © 2022 Zhang, Li, Ding, Tian, Ren, Liu and Zheng. This is an open-access article distributed under the terms of the Creative Commons Attribution License (CC BY). The use, distribution or reproduction in other forums is permitted, provided the original author(s) and the copyright owner(s) are credited and that the original publication in this journal is cited, in accordance with accepted academic practice. No use, distribution or reproduction is permitted which does not comply with these terms.
*Correspondence: Guodong Li, liguodonghd@163.com; Shengyan Ding, syding@henu.edu.cn