 Tiesheng Guan1,2,3
 Yanli Liu1,2,3*
 Zhouliang Sun1,4Jianyun Zhang1,2,3
 Hua Chen4
 Guoqing Wang1,2,3Junliang Jin1,2,3Zhenxin Bao1,2,3
 Wei Qi5
- 1State Key Laboratory of Hydrology-Water Resources and Hydraulic Engineering, Nanjing Hydraulic Research Institute, Nanjing, China
- 2Yangtze Institute for Conservation and Development, Nanjing, China
- 3Research Center for Climate Change of Ministry of Water Resources, Nanjing, China
- 4State Key Laboratory of Water Resources and Hydropower Engineering Science, Wuhan University, Wuhan, China
- 5School of Environmental Science and Engineering, Southern University of Science and Technology, Shenzhen, China
General circulation models could simulate precipitation under climate change and have been recognized as a major tool to project future water resources, but huge inherent uncertainties mean that their credibility is widely questioned. The current analysis mainly focuses on some aspects of uncertainty and few on the whole chain process to yield a more reliable projection. This study proposes a framework to identify the uncertainty and credibility of GCMs, consisting of downscaling, uncertainty analysis (model spread and Taylor diagram), ensemble analysis (grid-based weighted Bayesian model averaging), credibility analysis (signal-to-noise ratio), and probability projection. Based on five selected climate models from the Coupled Model Intercomparison Project Phase 5 (CMIP5), the uncertainties and credibility of simulated precipitation in the Yellow River of China were analyzed. By comparing the models’ output with the observation in the historical period of 1986–2005, we can see that large uncertainty exists among models’ annual precipitation. For different-class precipitation, the uncertainties of the five models are small in relatively weak rain, but large in heavy rainfall, which indicates more risk in future projections and the necessity to explore their credibility. Moreover, in such a large-span basin, GCMs show vast spatial differences in space and even opposite trends in some regions, demonstrating the limits of Bayesian model averaging (BMA) on multi-model ensemble due to one weight group overall whole basin. Thus, a grid-based weighted Bayesian model averaging (GBMA) method is proposed to cope with the spatial inconsistencies of models. Given the multi-model ensemble results, the future precipitation changes of the periods of 2021–2050 and 2061–2090 are projected, and the probability and credibility of future precipitation changes in terms of spatial distribution are identified. Model credibility identification could allow for more reliable projections of precipitation change trends, especially for different spatial regions, which will be very valuable for decision-making related to water resource management and security.
1 Introduction
Precipitation is one of the typical variables in the hydrological cycle, a process that has inevitably been affected by global climate change due to increasing atmospheric and other greenhouse gas concentrations and anthropogenic activities (Kong et al., 2021; Liu et al., 2018). General circulation models (GCMs) have been considered as primary tools for climate change scenarios and a very important basis for precipitation prediction (Zhao et al., 2020; Chen et al., 2014; Hasson and Pascale., 2016). Incomplete theoretical understanding and certain simplifying assumptions mean GCMs are not perfect (Georgescu et al., 2021; Reichler and Kim, 2008), particularly the greater errors in the local resolution. The World Climate Research Program (WCRP) developed the Coupled Model Intercomparison Project (CMIP), which provides an opportunity for model comparison and multi-model ensemble strategy development (Knutti and Sedláček, 2013; Li et al., 2011). The Coupled Model Intercomparison Project Phase 5 (CMIP5), coordinated by the WCRP with the support of the IPCC AR5, is still the current activity before the AR6. There are 59 GCMs in the CMIP5 (https://www.wcrp-climate.org/wgcm-cmip/wgcm-cmip5) in total, covering a large number of more complex models run at higher resolution, more complete “representative concentration pathways” (RCPs) of external forcing, more scenarios, and more saved diagnostics (Taylor et al., 2012). The models tended to be selected according to the availability, resolution, or initial analysis of their applicability (Huang et al., 2013; Knutti and Sedláček, 2013; Sabeerali et al., 2015; Sun and Ding, 2015; Li et al., 2018). It has been a focus of intense international attention to assess and correct GCMs in different regions all over the world (Maurer and Pierce, 2014; Wang C. et al., 2014; Toreti and Naveau., 2015). Given the variations in the GCM structure and hypothesis simplification, each model has its own level of performance and shows vast differences, especially at the local scale. Thus, based on the reliability and credibility exploration, models’ evaluation and selection play a very important role in future water projection.
Water resources in the Yellow River, one of China’s mother rivers, has caused extensive concern for the water resources issue (Miao et al., 2010; Zhou et al., 2018) due to the historical flow interruption in the last century. The huge stress on supplies in the middle and lower reaches is a major issue for economic and social development planning strategies in these regions. Meanwhile, climate change and the underlying surface change (e.g., land-use change and city or hydraulic engineering) caused by human activities are affecting the future water resources (Xia et al., 2014). Precipitation is the major source of the Yellow River water resources, and any future change will directly impact water resource utilization (Wang et al., 2018). Application of GCM scenarios has addressed the simulated and projected precipitation under climate change (Kang et al., 2015; Chen et al., 2016; Wei et al., 2016). The current research mainly imports several GCMs to try predicting precipitation or other related indexes such as the runoff change in spatio-temporal changes for future climate scenarios (Wang G. Q. et al., 2014; Yang et al., 2017). There has been some analysis of the performance of GCM simulation (Lin et al., 2018), but few studies comprehensively assess the uncertainty and credibility of GCMs. Decision-makers or other stakeholders might be very confused facing the quite different or even opposite results from the multi-model ensemble. Therefore, due to the well-known huge uncertainty of the GCMs (Friedlingstein et al., 2014; Lee et al., 2021), it is a key problem how much confidence could be provided if the future projection is imported into decision-making or planning.
There is an inherent hypothesis in climate model evaluation that good model performance evaluated from the historical and present climate guarantees higher reliability or credibility in future climate projections. This hypothesis has been widely accepted in the absence of a better alternative, for example, a comprehensive understanding of the climate cycle and more accurate downscaling techniques. Many studies have attempted to assess the performance of climate models in terms of goodness-fit to present-day climate and to predict the future climate on continental and regional scales (Mahlstein I et al., 2012; Grainger et al., 2013; Hertig et al., 2014; Mehran et al., 2014; Hui et al., 2018). Through extensive work and improvement in the representation of the atmospheric oceanic process, various models have been developed and shown to increasingly perform well in simulating climate changes (Van den Hurk et al., 2013; Ahmadalipour et al., 2017). But climate simulations and forecasts are inevitably uncertain (Allen et al., 2000; Eghdamirad et al., 2017). To reduce the simulation uncertainty and improve the credibility of climate models, multi-model ensemble techniques have been adopted (Thibeault et al., 2012; Ongoma et al., 2018). Multi-model ensembles are believed to perform better than single simulations, particularly in terms of reliability amid the huge uncertainty of climate models. This is because the multi-model approach involves different physical parameterization methods and structures that surmount the limitations of the single simulation (Wang et al., 2017). Thus, the technique of the multi-model ensemble (MME), defined as the average of simulation results from the multiple models, has been widely used on account of the better large-scale agreement with observations (Cubasch et al., 2001; Kumar et al., 2012). The extensive use of the MME has been considered a successful way to provide higher quality and more consistent future climate change projections, by means of constraining projections using observations (Lu and Fu et al., 2009; Strategy, 2014). However, since the future projections may vary widely among the different models, utilizing an average of all the models for the MME is not necessarily the best way to obtain more reliable projections without looking into the reliability of the individual models (Sun and Ding., 2009; Knutti, 2010; Lee and Wang, 2014). Therefore, the weight of individual simulation becomes crucial when deducing the multi-model ensemble result, rather than the simple average. Moreover, a multi-model ensemble does not necessarily involve all models. It has been recognized that poorly performing models degrade the overall skill of weather and climate forecasts in an ensemble mean approach (Krishnamurti et al., 2000); for further assessment of future changes, selecting some best models is needed (Huang et al., 2013; Seo and Ok, 2013; Lee and Wang, 2014; Vasconcellos et al., 2020).
The reliability ensemble averaging (REA) methodology, proposed by Giorgi and Mearns (2002) , provides a weighted average of climate change ensemble results based on the “reliability” of each model. “Reliability” defines the ability of a particular model to simulate the observed climate and its degree of convergence in predicted climate change compared with other ensemble members (Sun et al., 2015). Another similar averaging method is Bayesian model averaging (BMA) proposed by A. E. Raftery and coworkers as a formal framework. BMA conditions simulations of the entire ensemble of models and optimally combines their predictive capabilities. The weights are the estimated posterior model probabilities, representing each model’s relative forecast skill in the training period with observations (Vrugt and Robinson, 2007). Moreover, this BMA methodology can assess the models’ joint predictive uncertainty, which is an advantage in the face of huge uncertainty in climate model projections compared with other weighted methods such as REA. Since the model averaging simply requires a numerical representation of each model, there are no restrictions on the diversity of conceptual and numerical models. Many studies have demonstrated that BMA produces more accurate and reliable predictions than other available multi-model techniques (Raftery and Zheng, 2003; Ajami et al., 2007; Duan et al., 2007; Demirel and Moradkhani, 2016; Ma et al., 2018). However, due to normally providing only one weight group, BMA is not a perfect solution to variations in models, much less the defects of a large basin without allowing for spatial differences. Thus, a framework for the full assessment process of GCM simulation and projection is a necessary one that consists of uncertainty analysis, individual model evaluation, and then weight setting up.
There is a growing need among policymakers and even stakeholders to identify a future projection mode reliable enough to inform decision-making for adaptation and mitigation purposes, but the reliability assessment of projections is a challenge (Collins et al., 2012; Zhao et al., 2017). When a future projection is provided to policymakers and stakeholders, there are usually questions about how much confidence or even probability can be associated with it. Here, we addressed “credibility”, which is defined as the self-evaluation of molders or researchers when they submit the results to the government based on the MME projection or individual model skill. Credibility is more easily accepted than reliability by policymakers and stakeholders because it explicitly expresses the confidence or probability.
Thus, the goal of this study is to propose a framework to identify the uncertainty and credibility of GCMs for projected future precipitation. As a main component of the framework, a new grid-based BMA approach is also presented. Applying the CMIP5 to the Yellow River basin, this study assesses the performance and inherent uncertainties of the CMIP5 GCMs in simulating precipitation variation and projecting the precipitation change in future periods with credibility. Section 2 describes the data and methodology. Section 3 presents the performance of the grid-based weighted Bayesian model averaging (GBMA) method and uncertainties in CMIP5 models with historical observations over the Yellow River and the future projections with credibility quantification. Conclusions and discussions are provided in section 4.
2 Data and Method Framework
2.1 Data
Given the potential disadvantage of poor simulation in multi-ensemble approaches, instead of all CMIP5 models, the MIROC-ESM-CHEM, CSIRO-Mk3-6-0, NorESM1-M, CNRM-CM5, and EC-EARTH are involved in this study. They are selected based on their simulation ability initial evaluation of the Yellow River from the China Meteorological Administration (Zhou and Han., 2018), while the good performances of CSIRO-Mk3-6-0 and CNRM-CM5 in the Yellow River basin were also demonstrated in another study (Yang et al., 2021). The GCM models have been downscaled into 0.25° × 0.25° as daily series by a quantile mapping approach. The period of 1986–2005 is the historical simulation test, and 2006–2099 is the future projection period. The CMIP5 uses the new RCPs to express the emission scenarios as RCP 2.6, RCP 4.5, and RCP 8.5. The RCP 8.5 scenario is known as “business as usual”, in which the emission of anthropogenic gases is not strongly regulated. China's government is always trying to control and reduce the emission, even putting forward the target of “emission peak” by 2030 and “carbon neutrality” by 2060 in the near future. Thus, the RCP 4.5 might be more agreeable with actual states. The medium emission scenario RCP 4.5 is involved in this study in view of the fair uncertainty of models.
Observed daily precipitation is obtained from the National Meteorological Information Center of China (http://data.cma.cn). The data set resolution is 0.5° × 0.5°, which is not consistent with the aforementioned GCMs, so we carried out coordinate matching for these two data sets, resulting in 415 grids from coincidence points for model evaluation. Figure 1 shows the Yellow River basin in China. The Yellow River is Chinas mother river and the cradle of Chinese civilization, with a total length of 5,464 km and a basin area of 752,443 square kilometers. For a so large-span basin, the spatial inconsistencies could be a dominant handicap to producing a reliable ensemble from GCMs.
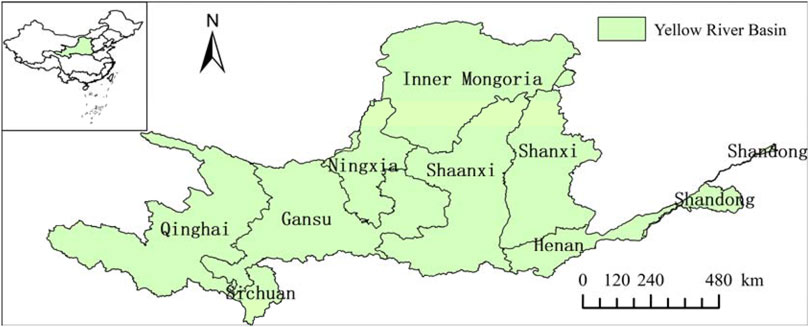
FIGURE 1. Yellow River basin in China.
2.2 Method Framework
Considering the way of the GCM output applied in the catchment scale, the credibility quantification process of the output of GCMs mainly consists of downscaling, uncertainty analysis (model spread and Taylor diagram), ensemble analysis (a new grid-based BMA), credibility analysis (signal-to-noise ratio), and probability projection as shown in Figure 2. The detailed method is illustrated as follows.
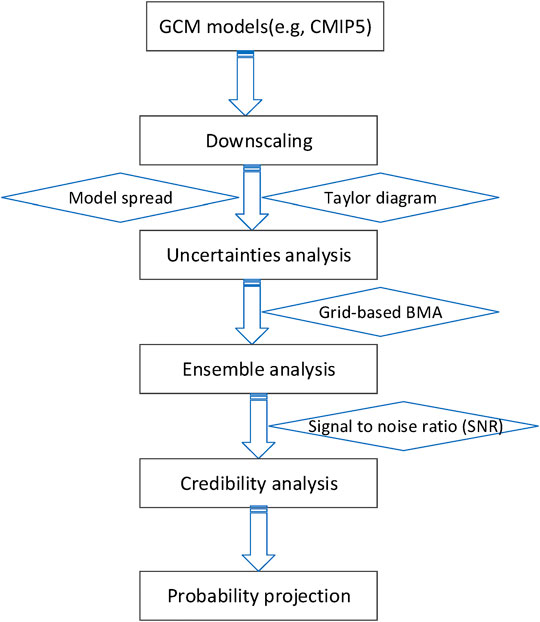
FIGURE 2. Framework to identify the uncertainty and credibility of GCMs.
The model spread has been widely addressed to estimate the uncertainties of GCM models (Zhou and Yu., 2006; Forster et al., 2013; Vial et al., 2013), which can be expressed as follows:
where
Bayesian model averaging (BMA) is used to deduce the ensemble multi-model results and the probability of future projections. BMA is an average of the posterior distributions under each of the models considered, weighted by their posterior model probability. This is recognized as a better way to treat the conceptual model uncertainty because it is not only conditioned on a single “best” model but on an entire ensemble of plausible models. It is impossible to select a best model for a global situation, especially at a regional scale. The BMA ensemble can be expressed as follows:
where P denotes the projected precipitation, D is the observed precipitation, and
BMA is traditionally used one time in a study area, but there can be a significant deviation if the study area is a large and long spatial distance. Allowing for the spatial differences, in this study, we proposed a grid-based BMA, which means each grid would have its own weights of models rather than a single weight system for the whole study area. This is very important, particularly for a long-span region such as the Yellow River basin.
Signal-to-noise ratio (SNR) is used to assess the credibility of the grid-based BMA ensemble projection, which reflects the models’ credibility by the relative size comparison of signal and noise (Tan et al., 2016). The signal denotes the grid-based BMA ensemble values, while the noise means the variations of models. Thus, the signal-to-noise ratio index RSN can be calculated as follows:
where
Based on the weights from the grid-based BMA, the probability of future projection is derived (Jiang et al., 2018). Given a threshold of precipitation, the sum of the weights of precipitation lower than the threshold could be considered as the probability; then, the precipitation change probability can be expressed as
where
3 Results
3.1 Model Performance for Historical Precipitation
Figure 3 shows the annual cycle of the five CMIP5-models’ average, observation, and range between maximum and minimum of the five models for daily precipitation averaged over the YRB. The average shows an annual cycle consistent with the observation but overestimates summer precipitation, especially in August. Meanwhile, Figure 4 shows the model spread spatial distribution over the Yellow River basin. The models demonstrate significant differences in each grid, especially in the northeast and southeast parts. The models illustrate remarkable uncertainty in temporal and spatial scales.
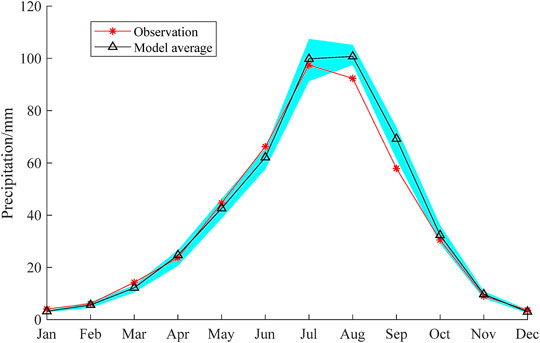
FIGURE 3. Annual cycle of average monthly precipitation from observation, model average, and range between maximum and minimum of the five CMIP5 models (blue shading) in 1986–2005.
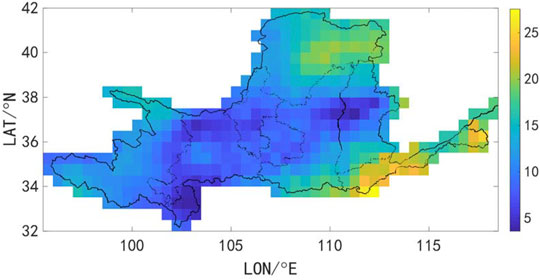
FIGURE 4. Model spread distribution of the five CMIP5 models over the Yellow River basin.
Figure 5 further shows the spatial variations of the five CMIP5 models in 1986–2005. In general, the variations of projections and observation are mostly around −50 to +50 mm. The variations of models of CNRM-CM5, EC-EARTH, MIROC-ESM-CHEM, and NorESM1-M are relatively smaller in the west and north and larger in the east and south. The deviation in most parts of CSIRO-Mk3.6-0 is around 0–50 mm, while the minus value is less. Similarly, the CMIP5 models tend to overestimate the precipitation of the Yellow River basin (Lin and Wen., 2014; Zhu et al., 2019), which would be weaker in the upper reaches of the Yellow River source region (Jin et al., 2020). It is worth noting that the deviations of the models demonstrated a great difference in space, even in some regions where the deviation indicated an opposite trend (e.g., Inner Mongolia and the region within the gray circle in Figure 5). If the deviation of −50–50 mm is assumed as acceptance (the pink, yellow, green, and blue areas in Figure 5), to some extent, the large deviation parts (the purple and red parts with red rectangle in Figure 5) are consistent in the models, and the spatial complementary is still as expected, especially for the potential less deviation in amplitude (e.g., 50 mm is better than 70 or 80 mm) on account of different abilities of models. Given the large uncertainty of the models, it is quite hard or impossible to select the best model. Thus, the MME should be a way to reduce the simulation uncertainty and improve GCM predictions. Nevertheless, all models show higher overestimation in the central Shaanxi province (the red rectangle in Figure 5), which indicates that even the MME would not obviously improve reproduction in this region.
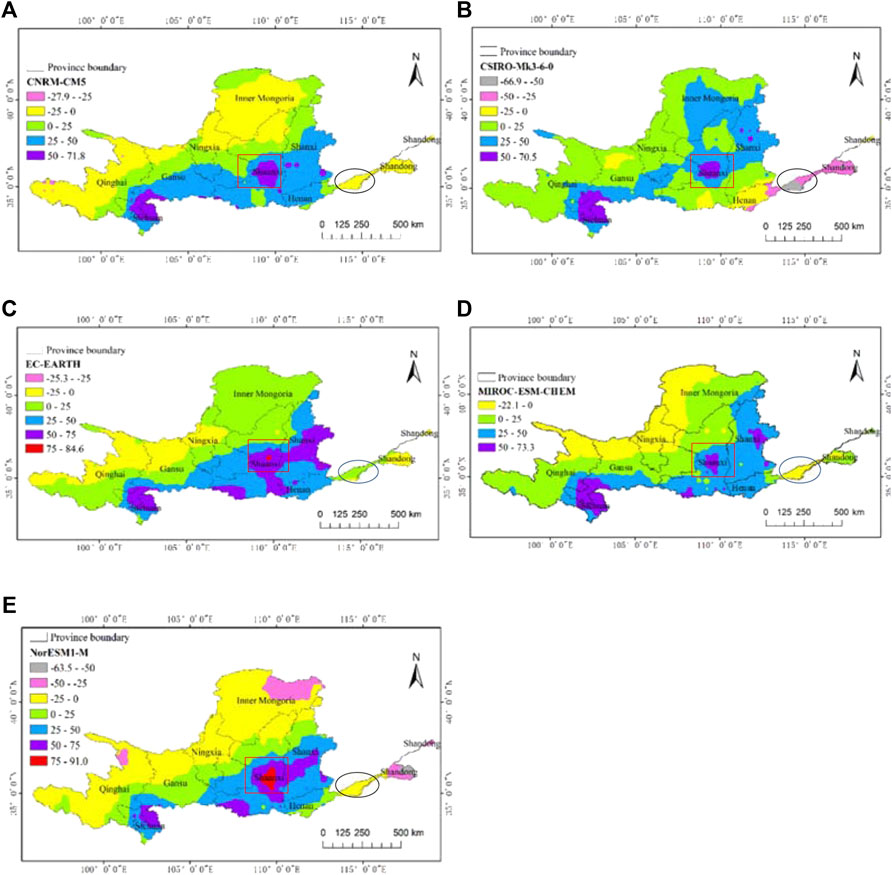
FIGURE 5. Annual total precipitation deviations of the five CMIP5 models with observations in 1986–2005 (mm, positive deviation means overestimation; minus means underestimation). (A–E) represents five CMIP5 models of (A) CNRM-CM5, (B) CSIRO-Mk3-6-0, (C) EC-EARTH, (D) MIROC-ESM-CHEM, (E) NorESM1-M.
With climate change, extreme climatic events have become more frequent worldwide (Calanca, 2007; Dobler et al., 2012; Gama et al., 2013; Schinko et al., 2017; Frame et al., 2020). Thus, it is essential to explore the different-class precipitation variations, especially non-rainfall, light, and heavy rainfall, which would result in drought or flood disasters. In this study, we chose six classes of precipitation based on the daily intensity in the five CMIP5 models. They are non-rainfall 0–0.5 mm day−1, very weak 0.5–5 mm day−1, relatively weak 5–10 mm day−1, moderate 10–20 mm day−1, relatively heavy rainfall 20–35 mm day−1, and very heavy >35 mm day−1. The frequency of each class in each region (in terms of the province to which belongs) is calculated. Figure 6 illustrates the histograms of the precipitation frequency in the nine regions as a function of the daily precipitation class. Most precipitation falls into either non-rainfall 0–0.5 mm day−1, very weak 0.5–5 mm day−1, or relatively weak 5–10 mm day−1. Their frequencies do not show big differences among the five CMIP5 models and are mainly consistent with the observations. However, large uncertainties exist in the classes of moderate 10–20 mm day−1, relatively heavy rainfall 20–35 mm day−1, and especially in very heavy rainfall >35 mm day−1. It is worth noting that generally, the GCMs overestimate heavy rainfall such as in Henan province (h) and Shandong province (i). The large uncertainties and deviations for heavy rainfall from GCMs indicate more risk in future projections and the necessity to explore their credibility.
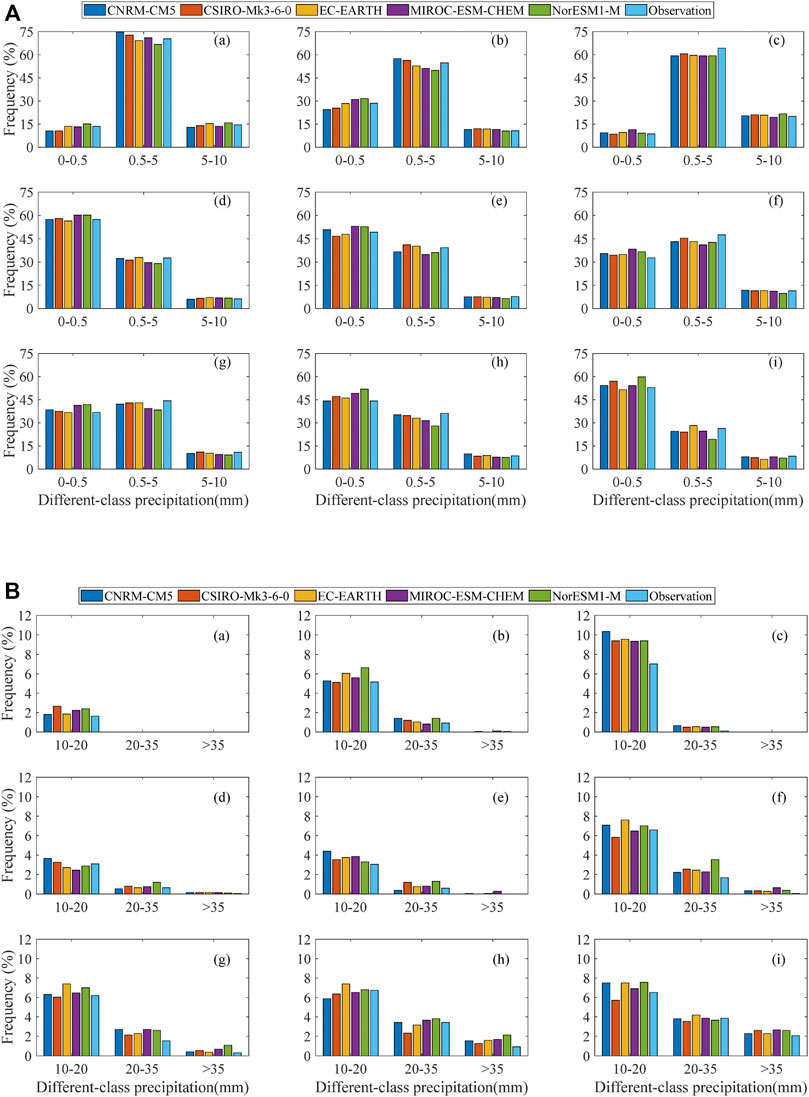
FIGURE 6. Histogram of the frequency of the simulated different-class precipitation in provinces from the five CMIP5 models [non-rainfall 0–0.5 mm day−1, very weak 0.5–5 mm day−1, relatively weak 5–10 mm day−1, moderate 10–20 mm day−1, relatively heavy rainfall 20–35 mm day−1, and very heavy >35 mm day−1: (a–i) represents nine regions of (a)-Qinghai, (b)-Gansu, (c)-Sichuan, (d)-Ningxia, (e)-Inner Mongolia, (f)-Shaanxi, (g)-Shanxi, (h)-Henan, and (i)-Shandong].
3.2 Multi-Model Ensemble Analysis
Given the huge uncertainty of individual and averaged models, BMA is employed to produce the MME, taking account of the model performances. The BMA weights of models are deduced by an EM algorithm and are listed in Table 1. Thus, the ensemble projection could be derived from the weighted average.
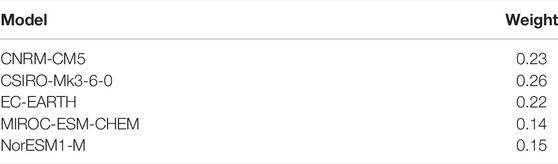
TABLE 1. BMA weights of each model for the whole basin.
However, one weight group could not reflect the ability of each CMIP5 model due to the huge spatial differences, as shown in Figure 5. In view of the spatial differences, especially in a so large-span Yellow river basin, a new grid-based BMA for each grid is imported into the MME analysis in this study. Each grid has its own weight group, according to the different performances of the five CMIP5 models. Figure 7 illustrates the weights’ distribution in the Yellow River basin for each CMIP5 model. EC-EARTCH has high weights on the upper reach, and NorESM1-M has high weights in the northwest part of Inner Mongolia. There is no uniform distribution even for the other CMIP5 models of CNRM-CM5, CSIRO-MK3-6-0, and MIROC-ESM-CHEM. Thus, grid-based BMA that allows for spatial differences is more reasonable than BMA for the whole large-span basin.
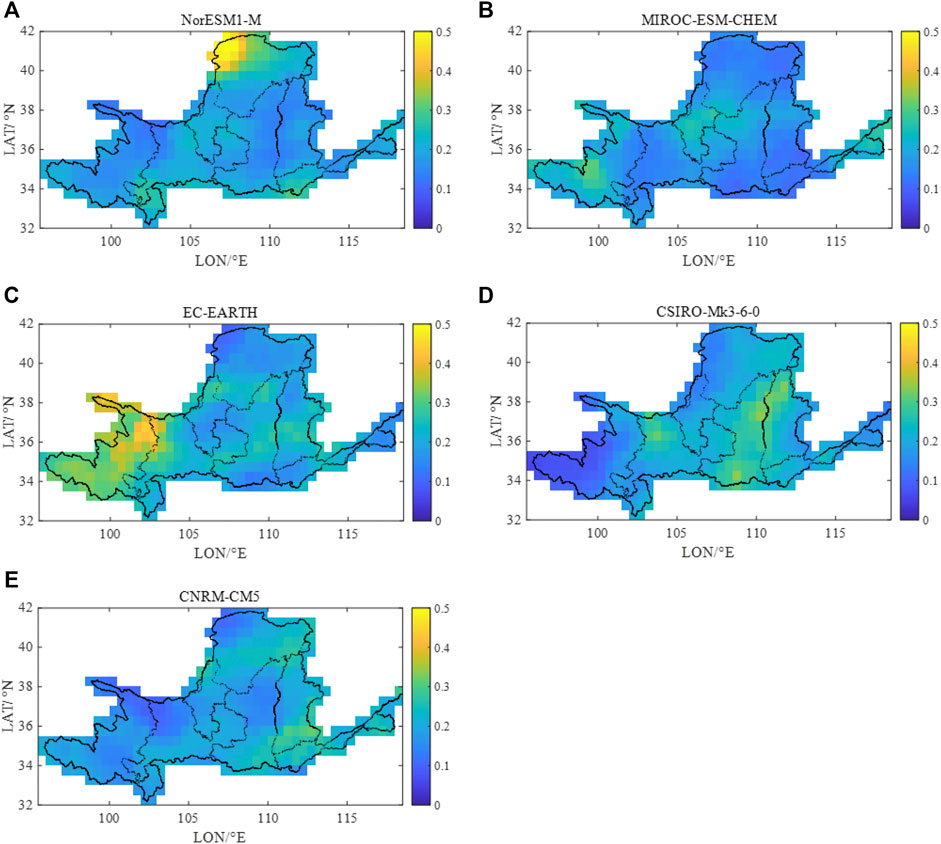
FIGURE 7. Weights on each grid of the five CMIP5 models from grid-based BMA. (A–E) represents five CMIP5 models of (A) NorESM1-M, (B) MIROC-ESM-CHEM, (C) EC-EARTH, (D) CSIRO-Mk3-6-0, (E) CNRM-CM5.
The Taylor diagram of each model, BMA, and grid-based BMA ensemble is shown in Figure 8. There are three indexes in the Taylor diagram. The correlation coefficient of projection and observation reflects the ability of model simulation in the center of the location. Root-mean-square error (RMSE) reflects the pattern similarity of projection and observation: the closer to 0, the better will be the performance of the model. Standard deviation demonstrates the ability of the model simulation in center amplitude. As mentioned earlier, here the five models have first been selected from the CMIP5 models, and it seems that each model is not too bad in Figure 8. However, the MME projections improve remarkably using BMA and grid-based BMA. Since the indexes of the Taylor diagram are derived from the averaged indexes for all grids, the differences between grids have been averaged. It seems that the grid-based BMA is slightly better than BMA, but the advantage lies in its consideration of spatial differences.
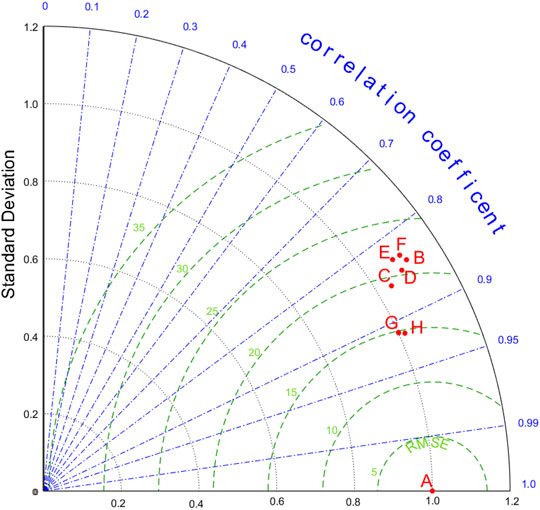
FIGURE 8. Taylor diagram of the five CMIP5 models, BMA, and grid-based BMA ensemble (A represents observation, and B to H represent CNRM-CM5, CSIRO-Mk3-6-0, EC-EARTH, MIROC-ESM-CHEM, NorESM1-M, BMA, and grid-based BMA separately).
Figure 9 shows the deviations of grid-based BMA and BMA ensembles from the observation in 1986–2005. The grid-based BMA presents different results in the northern part of Inner Mongolia and Ningxia and the western part of Qinghai province. The grid-based BMA could actually reflect the local grid’s deviations, which might be very important for local measures, especially for future water strategy in the irrigated farming area such as the northern part of Inner Mongolia and Ningxia. The more detailed projection as grids could make the local measures more targeted and effective. Though the deviations there have not been improved remarkably due to the limits of GCMs (e.g., the red parts in Figure 9), the grid-based BMA generally reduces the projected errors in terms of local grids.
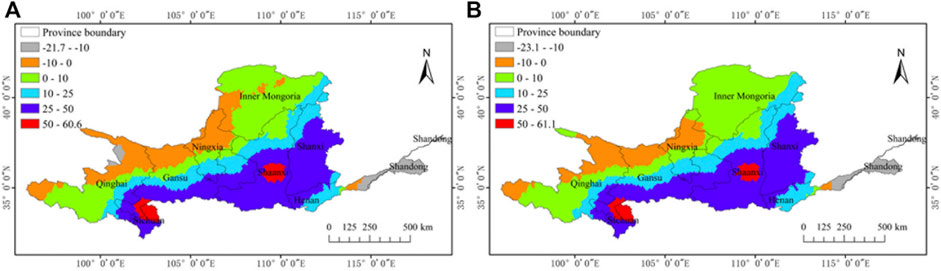
FIGURE 9. Annual total precipitation deviations of grid-based BMA (A) and BMA (B) ensembles with observation in 1986–2005 (mm, positive deviation means overestimation; minus means underestimation).
3.3 Projections of Future Precipitation
With the grid-based BMA weights in the baseline period, the future precipitation of the Yellow River in 2021–2050 and 2061–2090 is calculated as shown in Figure 10, with the observed annual precipitation for comparison. In general, the future precipitation shows an increasing trend, which is consistent with the previous study (Bao and Feng, 2016; Li et al., 2020). It is worth noting that it is assumed that the performance of the models remains consistent and stationary in the future. From Figure 11, the precipitation will increase throughout the YRB in the future, while the regions of rainfall lower than 200 mm will shrink progressively and other higher rainfall regions will expand, even for 800 mm. Again, the 400 mm isohyet will move to the north and west (Liu et al., 2019), which might have a deep impact since it is the important geographical marker of semi-arid and semi-humid regions in China. Taking the near and far future into account, the period of 2061–2090 shows a more remarkable increasing trend than 2021–2050.
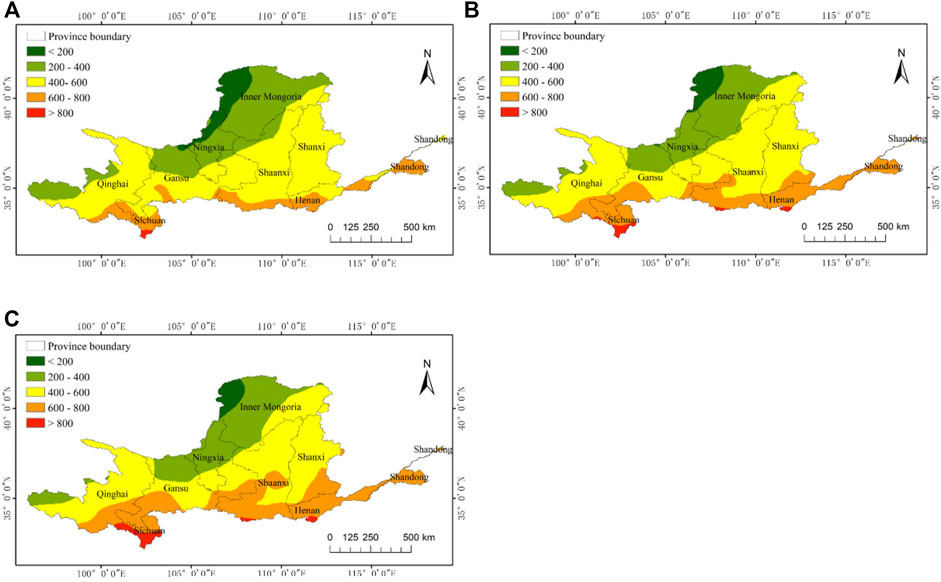
FIGURE 10. Averaged annual precipitation distribution of the YRB in the historical period of 1986–2005. (A) Grid-based BMA ensemble projection of the Yellow River basin in the future period of 2021–2050 (B) and 2061–2090 (C).
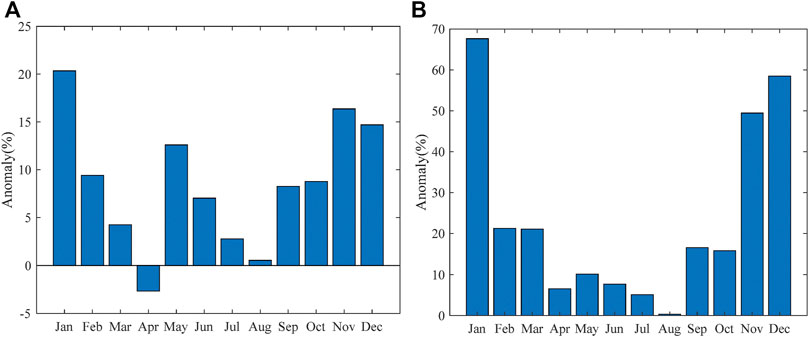
FIGURE 11. Averaged monthly precipitation anomaly in the future period of 2021–2050 (A) and 2061–2090 (B).
Figure 11 shows the future averaged monthly precipitation anomaly, which illustrates that the monthly precipitation will increase, especially between November and the following January. Only in April in the period of 2021–2050, it will slightly decrease. Precipitation in 2061–2090 will increase more than that of 2021–2050. This indicates an overall increase in the trend in precipitation in space and time.
The future variations in terms of different-class precipitation do not show vast differences compared with the observed series in the upper YRB, while a remarkable increase exists in (g)-Shanxi, (h)-Henan, and (i)-Shandong, especially above 5 mm (Figure 12). The risk of heavy rainfall might increase in Shanxi, Henan, and Shandong in the future and deserves more attention, although the daily precipitation projection might have great uncertainties.
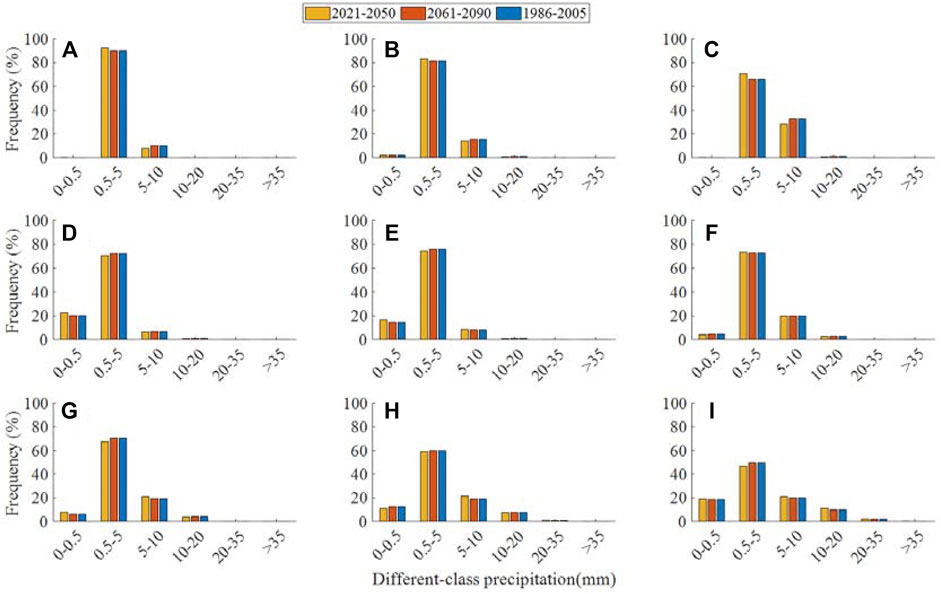
FIGURE 12. Histogram of the frequency of the future projected precipitation in provinces [non-rainfall 0–0.5 mm day−1, very weak 0.5–5 mm day−1, relatively weak 5–10 mm day−1, moderate 10–20 mm day−1, relatively heavy rainfall 20–35 mm day−1, and very heavy >35 mm day−1. (A–I) represents nine regions of (A)-Qinghai, (B)-Gansu, (C)-Sichuan, (D)-Ningxia, (E)-Inner Mongolia, (F)-Shaanxi, (G)-Shanxi, (H)-Henan, and (I)-Shandong].
3.4 Probability and Credibility of Future Precipitation Projection
3.4.1 Future Probability Projection in the Yellow River Basin
Three thresholds are selected: 25 mm, 50 mm, and 100 mm. The probabilities are quite small for future annual precipitation to decrease more than 25 mm and increase more than 100 mm, which are not displayed here. In the near future period of 2021–2050 (Figure 13), only some areas in the northern part of Inner Mongolia and the eastern part of Gansu show a decrease of 0–25 mm with a probability of above 40% (Figure 13A, yellow part), while other regions show an increase with higher probability. In general, precipitation in most of the Yellow River basin will increase by 0–25 mm, 25–50 mm, and 50–100 mm for the northern part of Shaanxi and Shanxi (Figure 13C).
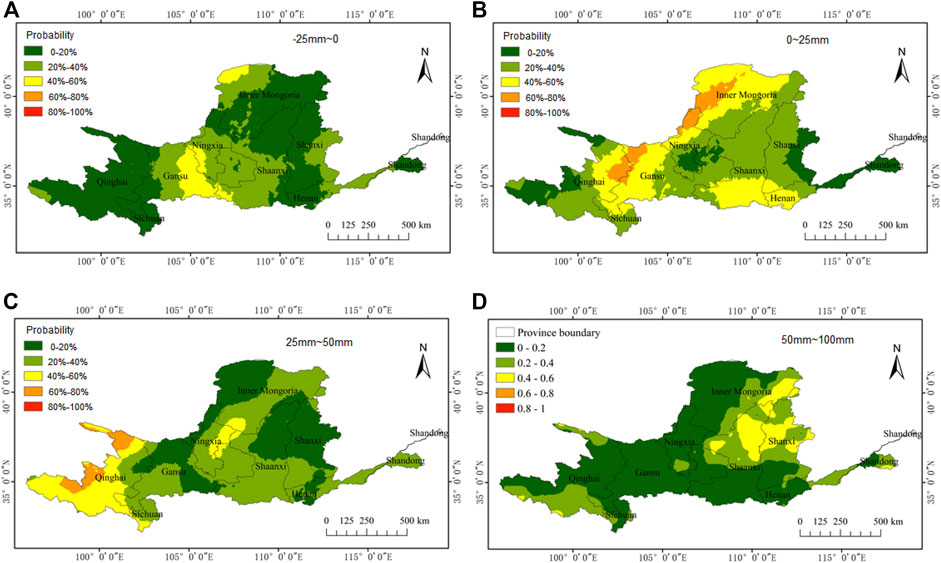
FIGURE 13. Annual average precipitation probability projection in the future period of 2021–2050. (A–D) represents four variations of (A) −25 to 0 mm, (B) 0 to 25 mm, (C) 25 to 50 mm, (D) 50 to 100 mm.
The probability of a decreasing trend is reduced and that of an increasing trend rises in the further period of 2061–2091 (Figure 14). The probability is even higher than 80% for some parts (in red) for a 0–25 mm (Figure 14B) and a 25–50 mm (Figure 14C) increase. The part of probability higher than 40% also expands with a 50–100 mm increase (Figure 14D). This is consistent with the more significant overall increasing trend for projected precipitation in the far future of 2061–2090.
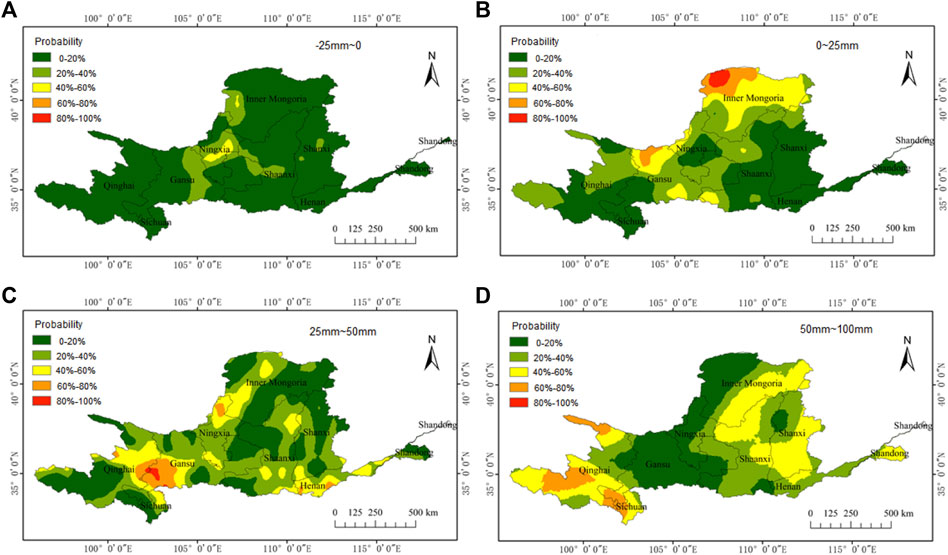
FIGURE 14. Annual average precipitation probability projection in the future period of 2061–2090. (A–D) represents four variations of (A) −25 to 0 mm, (B) 0 to 25 mm, (C) 25 to 50 mm, (D) 50 to 100 mm.
3.4.2 Credibility of Future Precipitation Ensemble Projection
Figure 15 provides signal-to-noise ratios for future projected precipitation based on the grid-based BMA in the Yellow River basin. The SNR of the northern and southern parts are smaller than 1, which demonstrates the signals are weaker here and lower in credibility. Meanwhile, the middle part is larger than 1, which illustrates the stronger signals and more credibility. These cases are consistent with the lower probability in Figure 13 for the northern and southern parts. The far future of 2061–2091 (Figure 15B) shows more regions with higher SNR and more credibility. Though the spatial differences in SNR, the GCMs demonstrate better credibility in the far future. It is worth noting that the southern parts of Shanxi, Shaanxi, and the northern areas of Henan are relatively lower in SNR and have weak credibility, which means that the deduction of the future heavy rainfall risk and variation analysis in those regions are more uncertain, in contrast with that of Shandong.
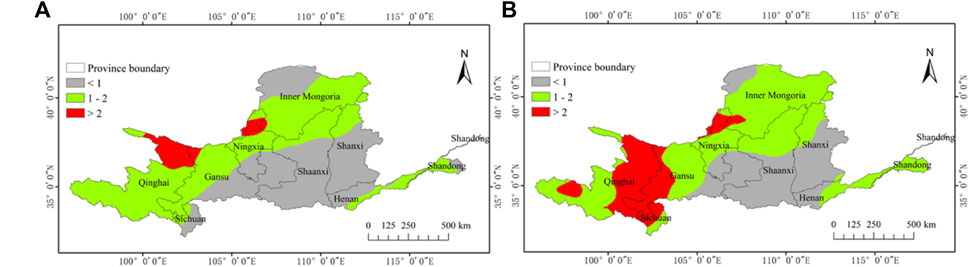
FIGURE 15. Signal-to-noise ratios of the future projected precipitation based on the grid-based BMA in the future period of 2021–2050 (A) and 2061–2090 (B).
The other interesting phenomenon is that the credibility of 2061–2090 is higher in a larger scope such as in the red regions in Figure 15B, which not necessarily means a more credible projection in the far future. It illustrates that for the far future, the GCMs are more consistent and have smaller differences since the far future scenarios show more inherent uncertainty and similar assumptions in all GCMs. Fundamentally, more evidence-based data, in-depth understanding, and exact mapping in GCMs are needed to improve their credibility.
4 Discussion and Conclusion
The development of GCMs enables projections of future climate and even water resource trends. The main challenge is that it is difficult, especially for decision-makers, to trust the predictions, given the huge uncertainty and even opposing results of GCMs. There have been plenty of publications on the evaluation and uncertainty in GCM models, including the Coupled Model Intercomparison Project of CMIP5. Normally climate researchers will suggest several models that are more reliable based on comparative analysis with observations in space and time for the specified basin. However, it is not still simple or used directly if the output of GCMs is imported into further analysis, such as the projected precipitation for future water resources. The current analysis usually focuses on one point or some aspects of the uncertainty and credibility of GCMs, but it lacks an overall operational process to deal with these problems. Thus, this study proposed a framework for an ensemble result generation process in a more credible manner for the future-projected precipitation, in which a new BMA model based on a grid is built to express spatial differences of models for long-span basins.
Five models from CMIP5 are addressed in this study due to the evaluation of the Yellow River basin from the China Meteorological Administration. In the historical period of 1986–2005, the models show a significant spread in space and time. The variations are mostly around ‒50 to 50 mm and demonstrated a great difference in space and even opposite trends in some regions. For different-class precipitation, the uncertainties of the five models are small in relatively weak rainfall but large in heavy rainfall, indicating more risk in future projections and the necessity to explore their credibility. It is quite hard to select the best or most reliable model, given the large uncertainty. However, it is worth noting that the spatial complementary could be expected for less deviation in amplitude. The MME should be a way to reduce the simulation uncertainty and improve GCM predictions.
In contrast with BMA, the grid-based BMA generally represents the spatial differences and performances of each GCM, resulting in a more reliable projection for each grid. It could somehow overcome individual differences and address relatively creditable information from more models on a grid-scale, which could avoid the leveling effect errors in a spatial scale from BMA. This is very critical for a large and long-span basin. However, real improvement still depends on better GCM models. If all the selected models fail in one grid, it is still impossible to get the correct projection even on such a grid scale.
The future precipitation of the YRB in 2021–2051 and 2061–2090 is calculated based on the grid-based BMA, which presents an increasing trend all over the YRB. The regions of rainfall lower than 200 mm will shrink progressively and other higher rainfall areas will expand, even for 800 mm, which is more remarkable for a further future period of 2061–2090. The 400 mm isohyet will also move to the north and west, which might have a deep impact as the geographical marker of semi-arid and semi-humid regions in China. Moreover, the monthly precipitation anomaly generally also shows an increasing trend, and the risk of heavy rainfall might increase in Shanxi, Henan, and Shandong provinces.
If taking the 40% as the accepted probability of projections, in the near future period of 2021–2050, precipitation in most of the Yellow River basin will increase by 0–25 mm and 25–50 mm and by 50–100 mm for the northern parts of Shaanxi and Shanxi. The probability goes up even higher than 80% for some parts for 0–25 mm and 25–50 mm, and the area with a probability higher than 40% extends to a larger region. The increasing trend and amplitude will be more concrete in the far future period of 2061–2090.
According to the signal-to-noise ratios, the middle parts of the YRB such as Qinghai, Gansu, and Ningxia provinces, the south and middle of Inner Mongolia, the north of Shaanxi, and Shanxi present higher values and credibility, which means that the projections in these regions have high credibility. While the other projections are less reliable, the risk exists in the higher precipitation regions in the southern part of the YRB, which will bring new challenges for flood control and mitigation. It is also worth noting that the credibility of 2061–2090 is higher in the larger scope, which is due to the similar assumptions in all GCMs, allowing for the more inherent uncertainty in the far future scenarios rather than better credibility. It ultimately requires more evidence-based data, in-depth understanding, and exact mapping in GCMs to improve the credibility of future projections.
The proposed framework here consists of downscaling, uncertainty analysis (model spread and Taylor diagram), ensemble analysis (a grid-based BMA), credibility analysis (signal-to-noise ratio), and probability projection. It provides a whole chain and novel way for identifying uncertainty and credibility. In particular, the new proposed GBMA method could help produce a more reliable ensemble projection, given the current capabilities of GCMs. This issue is very crucial for assessing risks for disaster and water resource management strategy on the basis of future precipitation projection.
GCMs mainly lie in the spatial differences in performance, especially for local regions, given the different settings of boundary conditions, parameters, and dynamical mechanisms. Quite a few studies find the different GCMs show significant differences in reproducing the historical climate and weather for large areas all over the world, which could be relative to the geography, land cover, etc., Thus, the grid scale or other similar representative units shall be involved to do multi-model ensemble rather than model evaluation on a whole large basin. Though the fundamental improvements of projections rely on more accurate GCMs, the ensemble way could first go further for a more positive spatial expression. As the new GCMs of CMIP6 improve and uncertainties reduce, this proposed framework could play a powerful role in a more credible ensemble projection in the future.
Data Availability Statement
The original contributions presented in the study are included in the article/Supplementary Material, further inquiries can be directed to the corresponding author.
Author Contributions
TG contributed to the original idea of methodology, data curation, and writing the draft manuscript. YL was responsible for conceptualization and methodology development, funding acquisition, and writing—review and editing. ZS helped with data analysis and made coding work on methodology. JZ provided supervision on conceptualization and methodology. HC and GW contributed to the detailed discussion on the results. JJ helped design the approach and coding. ZB and WQ contributed to the writing—review and editing.
Funding
This work was financially supported by the National Natural Science Foundation of China (Grant No. 52079079), the National Key Research and Development Program of China (Grant No. 2018YFC1508104), the Natural Science Foundation of Jiangsu Province (Grant No. BK20191129), and the National Key Research and Development Program of Zhejiang Province (Grant No. 2021C03017).
Conflict of Interest
The authors declare that the research was conducted in the absence of any commercial or financial relationships that could be construed as a potential conflict of interest.
Publisher’s Note
All claims expressed in this article are solely those of the authors and do not necessarily represent those of their affiliated organizations, or those of the publisher, the editors and the reviewers. Any product that may be evaluated in this article, or claim that may be made by its manufacturer, is not guaranteed or endorsed by the publisher.
Acknowledgments
We extend our cordial gratitude to the reviewers for their professional reviewing and constructive comments which are greatly helpful for further improvement of the quality of this manuscript. We also thank the editor for the encouragement.
References
Ahmadalipour, A., Rana, A., Moradkhani, H., and Sharma, A. (2017). Multi-Criteria Evaluation of CMIP5 GCMs for Climate Change Impact Analysis. Theor. Appl. Climatol 128, 71–87. doi:10.1007/s00704-015-1695-4
Ajami, N. K., Duan, Q., and Sorooshian, S. (2007). An Integrated Hydrologic Bayesian Multimodel Combination Framework: Confronting Input, Parameter, and Model Structural Uncertainty in Hydrologic Prediction. Water Resour. Res. 43 (1), 208–214. doi:10.1029/2005wr004745
Allen, M. R., Stott, P. A., Mitchell, J. F. B., Schnur, R., and Delworth, T. L. (2000). Quantifying the Uncertainty in Forecasts of Anthropogenic Climate Change. Nature 407, 617–620. doi:10.1038/35036559
Bao, J., and Feng, J. (2016). Intercomparison of CMIP5 Simulations of Summer Precipitation, Evaporation, and Water Vapor Transport over Yellow and Yangtze River Basins. Theor. Appl. Climatol 123, 437–452. doi:10.1007/s00704-014-1349-y
Calanca, P. (2007). Climate Change and Drought Occurrence in the Alpine Region: How Severe Are Becoming the Extremes? Glob. Planet. Change 57 (1-2), 151–160. doi:10.1016/j.gloplacha.2006.11.001
Chen, X. C., Xu, Y., Xu, C. H., and Yao, Yao. (2014). Assessment of Precipitation Simulation in China by CMIP5 Multi-Models. Clim. Change Res. (In Chinese) 10 (3), 217–225. doi:10.3969/j.issn.1673-1719.2014.03.011
Chen, Y. D., Li, J., and Zhang, Q. (2016). Changes in Site-Scale Temperature Extremes over China during 2071-2100 in CMIP5 Simulations. J. Geophys. Res. Atmos. 121 (6), 2732–2749. doi:10.1002/2015jd024287
Chiyuan Miao, C., Jinren Ni, J., and Borthwick, A. G. L. (2010). Recent Changes of Water Discharge and Sediment Load in the Yellow River basin, China. Prog. Phys. Geogr. Earth Environ. 34 (4), 541–561. doi:10.1177/0309133310369434
Collins, M., Chandler, R. E., Cox, P. M., Huthnance, J. M., Rougier, J., and Stephenson, D. B. (2012). Quantifying Future Climate Change. Nat. Clim Change 2 (6), 403–409. doi:10.1038/nclimate1414
Cubasch, U., Meehl, G. A., Boer, G. J., Stouffer, R. J., Dix, M., Noda, A., et al. (2001). “Projections of Future Climate Change,” in Climate Change 2001: The Scientific Basis. Contribution of Working Group I to the Third Assessment Report of the Intergovernmental Panel on Climate Change. (Cambridge: Cambridge Univ. Press), 525–582.
Demirel, M. C., and Moradkhani, H. (2016). Assessing the Impact of CMIP5 Climate Multi-Modeling on Estimating the Precipitation Seasonality and Timing. Climatic Change 135 (2), 357–372. doi:10.1007/s10584-015-1559-z
Dobler, C., Bürger, G., and Stötter, J. (2012). Assessment of Climate Change Impacts on Flood hazard Potential in the Alpine Lech Watershed. J. Hydrol. 460-461, 29–39. doi:10.1016/j.jhydrol.2012.06.027
Dong, L. H., Xiong, L. H., and Wan, M. (2011). Uncertainty Analysis of Hydrological Modeling Using the Bayesian Model Averaging Method. J. Hydraulic Eng. (In Chinese) 42 (9), 1065. doi:10.13243/j.cnki.slxb.2011.09.002
Duan, Q., Ajami, N. K., Gao, X., and Sorooshian, S. (2007). Multi-model Ensemble Hydrologic Prediction Using Bayesian Model Averaging. Adv. Water Resour. 30 (5), 1371–1386. doi:10.1016/j.advwatres.2006.11.014
Eghdamirad, S., Johnson, F., and Sharma, A. (2017). Using Second-Order Approximation to Incorporate GCM Uncertainty in Climate Change Impact Assessments. Climatic Change 142 (1-2), 37–52. doi:10.1007/s10584-017-1944-x
Forster, P. M., Andrews, T., Good, P., Gregory, J. M., Jackson, L. S., and Zelinka, M. (2013). Evaluating Adjusted Forcing and Model Spread for Historical and Future Scenarios in the CMIP5 Generation of Climate Models. J. Geophys. Res. Atmos. 118 (3), 1139–1150. doi:10.1002/jgrd.50174
Frame, D. J., Rosier, S. M., Noy, I., Harrington, L. J., Carey-Smith, T., Sparrow, S. N., et al. (2020). Climate Change Attribution and the Economic Costs of Extreme Weather Events: a Study on Damages from Extreme Rainfall and Drought. Climatic Change 162 (2), 781–797. doi:10.1007/s10584-020-02729-y
Friedlingstein, P., Meinshausen, M., Arora, V. K., Jones, C. D., Anav, A., Liddicoat, S. K., et al. (2014). Uncertainties in CMIP5 Climate Projections Due to Carbon Cycle Feedbacks. J. Clim. 27 (2), 511–526. doi:10.1175/JCLI-D-12-00579.1
Gama, M. C., Popescu, I., and Mynett, A. (2013). Modelling Extreme Flood hazard Events on the Middle Yellow River Using DFLOW-Flexible Mesh Approach. Nat. Hazards Earth Syst. Sci. Discuss. 1 (6), 6061–6092. doi:10.5194/nhessd-1-6061-2013
Georgescu, M., Broadbent, A. M., Wang, M., Krayenhoff, E. S., and Moustaoui, M. (2021). Precipitation Response to Climate Change and Urban Development over the continental United States. Environ. Res. Lett. 16 (416pp), 044001. doi:10.1088/1748-9326/abd8ac
Giorgi, F., and Mearns, L. O. (2002). Calculation of Average, Uncertainty Range, and Reliability of Regional Climate Changes from AOGCM Simulations via the “Reliability Ensemble Averaging” (REA) Method. J. Clim. 15 (10), 1141–1158. doi:10.1175/1520-0442(2002)015<1141:coaura>2.0.co;2
Grainger, S., Frederiksen, C. S., and Zheng, X. (2013). Modes of Interannual Variability of Southern Hemisphere Atmospheric Circulation in CMIP3 Models: Assessment and Projections. Clim. Dyn. 41, 479–500. doi:10.1007/s00382-012-1659-7
Hasson, S. u., Pascale, S., Lucarini, V., and Böhner, J. (2016). Seasonal Cycle of Precipitation over Major River Basins in South and Southeast Asia: A Review of the CMIP5 Climate Models Data for Present Climate and Future Climate Projections. Atmos. Res. 180 (180), 42–63. doi:10.1016/j.atmosres.2016.05.008
Hertig, E., Seubert, S., Paxian, A., Vogt, G., Paeth, H., and Jacobeit, J. (2014). Statistical Modelling of Extreme Precipitation Indices for the Mediterranean Area under Future Climate Change. Int. J. Climatol. 34 (4), 1132–1156. doi:10.1002/joc.3751
Huang, D.-Q., Zhu, J., Zhang, Y.-C., and Huang, A.-N. (2013). Uncertainties on the Simulated Summer Precipitation over Eastern china from the Cmip5 Models. J. Geophys. Res. Atmos. 118 (16), 9035–9047. doi:10.1002/jgrd.50695
Hui, P., Tang, J., Wang, S., Niu, X., Zong, P., and Dong, X. (2018). Climate Change Projections over China Using Regional Climate Models Forced by Two CMIP5 Global Models. Part II: Projections of Future Climate. Int. J. Climatol 38 (s1), e78–e94. doi:10.1002/joc.5409
Jiang, X. F., Li, W., and You, Q. L. (2018). Probability Projection and Uncertainties of the Temperature Extreme Indices Change over China. Clim. Change Res. (In Chinese) 14 (3), 228–236. doi:10.12006/j.issn.1673-1719.2017.202
Jin, J., Wang, G., Zhang, J., Yang, Q., Liu, C., Liu, Y., et al. (2020). Impacts of Climate Change on Hydrology in the Yellow River Source Region, China. J. Water Clim. Change 11 (3), 916–930. doi:10.2166/wcc.2018.085
Kang, L. L., Ruby, L. L., and Liu, C. (2015). Simulative Study of Future Climate and Hydrological Change over the Yellow River basin. Acta Meteorologica Sinica (In Chinese) 73 (2), 382. doi:10.11676/qxxb2015.016
Knutti, R., and Sedláček, J. (2013). Robustness and Uncertainties in the New CMIP5 Climate Model Projections. Nat. Clim Change 3 (4), 369–373. doi:10.1038/nclimate1716
Knutti, R. (2010). The End of Model Democracy? Climatic Change 102 (3-4), 395–404. doi:10.1007/s10584-010-9800-2
Kong, J., Shin, Y., Röhr, J. A., Wang, H., Meng, J., Wu, Y., et al. (2021). CO2 Doping of Organic Interlayers for Perovskite Solar Cells. Nature 594 (7861), 51–56. doi:10.1038/s41586-021-03518-y
Krishnamurti, T. N., Kishtawal, C. M., Zhang, Z., Larow, T., Bachiochi, D., Williford, E., et al. (2000). Multimodel Ensemble Forecasts for Weather and Seasonal Climate. J. Clim. 13, 4196–4216. doi:10.1175/1520-0442(2000)013<4196:meffwa>2.0.co;2
Kumar, A., Mitra, A. K., Bohra, A. K., Iyengar, G. R., and Durai, V. R. (2012). Multi-model Ensemble (MME) Prediction of Rainfall Using Neural Networks during Monsoon Season in India. Met. Apps 19 (2), 161–169. doi:10.1002/met.254
Lee, J. Y., and Wang, B. (2014). Future Change of Global Monsoon in the CMIP5. Clim. Dyn. 42 (1-2), 101–119. doi:10.1007/s00382-012-1564-0
Lee, S., Qi, J., Mccarty, G. W., Yeo, I.-Y., Zhang, X., Moglen, G. E., et al. (2021). Uncertainty Assessment of Multi-Parameter, Multi-GCM, and Multi-RCP Simulations for Streamflow and Non-floodplain Wetland (NFW) Water Storage. J. Hydrol. 600, 126564. doi:10.1016/j.jhydrol.2021.126564
Li, H., Feng, L., and Zhou, T. (2011). Multi-model Projection of July-August Climate Extreme Changes over China under CO2 Doubling. Part I: Precipitation. Adv. Atmos. Sci. 2011 (28), 433–447. doi:10.1007/s00376-010-0013-4
Li, J., Zhao, Y., and Tang, Z. (2020). Projection of Future Summer Precipitation over the Yellow River Basin: A Moisture Budget Perspective[J]. Atmosphere 11 (12), 1370. doi:10.3390/atmos11121307
Li, Z., Mingcai, L., and Ronghui, C. (2018). Projection and Uncertainties of Extreme Precipitation over the Yangtze River valley in the Early 21st century. Acta Meteorologica Sinica (In Chinese) 76 (1), 47–59. doi:10.11676/qxxb2017.076
Lin, W., and Wen, C. (2014). A CMIP5 Multimodel Projection of Future Temperature, Precipitation, and Climatological Drought in China[J]. Int. J. Climatology 34 (6), 2059–2078. doi:10.1002/joc.3822
Lin, Z. H., Yang, X. Y., and Wu, C. L. (2018). Capability Assessment of CMIP5 Models in Reproducing Observed Climatology and Decadal Changes in Summer Rainfall with Different Intensities over Eastern China. Climatic Environ. Res. (In Chinese) 23 (1), 1–25. doi:10.3878/j.issn.1006-9585.2017.16207
Liu, Y., Tang, X., and Sun, Z. (2019). Spatiotemporal Precipitation Variability and Potential Drivers during 1961–2015 over the Yellow River Basin, China. Weather 74 (S1), S32–S39. doi:10.1002/wea.3517
Liu, Z., Ballantyne, A. P., Poulter, B., Anderegg, W. R. L., Li, W., Bastos, A., et al. (2018). Precipitation Thresholds Regulate Net Carbon Exchange at the continental Scale. Nat. Commun. 9, 3596. doi:10.1038/s41467-018-05948-1
Lu, R. Y., and Fu, Y. H. (2009). Intensification of East Asian Summer Rainfall Interannual Variability in the Twenty-First Century Simulated by 12 CMIP3 Coupled Models. J. Clim. 23 (12), 3316–3331. doi:10.1175/2009JCLI3130.1
Ma, Y., Hong, Y., Chen, Y., Yang, Y., Tang, G., Yao, Y., et al. (2018). Performance of Optimally Merged Multisatellite Precipitation Products Using the Dynamic Bayesian Model Averaging Scheme over the Tibetan Plateau. J. Geophys. Res. Atmos. 123 (2), 814–834. doi:10.1002/2017JD026648
Mahlstein, I., Portmann, R. W., Daniel, J. S., Solomon, S., and Knutti, R. (2012). Perceptible Changes in Regional Precipitation in a Future Climate. Geophys. Res. Lett. 39 (5), a–n. doi:10.1029/2011GL050738
Maurer, E. P., and Pierce, D. W. (2014). Bias Correction Can Modify Climate Model Simulated Precipitation Changes without Adverse Effect on the Ensemble Mean. Hydrol. Earth Syst. Sci. 18 (9), 915–925. doi:10.5194/hess-18-915-2014
Mehran, A., Aghakouchak, A., and Phillips, T. J. (2014). Evaluation of CMIP5 continental Precipitation Simulations Relative to Satellite-Based Gauge-Adjusted Observations. J. Geophys. Res. Atmos. 119 (4), 1695–1707. doi:10.1002/2013jd021152
Ongoma, V., Chen, H., and Gao, C. (2018). Future Changes in Climate Extremes over Equatorial East Africa Based on CMIP5 Multimodel Ensemble. Nat. Hazards 90 (2), 901–920. doi:10.1007/s11069-017-3079-9
Raftery, A. E., Gneiting, T., Balabdaoui, F., and Polakowski, M. (2005). Using Bayesian Model Averaging to Calibrate Forecast Ensembles. Monthly Weather Rev. 133 (5), 1155–1174. doi:10.1175/mwr2906.1
Raftery, A. E., and Zheng, Y. (2003). Discussion. J. Am. Stat. Assoc. 98, 931–938. doi:10.1198/016214503000000891
Reichler, T., and Kim, J. (2008). How Well Do Coupled Models Simulate Today's Climate? Bull. Amer. Meteorol. Soc. 89 (3), 303–312. doi:10.1175/bams-89-3-303
Sabeerali, C. T., Rao, S. A., and Dhakate, A. R. (2015). Why Ensemble Mean Projection of South Asian Monsoon Rainfall by CMIP5 Models Is Not Reliable? Clim. Dyn. 45 (1-2), 161–174. doi:10.1007/s00382-014-2269-3
Schinko, T., Mechler, R., and Hochrainer-Stigler, S. (2017). A Methodological Framework to Operationalize Climate Risk Management: Managing Sovereign Climate-Related Extreme Event Risk in Austria. Mitig Adapt Strateg. Glob. Change 22 (7), 1063–1086. doi:10.1007/s11027-016-9713-0
Seo, K.-H., and Ok, J. (2013). Assessing Future Changes in the East Asian Summer Monsoon Using CMIP3 Models: Results from the Best Model Ensemble. J. Clim. 26, 1807–1817. doi:10.1175/jcli-d-12-00109.1
Strategy, U. T. (2014). A Neural Network Nonlinear Multimodel Ensemble to Improve Precipitation Forecasts over Continental US. Adv. Meteorology, 2321. doi:10.1155/2012/649450
Sun, Q., Miao, C., and Duan, Q. (2015). Projected Changes in Temperature and Precipitation in Ten River Basins over China in 21st century. Int. J. Climatol. 35 (6), 1125–1141. doi:10.1002/joc.4043
Sun, Y., and Ding, Y. H. (2009). An Assessment on the Performance of IPCC AR4 Climate Models in Simulating Interdecadal Variations of the East Asian Summer Monsoon. Acta Meteorol. Sin. 22 (4), 472. doi:10.1029/2007JD008874
Tan, J. L., Jiang, Z. H., and Ma, T. T. (2016). Projections of Future Surface Air Temperature Change and Uncertainty over China Based on the Bayesian Model Averaging. Acta Meteorologica Sinica (In Chinese) 74 (4), 583. doi:10.11676/qxxb2016.044
Taylor, K. E., Stouffer, R. J., and Meehl, G. A. (2012). An Overview of CMIP5 and the Experiment Design. Bull. Am. Meteorol. Soc. 93 (4), 485–498. doi:10.1175/bams-d-11-00094.1
Taylor, K. E. (2001). Summarizing Multiple Aspects of Model Performance in a Single Diagram. J. Geophys. Res. 106 (D7), 7183–7192. doi:10.1029/2000jd900719
Thibeault, J. M., and Seth, A. (2012). A Framework for Evaluating Model Credibility for Warm-Season Precipitation in Northeastern North America: A Case Study of CMIP5 Simulations and Projections. J. Clim. 27 (2), 493. doi:10.1175/JCLI-D-12-00846.1
Toreti, A., and Naveau, P. (2015). On the Evaluation of Climate Model Simulated Precipitation Extremes. Environ. Res. Lett. 10 (1), 014012. doi:10.1088/1748-9326/10/1/014012
Van den Hurk, B., Braconnot, P., Eyring, V., Friedlingstein, P., Gleckler, P., Knutti, R., et al. (2013). “Assessing the Reliability of Climate Models, CMIP5,” in Climate Science for Serving Society. Editors G. Asrar, and J. Hurrell (Dordrecht: Springer), 237–248. doi:10.1007/978-94-007-6692-1_9
Vasconcellos, F. C., Deng, Y., Zhang, H., and Martins, G. (2020). Austral Summer Precipitation Biases over Tropical South America in Five CMIP5 Earth System Models. Int. J. Climatol 40 (15), 6506–6525. doi:10.1002/joc.6595
Vial, J., Dufresne, J. L., and Bony, S. (2013). On the Interpretation of Inter-model Spread in CMIP5 Climate Sensitivity Estimates. Clim. Dyn. 41 (11-12), 3339–3362. doi:10.1007/s00382-013-1725-9
Vrugt, J. A., and Robinson, B. A. (2007). Treatment of Uncertainty Using Ensemble Methods: Comparison of Sequential Data Assimilation and Bayesian Model Averaging. Water Resour. Res. 43, W01411. doi:10.1029/2005wr004838
Wang, X., Yang, T., Li, X., Shi, P., and Zhou, X. (2017). Spatio-temporal Changes of Precipitation and Temperature over the Pearl River basin Based on CMIP5 Multi-Model Ensemble. Stoch Environ. Res. Risk Assess. 31 (5), 1077–1089. doi:10.1007/s00477-016-1286-7
Wang, Y., Peng, S. M., and Zheng, X. K. (2018). Key Scientific Issues of Water Allocation Plan Optimization and Comprehensive Operation for Yellow River basin. Adv. Water Sci. (In Chinese) 29 (5), 614. doi:10.14042/j.cnki.32.1309.2018.05.002
Wang, C., Zhang, L., Lee, S.-K., Wu, L., and Mechoso, C. R. (2014). A Global Perspective on CMIP5 Climate Model Biases. Nat. Clim Change 4 (3), 201–205. doi:10.1038/nclimate2118
Wang, G. Q., Zhang, J. Y., and Jin, J. L. (2014). Variation Trend of RCP-Based Climatic Scenarios for Yellow River basin. J. China Hydrology(In Chinese) 34 (2), 8. doi:10.3969/j.issn.1000-0852.2014.02.003
Wei, J., Chang, J. X., and Chen, L. (2016). Runoff Change in Upper Reach of Yellow River under Future Climate Change Based on VIC Model. J. Hydroelectric Eng. (In Chinese) 35 (5), 65. doi:10.11660/slfdxb.20160508
Xia, J., Peng, S. M., and Wang, C. (2014). Impact of Climate Change on Water Resources and Adaptive Management in the Yellow River Basin. Yellow River (10), 115. doi:10.3969/j.issn.1000-1379.2014.10.001
Yang, X. L., Zhang, W. F., and Lin, C. Q. (2017). Prediction of Drought in the Yellow River Based on Statistical Downscale Study and SPI. J. Hohai Univ. (Natural Sciences) (In Chinese) 45 (5), 377. doi:10.3876/j.issn.1000-1980.2017.05.001
Yang, X., Yong, B., Yu, Z., and Zhang, Y. (2021). An Evaluation of CMIP5 Precipitation Simulations Using Ground Observations over Ten River Basins in China. Hydrol. Res. 52 (3), 676–698. doi:10.2166/nh.2021.151
Zhao, T., Bennett, J. C., Wang, Q. J., Schepen, A., Wood, A. W., Robertson, D. E., et al. (2017). How Suitable Is Quantile Mapping for Postprocessing GCM Precipitation Forecasts? J. Clim. 30 (9), 3185–3196. doi:10.1175/jcli-d-16-0652.1
Zhao, T., Chen, H., Xu, W., Cai, H., Yan, D., and Chen, X. (2020). Spatial Association of Anomaly Correlation for GCM Seasonal Forecasts of Global Precipitation. Clim. Dyn. 55, 2273–2286. doi:10.1007/s00382-020-05384-2
Zhou, S., Wang, Y. M., and Guo, A. J. (2018). Spatial and Temporal Features of Future Changes in Water Resources in Yellow River basin. J. Hydroelectric Eng. (In Chinese) 37 (3), 28. doi:10.11660/slfdxb.20180304
Zhou, T., and Yu, R. (2006). Twentieth-Century Surface Air Temperature over China and the Globe Simulated by Coupled Climate Models. J. Clim. 19 (22), 5843–5858. doi:10.1175/jcli3952.1
Zhou, W. C., and Han, Z. Y. (2018). Assessing CMIP5 Climate Simulations and Objective Selection of Models over the Yellow River basin. J. Meteorology Environ. (In Chinese) 34 (6), 42. doi:10.3969/j.issn.1673-503X.2018.06.005
Keywords: grid-based BMA, uncertainty, credibility, framework, CMIP5
Citation: Guan T, Liu Y, Sun Z, Zhang J, Chen H, Wang G, Jin J, Bao Z and Qi W (2022) A Framework to Identify the Uncertainty and Credibility of GCMs for Projected Future Precipitation: A Case Study in the Yellow River Basin, China. Front. Environ. Sci. 10:863575. doi: 10.3389/fenvs.2022.863575
Received: 27 January 2022; Accepted: 30 March 2022;
Published: 04 May 2022.
Edited by:
Xander Wang, University of Prince Edward Island, CanadaReviewed by:
Subimal Ghosh, Indian Institute of Technology Bombay, IndiaXin Li, Hohai University, China
Gen Li, Hohai University, China
Copyright © 2022 Guan, Liu, Sun, Zhang, Chen, Wang, Jin, Bao and Qi. This is an open-access article distributed under the terms of the Creative Commons Attribution License (CC BY). The use, distribution or reproduction in other forums is permitted, provided the original author(s) and the copyright owner(s) are credited and that the original publication in this journal is cited, in accordance with accepted academic practice. No use, distribution or reproduction is permitted which does not comply with these terms.
*Correspondence: Yanli Liu, ylliu@nhri.cn