 Xiaoye Li
 Yixuan Tang2
- 1School of Business, Sun Yat-sen University, Guangzhou, China
- 2College of Architectural Science and Engineering, Yangzhou University, Yangzhou, China
- 3College of Finance and Commerce, Zhongshan Torch Polytechnic, Zhongshan, China
- 4College of Business Administration, Shanghai Business School, Shanghai, China
Industrial carbon emissions efficiency requires a balance between economic development and carbon reduction to be achieved through structural adjustment and technological change, which is the key to low-carbon economic development and the essence of China’s carbon reduction commitment. Existing research has focused more on static carbon emission efficiency and provides insufficient analysis of the internal causes of inter-regional differences in carbon emission efficiency. This paper aims to fill this gap in the existing research. The data of 30 provinces in China, obtained from the Chinese Official Statistical Yearbook, were taken as the sample. We accurately measured the dynamic carbon emission efficiency of industrial energy (DCEEIE) in China by combining the three-stage slacks-based measure data envelopment analysis (SBM-DEA) model and the Malmquist-Luenberger model. This study further uses Dagum’s Gini coefficient decomposition and the panel vector auto regression (PVAR) model to empirically estimate regional differences in DCEEIE and the effects of its internal structure. The results show, first, that DCEEIE in China is increasing, and that overall energy efficiency is at a high level. Although both efficiency change and technological change are fundamental to efficiency, an attenuation of efficiency and a diffusion of technology are evident. Second, the total Gini coefficients of dynamic efficiency, efficiency change (EC), and technological change (TC) are all decreasing; regional differences and transvariation intensity are the main reasons for long-term gaps. Third, TC improves dynamic efficiency in the initial stages, but the main driving force in the long run is EC. The limitation of this paper is that we do not fully discuss the external factors which might impact TC and EC, nor do we continue the discussion on how to transform the energy mix by improving carbon efficiency, which is the future direction for green development. These issues represent avenues for future research.
1 Introduction
Energy consumption is an important factor in economic growth (Abbasi, et al., 2021b), and the circular economy is an important means of achieving sustainable development goals (Awan and Sroufe, 2022). According to a report by the IPCC (2020)1, it is more than 90% probable that the observable rise in global temperatures since the middle of the 20th century has been caused by CO2-based greenhouse gas emissions. The joint efforts of all the countries in the world are needed to achieve the global goal of reducing net CO2 emissions per capita to zero by 2050 and limiting the temperature increase to 1.5°C. Although the Kyoto Protocol does not stipulate quantitative emission reduction obligations for developing countries, a general trend toward low carbonization has taken shape. As the world’s largest developing country, with the largest increase in CO2, China’s performance in energy conservation and emission reduction has become the focus of international attention in the negotiations around the sharing of emissions reduction responsibilities in the post-Kyoto era. To face the challenges of low-carbon competition globally, as well as insufficient resource support and environmental carrying capacity domestically, China supports the development of a low-carbon economy and has committed to achieving carbon-neutrality by 2060 and reaching its CO2 emissions peak by 2030. In the 14th Five-Year Plan (2021–2025), the Chinese government has set more stringent targets for energy conservation and emissions reduction: that by 2030, CO2 emissions per unit of GDP will be 18% lower than in 2020, and that energy consumption per unit of GDP will be 13.5% lower than in 2015. Therefore, promoting energy conservation, achieving emissions reductions, and ensuring sustainable economic development are issues of great concern to the Chinese government. Carbon reduction is not only necessary to satisfy commitments to the international community, but fundamental to continued development: if CO2 emissions are not reduced, the environment will continue to deteriorate, which will have a negative impact on the sustainable development of enterprises and on consumer behavior (Awan andRaza, 2012; Abbas et al., 2019a). Therefore, governments, enterprises and scholars must promote economic development while improving the efficiency of carbon emissions in the energy sector and reducing the total amount of CO2 emissions.
China is a major carbon emitter and a rapidly developing country, and the industrial sector is the main source of growth in China’s real economy; the sector is also characterized by high energy consumption and high levels of pollution. Studies have found that the industrial sector consumes nearly 71% of the energy used in China (Wu et al., 2016) and produces 85.3% of the country’s greenhouse gas emissions (Zhu et al., 2021). Given the new energy and carbon emissions constraints, China’s industrial sector needs to transform from an extensive development model with high energy consumption, high emissions, and low efficiency to an efficient development model. Improvements in the carbon emissions efficiency of industrial energy (CEEIE) require structural adjustments and technological changes to achieve a balance between economic development and carbon emissions reductions, which are the key to low-carbon economic development and central to the commitment of the Chinese government (Teng et al., 2019; Zhang et al., 2020; Wang and Wei, 2014; Zhang et al., 2021). Implementing the same low carbon emission reduction policies in different regions may have a negative impact on economic development, resulting in inefficiency and inequality. Therefore, accurately calculating and analyzing the true level of China’s CEEIE in order to understand the differences in industrial development between different regions is crucial to improving CEEIE and implementing emission reduction policies that take account of local conditions (Wang et al., 2020).
Taking the data of 30 provinces in China as the sample, this study uses the three-stage super-efficiency slacks-based measure data envelopment analysis (SE-SBM-DEA) Malmquist–Luenberger model to measure DCEEIE in China from 2001 to 2019, and expands the perspective of research on the relationship between the different internal structures of DCEEIE by using the panel vector auto regression (PVAR) model to measure the interactions between efficiency changes and technical changes.
The marginal contributions of this article are as follows. First, through our use of the three-stage SE-SBM-DEA Malmquist–Luenberger model, we improve the accuracy with which China’s DCEEIE is measured. Second, we use Dagum’s Gini coefficient to examine the regional differentials of DCEEIE in China and to determine the causes of these differences. This method could overcome the limitations of the traditional Gini coefficient and the Theil index in terms of accuracy and flexibility. Finally, in contrast to previous studies on dynamic efficiency, our paper not only focuses on the regional differences and causes of DCEEIE but also extends the research perspective to the relationships between the internal structures of DCEEIE by using the PVAR model. This approach is conducive to understanding the mechanism by which regional differences in DCEEIE are formed. We believe that our analysis will identify and alleviate the problem of inter-regional DCEEIE imbalances, which is crucial to the economic development of relatively backward western regions. From a macroeconomic perspective, reducing the DCEEIE gap between the backward regions and other regions can improve the inter-regional collaborative emission reduction mechanism in China, break through the inter-provincial emission reduction barriers, and provide a reference for the relevant departments to use when planning and making decisions.
2 Review of the literature
2.1 The measurement of carbon emission effeciency
A large and growing body of literature has investigated the concept (Teng et al., 2019; Zhang et al., 2020; Wang and Wei, 2014; Zhang et al., 2021), measurement (Yao et al., 2015; Liu et al., 2016a; Wang et al., 2017; Cai et al., 2019), impact factors (Zhou et al., 2016; Zhang et al., 2017; Yu and Zhang, 2021; Zhang et al., 2018; Li et al., 2021), and effects (Zhang and Cheng, 2009; Zhang, 2011; Long et al., 2015; Lu et al., 2018; Zhu et al., 2019; Gao et al., 2020; Wu and Gu, 2021) of carbon emission efficiency (CEE). The indicators for measuring CEE have shifted from a single factor measurement method (Ang, 1999; Mielnik and Goldemberg, 1999; Pretis and Roser, 2017; Ferreira et al., 2018) to a total factor measurement method (Kortelainen, 2008; Marklund and Samakovlis, 2007). The present study draws on the framework of total factor production to measure CEE. We believe that understanding CEE as an input–output relationship can better interpret the goal of lower carbon dioxide emissions to achieve higher economic growth. In the literature, although both parametric (Färe et al., 2005; Marklund and Samakovlis, 2007) and nonparametric (Wu et al., 2012) methods have been used to measure total factor CEE, nonparametric models are preferred because they avoid the subjectivity of parameter weighting and do not require functional forms or prior conditions to be established in advance (Song et al., 2012; Molinos-Senante et al., 2016; Zhou et al., 2010; Dong et al., 2017). The traditional DEA model, one of nonparametric models, focuses on the correspondence between input and output variables, but ignores the choice of radial and angle (Song et al., 2012). Subsequent research has addressed this shortcoming by proposing the SBM-DEA model (Tone, 2001; Choi et al., 2012; Gómez-Calvet et al., 2014; Iftikhar et al., 2016). For example, Zhou et al. (2019) used the super-efficiency SBM-DEA model proposed by Tone (2002) to measure CEEIE, thus avoiding the problem of not being able to carry out further evaluation of efficient DMU at the same time. Likewise, by combining the super-efficiency SBM model with the three-stage DEA model, Ming et al. (2020) avoided problems caused by environmental factors and random error. Our paper combines the three-stage SE-SBM-DEA model with the Malmquist–Luenberger model to measure the DCEEIE in China. The improvement of the new method is its focus on the dynamic efficiency change compared with previous studies.
2.2 The relationship between efficiency change and technological change
Efficiency change (EC) and technological change (TC) can be decomposed from the Malmquist-Luenberger (ML) index, which can precisely measure dynamic efficiency. EC and TC are important components of the internal structure of dynamic efficiency. Initially, Färe et al. (1992) proposed that the Malmquist index could be used to analyze dynamic efficiency. Based on Färe et al. (1992), Chung and Fare, 1997 introduced a directional distance function into the Malmquist index to deal with the undesired output problem and called the resulting index the Malmquist-Luenberger (ML) index. The ML index not only has all the advantages of the Malmquist index, but also takes the undesired output into account and considers both the decrease in undesired output and the increase in desired output. This paper therefore uses the ML index to measure the DCEEIE of 30 provincial regions in China from 2001 to 2019.
Dynamic efficiency (measured by the ML index) can be further decomposed into EC and TC. EC measures the change in efficiency of the decision unit over two different periods and measures the catch-up effect in economies. Scholars have found that economic cycle fluctuations and macroeconomic policies may affect efficiency changes.
TC incorporates the stock of technological knowledge into the analysis and measures the change in the level of technology over two periods. When the value of TC is greater than 1, this indicates technological progress, or in other words technological change that results in the expansion of desired output and contraction of non-desired output. If TC is less than 1, this indicates a regression in the level of technology (Ding et al., 2019). Technological progress is the core force that drives economic growth and the transformation, upgrading, and optimization of industrial structure.
It has also been observed that there may be a relationship of mutual influence between TC and EC. Although the increase in production efficiency also benefits from the increase in scale efficiency, it originates to a greater extent from technological progress (Worthington, 2000; Giannakas et al., 2001). TC can reduce the consumption of carbon-based energy, reduce carbon emissions, and improve energy efficiency without affecting economic development (Zhu et al., 2018). The existing literature is limited in its analysis of the interaction between EC, TC, and ML, and this paper thus proposes that these interactions can be analyzed by combining Dagum’s Gini coefficient decomposition method and the PVAR model.
2.3 Regional differential of dynamic carbon emission efficiency in China
In-depth analysis of regional differences in carbon emission efficiency in China and the factors which influence it is of practical significance for determining local carbon quotas and formulating regional carbon emission reduction policies (Chen et al., 2014). The Intergovernmental Panel on Climate Change (IPCC) report on global climate change focuses on the differences in CO2 emissions among countries at different stages of development, which has aroused interest in the study of inter-regional carbon emission differences (Bruce et al., 1996), and scholars have since expanded their research on this issue.
At the national level, income disparity indicators have been used to measure and analyze regional differences in CO2 emissions (Heil and Wodon, 1997; Heil and Wodon, 2000; Gantore and Padilla, 2010). The literature has also focused on the Chinese regions by exploring the external influences on regional differences in dynamic carbon emission efficiency. The regional distribution of carbon emission intensity in China is characterized by significant non-equilibrium, and the differences in economic development, urbanization, population, industrial structure, energy consumption structure, energy use efficiency, and consumption patterns among regions have led to regional differences in carbon emission efficiency (Zhang et al., 2016; Zheng et al., 2020). In addition, the cooperation between different regions or provinces, resulting in spillover and spatial aggregation effects, has led to regional differences in carbon emission efficiency (Yan et al., 2017). Liu et al. (2021) suggest that some regions have become pilot regions for policy implementation, resulting in higher carbon emission efficiency in these regions compared to others.
In addition to external influences, the distribution characteristics and internal structure of carbon emission efficiency differences between regions have also been analyzed in the literature. Scholars have measured regional differences in CO2 emissions using concentration indices (e.g., the Gini coefficient) and have decomposed regional differences in CO2 emissions using entropy indices (e.g., the Thiel index), revealing the intra-group or inter-group differences of each region as internal factors which influence regional differences in carbon emission efficiency (Hedenus and Azar, 2005; Padilla and Serrano, 2006; Zhang et al., 2013). In order to observe the distribution characteristics of regional differences, some scholars have analyzed the various influencing factors and convergence of regional carbon emission differences by using econometric regression (Xu et al., 2016). Some scholars have also studied regional carbon emissions from a spatial econometric perspective and found that there are strong spatial correlations and different evolutionary trends of carbon emissions in different provinces of China (Liu et al., 2016b).
Taken together, scholars have performed a great deal of research on carbon emission efficiency, and these existing studies provide important insights into China’s CEEIE. However, a number of limitations remain. First, most previous studies have measured and analyzed CEEIE in the current period from a static perspective (Lin and Du, 2015; Liu et al., 2017), overlooking improvements in efficiency (that is, dynamic efficiency change). Second, most previous research has used the traditional data envelopment analysis (DEA) model or the SE-SBM model without considering the impact of environmental factors, and this approach has severely limited measurement accuracy. As Kumbhakar et al. (2014) have proposed, the accuracy of carbon emission efficiency estimation should be improved, and different methods should be used to interpret carbon emission efficiency so that a deeper and clearer understanding of the carbon emission efficiency of focal industries can be obtained. Finally, and most importantly, research on CEEIE has not fully discussed the relationships between different internal structures. Existing research has only focused on external influencing factors and the spatial convergence of CEEIE, and policy recommendations based on these findings are inadequate. Not enough attention has been paid to disparities in carbon emission efficiency between regions, and the reasons for these disparities are likely to be found in the internal mechanism of DCEEIE. This has led to a lack of the relevant analysis and evidence required to explain regional differences in DCEEIE. Existing studies lack an analyze of the internal structure of DCEEIE itself, in other words how the interaction of TC and EC triggers variation in DEEIE and specifically inter-regional variation in DEEIE. Complementary analyses could better portray the internal mechanisms underlying the formation of regional differences in DEEIE. Scholars have also called for future studies to fully consider the regional variability of carbon emission efficiency and the internal causes of these differences (Chen et al., 2020; Wen et al., 2020), so that the sources of differences in DCEEIE between regions which are lagging behind and other regions can be better analyzed (Wang et al., 2020).
To fill this gap, this paper uses the three-stage SE-SBM-DEA Malmquist–Luenberger model to measure DCEEIE in China. Dagum’s Gini coefficient decomposition method is then used to analysis the regional differentials of DCEEIE, TC and EC. Finally, the PVAR model is used to test the internal structure of DCEEIE, that is, the relationship between TC and EC, and this is used as direct evidence of the formation mechanism of regional differences in DCEEIE.
3 Methodology and data
3.1 The three-stage super-efficiency SBM-DEA-malmquist luenberger model
We use the super-efficiency SBM-DEA model with undesirable output to calculate the initial efficiency of each decision-making unit and the slack variables of input and output. The basic form of the SBM-DEA model is:
λ is the weight vector, x is the input variable, y is the output variable, which means that there are m inputs, S outputs (S1 desirable outputs, S2 undesirable outputs), n decision-making units; yg is the desirable outputs, yb is the undesirable outputs; S−, Sg, Sb are the slack variables of input variables, desirable outputs and undesirable outputs respectively. ρ is the objective function, that is, the carbon emission efficiency value, and 0≤ρ ≤ 1, when ρ = 1, S− = Sg=Sb = 0. At this time, it is completely efficient for this particular decision-making unit; when ρ < 1, it means that the decision-making unit is inefficient, and the input variables and output variables need to be improved to improve efficiency.
First, we use the stochastic Frontier analysis (SFA) model to take the input slack variables of the 31 provincial regions from 2000 to 2019 obtained in the first stage as the explained variables, take six environmental factors as explanatory variables for regression analysis. We adopt the method of year-by-year analysis and establishes 54 regression equations.
Next, we separate environmental factors, management inefficiency and random noise as follows:
Finally, we adjust the input and output variables by adjust decision-making units to a poor external environment, increase the input and output of the other decision-making units, the formula is:
The adjusted input variable removes the external environment and random interference factors, our paper adopts the super-efficiency SBM-Malmquist-Luenberger (ML) index to recalculate the total factor carbon emission dynamic efficiency of 30 provincial regions from 2000 to 2019 by using the adjusted input variables and the initial output variables, which can reflect the efficiency of each decision-making units more accurately (Färe et al., 1992; Chung and Fare, 1997). According to Chung and Fare, (1997), it is assumed that “bad” output is weakly disposed, and “good” output is freely disposed. gt= (yt, -bt) is the direction vector.
ML measures the change in productivity from period t to period t+1. The ML index can be further decomposed into two parts: one part measures efficiency change (EC) indicate how close each observation value is to its respective production Frontier, and the other part measures technological change (TC) indicate the change in the production possibility boundary from period t to period t+1.
Considering we divided the Chinese regions into three major economic regions, i.e., the East, the Central, and the West, Dagum’s Gini coefficient decomposition (Dagum, 1997) is conducted to investigate the regional differences based on the ML index. The formula of Dagum’s Gini coefficient decomposition is as follows:
G represents the overall Gini coefficient; K represents the three major economic regions: East, Central, and West, yih and yir represent the true level of industrial energy carbon emission efficiency of any province in i (j) region respectively, i = 1,2, … ,K; j = 1,2, … ,K. μ is the average value of the ML (EC or TC) of all provinces across the country, n is the number of all provinces, ni and nj are the number of provinces in the i (j) region.
Dagum (1997) divides Gini coefficient into three parts: the within-regional differences Gw, the inter-regional net differences Grb and the intensity of transvariation Gt, and their relationship is G = Gw + Grb + Gt. If Gt = 0, it means the cross-term representing the ML (EC or TC) between regions does not exist. The Dagum’s Gini Coefficient Decomposition is:
(Eq. 10) and (Eq. 11) represents the regional Gini coefficient Gii and the contribution rate of regional disparity Gw, (Eq. 12) and (Eq. 13) represents the inter-regional Gini coefficient Gij and the rate of contribution of inter-regional disparity Grb, λi = ni/n, si = λiμi/μ, i = 1,2, … ,K. Dij=(dij−pij)/(dij + pij) is the economic impact of region i and region j on each other; dij is the total impact between region i and region j, when μi>μj, dij is the weighted average of all industrial energy carbon emission efficiency gaps (yih−yir) under the condition of yih > yir, continuous distribution density function fi(y) and fj(y), dij is:
pij is when μi>μj, pij is the weighted average of all industrial energy carbon emission efficiency gaps (yih-yir) under the condition of yih > yir:
3.2 Data source
Samples from Tibet, Hong Kong, Taiwan and Macao, for which datasets were incomplete, were excluded from this study. Samples from the remaining 30 regions in China were used to conduct research on DCEEIE in China from 2000 to 2019. Missing data for these 30 regions was managed by using interpolation, exponential smoothing, and the mean method. This paper focuses on the dynamic carbon emission efficiency of the industrial sector, and data for the industrial sector taken from statistical yearbooks was thus filtered and used in the calculation of DCEEIE, with reference to the National Economic Classification of Industries (GB/T 4754-2011). To test the inter-regional disparity of the dynamic efficiency, considering the Chinese government still adopt the division standard of geographical regions in the Seventh Five-Year Plan of China2, we also divide China into three major economic regions: Eastern3, Central4, and Western5, and analysis samples from different regions (shown in Figure 1).
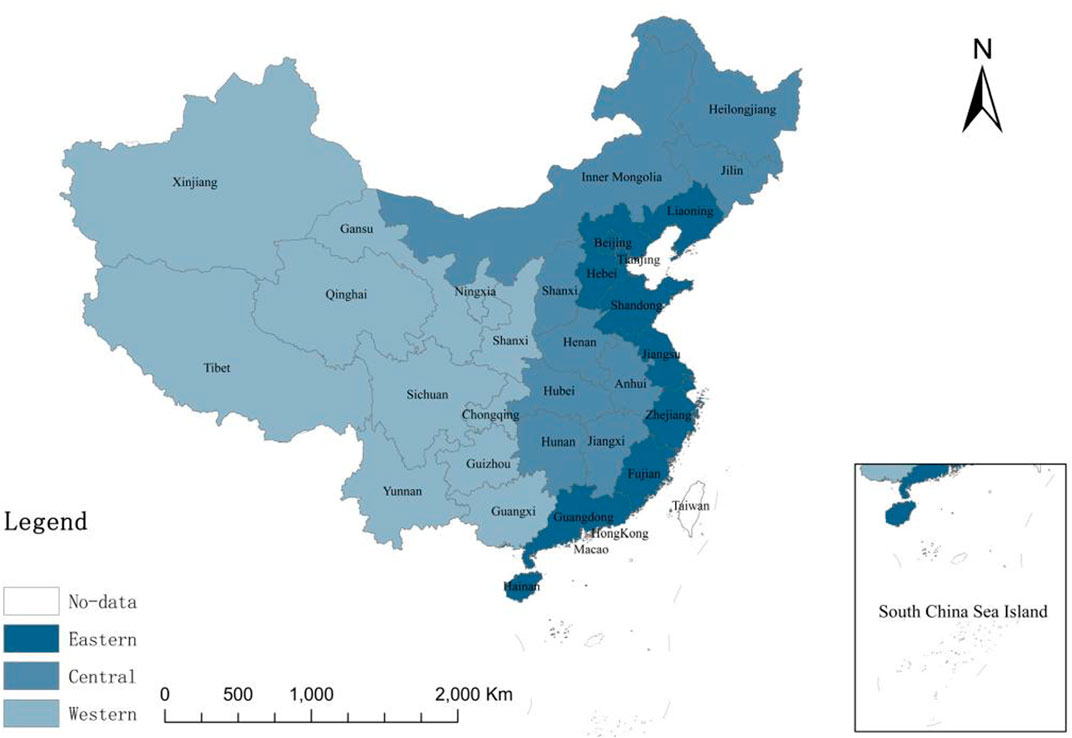
FIGURE 1. Distribution of eastern, central and western in China.
For the selection of input and output variables, our paper takes labor, capital stock and total energy consumption as input variables, take regional industrial production and carbon dioxide emissions as output variables.
For the selection of environmental variables in the three-stage DEA model, the main criterion is that the variable has a significant impact on the carbon emissions efficiency but cannot be controlled by the decision-making unit itself. Based on the availability of data, the representativeness of variable, and existing research, our paper selects six variables from the aspects of economic energy, institutional environment, etc. as the environmental variables. They are the level of economic development (Meng et al., 2011; Shafik and Bandyopadhyay, 1992; Grossman and Krueger, 1993), industrial structure (Ma and Stern, 2008; Yu et al., 2015), energy structure (Alves and Moutinho, 2013; Fredrik et al., 2013; Cao et al., 2014), government environmental regulation (Kneller and Manderson, 2012; Nesta et al., 2014; Feng D. et al., 2017), the level of technological innovation (Duro and Padilla, 2006; Duro et al., 2010; Sun, 1998), degree of opening to the outside world (Mutafoglu, 2012; Blanco et al., 2013). The measurement index system of industrial energy carbon emissions dynamic efficiency can be seen in Table 1.
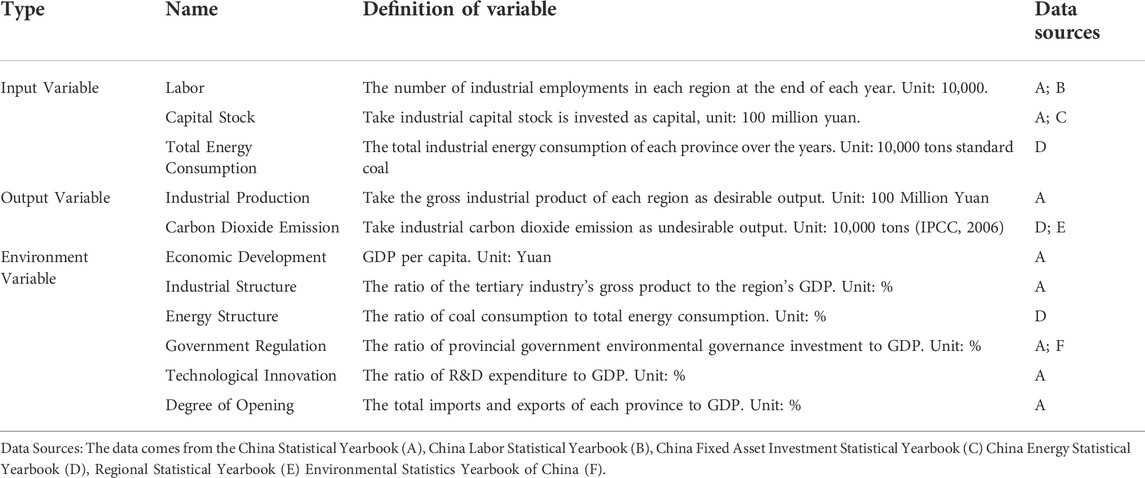
TABLE 1. The measurement index system of industrial energy carbon emissions dynamic efficiency.
4 Decomposition and evolution of regional differences in DCEEIE
4.1 General overview of DCEEIE in China
Table 2 reports the evolution of the mean value of ML at the national level and in the eastern, central, and western regions from 2001 to 2019. In order to accurately analyze DCEEIE in China, we also show the evolution of EC and TC. In general, DCEEIE in China increased significantly from 2001 to 2019. Specifically, at the national level, the average ML from 2001 to 2019 was 1.045, with an average annual growth rate of 0.87%, which means that DCEEIE can generally be classed as “efficient” during the survey period, and the efficiency value is gradually increasing. From the perspective of ML decomposition, the average EC from 2001 to 2019 was 1.022, with an average annual growth rate of -0.63%, indicating that although the level of technical efficiency can be classed as “effective,” there was a regression. The mean value of TC from 2001 to 2019 was 1.042, with an average annual growth rate of 1.45%, indicating that the technological change of DCEEIE is progressive and represents a trend of technological diffusion. This analysis indicates that the loss of efficiency caused by the regression in technical efficiency will be compensated by the spillover effect produced by technological change.
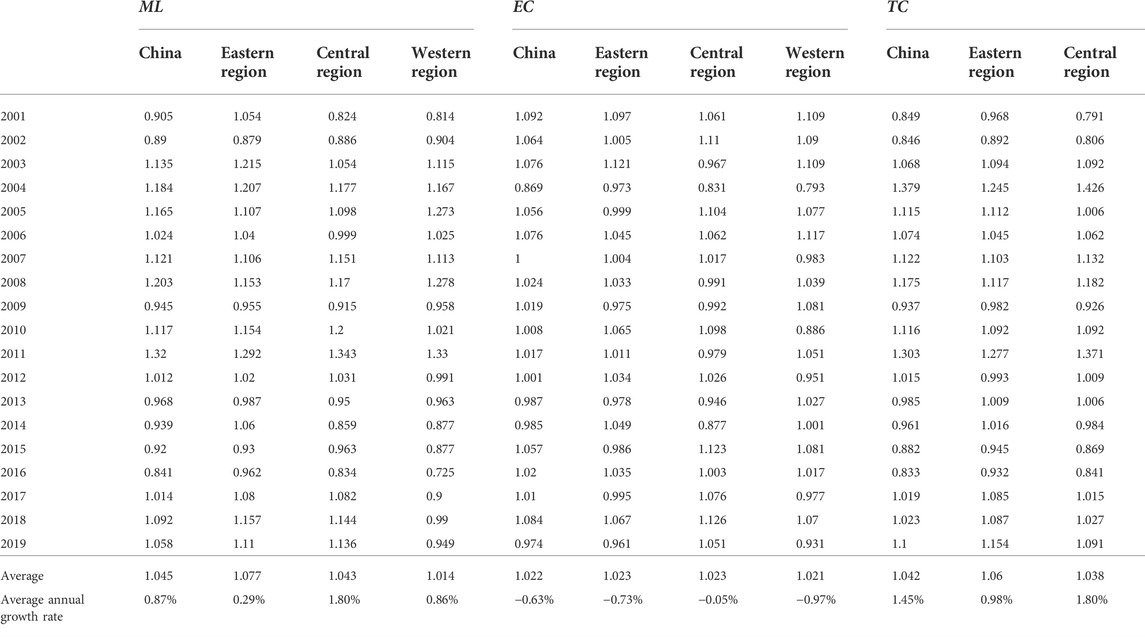
TABLE 2. Estimation results of the DCEEIE in China.
In terms of regional differences, the average values of ML in the eastern, central, and western regions were 1.077, 1.043, and 1.014, respectively, and the average annual growth rates were 0.29, 1.80, and 0.86%, respectively. These results indicate an overall growth in DCEEIE in China’s three regions, all of which were in an “efficient” state. In terms of spatial pattern, there is a gradual decrease from the east through the center to the west; the mean values of EC and TC in the three regions are all greater than 1, and both technical efficiency and technological change are at the Frontier of efficiency. However, because of differences in resource endowment and policy environment, the spatial characteristics are heterogeneous. From the perspective of the interannual variation trend of EC, all regions showed negative growth overall; the negative growth rates in the eastern (−0.73%) and western (−0.97%) regions were higher than the national average (−0.63%), while in the central region the rate of decline was lower, with an average annual growth rate of −0.05%. In terms of the interannual variation of TC, all regions showed growth overall. The annual growth rates of the central (1.80%) and the western (1.77%) regions were higher than the national average (1.45%), whereas the annual growth rate of the eastern region was lower (0.98%).
The reasons for these findings are as follows. The industrial structure of the eastern region is characterized by light industry, and the technological innovation frequency of the eastern region is better than that of the central and western regions. In contrast, the industrial structure of the central and western regions is dominated by heavy industry, with high energy consumption, and their carbon emissions intensity is higher than that of eastern China. In addition, compared with the western region, the central region has a high level of industrial development, with a great deal of light and mixed industry, which in terms of technological innovation will be subject to the economic radiation effect of the eastern region. The industrial structure of the western region is dominated by heavy industry, with low frequency of technological innovation and low energy utilization efficiency. These factors exacerbate the differences in carbon emissions among the eastern, central, and western regions.
4.2 Temporal evolution of the distribution of DCEEIE
In order to better understand the distribution evolution of ML, EC, and TC, we divided the observation period into three stages and selected the years 2001–2007, 2008–2013, and 2014–2019 for kernel density analysis (see Figures 2–4). Kernel density analysis reflects the convergence and polarization of data and other related information, and can, to a certain extent, provide empirical support for some of the above conclusions.
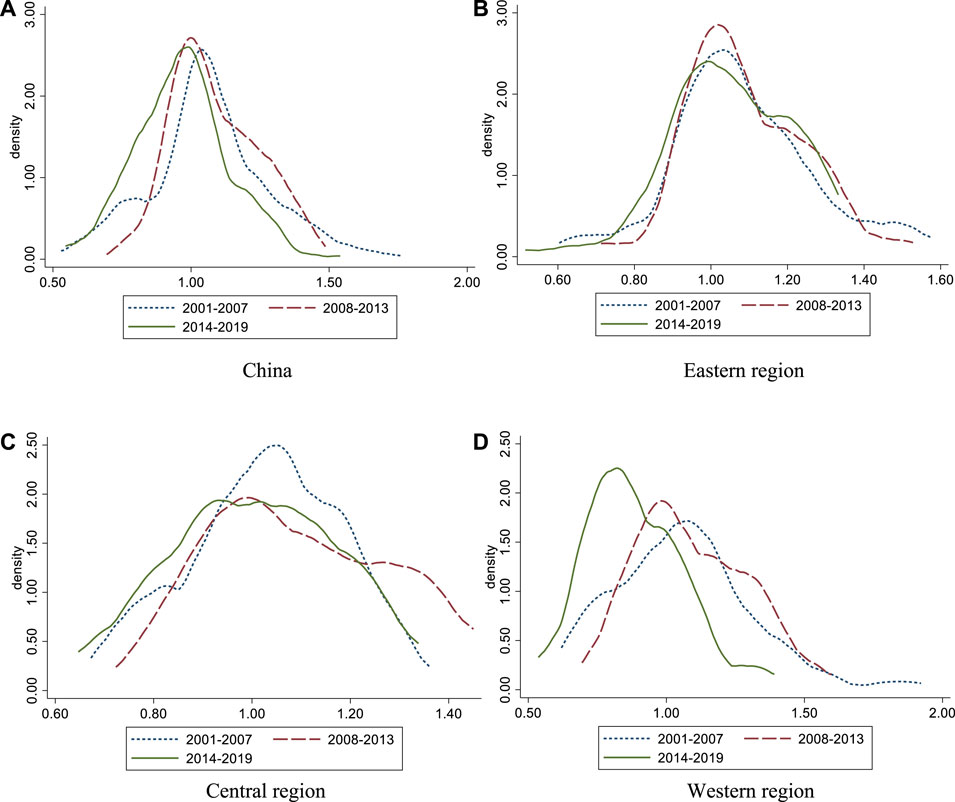
FIGURE 2. Dynamic evolution of ML. (A) China, (B) Eastern region, (C) Central region, (D) Western region.
Figure 2 depicts the dynamic evolution of ML from 2001 to 2019. At the national level (Figure 2A), the nuclear density function curve of ML from 2001 to 2007 consists of one main peak and one side peak, indicating a relatively clear polarization phenomenon within the region during that period. The curve in the figure gradually moves to the left and the width of the curve gradually narrows, indicating that the overall ML is gradually decreasing, and that the regional gap has narrowed. In the eastern region (Figure 2B), the polarization phenomenon within the region appeared in 2008–2013 and 2014–2019. The curve in the figure gradually shifts to the left and the width of the curve gradually expands, indicating that the overall ML is decreasing gradually and that the regional gap has widened. In the central region (Figure 2C), the polarization phenomenon within the region appeared in 2001–2007 and 2008–2013. The curve in the figure gradually shifts to the left and the width of the curve gradually becomes larger, indicating that the overall ML is decreasing and that the regional gap has expanded. In the western region (Figure 2D), the polarization phenomenon within the region appeared in 2008–2013 and 2014–2019. The curve in the figure accelerates to the left, but the width of the curve narrows gradually, indicating a rapid decline in ML and a narrowing of the regional gap.
Figure 3 depicts the dynamic evolution of EC from 2001 to 2019. At the national level (Figure 3A), the polarization phenomenon within the region appeared at each time stage, and the wave width increased to a certain extent, indicating that the regional gap of EC has widened. In the eastern region (Figure 3B), the polarization phenomenon within the region occurred in 2001–2007 and 2008–2013; however, it was more obvious in 2008–2013, and the width of the main peak increased, indicating a widening of the regional gap. In the central region (Figure 3C), the polarization phenomenon within the region appeared in 2001–2007 and the wave width increased rapidly, indicating an acceleration and widening of the regional gap. In the western region (Figure 3D), the polarization phenomenon occurred in 2001–2007 and 2014–2019. The curve in the figure shifts to the left and the wave gradually narrows, indicating a gradual narrowing of the regional gap and a decrease in the efficiency value.
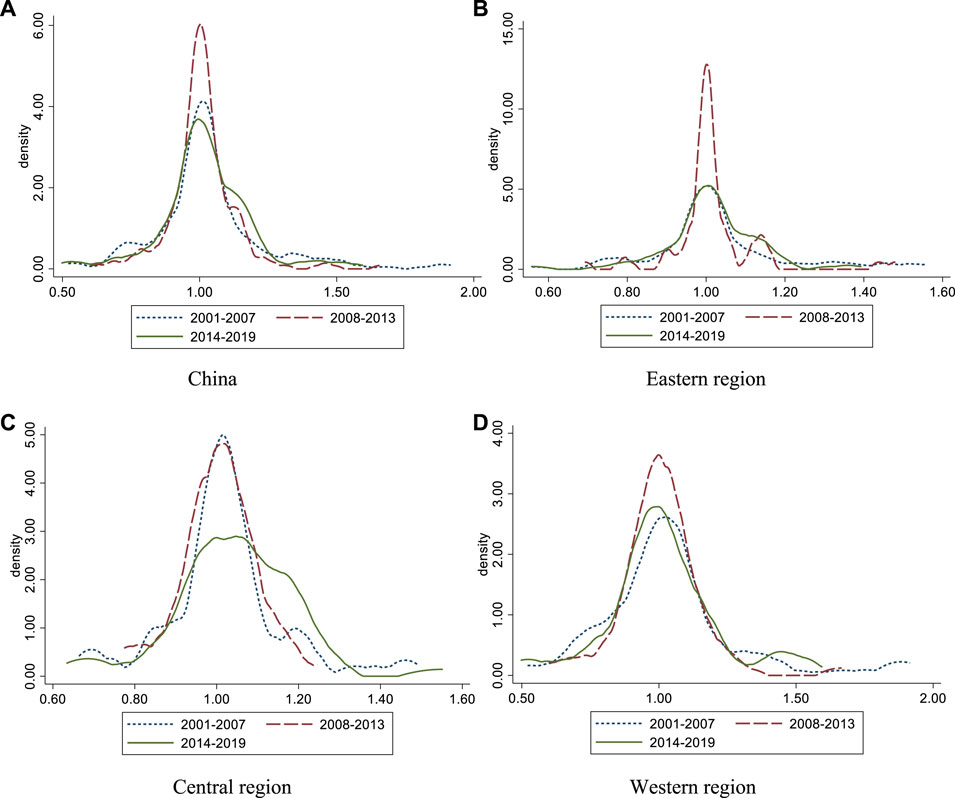
FIGURE 3. Dynamic evolution of EC. (A) China, (B) Eastern region, (C) Central region, (D) Western region.
Figure 4 depicts the dynamic evolution of TC from 2001 to 2019. At the national level (Figure 4A), the polarization phenomenon occurred in 2001–2007. The curve moves to the left, indicating that TC is gradually declining. In the eastern region (Figure 4B), the polarization phenomenon occurred in 2014–2019. The curve in the figure moves to the left and the wave gradually increases, indicating that the regional difference of TC has expanded and the efficiency value is decreasing. In the central region (Figure 4C), TC presents a single-peak distribution at each time stage. The curve shifts to the left, and the wave width increases gradually, indicating that TC is gradually decreasing and the regional gap is widening. In the western region (Figure 4D), the polarization phenomenon within the region appears in 2001–2007. The curve in the figure moves to the left and the wave gradually narrows, indicating that TC has gradually decreased and the regional gap is narrowing.
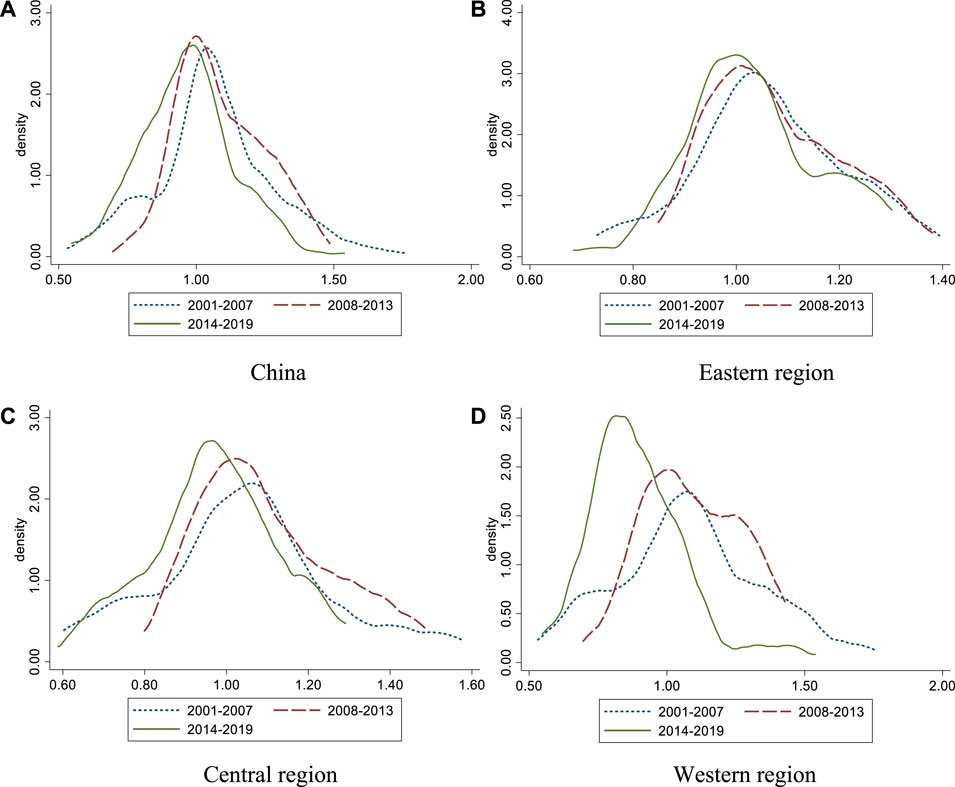
FIGURE 4. Dynamic evolution of TC. (A) China, (B) Eastern region, (C) Central region, (D) Western region.
4.3 Decomposition of regional differences in DCEEIE
The above analysis describes the temporal and spatial evolution of DCEEIE in different regions of China, but does not determine its regional differences and sources. Therefore, we further explore the regional differences in DCEEIE. Figure 5 shows the trends in the total Gini coefficients of ML, EC, and TC from 2001 to 2019. From the changes in the Gini coefficient for dynamic efficiency (GML), a trend of fluctuating decline can be seen from 2001 to 2019, with GML decreasing from 0.125 in 2001 to 0.092 in 2019, with an annual growth rate of -1.69%, indicating that the gap of ML values in different parts of China is gradually narrowing. From the perspective of interannual variation, the fluctuation of GML reached its lowest point (0.039) in 2007 and its highest point (0.128) in 2016. GML was at its most volatile from 2007 to 2016, with four alternating peaks and troughs in 8 years. From the changes in the Gini coefficients for technical efficiency (GEC) and technological change (GTC), similar fluctuations for GEC, GTC, and GML can be seen from 2001 to 2019. GEC dropped from 0.117 in 2001 to 0.082 in 2019, with an annual growth rate of −1.96%. GTC decreased from 0.119 in 2001 to 0.083 in 2019, with an annual growth rate of −1.98%. Both GEC and GTC reached their lowest points in the observation period in 2007 (GEC = 0.027, GTC = 0.037). GTC reached its peak (0.106) in 2016, when GEC was at the bottom of its downward trend (0.075).
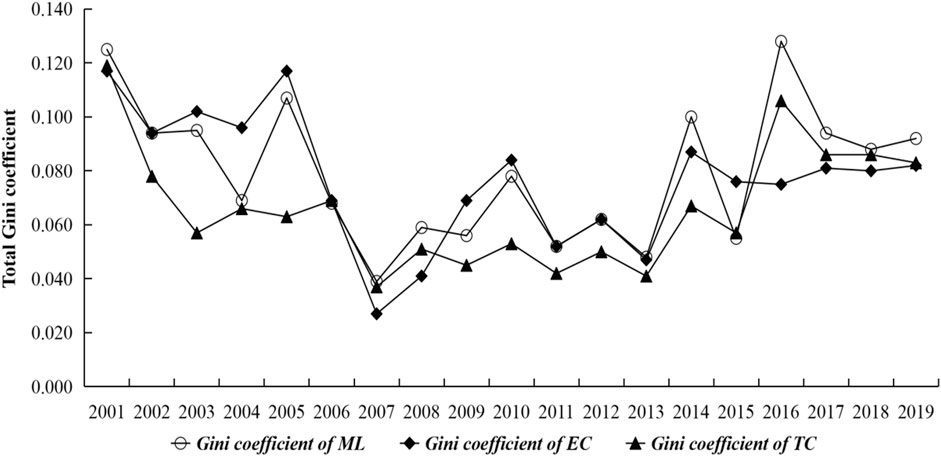
FIGURE 5. Total differences for ML, EC, and TC.
The phenomena described above can be analyzed as follows. The decrease of GEC is the main reason for the decline of GML, although the decrease of GTC also plays a positive role in the decline. However, the roles are different in different time periods. For example, in 2004, GEC and GTC both showed a reverse change, as the growth rate of GEC was −5.88%, and the growth rate of GTC was 15.79%. Their combined effect led to a negative growth rate of GML in 2004 (−27.37%), indicating that the influence of GEC on GML was greater than that of GTC. Before 2007, the effect of GEC on GML was greater than that of GTC, and after 2007, the effect of GTC on GML was greater than that of GEC. These results indicate that after 2007, the marginal utility brought by TC was far greater than that brought by EC.
Table 3 reports differences in ML, EC, and TC by region. GML, GEC, and GTC in the eastern, central, and western regions showed an overall downward trend from 2001 to 2019, indicating that the within-region differences of ML, EC, and TC were narrowing year by year. In terms of horizontal comparison, GML and GEC in the western region were higher than those in the other regions, with overall mean values of 0.085 and 0.09, respectively. The eastern region came next (GML = 0.065, GEC = 0.060), and the central region had the lowest values (GML = 0.055, GEC = 0.053). GTC was at its largest in the western region (0.070), followed by the central region (0.054) and then the eastern region (0.045). In terms of interannual variation, GML and GEC decreased most in the eastern region, with average annual growth rates of −1.95% and −3.83%, respectively, followed by the central region (−1.27%, −3.01%), and with the least growth in the western region (−0.88%, −1.21%). The largest drop in GTC was seen in the eastern region (−2.31%), followed by the western region (−1.64%) and then the central region (−0.20%).
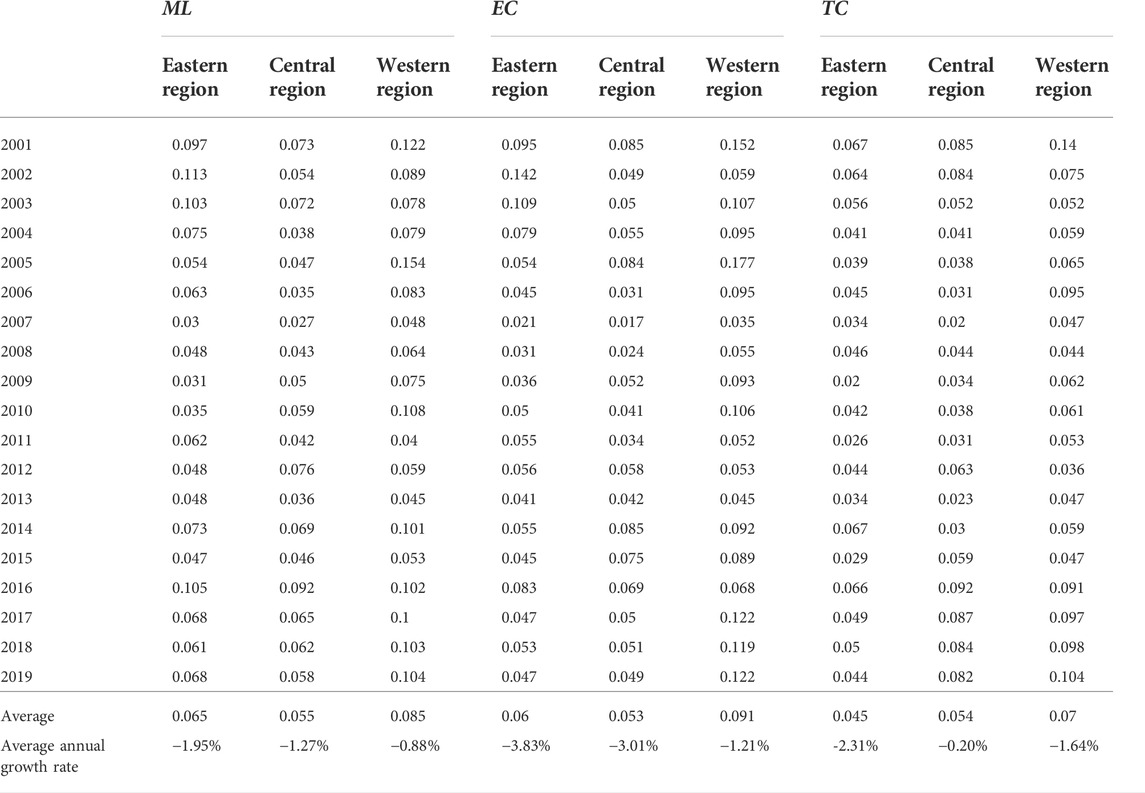
TABLE 3. DCEEIE’s difference within region of ML, EC, and TC.
Table 4 reports the differences between regions for ML, EC, and TC, all of which showed a downward trend from 2001 to 2019. The difference in ML and EC between the eastern and western regions was the largest, with averages of 0.084 and 0.081, respectively, followed by those between the eastern and western regions (0.079, 0.080) and those between the eastern and central regions (0.066, 0.062). The difference in TC was largest between the central and western regions (0.069), followed by the eastern and western regions (0.068), and the eastern and central regions (0.054). In terms of the range of variation, the Gini coefficient of the differences in ML and EC showed the largest decreasing range between the eastern and central regions, with annual growth rates of −2.88% and −2.90%, respectively, followed by the eastern and western regions (ML = −1.76%, EC = −2.03%), with the smallest range between the central and western regions (ML = −0.22%, EC = −1.41%). The results for TC show that the Gini coefficient decreased the most between the eastern and western regions (−2.30%), followed by the eastern and central regions (−2.16%) and the central and western regions (−1.17%). The ML gap between the eastern and central regions was much smaller because the gap in technical efficiency was much smaller. The eastern and central regions are adjacent, and the central region has a stronger economic and technological foundation than the western region. This enables the central region to absorb technologies from the eastern region to improve the technical efficiency of its DCEEIE. On the other hand, the diffusion effect of technological changes in the eastern region narrows the ML gap between the eastern and central regions.
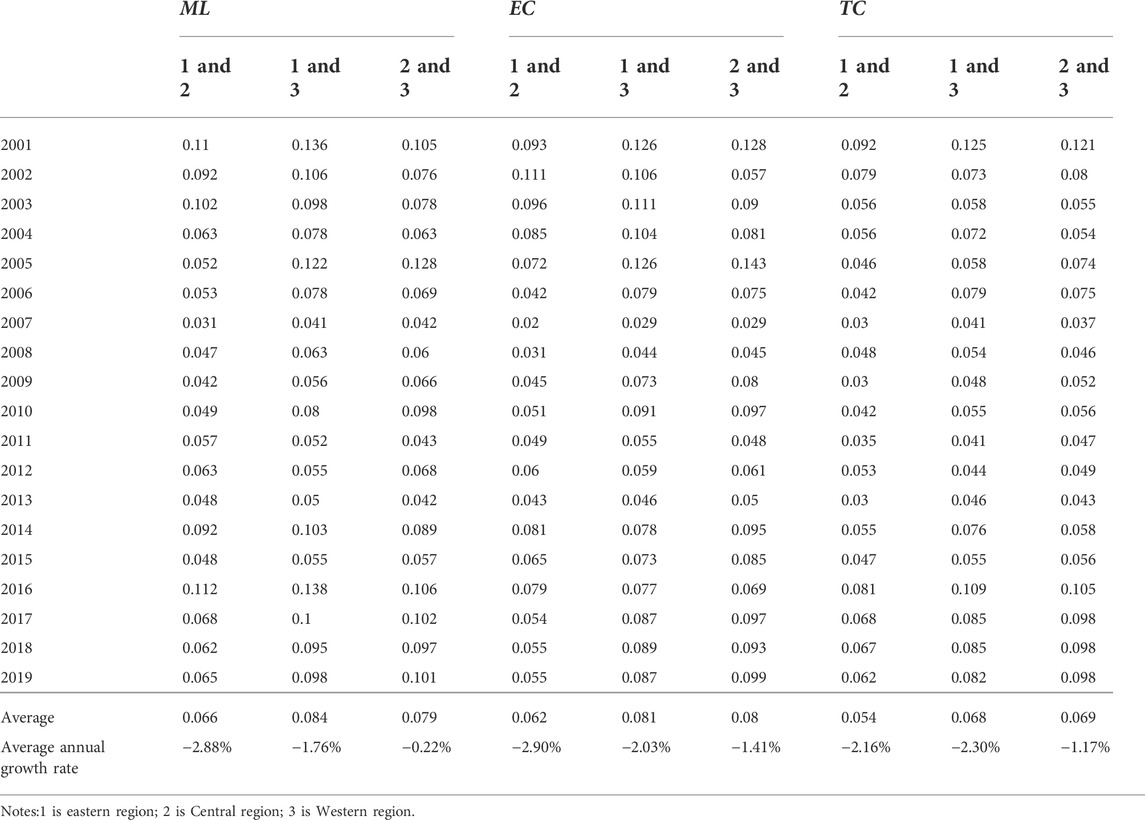
TABLE 4. DCEEIC’s difference between regions of ML, EC, and TC.
4.4 Source decomposition and contribution of regional differences to China’s DCEEIE
Table 5 reports the sources of decomposition and the contribution of regional differences in ML, EC, and TC. Figures 6A–C report the evolution of contribution rates from different sources. Table 5 and Figure 6A show that Grb and Gt were the two main factors leading to the ML gap between different regions from 2001 to 2019, and they showed reverse changes. In 2002–2007, 2009, and 2011–2013, Gt made the largest contribution and became the main cause of the ML gap between different regions (contribution rate ranging from 36.13% to 60.14%). Gt can be used to identify overlapping phenomena between regions. For example, the ML level in the eastern region is significantly higher than that in the western region, but the efficiency value of some provinces with lower ML levels in the eastern region are lower than those of provinces with higher ML levels in the western region. This means that, in the observation period, a small number of regions with higher ML development appeared in the eastern, central, and western regions, and that ML presented a discrete spatial distribution without agglomeration. In 2001, 2008, 2010, and 2014–2019, the contribution of Grb was the highest, making it the main cause of the ML gap across China (contribution rate ranging from 36.92% to 51.29%). The overall contribution rate of Gw remained relatively stable (between 27% and 32.98%).
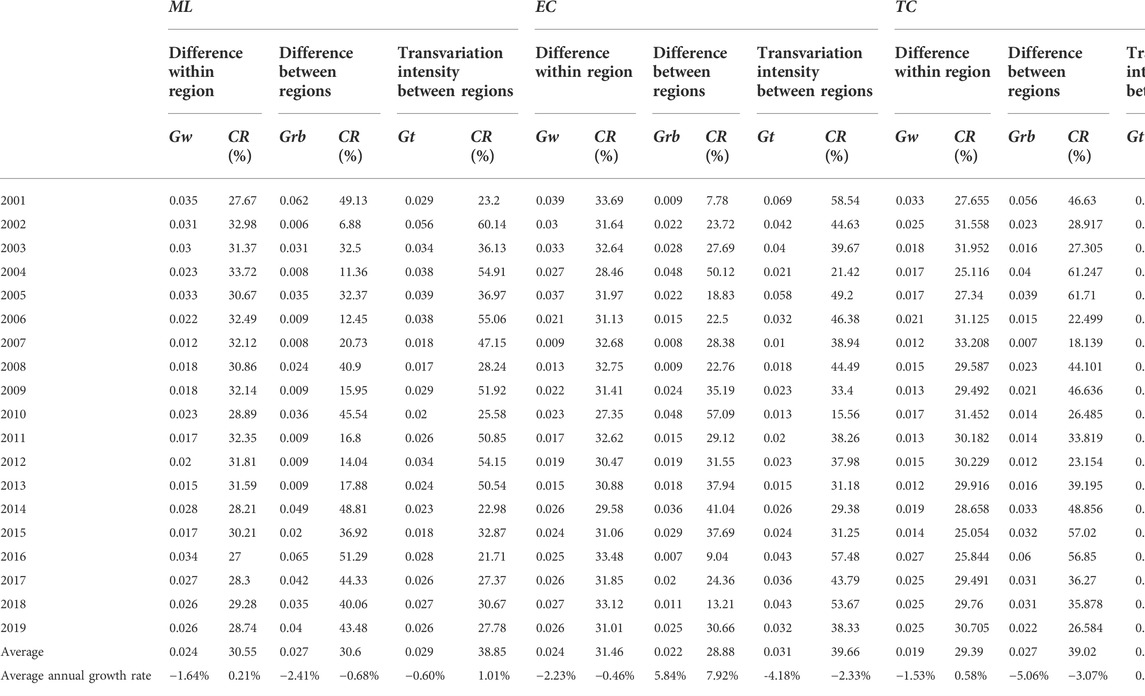
TABLE 5. The contributions to the total difference of DCEEIE.
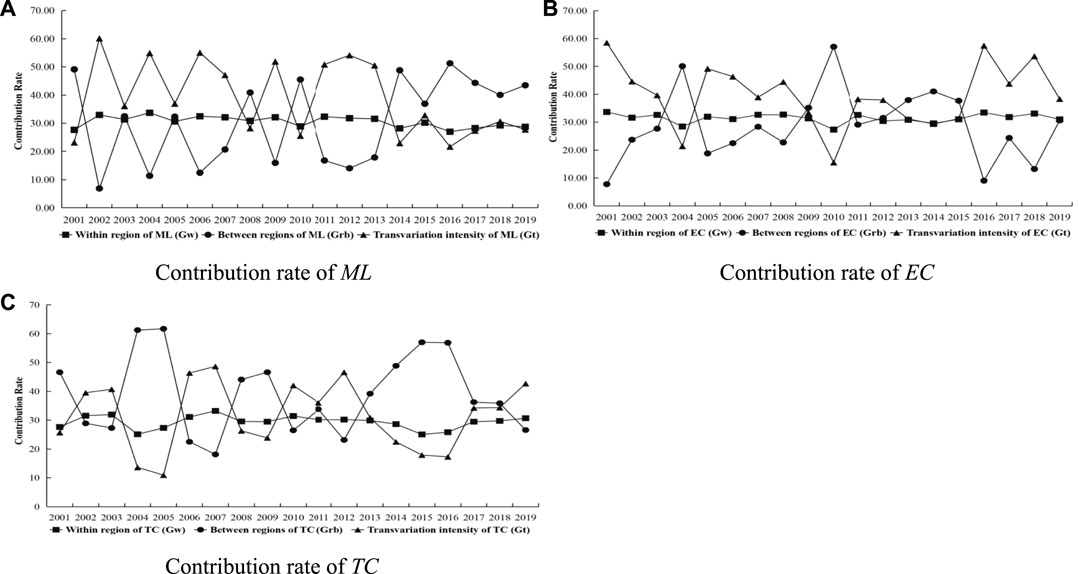
FIGURE 6. Evolution of regional differences in contribution rates of ML, EC, and TC. (A) Contribution rate of ML, (B) Contribution rate of EC, (C) Contribution rate of TC.
From Table 5 and Figure 6B, we see that in 2004, 2009–2010, and 2013–2015, Grb’s contribution was the largest (contribution rate ranging from 35.19% to 57.09%). In 2001–2003, 2005–2008, 2011–2012, and 2016–2019, Gt’s contribution was the largest (contribution rate ranging from 37.98% to 58.54%). The overall contribution rate of Gw remained relatively stable (between 27.35% and 33.69%). This means that Gt became the main cause of the EC gap in 2019, with regions with higher EC levels showing a discrete spatial distribution. From Table 5 and Figure 6C, it can be seen that Grb made the largest contribution in 2001, 2004–2005, 2008–2009, and 2013–2018 (contribution rate ranging from 39.2% to 61.71%), making it the main cause of the TC gap. Gt was the main cause of the TC gap in 2002–2003, 2006–2007, 2009–2012, and 2019 (contribution rate ranging from 36% to 48.65%). The overall contribution rate of Gw remained relatively stable (between 25.05% and 33.21%).
5 Expansion analysis of the sources and formation mechanism of regional differences in DCEEIE
5.1 Stationarity test
The above analysis partially explains the static relationships among ML, EC, and TC, but does not explain the dynamic relationships among the three or the relationship between EC and TC. When empirically testing the mechanism of action, it is critically important to select an appropriate model; EC and TC are generated by ML index decomposition, and there are internal connections among the three. The VAR model has the advantage of allowing each component to be an endogenous variable. The cross-period length of our data is 17 years, which also meets the requirements of time series samples, and we therefore use the PVAR model to test the dynamic relationships. Before analysis of the PVAR model, the stationarity of each variable needs to be tested and the optimal lag order of the model determined.
Table 6 shows the test results. LLC, IPS, ADF, PP, and other test statistics are used in this study to judge whether each variable belongs to a stationary series. We find that the variables of each regional sample are stationary series, which means that the original data can be modeled directly.
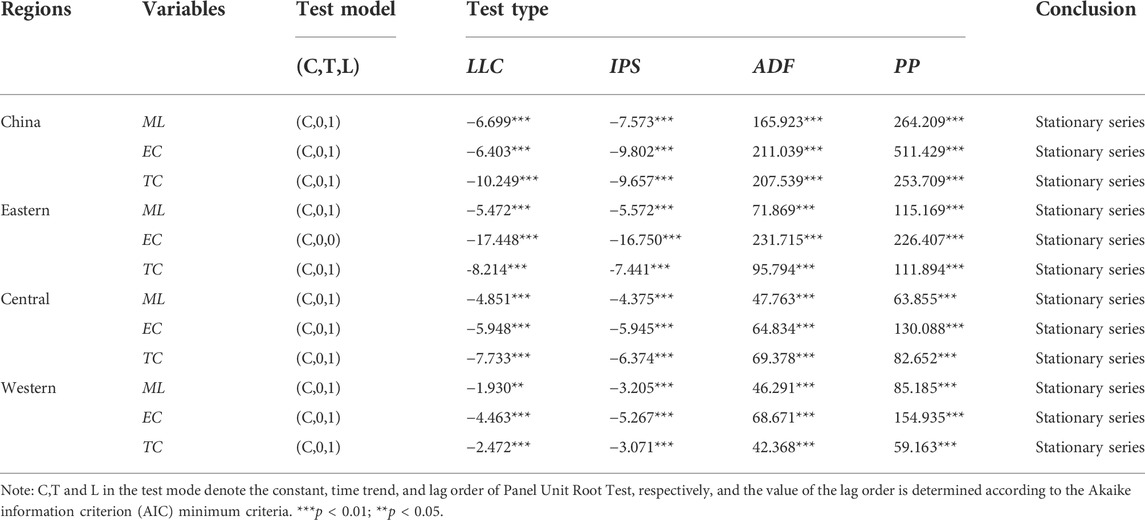
TABLE 6. Panel Unit root test.
5.2 Granger causality test
The Granger causality test accurately measures the correlations between variables. However, the optimal lag order of the model must be determined before the test is applied. According to previous studies (Granger, 1969, 1980; Hong, 2001), the order with the largest number of test values is adopted as the final optimal lag order of the model. Table 7 shows that the optimal lag order for the samples at the national level and in the eastern and central regions is 3, and the optimal lag order for the sample in the western region is 1. The results at the national level show that EC has a one-way Granger causality relationship with ML or TC, which is reflected only in the influence of EC on ML or TC. There is a two-way Granger causality between TC and ML, each of which can affect the other. In addition, ML is affected by the combined action of EC and TC, and TC is affected by the combination of ML and EC. The results in the eastern region show that ML is only affected by the joint action of EC and TC, whereas EC is affected by ML and also by TC. However, the joint action of ML and TC has no significant effect on EC, and TC is only affected by the joint action of EC and ML. The reason for these phenomena is that the technological efficiency and technological changes in the eastern region are saturated and following the same trend; the influence of each on dynamic efficiency is therefore affected by the other. The results in the central region show that TC is affected by ML, as well as by the combined effect of ML and EC, indicating that the dynamic efficiency in the central region has a direct impact on the efficiency of technological change and is also influenced by adjustments in technological efficiency. The results in the western region show that TC directly affects ML or co-affects ML with EC.
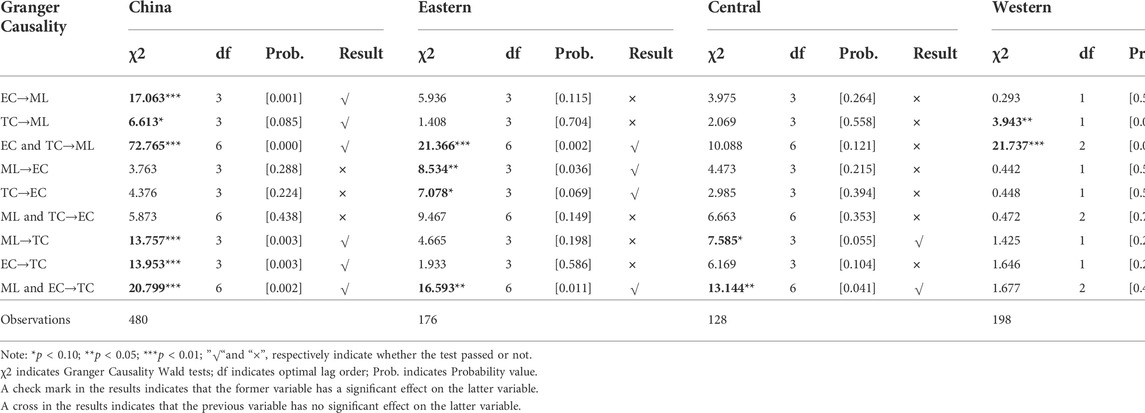
TABLE 7. Results for Granger causality tests.
5.3 PVAR model analysis
On the basis of the above findings, a PVAR model test was carried out on ML, EC, and TC using samples. The results are shown in Table 8. At the national level, when ML is used as the explained variable, the ML coefficient for lag period 1 is significantly positive, the ML coefficient for lag stage 3 is significantly positive, the EC coefficient for lag phase 2 is significantly positive, the EC coefficient for lag period 3 is significantly negative, and the TC coefficient for lag period 1 is significantly positive. When EC is used as the explained variable, the EC coefficient for lag stage 3 is significantly negative. When TC is used as the explained variable, the ML coefficient for lag period 1 is significantly positive, the ML coefficient for lag period 2 is significantly negative, the EC coefficient for lag period 2 is significantly positive, and the TC coefficient for lag period 2 is significantly positive. This indicates that TC has a positive and significant impact on ML in the early stage of ML development, and that the improvement of TC significantly promotes the improvement of EC. With the gradual improvement of ML, problems of scale begin to appear, restraining the development of ML. However, the improvement of EC in the early stage produces a strong accumulation effect, making EC a main factor in the mid-term development of ML. Over time, EC inhibits the development of ML.
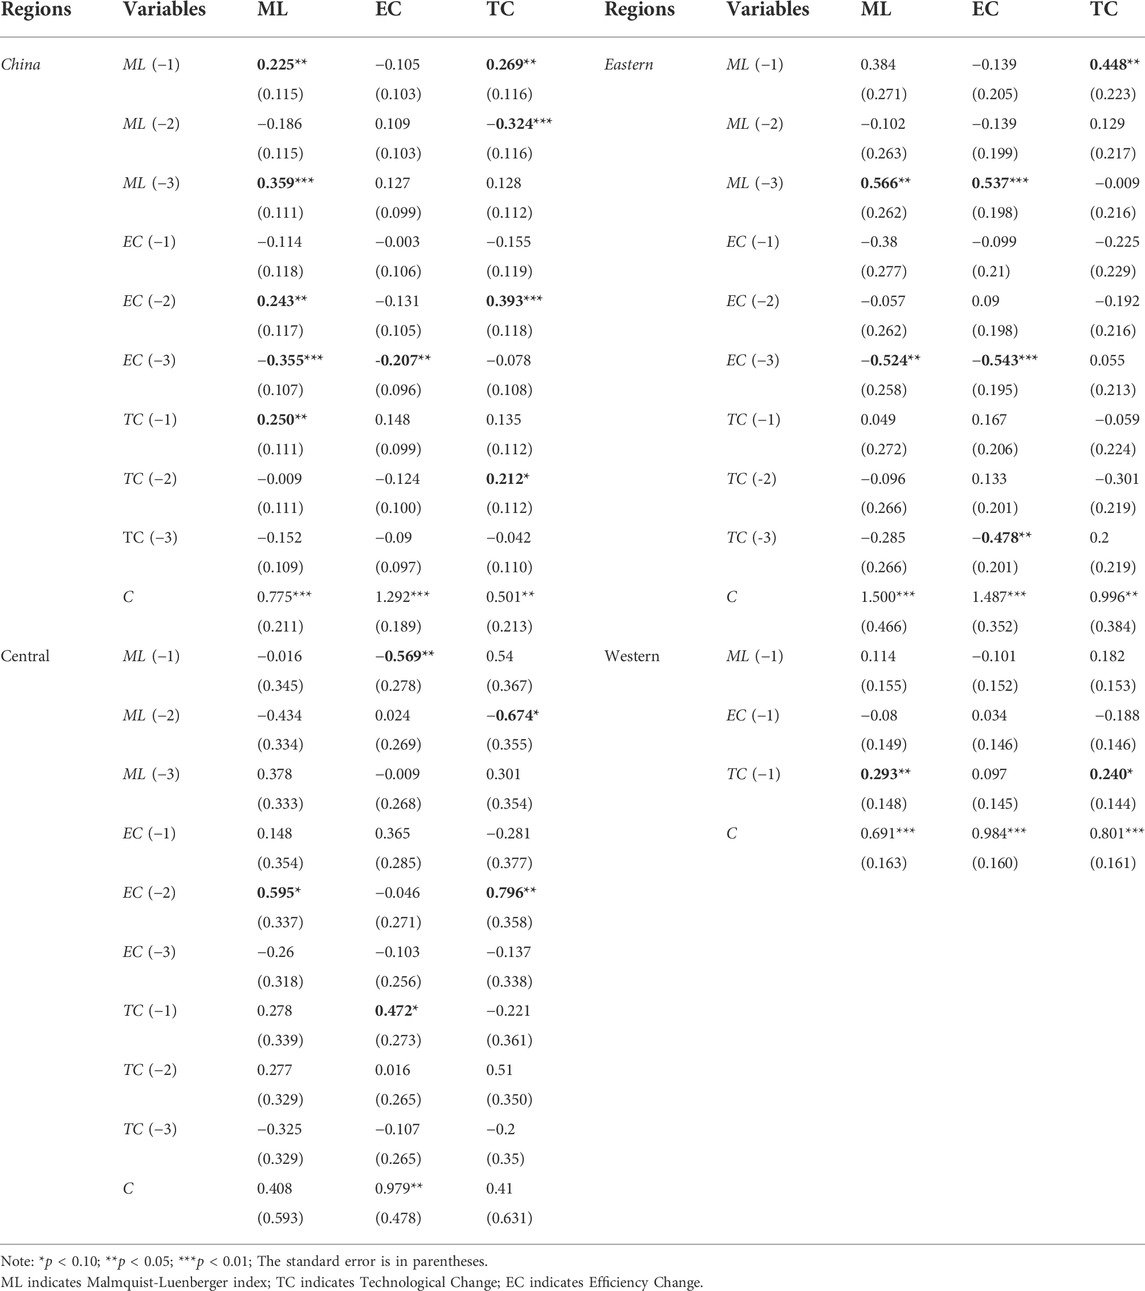
TABLE 8. Regression results of PVAR model.
The results in the eastern region show that when ML is used as the explained variable, the ML coefficient for lag period 3 is significantly positive and the EC coefficient is significantly negative. When EC is used as the explained variable, the ML coefficient for lag period 3 is significantly positive, while both the EC and the TC coefficients are significantly negative. When TC is used as the explained variable, the ML coefficient for lag period 1 is significantly positive. These results indicate that in the eastern region ML has a strong hysteretic self-enhancement mechanism, and EC has a significant inhibitory effect on ML in the later stage of ML development. The promotion effect of TC on EC is not significant, because the technological efficiency and technological change in the eastern region are both saturated. The development of ML promotes the development of TC and improves the level of EC, but there is no obvious promotion effect of TC and EC on ML.
The results for the central region show that when ML is used as the explained variable, the EC coefficient for lag period 2 is significantly positive. When EC is used as the explained variable, the ML coefficient for lag period 1 is significantly negative and the TC coefficient is significantly positive. When TC is used as the explained variable, the ML coefficient for lag period 2 is significantly negative and the EC coefficient is significantly positive. These results indicate that ML has an inhibitory effect on the growth of EC and TC, but there is a significant difference at the time of action. The growth of EC has a promoting effect on ML, but the incentive effect shows hysteresis.
The results in the western region show that when ML is used as the explained variable, the TC coefficient for lag period 1 is significantly positive. When EC is used as the explained variable, the coefficients of ML, EC, and TC are not significant for any lag period. When TC is used as the explained variable, the TC coefficient for lag period 1 is significantly positive. These results indicate that the growth of ML comes mainly from the growth of TC in the early stages of ML development in the western region. TC also has a self-reinforcing mechanism.
5.4 Impulse analysis and variance decomposition
Figures 7–10 show the results for impulse response among the ML, EC, and TC of four different samples. The abscissa represents the number of response periods of impact action, which is set to 10. The ordinate is the impulse response function, and the curves on either side represent estimates for the 95% and 5% loci. Figure 7 depicts the dynamic relationships among ML, EC, and TC at the national level. In general, ML has a significant role in promoting the growth of TC and EC in the early stage of ML development, but there are also large differences. In terms of intensity and duration of action, ML has a better effect on TC than on EC. In addition, the influence of EC and TC on ML is significantly different, which shows that TC is the driving force of ML growth in the early stage, while EC plays a promoting role in the medium term. Meanwhile, TC is the driving force of EC growth, and EC has a greater inhibitory effect on TC in the initial stage.
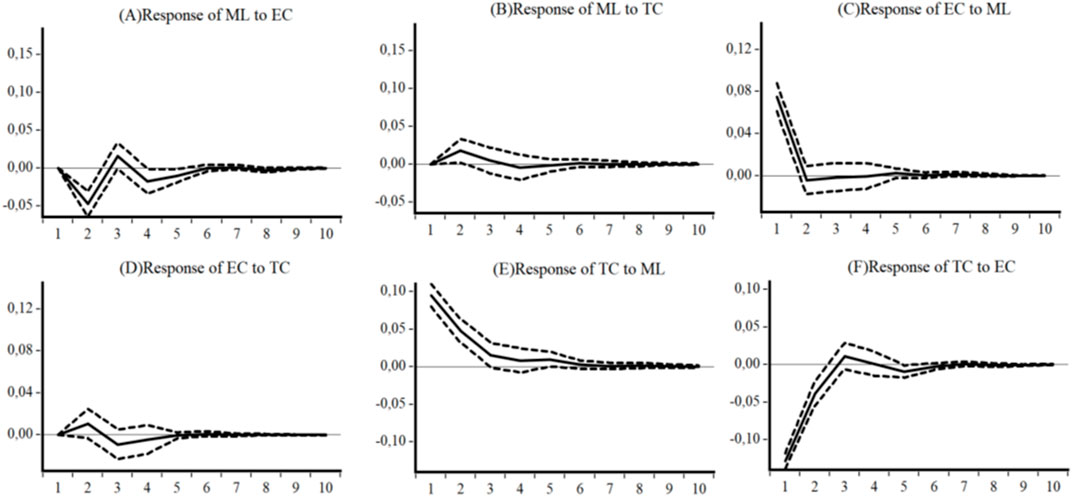
FIGURE 7. Impulse responses of ML, EC, and TC, China. (A) Response of ML to EC, (B) Response of ML to TC, (C) Response of EC to ML, (D) Response of EC to TC, (E) Response of TC to ML, (F) Response of TC to EC.
Figure 8 reports the dynamic relationships among ML, EC, and TC in the eastern region. The influence of ML on EC and TC is in line with that of the national sample. The influence of EC and TC on ML has always been negative, which means that EC and TC have not promoted the development of ML in the eastern region. TC is the driving force for the growth of EC, and EC has a restraining effect on TC.
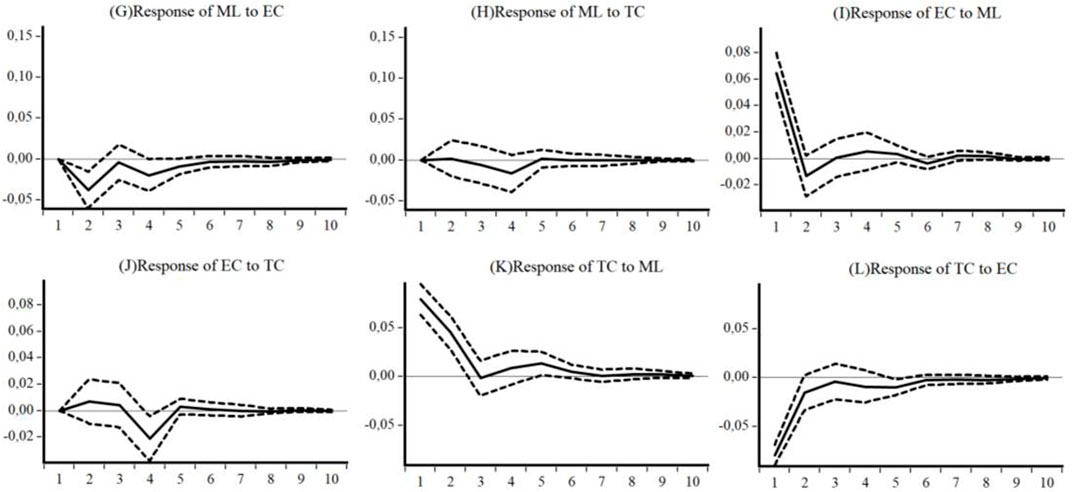
FIGURE 8. Impulse responses of ML, EC, and TC, eastern region. (G) Response of ML to EC, (H) Response of ML to TC, (I) Response of EC to ML, (J) Response of EC to TC, (K) Response of TC to ML, (L) Response of TC to EC.
Figure 9 depicts the dynamic relationships among ML, EC, and TC in the central region. The influence of ML on EC and TC is the same as at the national level and in the eastern region. The effect of EC and TC on ML is similar to that at the national level, but stronger and more obvious. TC is the driving force for the growth of EC. The effect of EC on TC is inhibition in the early stage, promotion in the medium term, and inhibition in the late stage.
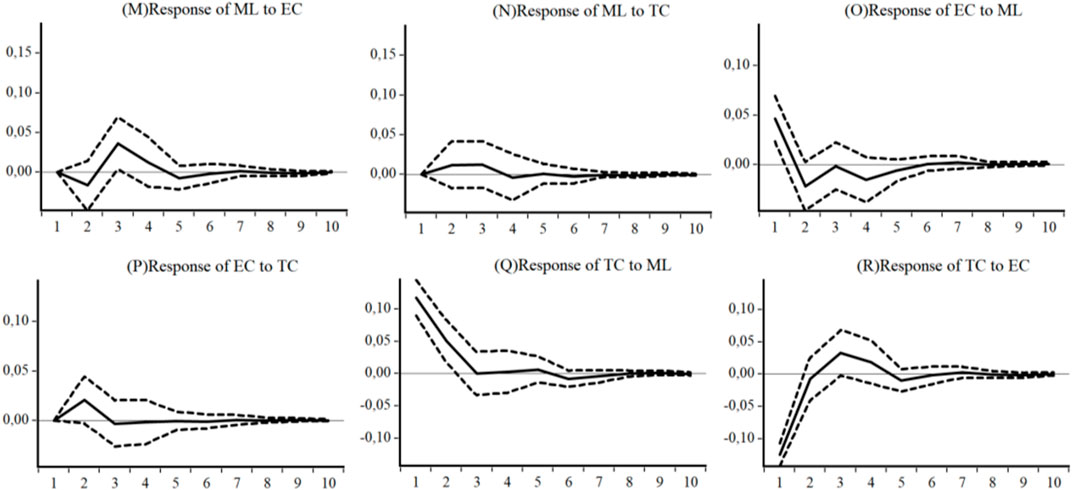
FIGURE 9. Impulse responses of ML, EC, and TC, central region. (M) Response of ML to EC, (N) Response of ML to TC, (O) Response of EC to ML, (P) Response of EC to TC, (Q) Response of TC to ML, (R) Response of TC to EC.
Figure 10 depicts the dynamic relationships among ML, EC, and TC in the western region. ML has a short-term continuously weakening promotion effect on EC but a long-term continuously weakening promotion effect on TC. The effect of EC on ML is sustained and weakening, while the influence of TC on ML is a promotion effect, first increasing and then decreasing, but relatively short in duration. The effect of TC on EC is positive and weakens in the short-term, while the effect of EC on TC is negative and weakens continuously.
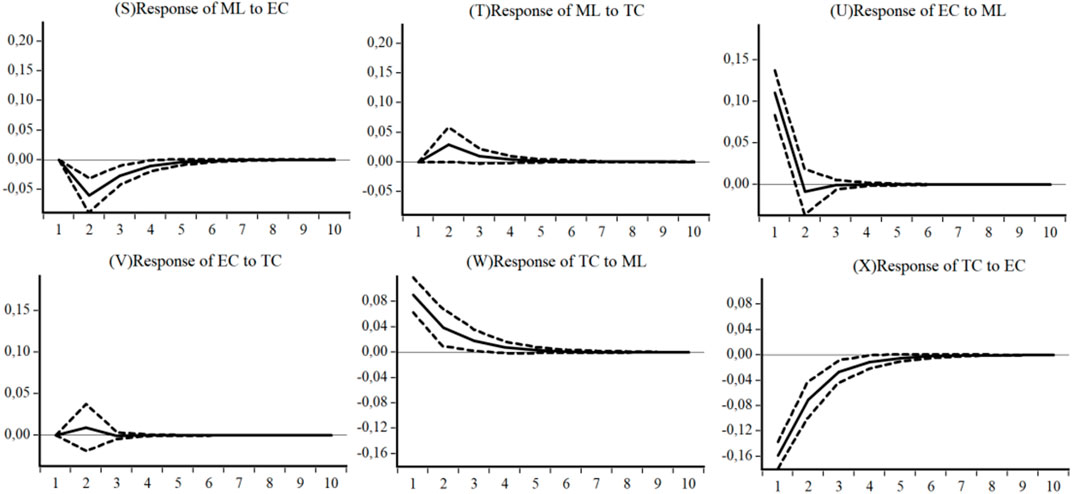
FIGURE 10. Impulse responses of ML, EC, and TC, western region. (S) Response of ML to EC, (T) Response of ML to TC, (U) Response of EC to ML, (V) Response of EC to TC, (W) Response of TC to ML, (X) Response of TC to EC.
Table 9 reports the variance decomposition results among ML, EC, and TC for four different samples. In the variance decomposition of ML, the first period is 100% affected by its own fluctuation shock, while the impact of EC and TC on ML begins to appear only in the second phase and the variance contribution of EC to ML is greater than that of TC to ML. In the variance decomposition of EC, ML’s impact on EC appears in the first phase, whereas TC’s impact on EC has a lag, with the impact beginning to appear only in the second phase. Of all the impacts, EC is the most affected by itself, followed by the impact of ML; the impact of TC on EC is the smallest. In the variance decomposition of TC, the impact of EC and ML on TC is timely, effective, and continuously enhanced, and the impact effect is relatively strong in the first phase. The impact of ML and EC on TC is greater than the impact of TC on itself, which means that the growth of TC is driven mainly by external factors. In addition, the impact of ML and EC on TC is significantly different across regions. In the samples from the eastern region, the impact of ML on TC is stronger than that of EC on TC. In the samples from the other regions, the impact of EC on TC is stronger than that of ML on TC.
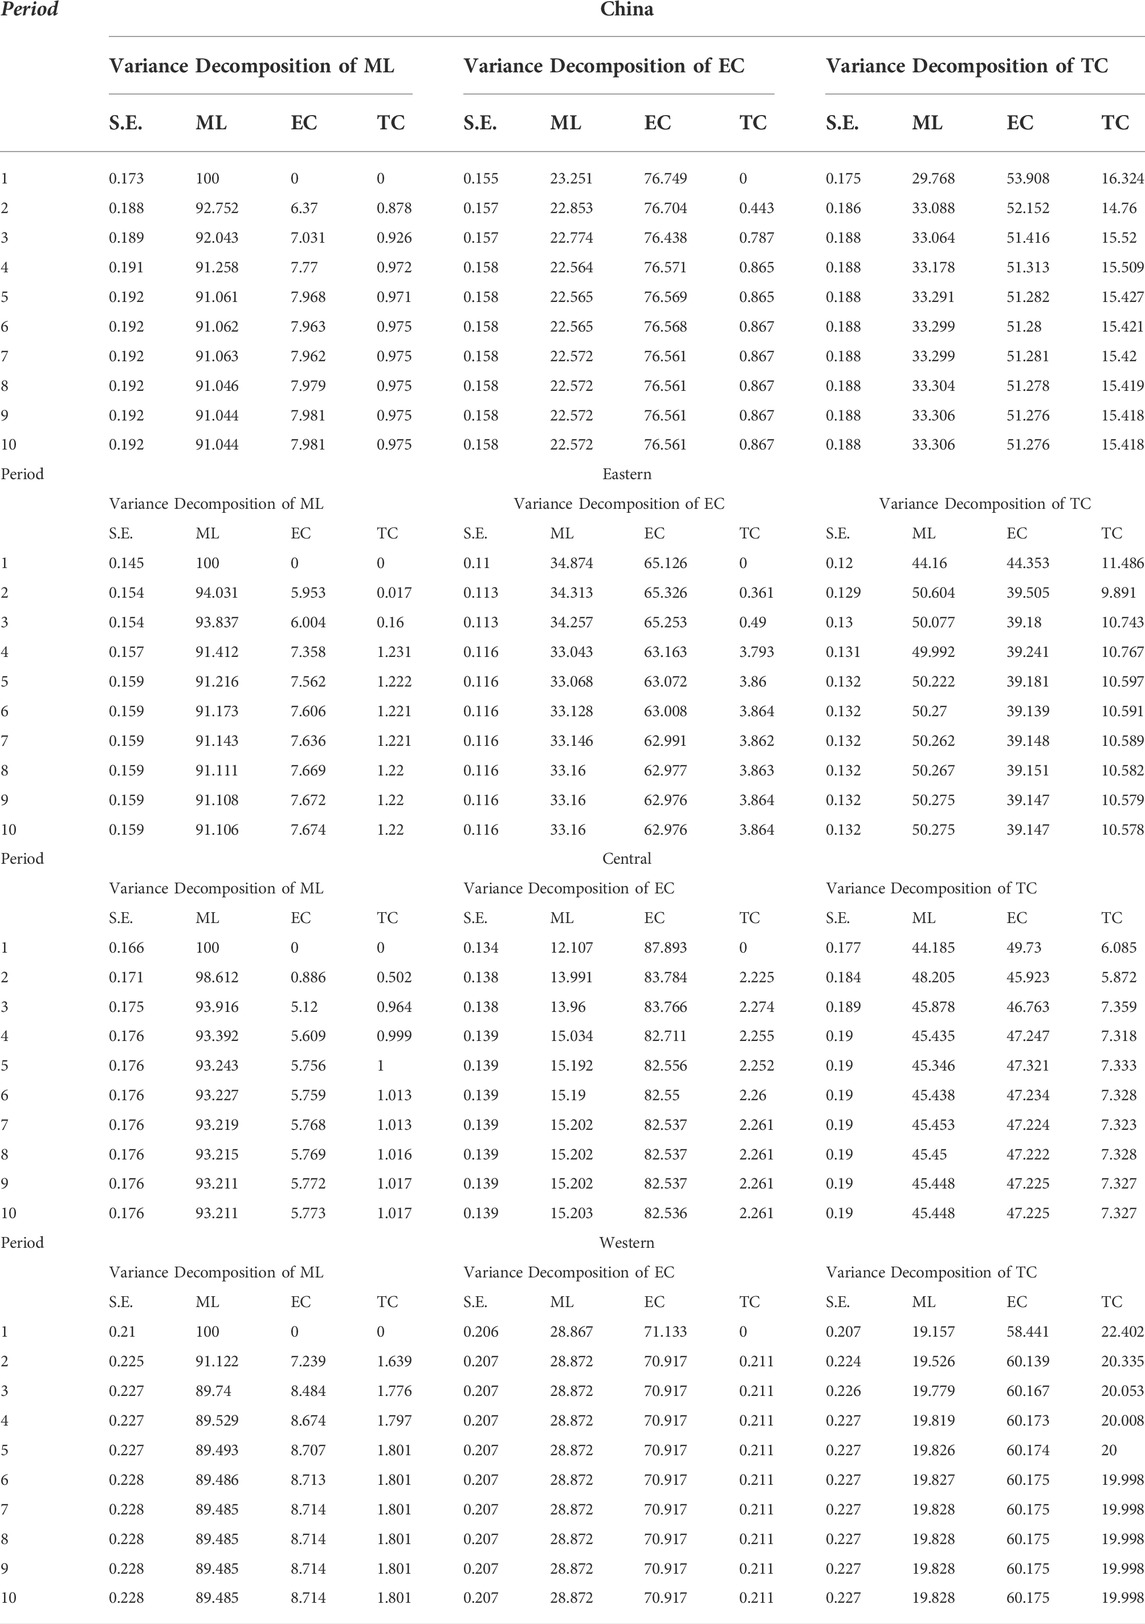
TABLE 9. Variance decomposition of ML, EC and TC of DEIECE in various regions.
5.5 Analysis of the formation mechanism of DCEEIE
From the above analysis, we can extract the theoretical mechanism of DCEEIE, as shown in Figure 11. However, it should be noted that in order to understand the formation mechanism of DCEEIE, we must first clarify the logical relationship between its dynamic efficiency and its total factor productivity. This is because improving the total factor productivity of carbon emissions is a matter of great importance for the government and business managers, and it is also the ultimate goal of carbon emissions management. We believe that DCEEIE can be used to compare and analyze the total factor productivity of carbon emissions longitudinally, revealing its dynamic characteristics. The economic meaning of the ML index reflects the carbon emissions from period t to period t+1. When ML > 1, the change in total factor productivity represents an improvement in efficiency (and the converse represents a decline in efficiency).
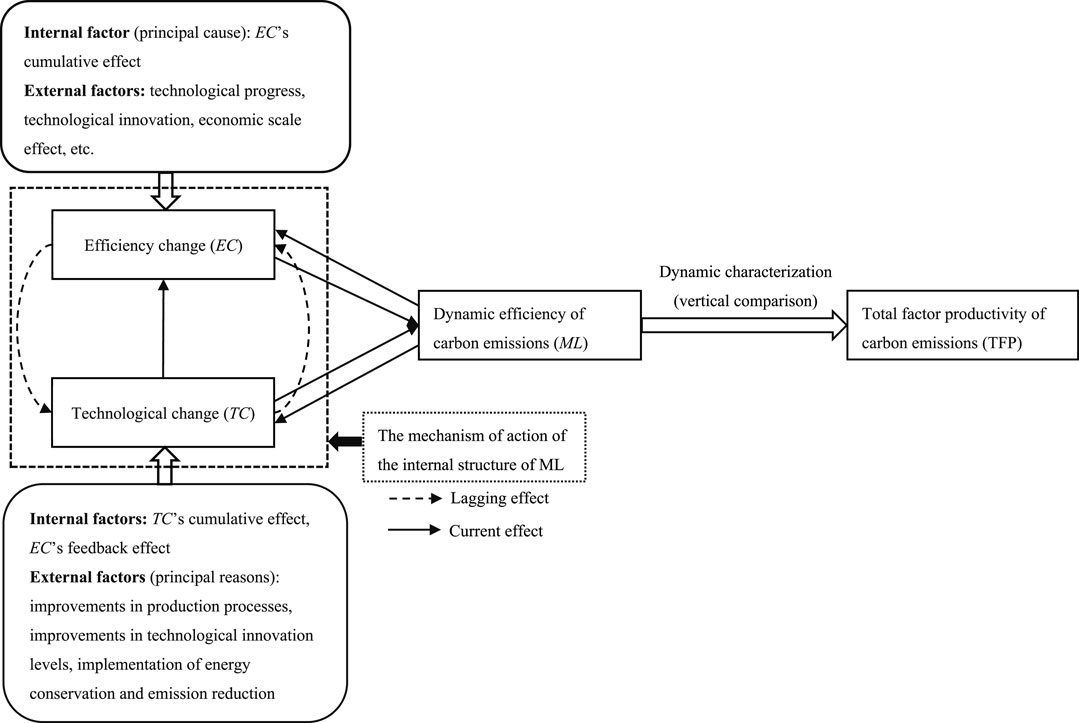
FIGURE 11. Theoretical mechanism of DCEEIE in China.
Figure 11 shows that TC and EC are the main factors influencing the mechanism of the internal structure of DCEEIE. TC is the development basis of all efficiency and affects EC and ML directly. EC also acts on ML directly, but the effect on TC has a certain lag. ML acts directly on TC and EC, because EC and TC themselves are decomposed by ML. In addition, the improvement in TC comes mainly from external factors, such as improvements in production processes, improvements in technological innovation levels, and the promotion of energy conservation and emissions reduction policies. The other source of the power of TC is TC’s cumulative effect and EC’s feedback effect. The growth of EC comes mainly from the EC’s cumulative effect, with the remainder dominated by external factors, such as the promotion from TC. This is because in the variance decomposition of EC, EC is more affected by its own impact than by the contribution of TC. The mechanism of the internal structure of DCEEIE is cyclic, with TC as the logical starting point and EC as the main driving force in jointly promoting the growth of ML.
6 Conclusion and policy implications
In response to the call from Kumbhakar et al. (2014) for more research to increase the accuracy of evaluations of carbon emission efficiency, and to calls from Wen et al. (2020), Chen et al. (2020), and Wang et al. (2020) for more research on regional differences in carbon emission efficiency, this study accurately measures the DCEEIE of 30 regions in China from 2001 to 2019 using the three-stage SE-SBM-DEA Malmquist–Luenberger model. It further examines regional differences in China’s DCEEIE using Dagum’s Gini coefficient and the PVAR model for empirical analysis. The results indicate that DCEEIE in China decreases gradually from east to west. The gaps in DCEEIE between regions are gradually narrowing, and the main reason for this is the narrowing of the technical efficiency gap between regions. Most importantly, technological change is the main driving force of efficiency change and dynamic efficiency.
7 Conclusion
The main findings of this study are as follows. First, DCEEIE in China shows an overall trend of growth, and all factors are all in the “efficient” state. Although both efficiency change and technological change are at the Frontier of efficiency, they are moving in opposite directions, leading to an attenuation of efficiency and a diffusion of technology. In terms of spatial pattern, DCEEIE is characterized by a “stepped” feature that decreases gradually from east to west. In addition, the efficiency change and technological change of China’s DCEEIE showed different degrees of polarization at different times from 2001 to 2019.
Second, the overall Gini coefficients of DCEEIE, efficiency change, and technological change all show a downward trend, indicating that regional differences are gradually narrowing. The narrowing of the technical efficiency gap is the main reason for the narrowing of the dynamic efficiency gap. The gaps between regions and transvariation intensity are among the principal reasons for these gaps, including the gaps for dynamic efficiency and efficiency change. The gap between regions is the main reason for the technological change gap.
Third, although there is an interaction between dynamic efficiency, efficiency change, and technological change, there are significant differences among samples from different regions in the intensity, direction, and duration of the effect. In the early stage of the development of dynamic efficiency, the impact of technological change is significantly positive, and the improvement of technological change significantly promotes improvements in efficiency change. Therefore, technological change is the main driving force for efficiency change and dynamic efficiency in the early stage. The accumulation of efficiency change in the early stage is then the main factor promoting the development of dynamic efficiency in the medium term. The development of dynamic efficiency promotes both efficiency and technological change, but the impact of dynamic efficiency on technological change is greater than the impact on efficiency change.
This paper has several limitations. First, we only focus on the industrial sector, but there are also regional differences in carbon efficiency in other industries such as construction and transportation, and such inter-regional differences and imbalances in these industries also need to be eliminated. COVID-19 has brought significant challenges to our society, increased the intensity of competition between enterprises, which has put pressure on the development of various industries such as tourism and manufacturing (Fu et al., 2021; Liu et al., 2022; Mamirkulova et al., 2022; Yu et al., 2022). This has undoubtedly also hindered the improvement of CEEIE in China. Therefore, it is also very important that future studies focus on regional differences in the carbon emission efficiency of these industries. Second, although this paper explores inter-regional differences in DCEEIE on the basis of existing literature and in terms of the internal structure of DCEEIE, the internal mechanism leading to the regional differences is derived from the interaction between TC and EC. However, there is still a need to further explore the internal or external factors which will affect TC and EC in the future in order to obtain a clearer understanding of the generation and elimination of interregional differences in DCEEIE. Finally, although increasing DCEEIE is an important way to reduce carbon emissions, the most fundamental and effective way to achieve green development is to increase the use of hybrid and renewable energy sources and reduce the use of fossil fuels (Abbasi et al., 2021a; Khan et al., 2021). Therefore, future research should focus on how to trigger and accelerate the transformation of energy infrastructure from fossil fuel use to hybrid and clean energy use at the source. Especially for SMEs, as they are more likely to encounter difficulties in the transition process and more difficult to resolve them (Mubeen et al., 2021).
7.1 Policy implications
The above analysis indicates that in order to reach its carbon peak by 2030 and become carbon-neutral before 2060, China, as a major carbon emitter and a rapidly developing country, should consider the following recommendations in line with its latest carbon emission policies.
First, the results of this study indicate that technological change is the basis of all efficiency development, and that efficiency change is the main driving factor in the early improvement of DCEEIE. Therefore, to further improve DCEEIE in China as a whole, it is necessary to carry out governance measures for efficiency change and technological change simultaneously. Given the large differences between regions in terms of economic development, policy orientation, and resource endowments, it is necessary to develop differentiated governance methods for efficiency change and technological change in different regions. Specifically, compared with the central and western regions, the eastern region should prioritize efficiency change in its governance measures. This is because the industrial structure of the eastern region is dominated by light industry with a relatively high rate of technological innovation. The cumulative effect of the contribution of technological change to carbon emission efficiency will gradually stabilize in line with the law of diminishing marginal utility, and the contribution of efficiency change will gradually become the main driving force for the growth of carbon emission efficiency. Accordingly, in response to the uneven development of DCEEIE between regions, the government also needs to put in place appropriate policies, for example, carbon tax, carbon pricing (Usman et al., 2022; Wei et al., 2022), and to ensure the implementation of tax policies and other related policies (Zhang et al., 2022). The eastern region should enhance subsidies for clean energy, seek to eliminate polluting and energy-intensive enterprises and products, and carry out further industrial upgrading and optimization. In addition, the eastern coastal areas should accelerate the diffusion of technology to the relatively backward areas in the central and western regions, strengthen technical exchanges and cooperation with those regions in terms of energy utilization, reduce the gaps with those regions in efficiency change and technological change, and aim for balanced development of regional carbon emissions efficiency.
Second, governance work in the central and western regions should take technological innovation as its initial goal, and improvements in efficiency change as the ultimate goal. This is because the industrial layout is an important factor in the carbon emissions efficiency in the central and western regions. The industrial structure in those regions is characterized by heavy industry with high energy consumption, relatively low rates of technological innovation, and industrial added value that is lower than energy consumption. As a result, the contribution of technological change to carbon emissions efficiency is inadequate, and the technological lag seriously restricts improvements in efficiency change. Therefore, it is necessary to optimize the overall industrial structure, adjust the regional industrial layout, change the energy consumption pattern, adjust the energy consumption structure, reduce the total amount of energy consumption, improve energy efficiency, and vigorously promote strategic emerging industries, high-tech industries, and equipment manufacturing in the central and western regions. In addition, although the central and western regions are significant locations for new energy industries such as photovoltaics and wind power, the slow upgrading of traditional industrial enterprises has resulted in low usage rates for renewable green energy. Therefore, to strengthen the green transformation services for traditional industrial enterprises in the central and western regions, it is necessary to guide traditional industrial enterprises in green technology innovation, encourage the building of a green manufacturing industrial system, and focus on promoting the green development of enterprises. Companies in backward regions can also enhance their dynamic capabilities through business relationships and achieve technological innovation (Abbas et al., 2019b). Innovative technology can directly reduce CO2 emissions and improve environmental quality (Cheng et al., 2021), indirectly help companies to better practice corporate social responsibility (Golinska-Dawson and Spychała, 2019), and can also better help people in backward regions to eliminate the negative impacts and effects of COVID-19 (Zhou et al., 2021; Ge et al., 2022). These are critical because COVID-19 will have a far-reaching impact worldwide in the future (Abbas, 2020).
Third, in order to improve technological change, it is necessary to strengthen international cooperation and promote the domestic implementation of international standards, including low-carbon technology assessments and carbon trading systems. It is important to introduce and integrate advanced technologies, improve independent innovation capabilities, and develop additional high-tech industries with high added value and low energy consumption; the gap between the major energy-carrying products and terminal energy-using equipment, on the one hand, and international energy consumption levels, on the other, should be narrowed as soon as possible. For the improvement of efficiency change, it is necessary to accelerate the low-carbon transformation of industry, prioritize the transformation of the industrial energy system, increase the proportion of renewable energy in the industrial sector, improve utilization efficiency, and facilitate the construction and improvement of new energy storage and transportation networks. Equally important measures are speeding up research and development in relation to green and low-carbon technologies, upgrading the original pollution reduction and carbon reduction technologies, and establishing a complete scientific and technological innovation service platform. In terms of the unbalanced development of CEEIE between regions, reducing the gaps in efficiency change and technological change will promote technical exchanges and cooperation in energy utilization between regions. In particular, a more balanced development of CEEIE can be achieved by accelerating technological diffusion from the eastern region to relatively backward areas in the central and western regions. Efforts at the corporate level are also very important, as companies that adopt environmental cooperation practices, such as green manufacturing practices, from the goal of practicing corporate social responsibility will not only achieve lower carbon emissions, but also improve their social sustainability performance (Awan, 2019).
Data availability statement
The raw data supporting the conclusion of this article will be made available by the authors, without undue reservation.
Author contributions
XL made contributions to the study design and data analysis; YT and XL wrote the draft of paper; YT and PL polished the manuscript, ZC and PL review and editing the manuscript in the revising process.
Acknowledgments
We thank J. Abbas, Joanna Rosak-Szyrocka and Gulnaz Muneer for their comments and suggestions. We gratefully acknowledge the financial support from the 2021 plateau discipline and first-class undergraduate specialty project of Shanghai Business School (Grant number SHGDD-GSGL-2021-03-11).
Conflict of interest
The authors declare that the research was conducted in the absence of any commercial or financial relationships that could be construed as a potential conflict of interest.
Publisher’s note
All claims expressed in this article are solely those of the authors and do not necessarily represent those of their affiliated organizations, or those of the publisher, the editors and the reviewers. Any product that may be evaluated in this article, or claim that may be made by its manufacturer, is not guaranteed or endorsed by the publisher.
Footnotes
1IPCC. Global Warming of 1.5°C. https://www.ipcc.ch/sr15/.
2Due to differences in economic development, geography and demographics, Chinese government divide China into three major economic regions: Eastern, Central and Western.
3The eastern region includes Beijing, Tianjin, Hebei, Liaoning, Shanghai, Jiangsu, Zhejiang, Fujian, Shandong, Guangdong and Hainan.
4The central region includes Shanxi, Inner Mongolia, Jilin, Heilongjiang, Anhui, Jiangxi, Henan, Hubei and Hunan.
5The western region includes Chongqing, Sichuan, Guizhou, Yunnan, Shaanxi, Guangxi, Gansu, Qinghai, Ningxia, Xinjiang and Xizang.
References
Abbas, J., Mahmood, S., Ali, H., Raza, M., Ali, G., Aman, J., et al. (2019a). The effects of corporate social responsibility practices and environmental factors through a moderating role of social media marketing on sustainable performance of firms' operating in multan, Pakistan. Sustainability 11 (12), 3434. doi:10.3390/su11123434
Abbas, J., Raza, S., Nurunnabi, M., Minai, M. S., and Bano, S. (2019b). The impact of entrepreneurial business networks on firms' performance through a mediating role of dynamic capabilities. Sustainability 11 (11), 3006. doi:10.3390/su11113006
Abbas, J. (2020). The role of interventions to manage and reduce Covid-19 mortality rate of the COVID-19 patients worldwide. Found. Univ. J. Psychol. 4 (2), 33–36.
Abbasi, K. R., Abbas, J., and Tufail, M. (2021a). Revisiting electricity consumption, price, and real GDP: A modified sectoral level analysis from Pakistan. Energy Policy 149, 112087. doi:10.1016/j.enpol.2020.112087
Abbasi, K. R., Adedoyin, F. F., Abbas, J., and Hussain, K. (2021b). The impact of energy depletion and renewable energy on CO2 emissions in Thailand: Fresh evidence from the novel dynamic ARDL simulation. Renew. Energy 180, 1439–1450. doi:10.1016/j.renene.2021.08.078
Ang, B. W. (1999). Is the energy intensity a less useful indicator than the carbon factor in the study of climate change? Energy Policy 27 (15), 943–946. doi:10.1016/s0301-4215(99)00084-1
Awan, U. (2019). Impact of social supply chain practices on social sustainability performance in manufacturing firms. Ijisd 13 (2), 198–219. doi:10.1504/ijisd.2019.10019789
Awan, U. S. A. M. A., and Raza, M. A. (2012). Green consumer behavior: Empirical study of Swedish consumer behavior. Recent Res. Econ. 1, 89–104.
Awan, U., and Sroufe, R. (2022). Sustainability in the circular economy: Insights and dynamics of designing circular business models. Appl. Sci. 12 (3), 1521. doi:10.3390/app12031521
Blanco, L., Gonzalez, F., and Ruiz, I. (2013). The impact of FDI on CO2Emissions in Latin America. Oxf. Dev. Stud. 41 (1), 104–121. doi:10.1080/13600818.2012.732055
Bruce, J. P., Lee, H., and Haites, E. F. (1996). Climate change 1995. Economic and social dimensions of climate change.
Cai, B., Guo, H., Ma, Z., Wang, Z., Dhakal, S., and Cao, L. (2019). Benchmarking carbon emissions efficiency in Chinese cities: A comparative study based on high-resolution gridded data. Appl. Energy 242 (PT.1-1284), 994–1009. doi:10.1016/j.apenergy.2019.03.146
Chen, C., Liu, C., Wang, H., Guan, J., Chen, L., Wang, H., and Liu, X. (2014). Examining the impact factors of energy consumption related carbon footprints using the STIRPAT model and PLS model in Beijing. China Environ. Sci. 34 (6), 1622–1632.
Chen, Z., Yuan, X.-C., Zhang, X., and Cao, Y. (2020). How will the Chinese national carbon emissions trading scheme work? The assessment of regional potential gains. Energy Policy 137, 111095. doi:10.1016/j.enpol.2019.111095
Cheng, Y., Awan, U., Ahmad, S., and Tan, Z. (2021). How do technological innovation and fiscal decentralization affect the environment? A story of the fourth industrial revolution and sustainable growth. Technol. Forecast. Soc. Change 162, 120398. doi:10.1016/j.techfore.2020.120398
Choi, Y., Zhang, N., and Zhou, P. (2012). Efficiency and abatement costs of energy-related co2 emissions in China: A slacks-based efficiency measure. Appl. Energy 98, 198–208. doi:10.1016/j.apenergy.2012.03.024
Chung, Y. H., Färe, R., and Grosskopf, S. (1997). Productivity and undesirable outputs: A directional distance function approach. J. Environ. Manag. 51 (3), 229–240. doi:10.1006/jema.1997.0146
Dagum, C. (1997). A new approach to the decomposition of the gini income inequality ratio. Empir. Econ. 22 (4), 515–531. doi:10.1007/bf01205777
Ding, L., Yang, Y., Wang, W., and Calin, A. C. (2019). Regional carbon emission efficiency and its dynamic evolution in China: A novel cross efficiency-malmquist productivity index. J. Clean. Prod. 241, 118260. doi:10.1016/j.jclepro.2019.118260
Duro, J. A., Alcántara, V., and Padilla, E. (2010). International inequality in energy intensity levels and the role of production composition and energy efficiency: An analysis of OECD countries. Ecol. Econ. 69 (12), 2468–2474. doi:10.1016/j.ecolecon.2010.07.022
Duro, J. A., and Padilla, E. (2006). International inequalities in per capita CO2 emissions: A decomposition methodology by kaya factors. Energy Econ. 28 (2), 170–187. doi:10.1016/j.eneco.2005.12.004
Färe, R., Grosskopf, S., Noh, D. W., and Weber, W. (2005). Characteristics of a polluting technology: Theory and practice. J. Econ. 126 (2), 469–492. doi:10.1016/j.jeconom.2004.05.010
Färe, R., Grosskopf, S., Lindgren, B., and Roos, P. (1992). Productivity changes in Swedish pharamacies 1980–1989: A non-parametric malmquist approach. J. Prod. Analysis 3 (1), 81–97. doi:10.1007/978-94-017-1923-0_6
Feng, D., Long, R., Bian, Z., Xu, X., Yu, B., and Ying, W. (2017). Applying a ruggiero three-stage super-efficiency dea model to gauge regional carbon emission efficiency: Evidence from China. Nat. Hazards 87 (3), 1453–1468.
Ferreira, A., Pinheiro, M. D., de Brito, J., and Mateus, R. (2018). Combined carbon and energy intensity benchmarks for sustainable retail stores. Energy 165, 877–889. doi:10.1016/j.energy.2018.10.020
Fu, Q., Abbas, J., and Sultan, S. (2021). Reset the industry redux through corporate social responsibility: The COVID-19 tourism impact on hospitality firms through business model innovation. Front. Psychol., 6686.
Gao, P., Yue, S., and Chen, H. (2020). Carbon emission efficiency of China's industry sectors: From the perspective of embodied carbon emissions. J. Clean. Prod. 283 (1), 124655. doi:10.1016/j.jclepro.2020.124655
Ge, T., Abbas, J., Ullah, R., Abbas, A., Sadiq, I., and Zhang, R. (2022). Women's entrepreneurial contribution to family income: Innovative technologies promote females' entrepreneurship amid COVID-19 crisis. Front. Psychol. 13, 828040. doi:10.3389/fpsyg.2022.828040
Giannakas, K., Schoney, R., and Tzouvelekas, V. (2001). Technical efficiency, technological change and output growth of wheat farms in Saskatchewan. Can. J. Agric. Econ. 49 (2), 135–152. doi:10.1111/j.1744-7976.2001.tb00295.x
Golinska-Dawson, P., and Spychała, M. (Editors) (2019). Corporate social responsibility in the manufacturing and services sectors (Springer).
Gómez-Calvet, R., Conesa, A., Gómez-Calvet, A. R., and Tortosa-Ausina, E. (2014). Energy efficiency in the European Union: What can be learned from the joint application of directional distance functions and slacks-based measures? Appl. Energy 132 (11), 137–154. doi:10.1016/j.apenergy.2014.06.053
Granger, C. W. J. (1969). Investigating causal relations by econometric models and cross spectral methods. Econometrica (37), 424–438. doi:10.2307/1912791
Granger, C. W. J. (1980). Testing for causality: A personal viewpoint. J. Econ. doi:10.1017/ccol052179207x.003
Hedenus, F., and Azar, C. (2005). Estimates of trends in global income and resource inequalities. Ecol. Econ. 55 (3), 351–364. doi:10.1016/j.ecolecon.2004.10.004
Heil, M. T., and Wodon, Q. T. (2000). Future inequality in CO2 emissions and the impact of abatement proposals. Environ. Resour. Econ. 17 (2), 163–181. doi:10.1023/a:1008326515058
Heil, M. T., and Wodon, Q. T. (1997). Inequality in CO2 emissions between poor and rich countries. J. Environ. Dev. 6 (4), 426–452. doi:10.1177/107049659700600404
Hong, Y. (2001). A test for volatility spillover-with application to exchange rates. J. Econ. (103), 183–224. doi:10.1016/s0304-4076(01)00043-4
Iftikhar, Y., He, W., and Wang, Z. (2016). Energy and CO 2 emissions efficiency of major economies: A non-parametric analysis. J. Clean. Prod. 139, 779–787. doi:10.1016/j.jclepro.2016.08.072
Kneller, R., and Manderson, E. (2012). Environmental regulations and innovation activity in UK manufacturing industries. Resour. Energy Econ. 34 (2), 211–235. doi:10.1016/j.reseneeco.2011.12.001
Kortelainen, M. (2008). Dynamic environmental performance analysis: A malmquist index approach. Ecol. Econ. 64 (4), 701–715. doi:10.1016/j.ecolecon.2007.08.001
Kumbhakar, S. C., Lien, G., and Hardaker, J. B. (2014). Technical efficiency in competing panel data models: A study of Norwegian grain farming. J. Prod. Anal. 41 (2), 321–337. doi:10.1007/s11123-012-0303-1
Li, Y., Lin, T. Y., Chiu, Y. H., Chen, H., and Cen, H. (2021). The impact of media reports on energy and environmental efficiency in China: Evidence from modified dynamic DEA with undesirable outputs. Cost Eff. Resour. Allocation 19 (1), 1–15. doi:10.1186/s12962-021-00302-7
Lin, B., and Du, K. (2015). Modeling the dynamics of carbon emission performance in China: A parametric malmquist index approach. Energy Econ. 49, 550–557. doi:10.1016/j.eneco.2015.03.028
Liu, J., Li, S., and Ji, Q. (2021). Regional differences and driving factors analysis of carbon emission intensity from transport sector in China. Energy 224, 120178. doi:10.1016/j.energy.2021.120178
Liu, Q., Qu, X., Wang, D., Abbas, J., and Mubeen, R. (2022). Product market competition and firm performance: Business survival through innovation and entrepreneurial orientation amid COVID-19 financial crisis. Front. Psychol. 12, 790923. doi:10.3389/fpsyg.2021.790923
Liu, X., Zhou, D., Zhou, P., and Wang, Q. (2017). Dynamic carbon emission performance of Chinese airlines: A global malmquist index analysis. J. Air Transp. Manag. 65, 99–109. doi:10.1016/j.jairtraman.2017.09.009
Liu, Y., Xiao, H., and Zhang, N. (2016b). Industrial carbon emissions of China's regions: A spatial econometric analysis. Sustainability 8 (3), 210. doi:10.3390/su8030210
Liu, Y., Zhao, G., and Zhao, Y. (2016a). An analysis of Chinese provincial carbon dioxide emission efficiencies based on energy consumption structure. Energy Policy 96 (sep), 524–533. doi:10.1016/j.enpol.2016.06.028
Long, X., Naminse, E. Y., Du, J., and Zhuang, J. (2015). Nonrenewable energy, renewable energy, carbon dioxide emissions and economic growth in China from 1952 to 2012. Renew. Sustain. Energy Rev. 52, 680–688. doi:10.1016/j.rser.2015.07.176
Lu, L., Zhou, L., Zhang, H., and Weng, Y. (2018). The effects of industrial energy consumption on energy-related carbon emissions at national and provincial levels in China. Energy Sci. Eng. 6 (5), 371–384. doi:10.1002/ese3.206
Ma, C., and Stern, D. I. (2008). China's changing energy intensity trend: A decomposition analysis. Energy Econ. 30 (3), 1037–1053. doi:10.1016/j.eneco.2007.05.005
Mamirkulova, G., Abbas, J., and Salem, S. (2022). Economic Corridor and tourism sustainability amid unpredictable COVID-19 challenges: Assessing community well-being in the World Heritage Sites. Front. Psychol. 12, 797568. doi:10.3389/fpsyg.2022.797568
Marklund, P.-O., and Samakovlis, E. (2007). What is driving the EU burden-sharing agreement: Efficiency or equity? J. Environ. Manag. 85 (2), 317–329. doi:10.1016/j.jenvman.2006.09.017
Mielnik, O., and Goldemberg, J. (1999). Communication the evolution of the “carbonization index” in developing countries. Energy Policy 27 (5), 307–308. doi:10.1016/s0301-4215(99)00018-x
Molinos-senante, M., Sala-Garrido, R., and Hernández-Sancho, F. (2016). Development and application of the Hicks-Moorsteen productivity index for the total factor productivity assessment of wastewater treatment plants. J. Clean. Prod. 112, 3116–3123. doi:10.1016/j.jclepro.2015.10.114
Mubeen, R., Han, D., Abbas, J., Raza, S., and Bodian, W. (2021). Examining the relationship between product market competition and Chinese firms performance: The mediating impact of capital structure and moderating influence of firm size. Front. Psychol. 12, 709678. doi:10.3389/fpsyg.2021.709678
Mutafoglu, T. H. (2012). Foreign direct investment, pollution, and economic growth. J. Dev. Soc. 28 (3), 281–297. doi:10.1177/0169796x12453780
Nesta, L., Vona, F., and Nicolli, F. (2014). Environmental policies, competition and innovation in renewable energy. J. Environ. Econ. Manag. 67 (3), 396–411. doi:10.1016/j.jeem.2014.01.001
Padilla, E., and Serrano, A. (2006). Inequality in CO2 emissions across countries and its relationship with income inequality: A distributive approach. Energy policy 34 (14), 1762–1772. doi:10.1016/j.enpol.2004.12.014
Pretis, F., and Roser, M. (2017). Carbon dioxide emission-intensity in climate projections: Comparing the observational record to socio-economic scenarios. Energy 135, 718–725. doi:10.1016/j.energy.2017.06.119
Rashid Khan, H. u., Awan, U., Zaman, K., Nassani, A. A., Haffar, M., and Abro, M. M. Q. (2021). Assessing hybrid solar-wind potential for industrial decarbonization strategies: Global shift to green development. Energies 14 (22), 7620. doi:10.3390/en14227620
Robaina Alves, M., and Moutinho, V. (2013). Decomposition analysis and Innovative Accounting Approach for energy-related CO2 (carbon dioxide) emissions intensity over 1996-2009 in Portugal. Energy 57, 775–787. doi:10.1016/j.energy.2013.05.036
Shafik, N., and Bandyopadhyay, S. (1992). Policy research working paper Series.Economic growth and environmental quality : Time series and cross-country evidence
Song, M., An, Q., Zhang, W., Wang, Z., and Wu, J. (2012). Environmental efficiency evaluation based on data envelopment analysis: A review. Renew. Sustain. Energy Rev. 16 (7), 4465–4469. doi:10.1016/j.rser.2012.04.052
Teng, X., Lu, L. C., and Chiu, Y.-H. (2019). Energy and emission reduction efficiency of China's industry sector: A non-radial directional distance function analysis. Carbon Manag. 10 (4), 333–347. doi:10.1080/17583004.2019.1605481
Tone, K. (2001). A slacks-based measure of efficiency in data envelopment analysis. Eur. J. Operational Res. 130 (3), 498–509. doi:10.1016/s0377-2217(99)00407-5
Tone, K. (2002). A slacks-based measure of super-efficiency in data envelopment analysis. Eur. J. Operational Res. 143 (1), 32–41. doi:10.1016/s0377-2217(01)00324-1
Usman, B., Zaman, K., Nassani, A. A., Haffar, M., and Muneer, G. (2022). The impact of carbon pricing, climate financing, and financial literacy on COVID-19 cases: Go-for-green healthcare policies. Environ. Sci. Pollut. Res., 1–13.
Wang, J., Lv, K., Bian, Y., and Cheng, Y. (2017). Energy efficiency and marginal carbon dioxide emission abatement cost in urban China. Energy Policy 105, 246–255. doi:10.1016/j.enpol.2017.02.039
Wang, K., and Wei, Y. M. (2014). China’s regional industrial energy efficiency and carbon emissions abatement costs. Appl. Energy 130, 617–631.
Wang, Y., Yang, H., and Sun, R. (2020). Effectiveness of China's provincial industrial carbon emission reduction and optimization of carbon emission reduction paths in "lagging regions": Efficiency-cost analysis. J. Environ. Manag. 275, 111221. doi:10.1016/j.jenvman.2020.111221
Wei, R., Ayub, B., and Dagar, V. (2022). Environmental benefits from carbon tax in the Chinese carbon market: A roadmap to energy efficiency in the post-COVID-19 era. Front. Energy Res. 10, 832578. doi:10.3389/fenrg.2022.832578
Wen, Q., Gu, J., Hong, J., Shen, G. Q., Li, Z., and Yuan, M. (2020). Unfolding interregional energy flow structure of China's construction sector based on province-level data. J. Environ. Manag. 253, 109693. doi:10.1016/j.jenvman.2019.109693
Worthington, A. C. (2000). Technical efficiency and technological change in Australian building societies. Abacus 36 (2), 189–197. doi:10.1111/1467-6281.00059
Wu, F., Fan, L. W., Zhou, P., and Zhou, D. Q. (2012). Industrial energy efficiency with co2 emissions in China: A nonparametric analysis. Energy Policy 49 (none), 164–172. doi:10.1016/j.enpol.2012.05.035
Wu, J., Zhu, Q., and Liang, L. (2016). Co2 emissions and energy intensity reduction allocation over provincial industrial sectors in China. Appl. Energy 166 (mar.15), 282–291. doi:10.1016/j.apenergy.2016.01.008
Wu, Q., and Gu, S. (2021). Exploring the focus of future co2 emission reduction in China's industrial sectors. Greenh. Gases Sci. Technol. (8), 682–696. doi:10.1002/ghg.2072
Xu, S.-C., He, Z.-X., Long, R.-Y., Shen, W.-X., Ji, S.-B., and Chen, Q.-B. (2016). Impacts of economic growth and urbanization on CO2 emissions: Regional differences in China based on panel estimation. Reg. Environ. Change 16 (3), 777–787. doi:10.1007/s10113-015-0795-0
Yan, D., Lei, Y., Li, L., and Song, W. (2017). Carbon emission efficiency and spatial clustering analyses in China's thermal power industry: Evidence from the provincial level. J. Clean. Prod. 156, 518–527. doi:10.1016/j.jclepro.2017.04.063
Yao, X., Zhou, H., Zhang, A., and Li, A. (2015). Regional energy efficiency, carbon emission performance and technology gaps in China: A meta-frontier non-radial directional distance function analysis. Energy Policy 84 (sep), 142–154. doi:10.1016/j.enpol.2015.05.001
Yu, S., Abbas, J., Draghici, A., Negulescu, O. H., and Ain, N. U. (2022). Social media application as a new paradigm for business communication: The role of COVID-19 knowledge, social distancing, and preventive attitudes. Front. Psychol. 13, 903082. doi:10.3389/fpsyg.2022.903082
Yu, S., Zhang, J., Zheng, S., and Sun, H. (2015). Provincial carbon intensity abatement potential estimation in China: A PSO-GA-optimized multi-factor environmental learning curve method. Energy Policy 77 (feb), 46–55. doi:10.1016/j.enpol.2014.11.035
Yu, Y., and Zhang, N. (2021). Low-carbon city pilot and carbon emission efficiency: Quasi-experimental evidence from China. Energy Econ. 96 (2), 105125. doi:10.1016/j.eneco.2021.105125
Zhang, L., Zhao, L., and Zha, Y. (2021). Efficiency evaluation of Chinese regional industrial systems using a dynamic two-stage dea approach. Socio-Economic Plan. Sci. 77 (1), 101031. doi:10.1016/j.seps.2021.101031
Zhang, N., Zhou, P., and Choi, Y. (2013). Energy efficiency, CO2 emission performance and technology gaps in fossil fuel electricity generation in korea: A meta-frontier non-radial directional distance functionanalysis. Energy policy 56, 653–662. doi:10.1016/j.enpol.2013.01.033
Zhang, X.-P., and Cheng, X.-M. (2009). Energy consumption, carbon emissions, and economic growth in China. Ecol. Econ. 68 (10), 2706–2712. doi:10.1016/j.ecolecon.2009.05.011
Zhang, X., Husnain, M., Yang, H., Ullah, S., Abbas, J., and Zhang, R. (2022). Corporate business strategy and tax avoidance culture: Moderating role of gender diversity in an emerging economy. Front. Psychol. 13. doi:10.3389/fpsyg.2022.827553
Zhang, Y.-J., Hao, J.-F., and Song, J. (2016). The CO2 emission efficiency, reduction potential and spatial clustering in China's industry: Evidence from the regional level. Appl. Energy 174, 213–223. doi:10.1016/j.apenergy.2016.04.109
Zhang, Y.-J., Liang, T., Jin, Y.-L., and Shen, B. (2020). The impact of carbon trading on economic output and carbon emissions reduction in China's industrial sectors. Appl. Energy 260, 114290. doi:10.1016/j.apenergy.2019.114290
Zhang, Y.-J., Peng, Y.-L., Ma, C.-Q., and Shen, B. (2017). Can environmental innovation facilitate carbon emissions reduction? Evidence from China. Energy Policy 100 (Complete), 18–28. doi:10.1016/j.enpol.2016.10.005
Zhang, Y.-J., Sun, Y.-F., and Huang, J. (2018). Energy efficiency, carbon emission performance, and technology gaps: Evidence from cdm project investment. Energy Policy 115 (APR), 119–130. doi:10.1016/j.enpol.2017.12.056
Zhang, Y.-J. (2011). The impact of financial development on carbon emissions: An empirical analysis in China. Energy Policy 39 (4), 2197–2203. doi:10.1016/j.enpol.2011.02.026
Zheng, H., Gao, X., Sun, Q., Han, X., and Wang, Z. (2020). The impact of regional industrial structure differences on carbon emission differences in China: An evolutionary perspective. J. Clean. Prod. 257, 120506. doi:10.1016/j.jclepro.2020.120506
Zhou, P., Ang, B. W., and Han, J. Y. (2010). Total factor carbon emission performance: A malmquist index analysis. Energy Econ. 32 (1), 194–201. doi:10.1016/j.eneco.2009.10.003
Zhou, Y., Draghici, A., Abbas, J., Mubeen, R., Boatca, M. E., and Salam, M. A. (2021). Social media efficacy in crisis management: Effectiveness of non-pharmaceutical interventions to manage COVID-19 challenges. Front. psychiatry 12.
Zhou, Y., Liu, W., Lv, X., Chen, X., and Shen, M. (2019). Investigating interior driving factors and cross-industrial linkages of carbon emission efficiency in China's construction industry: Based on super-sbm dea and gvar model. J. Clean. Prod. 241 (Dec.20), 118322. doi:10.1016/j.jclepro.2019.118322
Zhu, J., Niu, L., Ruth, M., and Shi, L. (2018). Technological change and energy efficiency in large Chinese firms. Ecol. Econ. 150, 241–250. doi:10.1016/j.ecolecon.2018.04.009
Zhu, Q., Li, X., Li, F., and Zhou, D. (2019). The potential for energy saving and carbon emission reduction in China's regional industrial sectors. Sci. Total Environ. 716, 135009. doi:10.1016/j.scitotenv.2019.135009
Keywords: dynamic efficiency, technological change, dagum gini coefficient, PVAR model, three-stage SBM-DEA, malmquist-luenberger index
Citation: Li X, Tang Y, Liu P and Cheng Z (2022) Regional differential decomposition and the formation mechanism of the dynamic carbon emissions efficiency of industrial energy in China. Front. Environ. Sci. 10:946596. doi: 10.3389/fenvs.2022.946596
Received: 17 May 2022; Accepted: 27 June 2022;
Published: 04 August 2022.
Edited by:
Usama Awan, Lappeenranta University of Technology, FinlandReviewed by:
J. Abbas, Shanghai Jiao Tong University, ChinaJoanna Rosak-Szyrocka, Częstochowa University of Technology, Poland
Gulnaz Muneer, Bahauddin Zakariya University, Pakistan
Copyright © 2022 Li, Tang, Liu and Cheng. This is an open-access article distributed under the terms of the Creative Commons Attribution License (CC BY). The use, distribution or reproduction in other forums is permitted, provided the original author(s) and the copyright owner(s) are credited and that the original publication in this journal is cited, in accordance with accepted academic practice. No use, distribution or reproduction is permitted which does not comply with these terms.
*Correspondence: Pingsheng Liu, ansonliu278@163.com