 Anna Åkesson1,2*
 Liana Xhakollari3,4
 Agnė Laučytė-Cibulskiene3,4
 Anders Grubb5
 Anders Larsson6
 Amra Jujic3,7
 Martin Magnusson3,7,8,9
 Anders Christensson3,4,†
 Jonas Björk1,2,†
- 1Clinical Studies Sweden - Forum South, Skåne University Hospital, Lund, Sweden
- 2Department of Laboratory Medicine, Lund University, Lund, Sweden
- 3Department of Clinical Sciences Malmö, Lund University, Malmö, Sweden
- 4Department of Nephrology, Skåne University Hospital, Malmö, Sweden
- 5Department of Clinical Chemistry, Lund University, Lund, Sweden
- 6Department of Medical Sciences, Clinical Chemistry, Uppsala University, Uppsala, Sweden
- 7Department of Cardiology, Skåne University Hospital, Malmö, Sweden
- 8Wallenberg Centre for Molecular Medicine, Lund University, Lund, Sweden
- 9Hypertension in Africa Research Team (HART), North-West University, Potchefstroom, South Africa
Purpose: Glomerular filtration rate (GFR) is used for evaluating kidney function. Creatinine and cystatin C levels are the two endogenous substances used to estimate GFR (eGFRCR and eGFRCYS). The agreement between these two is reflected by the eGFRCYS/eGFRCR ratio. An eGFRCYS/eGFRCR ratio <0.70 has been strongly associated with mortality and morbidity. An explanation is a selective decrease in the filtration of substances of different masses, and this condition is referred to as “Shrunken pore syndrome” (SPS). We aim to investigate the prevalence of SPS and its association with morbidity and mortality in a well-characterized population-based cohort.
Methods: The study population consisted of 5,061 individuals from the Malmö Diet and Cancer cardiovascular cohort (MDC-CC) with baseline examinations between 1991 and 1994 and a median follow-up of 25.3 years (IQR = 5.7). The eGFRCYS/eGFRCR ratio was categorized into four groups and used to estimate a generalized propensity score for SPS to adjust for confounding factors. Individuals were matched to create a quartet (one from each eGFRCYS/eGFRCR ratio category) with similar scores. We related the eGFRCYS/eGFRCR ratio to all-cause mortality, incident cardiovascular disease, incident kidney disease, and incident diabetes using Cox proportional hazards models with shared frailty.
Results: SPS was detected in 405 individuals (8.0%). The hazard ratio (HR) for all-cause mortality was 1.6 [95% confidence interval (CI) 1.3–2.0] when comparing individuals with SPS to the reference group (eGFRCYS/eGFRCR ratio ≥ 1.0). For incident kidney disease, the association seems to stem from a low eGFRCYS rather than the eGFRCYS/eGFRCR ratio. For the other two outcomes, robust and statistically significant associations could not be found.
Conclusion: SPS was prevalent among middle-aged, generally healthy, individuals and led to markedly higher mortality during follow-up.
1 Introduction
Glomerular filtration rate (GFR) is considered the clinically most useful way to evaluate kidney function (1). Creatinine and cystatin C are the two endogenous substances commonly used in clinical practice to estimate GFR (eGFRCR and eGFRCYS). The Kidney Disease: Improving Global Outcomes (KDIGO) guidelines recommend to base eGFR on both creatinine and cystatin C in clinical practice for classification of chronic kidney disease (CKD) stage and risk calculation of mortality and morbidity (2).
The agreement between eGFR based on creatinine and cystatin C is reflected by the eGFRCYS/eGFRCR ratio. In most patients, eGFRCR and eGFRCYS agree, yielding an eGFRCYS/eGFRCR ratio close to 1. However, decreased ratios below 0.70 are sometimes observed even in the absence of non-renal factors influencing eGFRCYS or eGFRCR (3). Such low ratios are strongly associated with premature death and morbidity (4–14) and seem robust to the choice of GFR equations (5, 6). These observations have been suggested to be due to a selective decrease in the capacity of the glomerular filtration barrier to filter middle-sized (5–40 kDa) substances, such as cystatin C and beta-2-microglobulin, with virtually intact capacity to filter low molecular mass (<1 kDa) substances, such as water and creatinine, first noted in the third trimester of pregnancy (12, 15, 16). The corresponding condition is hence referred to as “Shrunken pore syndrome (SPS)” (3, 5, 6). Although the designation of the syndrome is based on the theoretical pore model for glomerular filtration, recent structural studies suggest that a thickening of the glomerular basal membrane also can produce a selective decrease in the filtration of middle-sized molecules (12, 16, 17). Whether this is due to shrinking or extension of the pores or to some other mechanism remains to be established.
Since the first description of SPS in 2015 (3), several studies in different patient settings have established SPS as a health condition associated with mortality and morbidity, with prevalence estimates varying from 0.2% to 36% (4, 7, 12, 13, 16, 18, 19). An association to mortality or morbidity in patients with an eGFRCYS value significantly lower than their eGFRCR value has also been found when the difference was used rather than the ratio (20–23).
When SPS has been investigated in general population studies, similar associations with mortality and morbidity have been observed (24, 25). In this study, we aim to further investigate these associations using a well-characterized population-based cohort with register linkage to national registers, allowing for a more refined confounding adjustment.
2 Materials and methods
2.1 Study cohort
The main study cohort used originates from the Malmö Diet and Cancer (MDC) study, a population-based, prospective study conducted in Malmö in southern Sweden (n = 28,449). In MDC, 6,103 subjects were additionally part of a study on the epidemiology of carotid artery disease. This subsample is referred to as the MDC cardiovascular cohort (MDC-CC), with examinations carried out between 1991 and 1994 (26). Samples of cystatin C and creatinine were available for 5,061 individuals, who make up our study cohort. This study was conducted in accordance with the Declaration of Helsinki and was approved by the Ethics Review Board in Lund, Sweden (DNR 2017/846). The manuscript was prepared according to the Strengthening the Reporting of Observational Studies in Epidemiology (STROBE) guidelines (27).
2.2 Baseline examinations
Baseline examination included blood sample donations, anthropometric measurements, dietary assessment, and a self-administered questionnaire about alcohol consumption, smoking, physical activity, education, employment status, and medical history.
Hypertension was defined as a history of hypertension, use of antihypertensive medication, or a systolic or diastolic blood pressure ≥140/90 mmHg. Diabetes at baseline was defined as a previous diagnosis of diabetes, use of anti-diabetic medications, or a fasting blood glucose level >6 mmol/L. Current cigarette smoking was defined as use of cigarette within the past year (28). Additional blood sampling, including measurements of cystatin C and creatinine, was carried out in the MDC-CC (28).
2.3 Measurements of cystatin C and creatinine in the MDC-CC and the reference cohort
Plasma creatinine (μmol/L) was analyzed at the Department of Clinical Chemistry, Malmö University Hospital, using the Jaffé method, traceable to isotope-dilution mass spectrometry (IDMS). Cystatin C levels (mg/L) were analyzed using a particle-enhanced immunonephelometric assay (N Latex Cystatin; Dade Behring, Deerfield, IL, USA) (21). The cystatin C values in the MDC-CC cohort were analyzed before the introduction of the world calibrator in 2010 (29) and were not standardized according to this (30). The reference value for the method was 0.53–0.95 mg/L.
Non-standardized cystatin C values in the MDC-CC tended to be lower than those in cohorts analyzed after the introduction of the world calibrator (ERM-DA 471/IFCC). We therefore used the association between cystatin C and creatinine levels in a reference cohort to correct the cystatin C values in the MDC-CC (see Statistical analysis). The reference cohort was obtained from non-nephrology units in Uppsala, Sweden, in 2005–2015 and consisted of anonymous data on age, sex, and plasma creatinine and cystatin C levels for patients aged 44–74 years old (n = 142,978). All creatinine samples for the reference cohort were analyzed in clinical routine at the hospital with standardized assays traceable to IDMS, and cystatin C samples were determined by an automated particle-enhanced immunoturbidimetric assay and calibrated against the ERM-DA 471/IFCC.
We used the cystatin C-based Caucasian Asian Pediatric Adult (CAPA)-equation (31) to estimate GFR based on corrected cystatin C (eGFRCYS) and the Lund-Malmö revised (LMR) equation (32) to estimate GFR based on creatinine (eGFRCR). In a Swedish population, CAPA and LMR can advantageously be used, as these equations were developed in Swedish cohorts (31). We categorized eGFRCYS/eGFRCR ratio into four groups, with the lowest quartile indicating SPS, to accommodate more of a gradient in the effect.
2.4 Endpoints
The endpoints investigated were all-cause mortality, incident cardiovascular disease (CVD) (ICD10 I21–I23, I25; ICD9 410), incident diabetes (ICD10 E100–E149; ICD9 250–259), and incident kidney disease (ICD10 N02–N08, N11–N16, N18–N19; ICD9 585–589). Information on endpoints in MDC was linked with the national patient and cause of death registers kept by the Swedish National Board of Health and Welfare using the personal identity number for each study participant. All participants in the MDC-CC were followed from the baseline examination until the specific endpoint or death or emigration from Sweden or until the end of follow-up (31 December 2018), with a median follow-up of 25.3 years (IQR = 5.7).
2.5 Statistical analysis
All statistical analyses were conducted using STATA SE version 16.1 (33) and R v.4.1.0 (34).
2.5.1 Corrected cystatin C using linear regression
For the reference cohort, we restricted the analysis to subjects with cystatin C within the 2.5–97.5 percentile and creatinine within the same range (min–max) as the range in the MDC-CC. Furthermore, the analysis in the reference cohort was weighted to follow the distribution (in deciles) of creatinine as in the MDC-CC. In both cohorts, sex-specific linear regression models were estimated as follows:
where ln is the natural logarithm and β0–β2 are the estimated regression coefficients. Predicted values from the models were obtained, and corrected cystatin C values for females were calculated as follows:
and for males:
The values were exponentiated before further analysis.
2.5.2 Generalized propensity score
Propensity score analysis is a method for detailed confounding adjustment in observational studies, by creating matched cohorts of individuals who are balanced with respect to measured confounders (35). The generalized propensity score (GPS) is an extension of the propensity score beyond two groups and is instead calculated as the level of treatment conditional on confounders (36). Here, the treatment was categorized in eGFRCYS/eGFRCR ratio intervals, and we estimated the GPS using multinomial logistic regression including all the variables listed in Table 1 as covariates. Then, the predicted probabilities (i.e., the GPS) from the first three categories were used. Next, a greedy matching approach was employed to create quartets of matched individuals. A greedy approach means that the nearest match is found, and then the process repeats itself. The matching generates a quartet consisting of four individuals (one from each eGFRCYS/eGFRCR ratio category) with similar scores. To ensure as many quartets as possible, and since each matched quartet is gradually built, i.e., first a pair is found, then a trio, and finally a quartet is formed, matches of higher quality were given priority. Where higher quality was defined as smaller overall distances. A group's (pair, trio, quartet) distance is equal to the sum of all three-dimensional point' individual distances to the Euclidean center. Next, we defined a caliper (the maximum allowed distance) analogous to Rassen et al. (37) as follows:
where k is the number of individual distances, 1/2 since we look at the distance to the center, is the mean variance of the logit of the predicted probabilities, and corresponds to 0.2 times the standard deviation of the logit of the propensity score with two treatment groups.
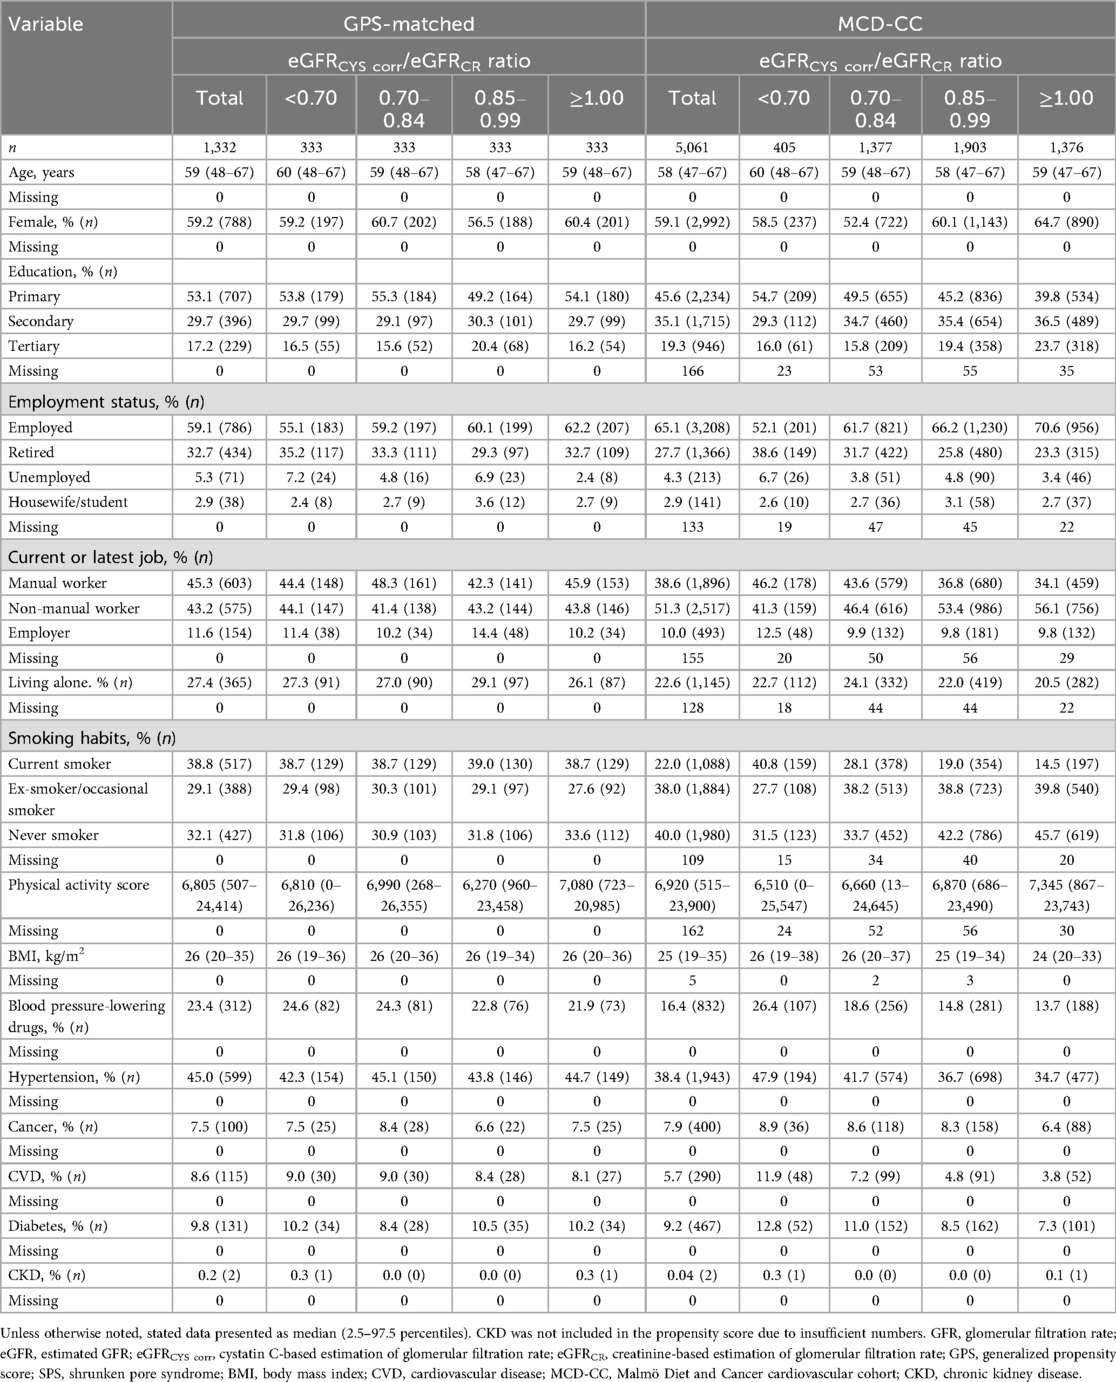
Table 1. Baseline characteristics stratified by the ratio of estimated GFR according to eGFRCYS corr and eGFRCR in the Malmö Diet and Cancer cardiovascular cohort and the GPS-matched subset. The lowest category (<0.70) indicates SPS.
Once the matched subset was found, it was essential to assess the similarity of baseline covariates (38). In this case, we calculated standardized mean differences (SMD) for all pair-wise combinations of the quartets, and in a conservative approach, the largest difference was selected. We aimed for a good match across all four groups, and a single large SMD would indicate an overall poorer match.
2.5.3 Cox regression
In the matched analysis, following the recommendations by Austin (38), we account for within-quartet correlation using Cox proportional hazard models with shared frailty to relate the eGFRCYS/eGFRCR ratio to the four different endpoints. An unmatched analysis using Cox proportional hazard models was employed, adjusting for all the covariates included in the GPS (see Table 1). As a sensitivity analysis, further adjustment for eGFRCYS was made to investigate whether the associations were entirely driven by the cystatin C level. The results were presented as hazard ratios (HR) with 95% confidence intervals (CI). Prevalent cases were excluded in analyses of incident outcomes.
3 Results
Baseline characteristics are presented in Table 1, stratified based on eGFRCYS/eGFRCR ratio intervals, for both the GPS-matched subset (n = 1,332 individuals in 333 quartets: 26% of the MDC-CC) and the full study cohort (n = 5,061). The prevalence of SPS was 8% in the complete study cohort at baseline. Notable imbalances in variables relating to socioeconomic status and smoking habits were observed. In the lowest eGFRCYS/eGFRCR ratio group, 46% were manual workers compared with 34% in the highest ratio group. Smoking prevalence in the lowest eGFRCYS/eGFRCR ratio group was 41% compared with 15% in the highest group. In contrast, the covariates of the GPS-matched subset were generally balanced. The proportion of current smokers was 39% in both the lowest and highest eGFRCYS/eGFRCR ratio group, whereas the proportion of manual workers was 44% and 46%, respectively. The balance achieved across the GFRCYS/eGFRCR ratio group can also be assessed with SMD (Supplementary Tables S1, S2). Here too, we see that the imbalance was substantially reduced or eliminated in the matched sample, while large imbalances were found for the individuals that we were not able to match.
Table 2 presents eGFR-related variables. The non-standardized cystatin C levels were lower [0.76 (0.55–1.11), median (2.5–97.5 percentiles)] compared with the corrected values [1.14 (0.80–1.73)] obtained from the correction based on linear regression models. The creatinine and eGFRCR levels were similar across the four groups, whereas cystatin C and eGFRCYS differed considerably.
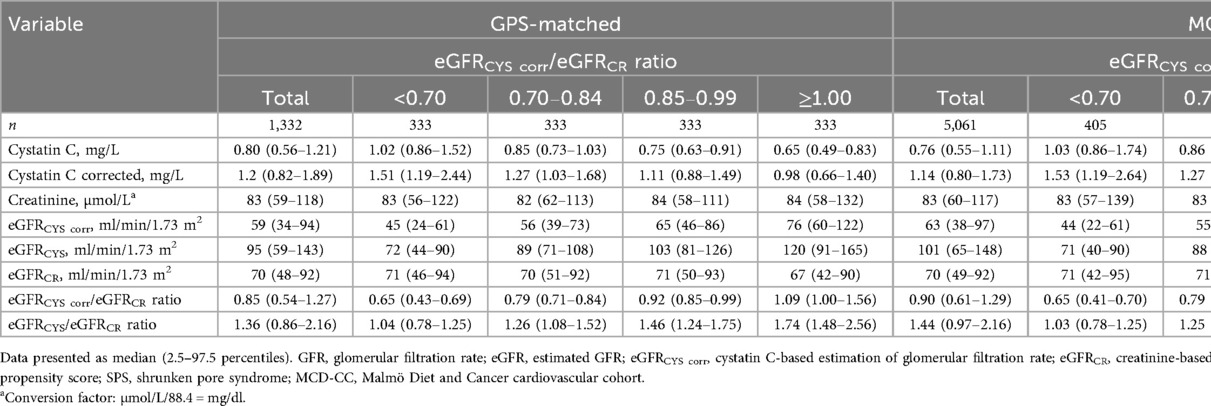
Table 2. Baseline biomarkers of renal function and estimated GFR stratified by the ratio of estimated GFR according to eGFRCYS corr and eGFRCR in the GPS-matched subset from the Malmö Diet and Cancer cardiovascular cohort and in the full Malmö Diet and Cancer cardiovascular cohort. The lowest category (<0.70) indicates SPS.
We investigated mortality, incident CVD, incident kidney disease, and incident diabetes for both the GPS-matched subset and the full study cohort (Table 3). In both samples, we observed a higher mortality among those with SPS. The incidence of kidney disease and diabetes was marginally higher for individuals with SPS compared with that of the three other groups, whereas the incidence of CVD was similar across the four groups.
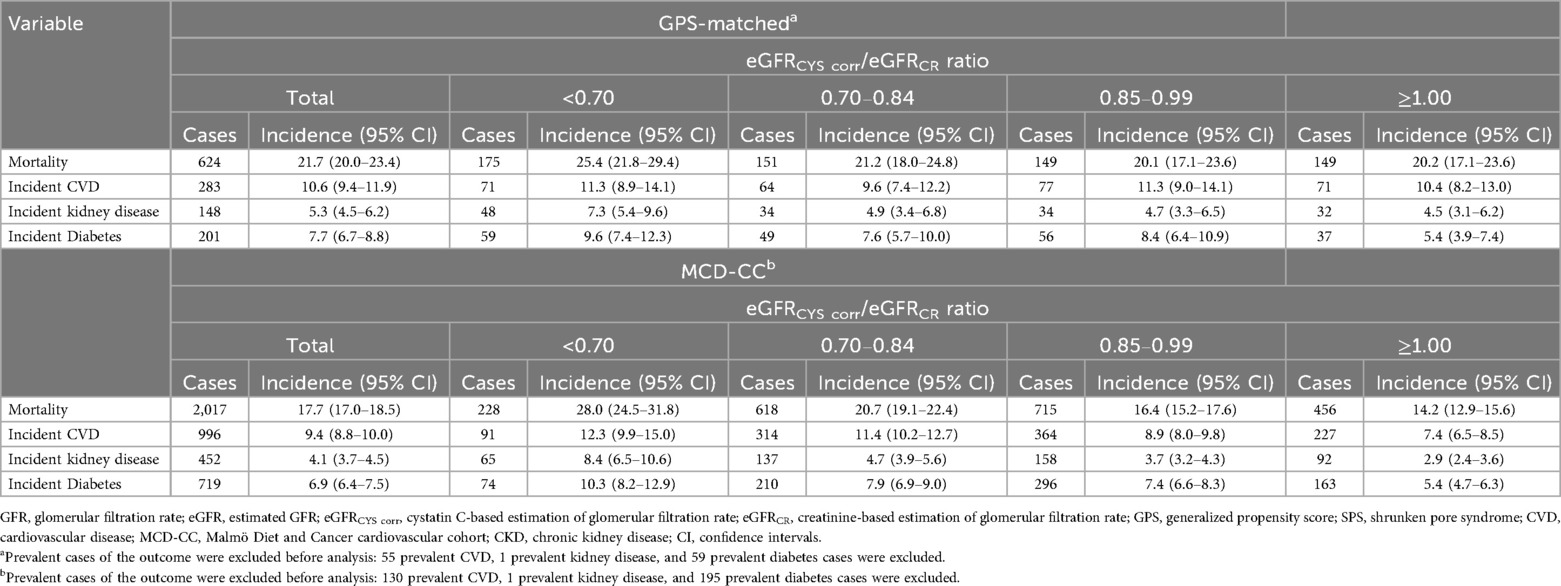
Table 3. Incidence rate per 1,000 person-years across the eGFRCYS corr/eGFRCR ratio groups in the GPS-matched subset from the Malmö Diet and Cancer cardiovascular cohort and in the full Malmö Diet and Cancer cardiovascular cohort, presented as cases and incidence (95% CI). The lowest category (<0.70) indicates SPS.
Next, we investigated the eGFRCYS/eGFRCR ratio for the four endpoints with Cox regression in both samples. In the matched subset, individuals with eGFRCYS/eGFRCR ratio <0.70 had higher mortality HR (95% CI), of 1.6 (1.3–2.0) compared with that of individuals with eGFRCYS/eGFRCR ratio ≥1.00 (Table 4 and Figure 1). For incident kidney disease, individuals with SPS had 2.1 (1.4–3.4) times higher incidence compared with that of individuals with eGFRCYS/eGFRCR ratio ≥1.00. No evident association between the eGFRCYS/eGFRCR ratio and incident CVD was found. An association with incident diabetes was suggested. The results in the full study cohort using adjusted Cox regression models (Table 4) mirror those seen for the matched subset, where SPS is significantly associated with three of the endpoints, i.e., mortality [HR 1.5 (1.2–1.8)], incident kidney disease [HR 2.1 (1.5–3.0)] and incident diabetes [HR 1.5 (1.0–2.0)], while for incident CVD, we find no evident association.

Table 4. Results from Cox regression modelsa relating eGFRCYS corr/eGFRCR ratio to all-cause mortality, incident CVD, incident kidney disease, and diabetes in the GPS-matched subset from the Malmö Diet and Cancer cardiovascular cohort and in the full Malmö Diet and Cancer cardiovascular cohort. The lowest category (<0.70) indicates SPS.
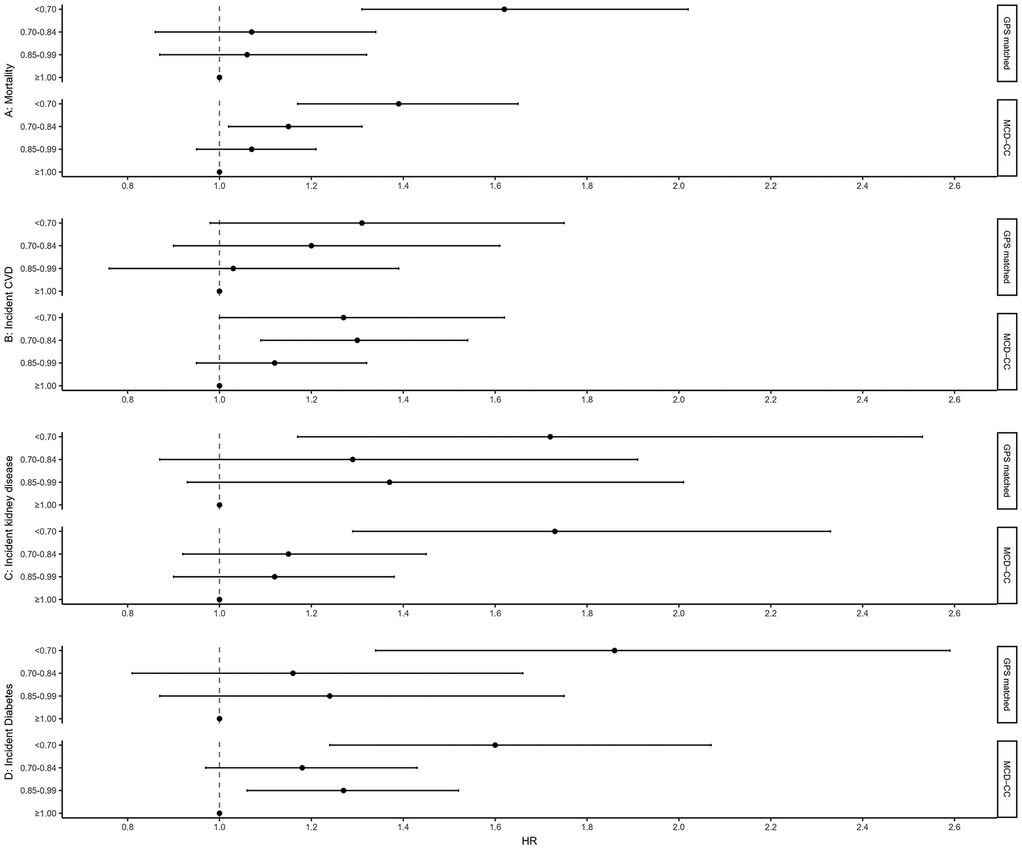
Figure 1. Forest plot of HR and 95% CI for results from Cox regression models relating eGFRCYS corr/eGFRCR ratio to all-cause mortality, incident CVD, incident kidney disease, and incident diabetes in the GPS-matched subset from the Malmö Diet and Cancer cardiovascular cohort and in the full Malmö Diet and Cancer cardiovascular cohort. The lowest category (<0.70) indicates SPS. GFR, glomerular filtration rate; eGFR, estimated GFR; eGFRCYS cor, cystatin C-based estimation of glomerular filtration rate; eGFRCR, creatinine-based estimation of glomerular filtration rate; GPS, generalized propensity score; SPS, shrunken pore syndrome; CVD, cardiovascular disease, MCD-CC, Malmö Diet and Cancer cardiovascular cohort; CKD, chronic kidney disease; HR, hazard ratio; CI, confidence intervals.
In the sensitivity analysis, we made further adjustments to the Cox regression models by adding eGFRCYS. The association for mortality holds, and individuals with eGFRCYS/eGFRCR ratio <0.70 exhibited an increased death rate compared with the reference group [1.4 (1.0–1.9), Table 5]. For incident kidney disease and for incident CVD, we found no evident association. An association with incident diabetes was suggested (Table 5); however, few individuals existed in the reference group for both the eGFRCYS/eGFRCR ratio and eGFRCYS, making the results statistically uncertain.
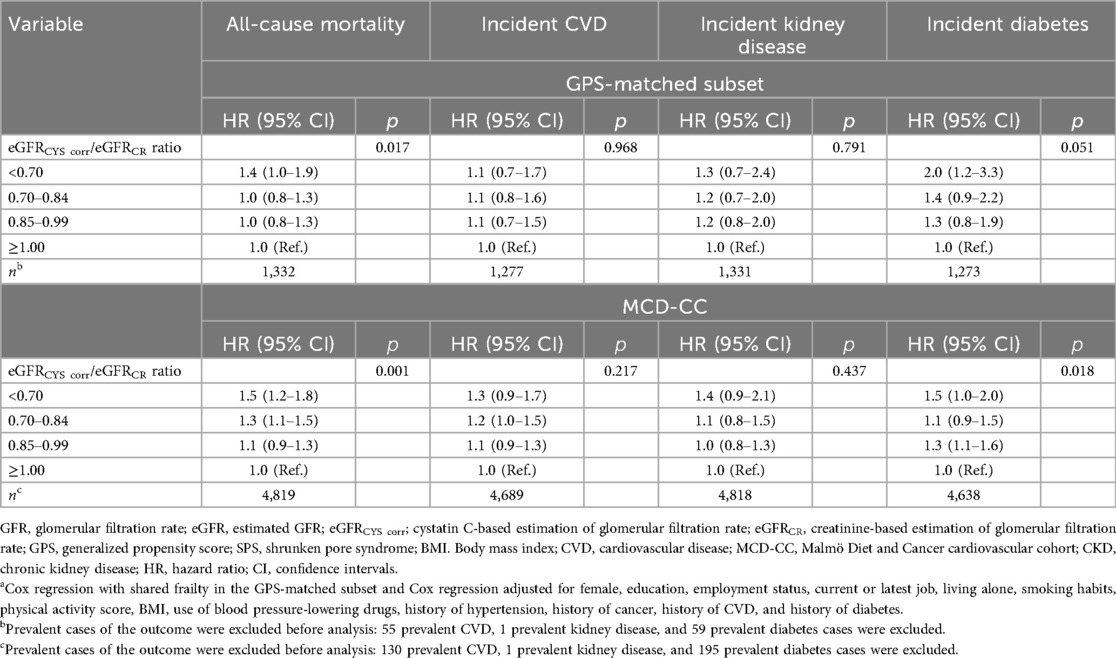
Table 5. Results from sensitivity analysis using Cox regression modelsa relating eGFRCYS corr/eGFRCR ratio to all-cause mortality, incident CVD, incident kidney disease, and diabetes in the GPS-matched subset form Malmö Diet and Cancer cardiovascular cohort and in the full Malmö Diet and Cancer cardiovascular cohort adjusting for eGFRCYS corr. The lowest category (<0.70) indicates SPS.
Additionally, we also investigated causes of death and how these were distributed across the eGFRCYS/eGFRCR ratio groups (Supplementary Table S3). In both the study cohort and the GPS-matched subsample, causes of death were evenly distributed across the eGFRCYS/eGFRCR ratio groups.
4 Discussion
The prevalence of SPS was 8% in this large population-based cohort of middle-aged individuals. Using a well-characterized population-based cohort with register linkage to national registers, we found that healthy middle-aged individuals with SPS had higher all-cause mortality than individuals without SPS. This association remained after accounting for eGFRCYS, suggesting that the effect of SPS on mortality was not driven by GFR or by cystatin C levels per se. The association of SPS with a rise in mortality was shown in several studies in different patient cohorts (4, 7–10, 12, 13, 16, 18, 19) and seen in other cohorts of healthy individuals (24, 25). SPS's role in increased mortality is debated with one hypothesis being that the increased mortality in SPS is due to lower kidney function shown by the higher cystatin C levels. In our study, the association between SPS and mortality remained significant in both matched and unmatched groups even after adjustment for eGFRCYS, which was confirmed in two other studies (9, 10).
The observed association between SPS and kidney disease was expected since cystatin C is a sensitive marker for kidney function. When adjusting for eGFRCYS, the association between SPS and incident kidney disease was no longer apparent, suggesting that this association seems to stem from low eGFRCYS rather than eGFRCYS/eGFRCR ratio.
The suggested association of SPS with incident diabetes was unexpected. The individuals with SPS and those without had the same BMI in both matched and unmatched datasets. However, adjustment for eGFRCYS did not affect the association between SPS and diabetes, keeping in mind that due to a limited number of individuals, the results are statistically uncertain and should be interpreted with caution. A reversed association between the eGFRCYS/eGFRCR ratio and diabetes has been suggested (12, 17), explained by thickening of the glomerular basal membrane, and would suggest a higher prevalence of SPS among diabetes patients; however, we did not observe this in our study.
A major strength of our study is the use of propensity score matching, a method that attempts to reduce the bias due to confounding variables, meaning that, after matching on the propensity score, we obtain quartets of matched individuals that are similar across all these variables. Thus, our effect estimates in the matched cohort are likely to have lower bias compared with those obtained from just adjusting for confounders in the unmatched cohort. However, a limitation of the propensity score matching is that the number of observations is reduced, since not all individuals find a match, and thus, statistical precision is lowered. Nevertheless, the results seen in the matched subset mirror those seen in the unmatched one with more observations.
Cystatin C was measured before the introduction of the world calibrator in 2010 and was not standardized; however, we used reference material as a way of correcting the cystatin C levels. The cystatin C levels differed in the groups with different eGFRCYS/eGFRCR ratio but when adjusted for this difference, SPS was still significantly associated with mortality.
As a limitation of this study, it is worth noting that neither of the two types of analyses presented is shielded from the effects of unmeasured confounding, and thus bias from unmeasured variables cannot be ruled out. One example of unmeasured confounding that may bias the results is that we did not have data on albuminuria levels. Albuminuria is both a strong marker of mortality and an established risk factor for renal and cardiovascular events; thus, the inclusion of albuminuria in the GPS could potentially have influenced the findings of this study.
5 Conclusion
Among healthy middle-aged individuals, 8% had SPS in the study cohort. All-cause mortality was markedly higher for individuals with SPS compared with those without SPS. Other studies are needed to investigate the pathophysiology behind SPS and the mechanism behind the association between SPS and mortality.
Data availability statement
The data analyzed in this study are subject to the following licenses/restrictions: The dataset from the Malmö cohorts (39) supporting the conclusions of this article was used under a license and is not available as an open source. Please visit their website for more information. Requests to access these datasets should be directed to https://www.malmo-kohorter.lu.se/malmo-cohorts.
Ethics statement
The studies involving humans were approved by the Ethics Review Board in Lund, Sweden. The studies were conducted in accordance with the local legislation and institutional requirements. The participants provided their written informed consent to participate in this study.
Author contributions
AÅ: Investigation, Conceptualization, Writing – review & editing, Formal analysis, Writing – original draft, Visualization, Methodology. LX: Writing – review & editing, Writing – original draft, Investigation. AL-C: Writing – original draft, Writing – review & editing, Investigation. AG: Writing – review & editing, Investigation, Writing – original draft. AL: Writing – review & editing, Investigation, Writing – original draft. AJ: Writing – original draft, Writing – review & editing, Investigation. MM: Writing – review & editing, Writing – original draft, Investigation. AC: Investigation, Writing – review & editing, Supervision, Writing – original draft, Conceptualization. JB: Writing – original draft, Investigation, Writing – review & editing, Supervision, Conceptualization.
Funding
The author(s) declare that financial support was received for the research and/or publication of this article. MM was supported by grants from the Medical Faculty of Lund University Skåne University Hospital, the Crafoord Foundation, the Region Skåne, the Research Funds of Region Skåne, and the Swedish Heart and Lung foundation (2021-0354), the Swedish Research Council (2022-00973), Swedish state under the agreement between the Swedish government and the county councils (the ALF agreement), and the Wallenberg Center for Molecular Medicine, Lund University. JB and AÅ were supported by a grant from the Swedish Research Council (2019-00198). AC was funded by grants from the Medical Faculty of Lund University Skåne University Hospital, the Region Skåne, the Research Funds of Region Skåne, the Swedish Kidney Foundation, the Fulbright Commission, and the Skåne University Hospital Research Fund. AL-C and AL were financed by grants from the Swedish state under the agreement between the Swedish government and the county councils (the ALF agreement).
Acknowledgments
On behalf of the European Kidney Function Consortium (EKFC), the authors acknowledge the support of the European Renal Association (ERA).
Conflict of interest
The authors declare that the research was conducted in the absence of any commercial or financial relationships that could be construed as a potential conflict of interest.
Generative AI statement
The author(s) declare that no Generative AI was used in the creation of this manuscript.
Any alternative text (alt text) provided alongside figures in this article has been generated by Frontiers with the support of artificial intelligence, and reasonable efforts have been made to ensure accuracy, including review by the authors wherever possible. If you identify any issues, please contact us.
Publisher's note
All claims expressed in this article are solely those of the authors and do not necessarily represent those of their affiliated organizations, or those of the publisher, the editors and the reviewers. Any product that may be evaluated in this article, or claim that may be made by its manufacturer, is not guaranteed or endorsed by the publisher.
Supplementary material
The Supplementary Material for this article can be found online at: https://www.frontiersin.org/articles/10.3389/fepid.2025.1661167/full#supplementary-material
References
1. Stevens LA, Levey AS. Measured GFR as a confirmatory test for estimated GFR. J Am Soc Nephrol. (2009) 20(11):2305–13. doi: 10.1681/ASN.2009020171
2. Kidney Disease Improve Global Initiative (KDIGO). Global science. Local change (2016). Available online at: https://kdigo.org/ (Accessed June 21, 2024).
3. Grubb A, Lindström V, Jonsson M, Bäck S-E, Åhlund T, Rippe B, et al. Reduction in glomerular pore size is not restricted to pregnant women. Evidence for a new syndrome: ‘Shrunken pore syndrome’. Scand J Clin Lab Invest. (2015) 75(4):333–40. doi: 10.3109/00365513.2015.1025427
4. Lüders F, Meyborg M, Malyar N, Reinecke H. The preinterventional cystatin-creatinine-ratio: a prognostic marker for contrast medium-induced acute kidney injury and long-term all-cause mortality. Nephron. (2015) 131(1):59–65. doi: 10.1159/000438755
5. Grubb A. Shrunken pore syndrome—a common kidney disorder with high mortality. Diagnosis, prevalence, pathophysiology and treatment options. Clin Biochem. (2020) 83:12–20. doi: 10.1016/j.clinbiochem.2020.06.002
6. Grubb A. Glomerular filtration and shrunken pore syndrome in children and adults. Acta Paediatr. (2021) 110(9):2503–8. doi: 10.1111/apa.15846
7. Purde M-T, Nock S, Risch L, Medina Escobar P, Grebhardt C, Nydegger UE, et al. Ratio of cystatin C and creatinine-based estimates of the glomerular filtration rate predicts mortality in healthy seniors independent of kidney function. Scand J Clin Lab Invest. (2016) 76(4):341–3. doi: 10.3109/00365513.2016.1149882
8. Herou E, Dardashti A, Nozohoor S, Zindovic I, Ederoth P, Grubb A, et al. The mortality increase in cardiac surgery patients associated with shrunken pore syndrome correlates with the eGFRcystatin C/eGFRcreatinine-ratio. Scand J Clin Lab Invest. (2019) 79(3):167–73. doi: 10.1080/00365513.2019.1576101
9. Xhakollari L, Grubb A, Jujic A, Bachus E, Nilsson PM, Leosdottir M, et al. The Shrunken pore syndrome is associated with poor prognosis and lower quality of life in heart failure patients: the HARVEST-Malmö study. ESC Heart Fail. (2021) 8(5):3577–86. doi: 10.1002/ehf2.13485
10. Åkesson A, Lindström V, Nyman U, Jonsson M, Abrahamson M, Christensson A, et al. Shrunken pore syndrome and mortality: a cohort study of patients with measured GFR and known comorbidities. Scand J Clin Lab Invest. (2020) 80(5):412–22. doi: 10.1080/00365513.2020.1759139
11. Almén MS, Björk J, Nyman U, Lindström V, Jonsson M, Abrahamson M, et al. Shrunken pore syndrome is associated with increased levels of atherosclerosis-promoting proteins. Kidney Int Rep. (2019) 4(1):67–79. doi: 10.1016/j.ekir.2018.09.002
12. Malmgren L, Öberg C, den Bakker E, Leion F, Siódmiak J, Åkesson A, et al. The complexity of kidney disease and diagnosing it—cystatin C, selective glomerular hypofiltration syndromes and proteome regulation. J Intern Med. (2023) 293(3):293–308. doi: 10.1111/joim.13589
13. Dardashti A, Nozohoor S, Grubb A, Bjursten H. Shrunken pore syndrome is associated with a sharp rise in mortality in patients undergoing elective coronary artery bypass grafting. Scand J Clin Lab Invest. (2016) 76(1):74–81. doi: 10.3109/00365513.2015.1099724
14. Grubb AO, Magnusson M, Christensson A. Etiologic and diagnostic implications of morbidity and mortality associations when cystatin C-based estimated GFR is lower than creatinine-based estimated GFR. Am J Kidney Dis. (2023) 82(5):509–11. doi: 10.1053/j.ajkd.2023.08.001
15. Strevens H, Wide-Swensson D, Torffvit O, Grubb A. Serum cystatin C for assessment of glomerular filtration rate in pregnant and non-pregnant women. Indications of altered filtration process in pregnancy. Scand J Clin Lab Invest. (2002) 62(2):141–7. doi: 10.1080/003655102753611771
16. Quiroga B, Ortiz A, Díez J. Selective glomerular hypofiltration syndrome. Nephrol Dial Transplant. (2024) 39(1):10–7. doi: 10.1093/ndt/gfad145
17. Öberg CM, Lindström M, Grubb A, Christensson A. Potential relationship between eGFRcystatin C/eGFRcreatinine-ratio and glomerular basement membrane thickness in diabetic kidney disease. Physiol Rep. (2021) 9(13):e14939. doi: 10.14814/phy2.14939
18. Ljungberg J, Johansson B, Bergdahl IA, Holmgren A, Näslund U, Hultdin J, et al. Mild impairment of renal function (shrunken pore syndrome) is associated with increased risk for future surgery for aortic stenosis. Scand J Clin Lab Invest. (2019) 79(7):524–30. doi: 10.1080/00365513.2019.1664761
19. Malmgren L, McGuigan FE, Christensson A, Akesson KE. Impaired selective renal filtration captured by eGFRcysC/eGFRcrea ratio is associated with mortality in a population based cohort of older women. Sci Rep. (2022) 12(1):1273. doi: 10.1038/s41598-022-05320-w
20. Potok OA, Ix JH, Shlipak MG, Katz R, Hawfield AT, Rocco MV, et al. The difference between cystatin C- and creatinine-based estimated GFR and associations with frailty and adverse outcomes: a cohort analysis of the systolic blood pressure intervention trial (SPRINT). Am J Kidney Dis. (2020) 76(6):765–74. doi: 10.1053/j.ajkd.2020.05.017
21. Potok OA, Katz R, Bansal N, Siscovick DS, Odden MC, Ix JH, et al. The difference between cystatin C- and creatinine-based estimated GFR and incident frailty: an analysis of the cardiovascular health study (CHS). Am J Kidney Dis. (2020) 76(6):896–8. doi: 10.1053/j.ajkd.2020.05.018
22. Chen DC, Shlipak MG, Scherzer R, Bauer SR, Potok OA, Rifkin DE, et al. Association of intraindividual difference in estimated glomerular filtration rate by creatinine vs cystatin C and end-stage kidney disease and mortality. JAMA Network Open. (2022) 5(2):e2148940. doi: 10.1001/jamanetworkopen.2021.48940
23. Åkesson A, Malmgren L, Leion F, Nyman U, Christensson A, Björk J, et al. Different ways of diagnosing selective glomerular hypofiltration syndromes such as shrunken pore syndrome and the associated increase in mortality. J Intern Med. (2025) 297(1):79–92. doi: 10.1111/joim.20035
24. Katz-Agranov N, Rieu-Werden ML, Thacker A, Lykken JM, Sise ME, Shah SJ. Large discordance between creatinine-based and cystatin C-based eGFRs is associated with falls, hospitalizations, and death in older adults. Clin J Am Soc Nephrol. (2024) 19(10):1275–83. doi: 10.2215/CJN.0000000000000523
25. Farrington DK, Surapaneni A, Matsushita K, Seegmiller JC, Coresh J, Grams ME. Discrepancies between cystatin C-based and creatinine-based eGFR. Clin J Am Soc Nephrol. (2023) 18(9):1143–52. doi: 10.2215/CJN.0000000000000217
26. Berglund G, Elmståhl S, Janzon L, Larsson S. Design and feasibility. J Intern Med. (1993) 233(1):45–51. doi: 10.1111/j.1365-2796.1993.tb00647.x
27. Vandenbrouckel JP, von Elm E, Altman DG, Gotzsche PC, Mulrow CD, Pocock SJ, et al. Strengthening the reporting of observational studies in epidemiology (STROBE): explanation and elaboration. PLoS Med. (2007) 4(10):1628–55. doi: 10.1371/journal.pmed.0040297
28. Hedblad B, Nilsson P, Janzon L, Berglund G. Relation between insulin resistance and carotid intima-media thickness and stenosis in non-diabetic subjects. Results from a cross-sectional study in Malmö, Sweden. Diabetic Med. (2000) 17(4):299–307. doi: 10.1046/j.1464-5491.2000.00280.x
29. Grubb A, Blirup-Jensen S, Lindström V, Schmidt C, Althaus H, Zegers I, et al. First certified reference material for cystatin C in human serum ERM-DA471/IFCC. Clin Chem Lab Med. (2010) 48(11):1619–21. doi: 10.1515/CCLM.2010.318
30. Svensson-Färbom P, Ohlson Andersson M, Almgren P, Hedblad B, Engström G, Persson M, et al. Cystatin C identifies cardiovascular risk better than creatinine-based estimates of glomerular filtration in middle-aged individuals without a history of cardiovascular disease. J Intern Med. (2014) 275(5):506–21. doi: 10.1111/joim.12169
31. Grubb A, Horio M, Hansson L-O, Björk J, Nyman U, Flodin M, et al. Generation of a new cystatin C-based estimating equation for glomerular filtration rate by use of 7 assays standardized to the international calibrator. Clin Chem. (2014) 60(7):974–86. doi: 10.1373/clinchem.2013.220707
32. Nyman U, Grubb A, Larsson A, Hansson L-O, Flodin M, Nordin G, et al. The revised Lund-Malmö GFR estimating equation outperforms MDRD and CKD-EPI across GFR, age and BMI intervals in a large Swedish population. Clin Chem Lab Med. (2014) 52(6):815–24. doi: 10.1515/cclm-2013-0741
33. StataCorp. Stata Statistical Software: Release 16. College Station, TX, United States: StataCorp LLC (2019).
34. R Core Development Team. R: A Language and Environment for Statistical Computing. Vienna, Austria: R Foundation for Statistical Computing (2021).
35. Rosenbaum PR, Rubin DB. The central role of the propensity score in observational studies for causal effects. Biometrika. (1983) 70(1):41–55. doi: 10.1093/biomet/70.1.41
36. Imai K, Van Dyk DA. Causal inference with general treatment regimes: generalizing the propensity score. J Am Stat Assoc. (2004) 99(467):854–66. doi: 10.1198/016214504000001187
37. Rassen JA, Shelat AA, Franklin JM, Glynn RJ, Solomon DH, Schneeweiss S. Matching by propensity score in cohort studies with three treatment groups. Epidemiology. (2013) 24:401–9. doi: 10.1097/EDE.0b013e318289dedf
38. Austin PC. The use of propensity score methods with survival or time-to-event outcomes: reporting measures of effect similar to those used in randomized experiments. Stat Med. (2014) 33(7):1242–58. doi: 10.1002/sim.5984
39. Lund University. The Malmö cohorts 2021 (2021). Available online at: https://www.malmo-kohorter.lu.se/malmo-cohorts (Accessed October 14, 2024).
Keywords: population-based cohort, mortality, refined confounding adjustment, creatinine, cystatin C, eGFR
Citation: Åkesson A, Xhakollari L, Laučytė-Cibulskiene A, Grubb A, Larsson A, Jujic A, Magnusson M, Christensson A and Björk J (2025) Shrunken pore syndrome in relation to morbidity and mortality in the population-based Malmö Diet and Cancer cohort: a generalized propensity score approach. Front. Epidemiol. 5:1661167. doi: 10.3389/fepid.2025.1661167
Received: 7 July 2025; Accepted: 12 September 2025;
Published: 30 September 2025.
Edited by:
Ronny Westerman, Bundesinstitut für Bevölkerungsforschung, GermanyReviewed by:
Antonio Marcio Teodoro Cordeiro Silva, Pontifical Catholic University of Goias, BrazilDiana Morales Koelliker, Universidad Popular Autónoma del Estado de Puebla, Mexico
Copyright: © 2025 Åkesson, Xhakollari, Laučytė-Cibulskiene, Grubb, Larsson, Jujic, Magnusson, Christensson and Björk. This is an open-access article distributed under the terms of the Creative Commons Attribution License (CC BY). The use, distribution or reproduction in other forums is permitted, provided the original author(s) and the copyright owner(s) are credited and that the original publication in this journal is cited, in accordance with accepted academic practice. No use, distribution or reproduction is permitted which does not comply with these terms.
*Correspondence: Anna Åkesson, YW5uYS5ha2Vzc29uLjcxMTJAbWVkLmx1LnNl
†These authors contributed equally to this work and share last authorship