 Don C. Bragg
- Southern Research Station, USDA Forest Service, Monticello, AR, United States
A plus-tree progeny test of full- and half-sib “superior” loblolly pine (Pinus taeda) was installed in 1969 on the Crossett Experimental Forest (CEF) to consider the performance of 28 improved families with unimproved planting stock from the CEF (family W29). Performance was evaluated using data from young (3-year-old; early 1970s), maturing (25-year-old; 1994), and mature (48-year-old; 2017) trees. With the exception of a single improved family, early survival was high (>80%), with most families exceeding 90%. Three years post-planting, fusiform rust infection rates were also low, with most families having less than 1% of seedlings infected. At this early stage, the unimproved CEF family W29 only slightly underperformed the best full- and half-sib superior families. By 1994, W29 had slightly higher than average merchantable volume. This trend continued for W29 when remeasured in 2017, with the average merchantable volume yield for W29 statistically similar to the most productive families. This study found only limited volume performance gains from crossing plus-trees. However, it was important to note that several of the best height growth-performing families in 1972 were not the highest merchantable volume producers at 25 or 48 years, and some of the worst early performers moved into the upper tiers by the later remeasurements. These outcomes suggest that depending solely on early height performance to select families for long-term (>50 year) volume (especially if adjusted for wood density) or biomass yields may not be the best approach for forest managers seeking to increase carbon sequestration.
Introduction
Forest genetics and tree improvement programs have greatly benefited forestry in the southern United States (Borders and Bailey, 2001; Allen et al., 2005; White et al., 2014; Wheeler et al., 2015). Driven by the desire to increase productivity, disease resistance, seedling survival, and shorten harvest rotations, decades of increasingly sophisticated efforts have resulted in extensive plantations of improved loblolly pine (Pinus taeda), helping the South to become the most productive timber region in the world (Allen et al., 2005). This work progressed rapidly as researchers and managers overcame specific challenges. For example, by identifying rust-resistant loblolly pine families and selectively breeding them, tree improvement efforts greatly decreased the occurrence and economic impact of fusiform rust (Cronartium quercuum f. sp. fusiforme) in just a couple of decades (Randolph et al., 2015; Walker and McKeand, 2018). Further successes in southern pines (including hybrids) have likewise improved wood volume production, bole straightness, branching patterns, and other targeted attributes (e.g., Dorman, 1976; McKeand et al., 2003; Belaber et al., 2018; Lauer et al., 2021).
The most improved pines are generally deployed under the most intensive management, which focus on short (less than 25 year) rotations to effectively recoup investments in seedlings, site preparation, competition control, fertilization, etc. Further study of loblolly pine has led to new approaches to the propagation of certain preferred traits using somatic embryogenesis (Gupta and Durzan, 1987), genomic selection (e.g., Resende et al., 2012; Isik, 2014), and new analysis approaches based on mate selection algorithms derived from other breeding programs (Isik and McKeand, 2019). The recent sequencing of the loblolly genome (Zimin et al., 2014) also offers promise for additional gains. However, these successes do not mean that there have not been failures, or at least undesired outcomes. As examples, there are often negative correlations between families chosen for fast volume growth and other desired wood quality properties such as high stiffness and strength (e.g., Martin et al., 2001; Apiolaza, 2008; Santos et al., 2021). Even the successful deployment of improved, short-rotation southern pine plantations has come with significant and often negative social and environmental consequences following the widespread conversion of natural-origin pine, pine-hardwood, and hardwood forests (Wear and Greis, 2002, 2013; McGrath et al., 2004).
Traditionally, provenance and progeny tests are the mechanism of choice for determining the performance of different families, but there are only a few multidecadal tests in loblolly and shortleaf (Pinus echinata) pines and these rarely exceed 35 years (e.g., Wakeley and Bercaw, 1965; Wells and Rink, 1984; Rink and Wells, 1988; Buford, 1989; Schmidtling and Froehlich, 1993). Unlike efforts related to short-term wood volume production, the long-term performance of genetically improved loblolly pine is less certain (Allen et al., 2005) for ecosystem goods and services such as biomass production and carbon sequestration. However, sustaining progeny tests is particularly challenging, given their oft-limited scope (a few families tested with small sample sizes at a few locations), vulnerability to loss, and the resources needed to maintain such efforts. Major projects such as the large Southwide Pine Seed Source Study (SPSSS) (Wells and Wakeley, 1966) have demonstrated these challenges. For example, after the initial establishment challenges and drought losses of the SPSSS failed to derail this study, those pioneering southern pine progeny tests were followed without major incident to 25 years (Wells, 1983). However, in the next decade a series of disturbance events occurred that reduced this study to a handful of viable locations (Buford, 1989).
Furthermore, with many land managers seeking increasingly shorter pine plantation rotations, long-term progeny tests have not been considered useful or necessary, especially given the likelihood of new and even more improved families becoming more available. Conventional wisdom—supported by carefully targeted research—holds that the volume-based performance of loblolly pine families can usually be determined after a short amount of time (e.g., McKeand, 1988; Lowe and van Buijtenen, 1989; Isik and McKeand, 2019; Maynor et al., 2021), with early success being maintained through at least mid-rotation (Bridgwater and McKeand, 1997; McKeand, 1988; Raley et al., 2003; Farjat et al., 2017). A recent example of rapid evaluation of the progeny of cloned and half-sib loblolly pine genotypes is found in Shalizi et al. (2020), who made family choice recommendations after seedlings were only 4 years in the ground. If consistent and reliable, such early determinations can considerably speed up family deployment, especially if particularly poor performing genotypes (e.g., disease-susceptible families or low bole quality) are quickly recognized.
DNA marker-based technologies and analysis offer the promise of even faster genomic selections and more efficient tree breeding programs (Isik, 2014; Isik and McKeand, 2019). However, there are potential issues that may only be identified following extended observations of progeny tests. For instance, Bridgwater and McKeand (1997) suggested a “Type A” family, which grows poorly in early stages of a trial, only to be a good performer later in the rotation. One such example could be found in the grass stage of longleaf pine (Pinus palustris): Ford (2017) reported that early height measurements (at ages 3 and 7 years) were poor predictors of this species’ volume at 17 and 40 years. Martin et al. (2001) suggested the implications of families selected for high early performance measures that failed to meet expectations under longer rotations, especially if test conditions did not match field circumstances. Furthermore, some outputs (e.g., specialty products, such as poles or pilings, or maximizing carbon to be sequestered under contracts) may not be optimized by families selected for maximal early volume growth and short rotations. As an example, a growing body of evidence suggests significant carbon accumulation in older trees and stands that could alter strategies (much longer rotations) for using forests to sequester atmospheric carbon dioxide (e.g., Carey et al., 2001; Luyssaert et al., 2008; Stephenson et al., 2014; Sillett et al., 2019; Leverett et al., 2021).
Hence, when feasible, old progeny tests should be maintained and periodically remeasured to search for any interesting or unexpected results. This paper evaluates the data from a recently remeasured loblolly pine progeny test 48 years after it was planted on the USDA Forest Service’s (hereafter, USFS) Crossett Experimental Forest (CEF) in southern Arkansas. This progeny test was originally designed to consider the survival, fusiform resistance, and productivity differences between full- and half-sib superior pines identified across an industrial landowner in southern Arkansas and northern Louisiana, using seedlings from unimproved loblolly pine on the CEF as the standard for comparison. Although the original study has long been closed, this progeny test offers the opportunity to determine if the top performing families when young (age 3 years) remained the best choice decades later (at 25 and 48 years). Ultimately, results from such long-term progeny test observations may be adapted to improve management decisions for the extended (50+ year) rotations of loblolly pine required to support carbon markets and similar ecosystem services.
Materials and Methods
Site Description
While best known for silviculture of naturally regenerated southern pine, tree improvement and forest genetics studies were also conducted on the CEF from 1951 until 1975 (Bragg et al., 2016). In 1969, USFS Plant Geneticist Hoy Grigsby installed the final outplanting of an 8.1-ha superior pine progeny test in the eastern half of Compartment 3 on the CEF (Figure 1).1 This site, selected because its relatively level ground and soils (Bude and Providence silt loams, with a nominal loblolly pine site index of 26.0–27.5 m at 50 years; Gill et al., 1979), was considered representative of this part of the Upper West Gulf Coastal Plain. The existing pine-dominated forest was cleared and the site prepared prior to the first outplanting in February of 1966; competing vegetation was controlled prior to planting of seedlings each year until the final outplanting was installed in 1969.
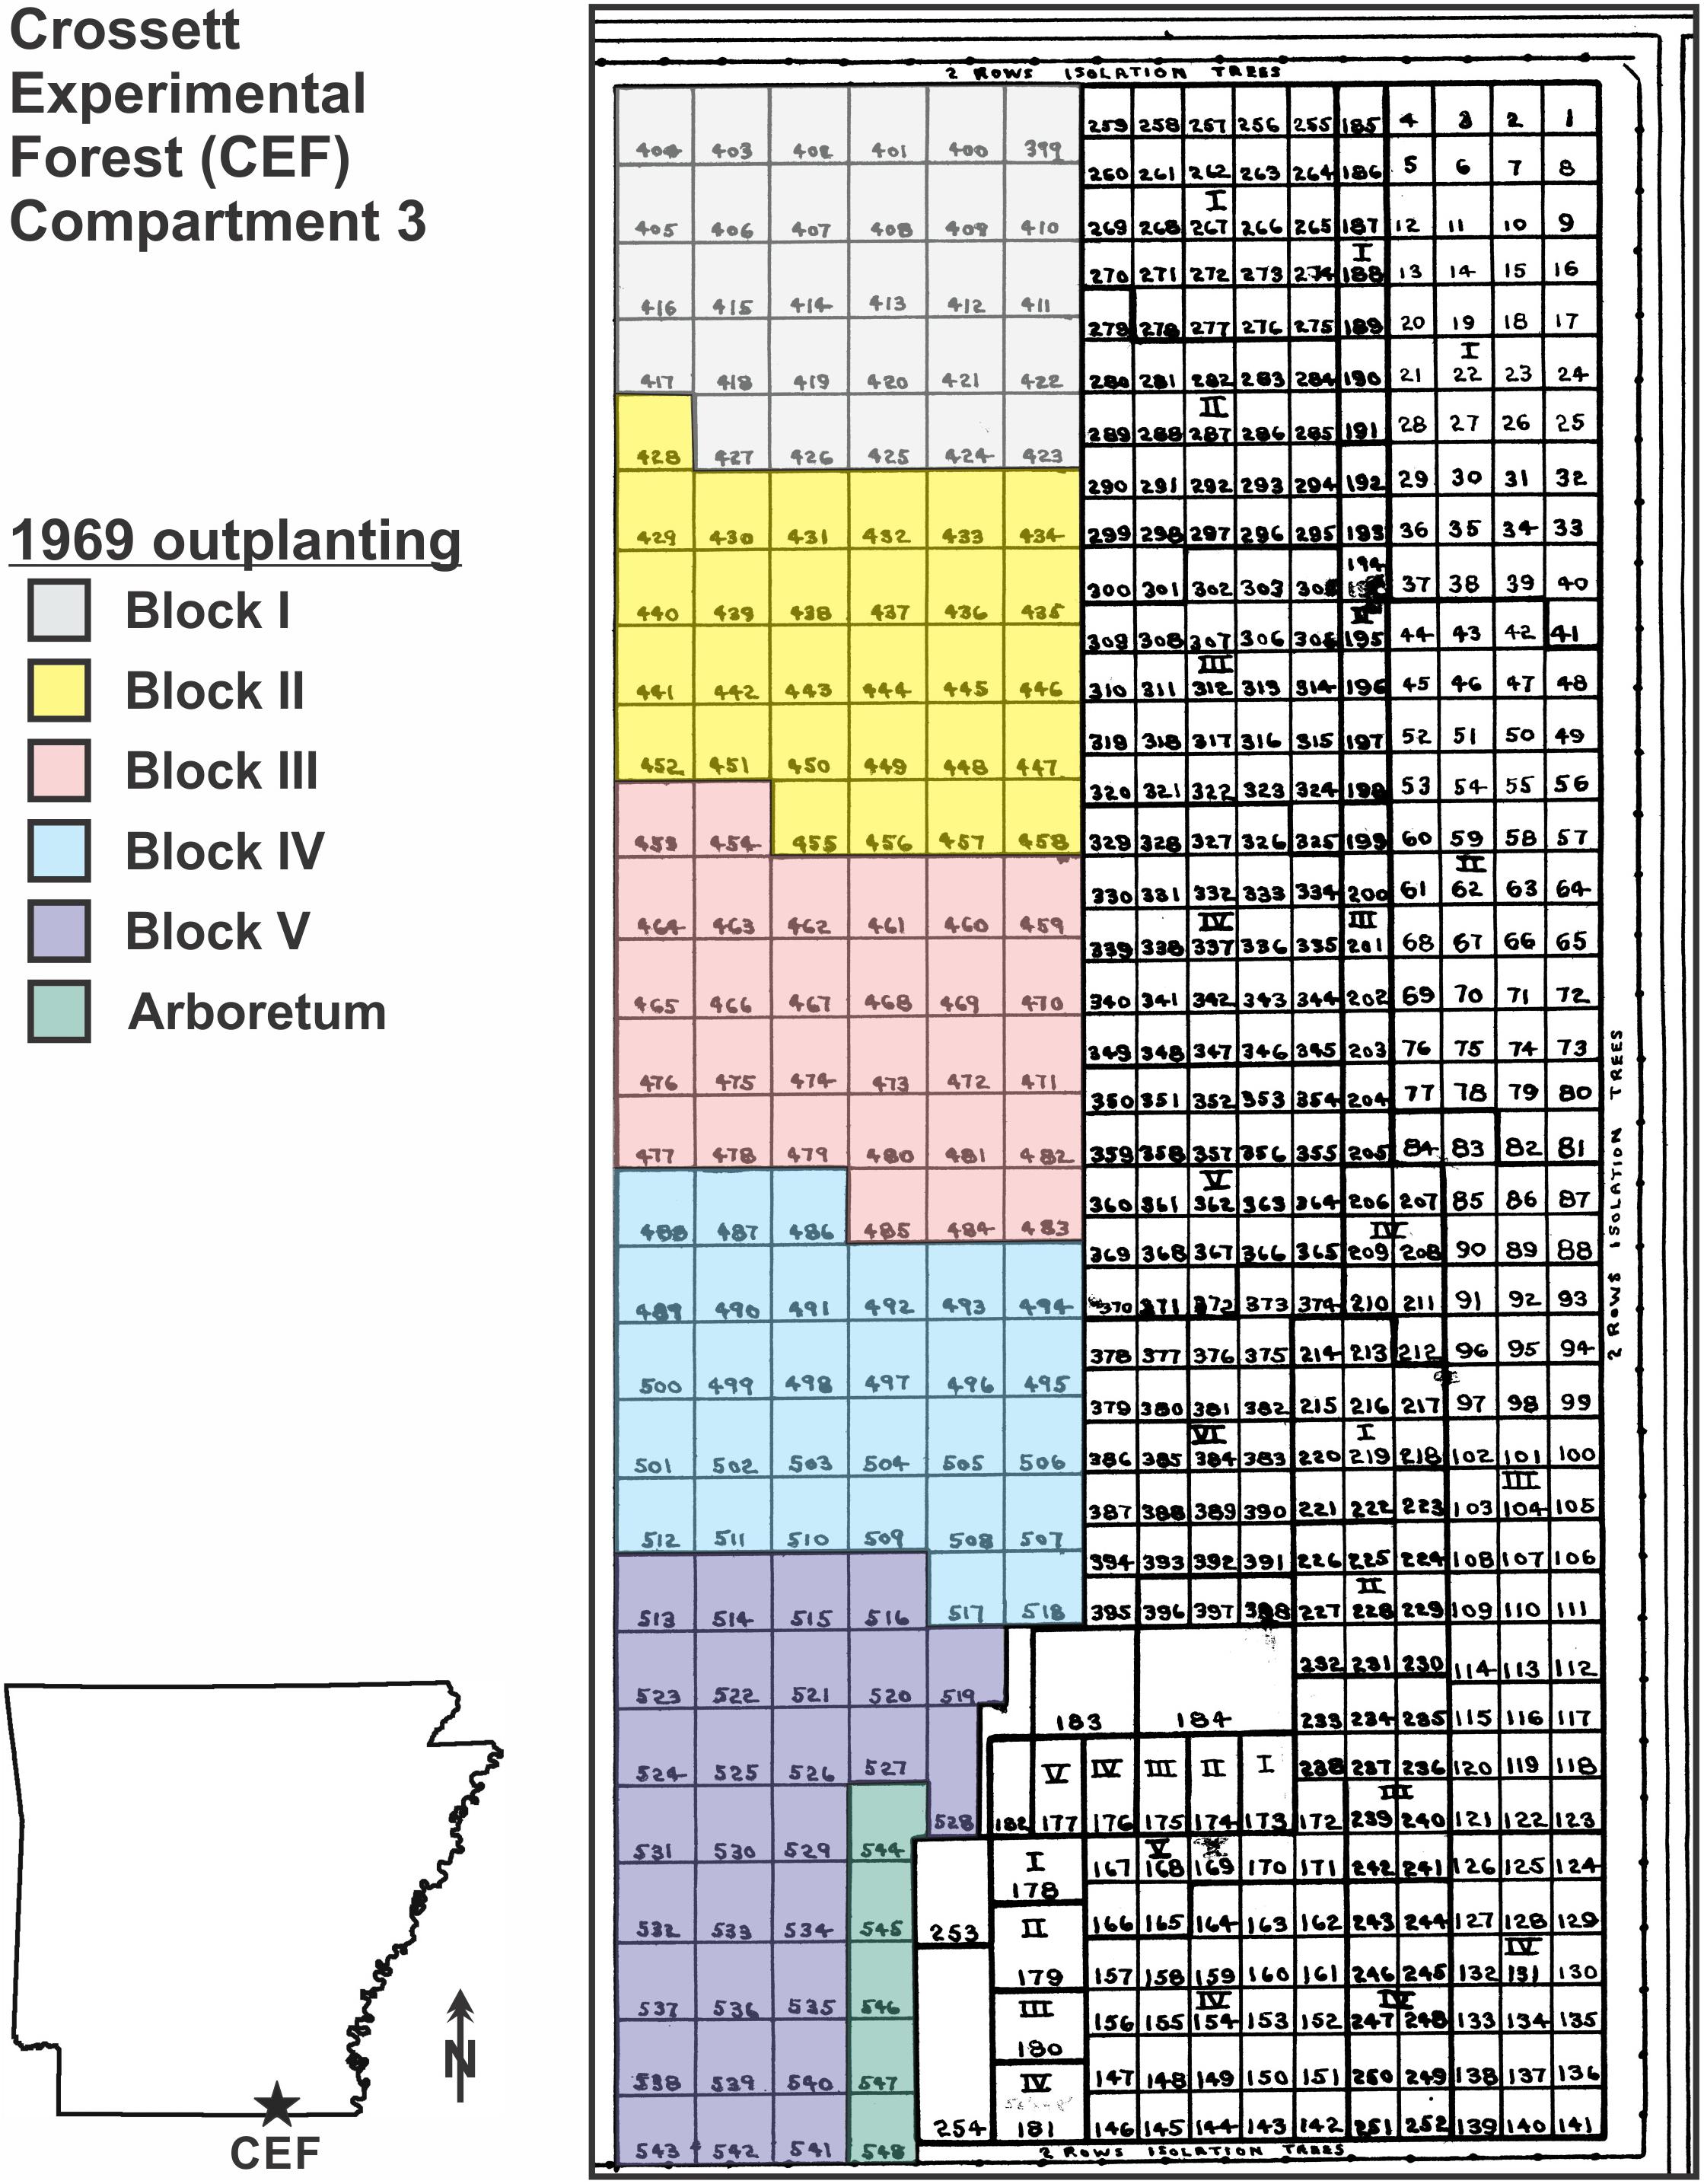
Figure 1. Map of the 8.1-ha superior pine progeny test outplanting in the eastern half of Compartment 3 on the Crossett Experimental Forest (CEF), southern Arkansas; the outplanting were established between 1966 and 1969 by Hoy Grigsby. The colored area on the west side is the 1969 outplanting; inset shows the layout of the 36-plot subsample of the 1969 outplanting sampled in January 2017 (48 years post-planting), with planting block and family code (see Table 1) indicated [for example, the Crossett woods-run pines (W29) in Block I were located in Plot 405].
Progeny Test Design, Implementation, and Measurement
Details on the 1969 outplanting are limited; most of the information on this superior pine progeny test came from a series of unpublished establishment and progress reports between 1967 and 1969 (Grigsby, 1969). Additional information on these progeny tests can also be gleaned from an unpublished closing report written by a later investigator, USFS Plant Geneticist Warren Nance (Nance, 1978). This outplanting (colored areas on Figure 1) included 29 families, 28 of which were produced by crossing superior pines (22 full-sibs and 6 half-sibs) and one which was an open-pollinated (using unimproved trees in natural-origin stands; hereafter, “woods-run”) CEF-origin loblolly pine family (Table 1). The families were bred from superior pines identified by trained foresters on Georgia-Pacific (GP) lands in southern Arkansas and northern Louisiana; the parent trees in the 1969 test all came from Ashley County, Arkansas (Grigsby, 1969). These superior pines were selected using multiple traits (see Table 1), not all of which focused on increasing volume. For instance, families were also chosen for bole straightness and minimal forking to help GP supply the world’s first southern pine plywood mills in Crossett and nearby Fordyce, Arkansas (Love, 1996).
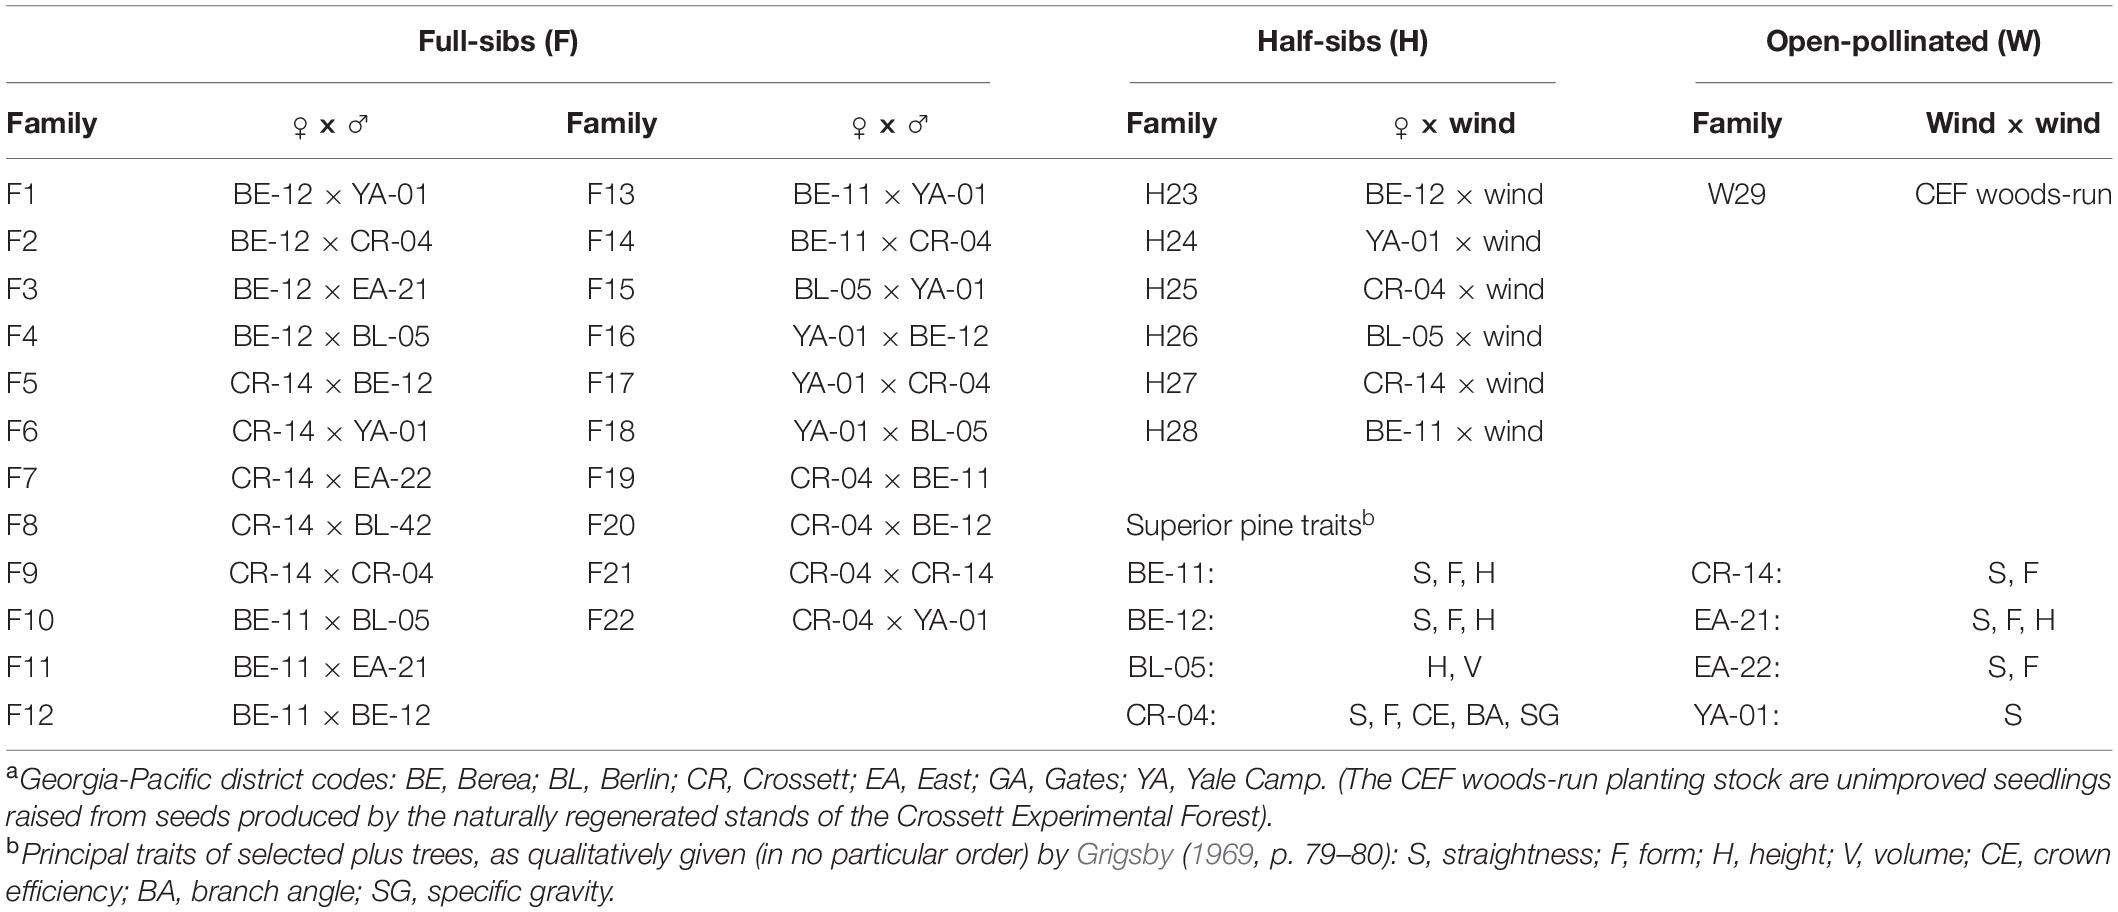
Table 1. Family labels by Georgia-Pacific district codesa and superior pine tree number for the families tested in the 1969 outplanting, Compartment 3, Crossett Experimental Forest.
The original intent of this progeny test was to determine the influence of superior pine family on various performance measures, including survival, vigor, growth, form, wood specific gravity, and fusiform rust susceptibility. Full- and half-sib families pollinated in seed orchards established on the CEF and nearby GP lands, and the resulting seeds were placed in cold storage at the CEF. All families were germinated and raised to 1-year-old at the CEF before being hand-planted as bare-root seedlings in Compartment 3 on 2.43-m by 2.43-m spacing in a series of replicated blocks (Grigsby, 1969). Installed in February 1969, this superior pine progeny tests using five blocks, each of which contained 29 14.63-m by 14.63-m plots with 36 planting points, for a total of 5,220 loblolly pine seedlings (Grigsby, 1969). An additional five slightly smaller plots (called “Arboretum” plots; see Figure 1) were planted in 1969 to fill in the last open space in this part of the Compartment 3; four of these plots and their 124 trees are included in this analysis.
According to his study plans, Grigsby intended to assess the 1969 progeny tests at the end of their first, third, fifth, and tenth years, with a final decision on the disposition of this study at the end of their fifteenth growing season (Grigsby, 1969). However, the retirement of Project Leader Russ Reynolds shortly after the installation of this superior pine progeny test soon led to the closing of the CEF, and Grigsby was reassigned to the genetics unit in Saucier, Mississippi (Bragg et al., 2016). The CEF archives do not have any year one measurements; Grigsby measured the study at the end of the third year, but then retired. Nance assumed responsibility for the open CEF genetics studies and completed the fifth-year measurement for the 1969 outplanting. Based on these results, Nance (1978) decided there was insufficient value to continue and formally closed the study.
When the CEF reopened in the late 1970s, its mission had shifted to developing low-cost, natural regeneration-based management options for small, non-industrial landowners, and none of the studies related to the forest improvement program were restarted. However, because of their investment in the effort and the utility of the information for their management purposes, GP staff continued to measure the progeny tests in Compartment 3 in the 1980s and 1990s (for this paper, only the 25-year remeasurement from February–March 1994 are used). The 1994 assessment included measurement of DBH (to the nearest 0.25 cm) and total tree height (to the nearest 3 cm) using unspecified tools and techniques (probably diameter tapes and clinometers for heights). During their long history, the progeny tests in Compartment 3 have been operationally thinned and salvaged several times; with a few exceptions, all remaining plots currently contain between 3 and 6 trees.
Recently, the development of genetic markers and other more sophisticated DNA-based analysis has rekindled agency interest in these old progeny tests. To determine what information may remain, we relocated and documented the progeny tests remaining on the CEF started in late 2016. The 1969 outplanting was chosen to be the basis for the initial effort because of its clear planting patterns and relative intactness. Plot corners were reestablished in the 1969 outplanting and all surviving loblolly pines were tagged, had their diameter at breast height (DBH, to the nearest 0.25 cm with a diameter tape) and total tree height (to the nearest 15 cm using a TruPulse® 200X laser hypsometer and the sine method, Bragg et al., 2011) measured between January and April 2017. Any obvious signs of damage (e.g., from ice storms) or disease (e.g., fusiform cankers) or competing hardwood or potentially influential site factors (e.g., tree growing on a prairie mound) were also noted.
Data Analysis
In an unpublished table in the CEF study files, Grigsby reported family-level summaries by block, from which Bragg (2018) produced means and standard deviations. Rather than using these same summaries for this paper, the original data sheets were relocated from the late February-early March 1972 field measurements and used in a new analysis of this data on survivorship and survivor height. In 1969, there were 5,344 loblolly pines planted (5,220 seedlings in the official design and 124 from four Arboretum plots). Overall survivorship (in percent) was determined in 1972 by those planted pines still recorded as alive (versus dead or missing). Total tree height was directly measured with a height pole to the nearest 3 cm for the 1972 survivors. Survivorship data (percentages) were arcsine transformed; both survivorship and total height data were compared for statistical significance (α = 0.05) using one-way analysis of variance (ANOVA) and Tukey’s honestly significant difference (HSD) test for unequal n for the means separation (Zar, 2010). Fusiform infection was not included in the 1972 data sheets for the 1969 outplanting (or the Arboretum plots), so it was not recalculated. Hence, to determine fusiform rust occurrence (in terms of percent of seedlings with signs of the disease), Grigsby’s original analysis was used, with block-level plot means were treated as replicates; since there were five blocks, n = 5 for each family; these represent an assessment of 4,814 loblolly pines that survived the first 3 years of this outplanting. Fusiform rates were also compared using one-way ANOVA and Tukey’s HSD for unequal n on arcsine transformed percentages.
While CEF management records are incomplete, Compartment 3 (including all or part of the progeny tests) were thinned in at least 1985, 1996, and 2002 using varying standards and objectives (Bragg, 2018). In addition to thinnings, these progeny tests were also periodically salvaged following other mortality events (e.g., lightning, wind, ice, insects) over the last four decades. Because they targeted damaged or diseased individuals, these thinnings and salvage removals prevent further assessments of survival and fusiform occurrence; hence, they were not compared for the 1994 and 2017 remeasurements. However, it was possible at these later rates to compare DBH and height, as well as merchantable inside-bark (wood) volume. Merchantable volume (V, converted from ft3 to m3) was calculated using a regional loblolly pine volume equation (Van Deusen et al., 1981):
where DBH and HT (total tree height) were originally in inches and feet, respectively, and R is a top-diameter conversion ratio (for trees of this size, assumed to equal 1.0). A coefficient of variation (CV) was also derived for all families (for height only in the 1972 measurements; DBH, total tree height, and merchantable volume for the 1994 and 2017 measurements). DBH, total tree height, and merchantable volume were compared for the 1994 and 2017 data sets using one-way ANOVA, with mean separation done using Tukey’s HSD test for unequal sample sizes (α = 0.05).
Because of the lack of long-term control over this single surviving outplanting and a desire to consider family performance as realized following 3, 25, and 48 years post-planting, more conventional heritability analyses were not attempted. Rather, changes in top performers over time were evaluated, particularly in contrast with the local woods-run family, with an emphasis on the implications of such decisions over time for stands to be manage for long-term carbon storage.
Biomass-Focused Comparisons
As the Crossett woods-run family represented a collection of locally sourced seed of unknown parentage, it provided the best baseline to compare against the top-performing families in this progeny test suggested at the early (3 years post-planting), mid-rotation (25 years), and late rotation (48 years) analysis. At 3 years, the presumed top performer (F15, at 2.1 m on average) was the family with the tallest average height; at 25 and 48 years, the top performers were identified as those with the highest merchantable volumes at those respective years (F8 and H23, at 0.59 and 2.00 m3, respectively). The merchantable volumes of four families (F8, F15, H23, and W29) at ages 25 and 48 years were then adjusted from green to oven-dry volume by reducing them by 12.3% as the volumetric shrinkage of loblolly pine to 0% moisture content (FPL, 2010, their Table 4-3).
Since there are relationships between loblolly pine wood specific gravity, genetics, tree age, and silvicultural practices (e.g., Zobel et al., 1969; Koch, 1972; Megraw, 1985; Schimleck et al., 2018), I compared a range of specific gravities for these best performing families against the Crossett woods-run family. This was done because whole tree estimates of wood specific gravity were not made on this progeny test. Hence, oven-dry merchantable volume was multiplied by wood density at 0% moisture content for families F8, F15, and H23, assuming three levels of specific gravity (0.45, 0.50, and 0.55). This range of specific gravities is consistent with that possible in loblolly pine, which reflects both a degree of genetic control and its response to silvicultural practices (e.g., Saucier and Taras, 1969; Wahlgren and Schumann, 1975). For W29, two age-based specific gravities (0.45 at 25 years and 0.48 at 48 years) were derived from surveys of this variable for local-origin loblolly pine in the Arkansas area (e.g., Wahlgren and Schumann, 1975; Tauer and Loo-Dinkins, 1990). The product of oven-dry merchantable volume and wood density yields a per-tree oven-dry biomass estimate; multiplying that by 350, 500, and 650 trees per hectare at 25 years and 150, 250, and 350 trees per hectare at age 48 years provides a per-hectare oven-dry biomass quantity to compare different families across a range of specific gravities.
Results
1972 Measurement Reanalysis
When installed, the 1969 outplanting consisted of 4,054 loblolly pines from full-sib families, 1,110 from half-sib families, and 180 were CEF woods-run seedlings (Table 2). When measured in 1972, mortality had been almost universally low—19 of the 22 full-sib families and the Crossett woods-run (W29) family averaged between 92.8 and 98.3% survivorship. Two of the remaining full-sib families and all of the half-sib families had at least 83% survivorship, but due to higher levels of variation in plot-level survival, these were not significantly less than the best (only F8, at 54.4%, experienced significantly (p < 0.05) lower survivorship). Most families tested had at least one plot with 100% survival, and only two families (F7 and F8) had plots with <75% survival.
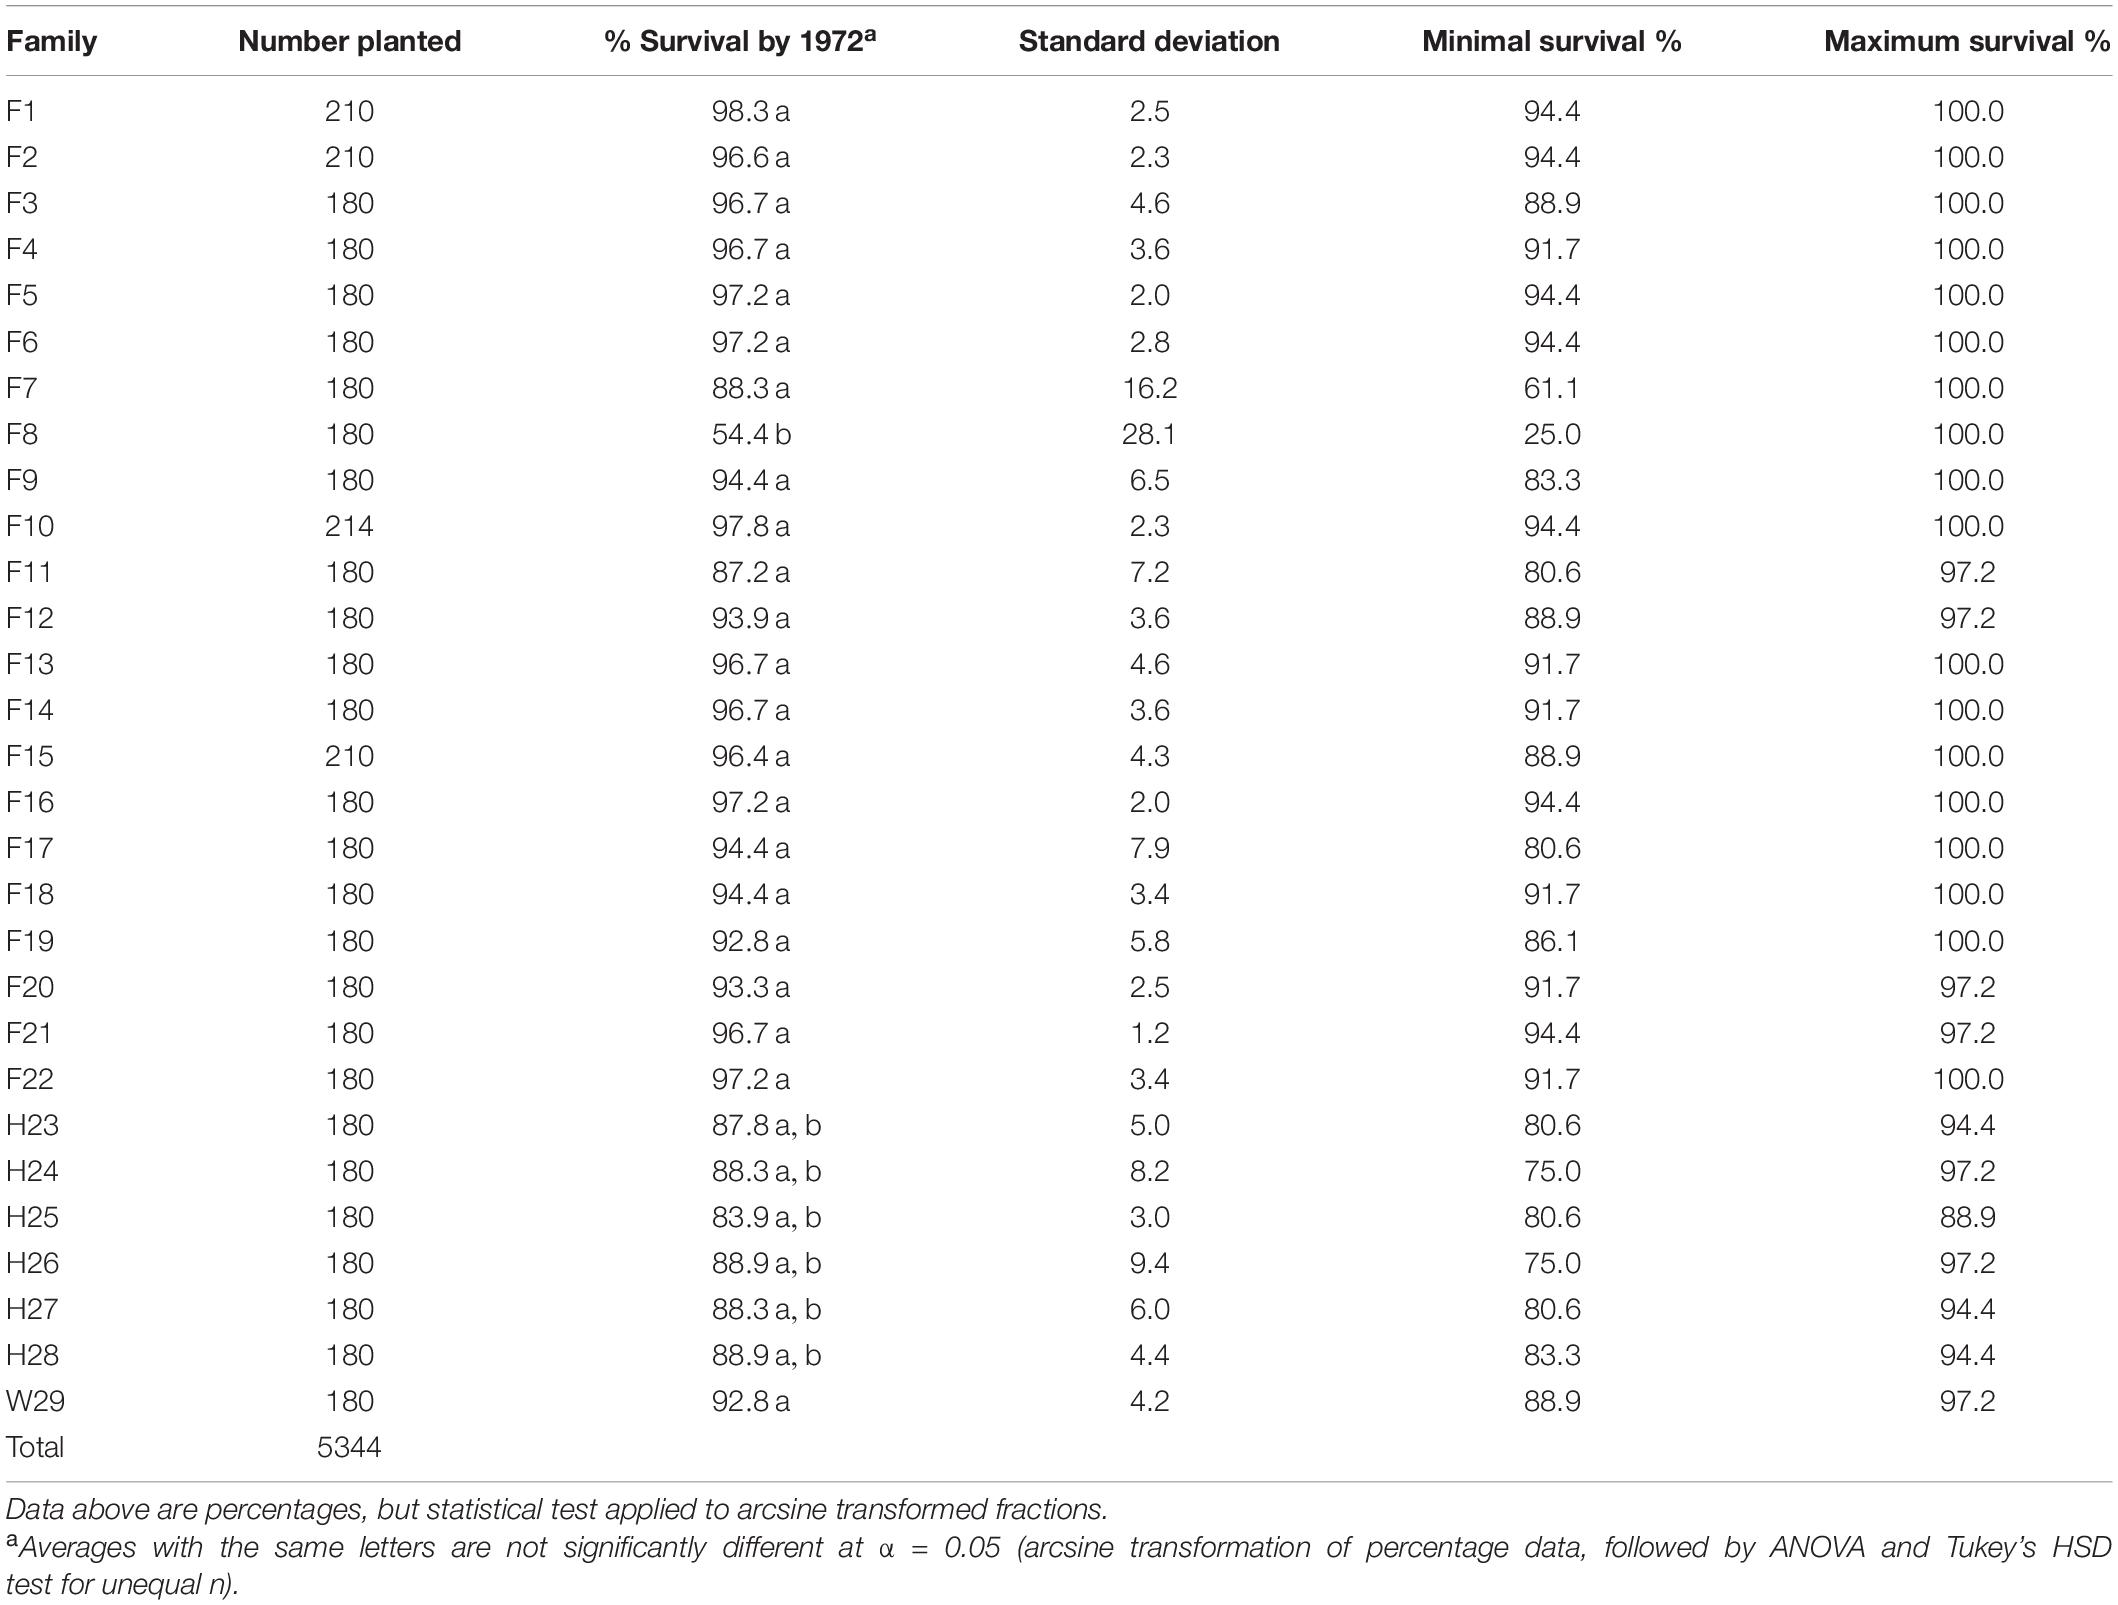
Table 2. Three-year percent survivorship of the 1969 outplanting in Compartment 3 of the Crossett Experimental Forest, measured in 1972 and summarized by family (five replicates, including the five arboretum plots merged with Replicate #5).
Out of the dozens of plots evaluated, only two had a fusiform rust infection rate of approximately 6%, and only a single family (F8) averaged more than 2% infected (Table 3). It is likely that the higher fusiform infection rate in F8 contributed to this family having the lowest survival rate (54.4%) after three growing seasons. Along with 16 other families, W29 showed no evidence of fusiform infection when checked in February of 1972.2
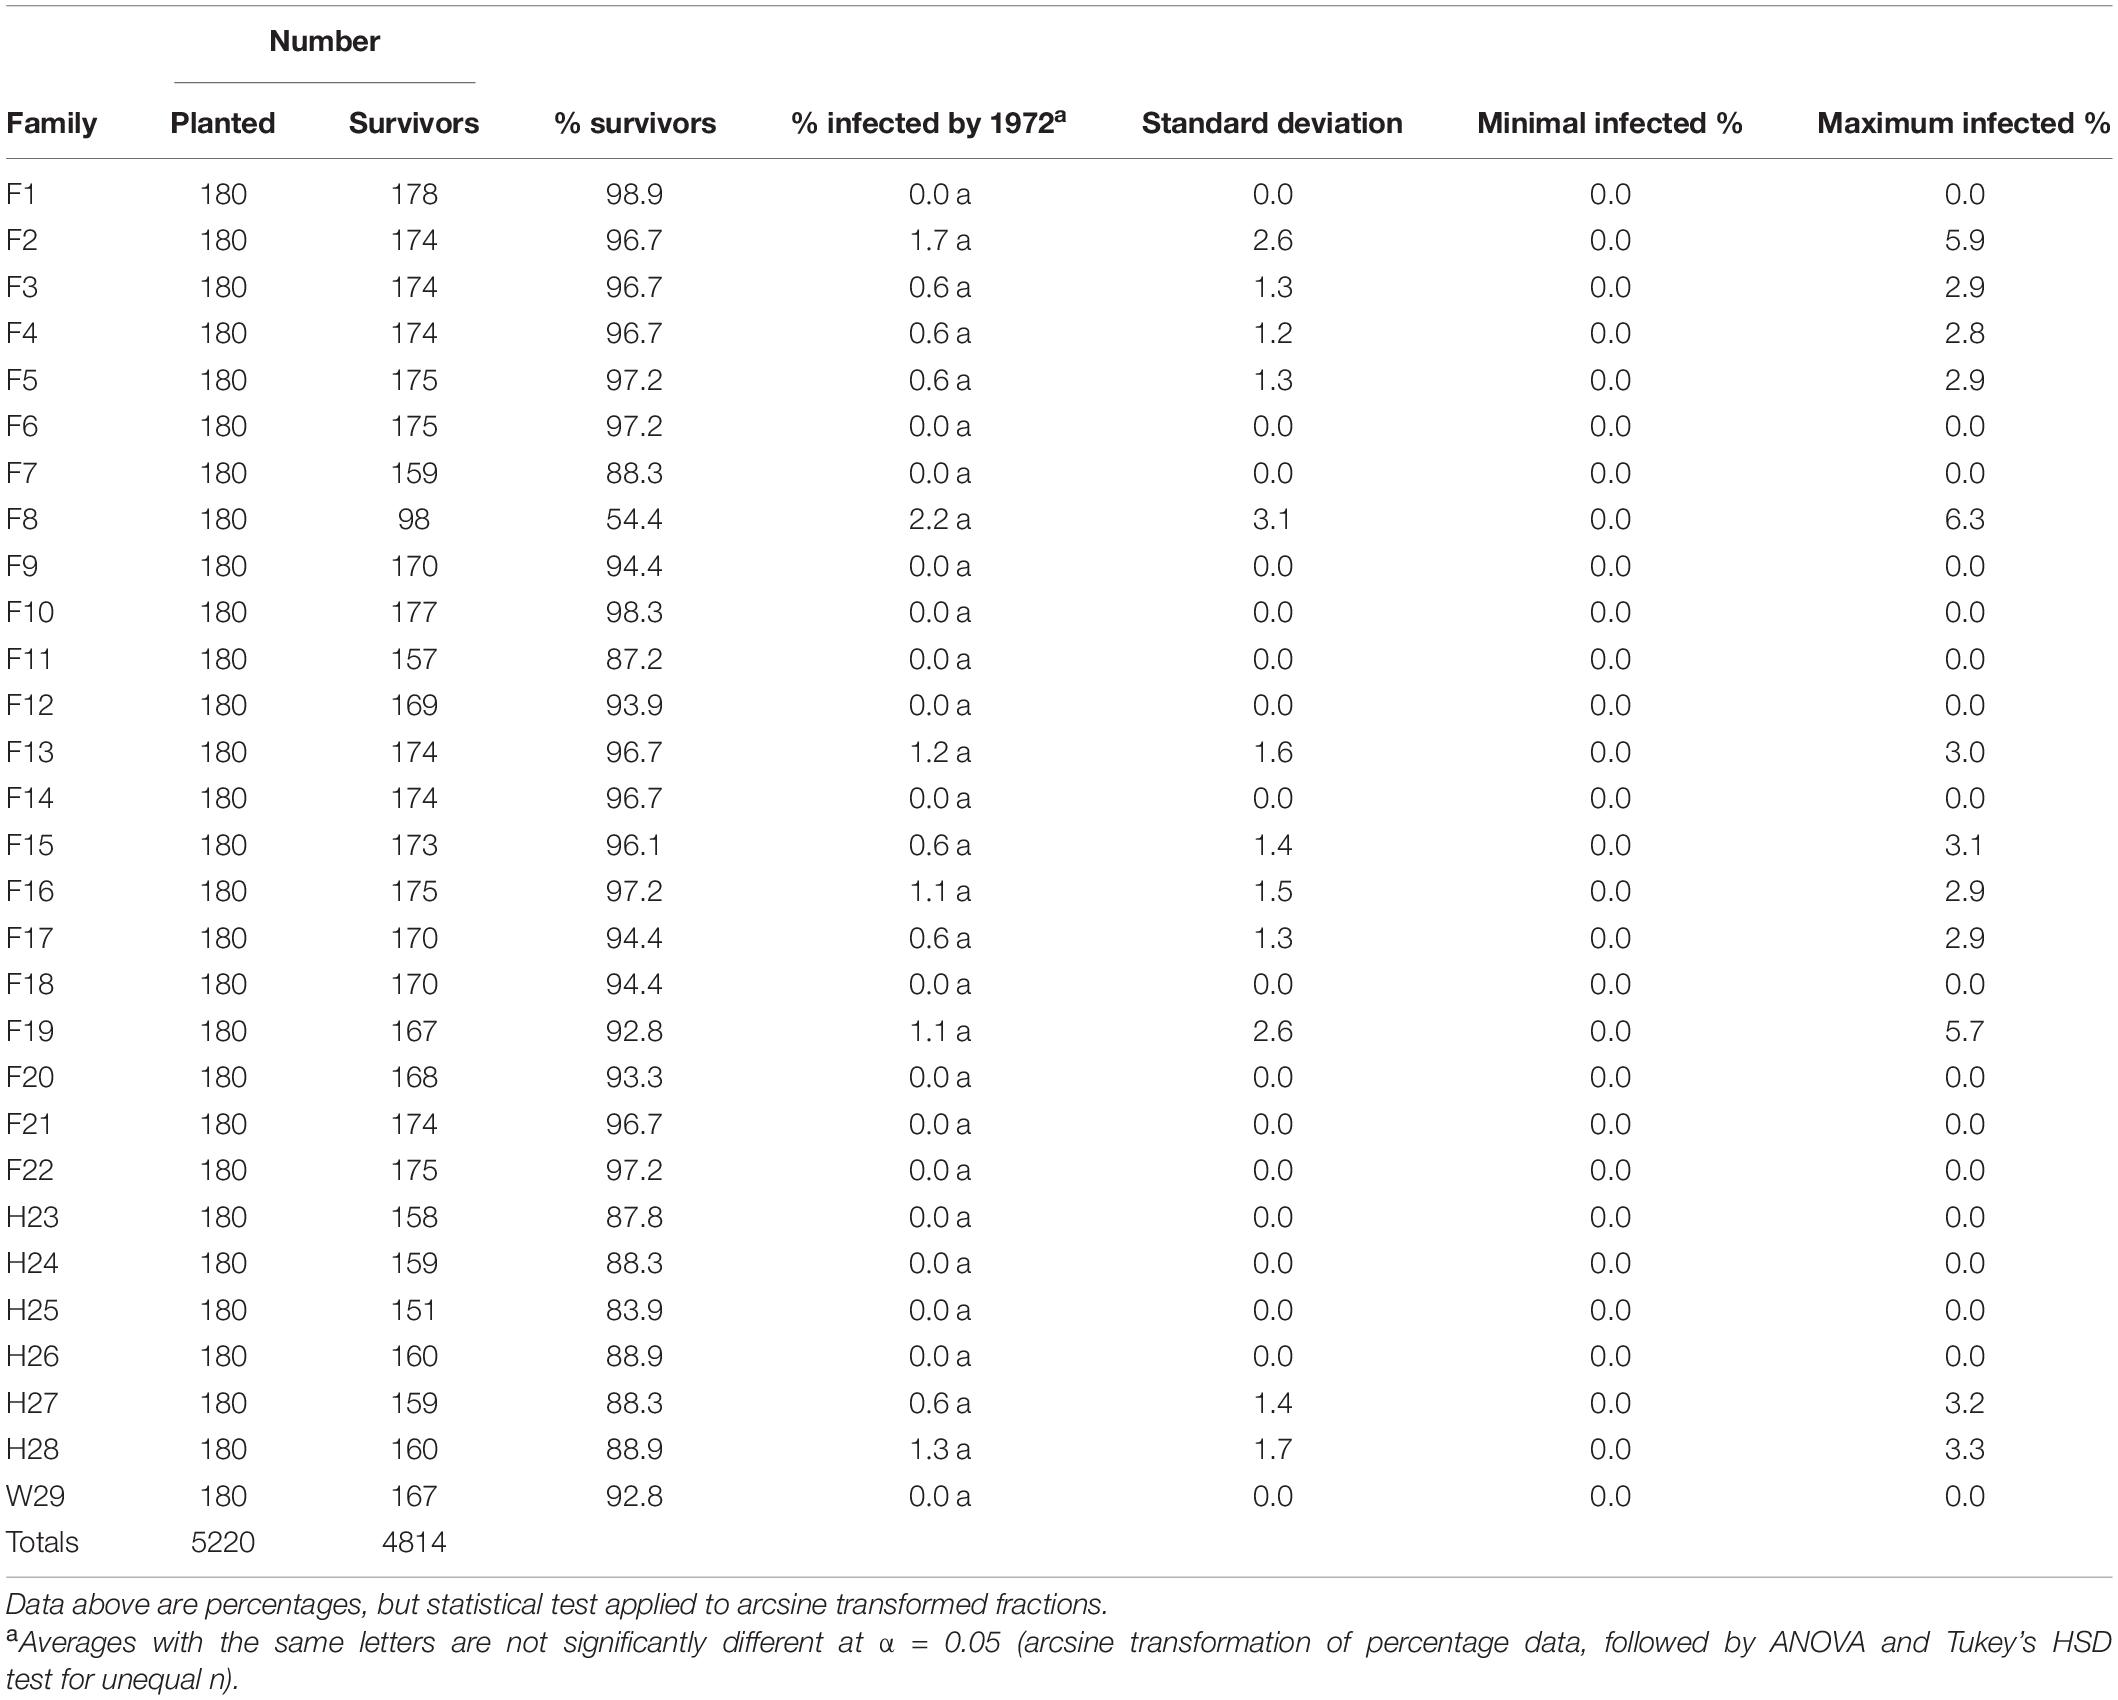
Table 3. Three-year percent fusiform rust infection rates of the 1969 outplanting in Compartment 3 of the Crossett Experimental Forest, measured in 1972 and summarized by family (five replicates, but without the arboretum plots merged into Replicate #5).
Substantial variation in height within families resulted in many of them being statistically indistinguishable from each other after 3 years (Table 4). On average, the tallest family was F15 at 2.1 m; families F2 and F6 also averaged at least 1.8 m tall. Most families had good (1.5–1.8 m) to fair (1.2–1.5 m) height performance and only two (F11 and F12) proved to be poor (<1.2 m) at this age (Table 4). At 1.6 m, W29 was on the lower end of good height performance. Nance (1978, his Table 27) reported similar findings; his analysis of height performance at 5 years noted only five families exceeded W29 by 5% or more and some families averaged more than 25% shorter. Both families F2 and F15 had maximum heights > 3 m, while all families had minimum heights of <1 m.
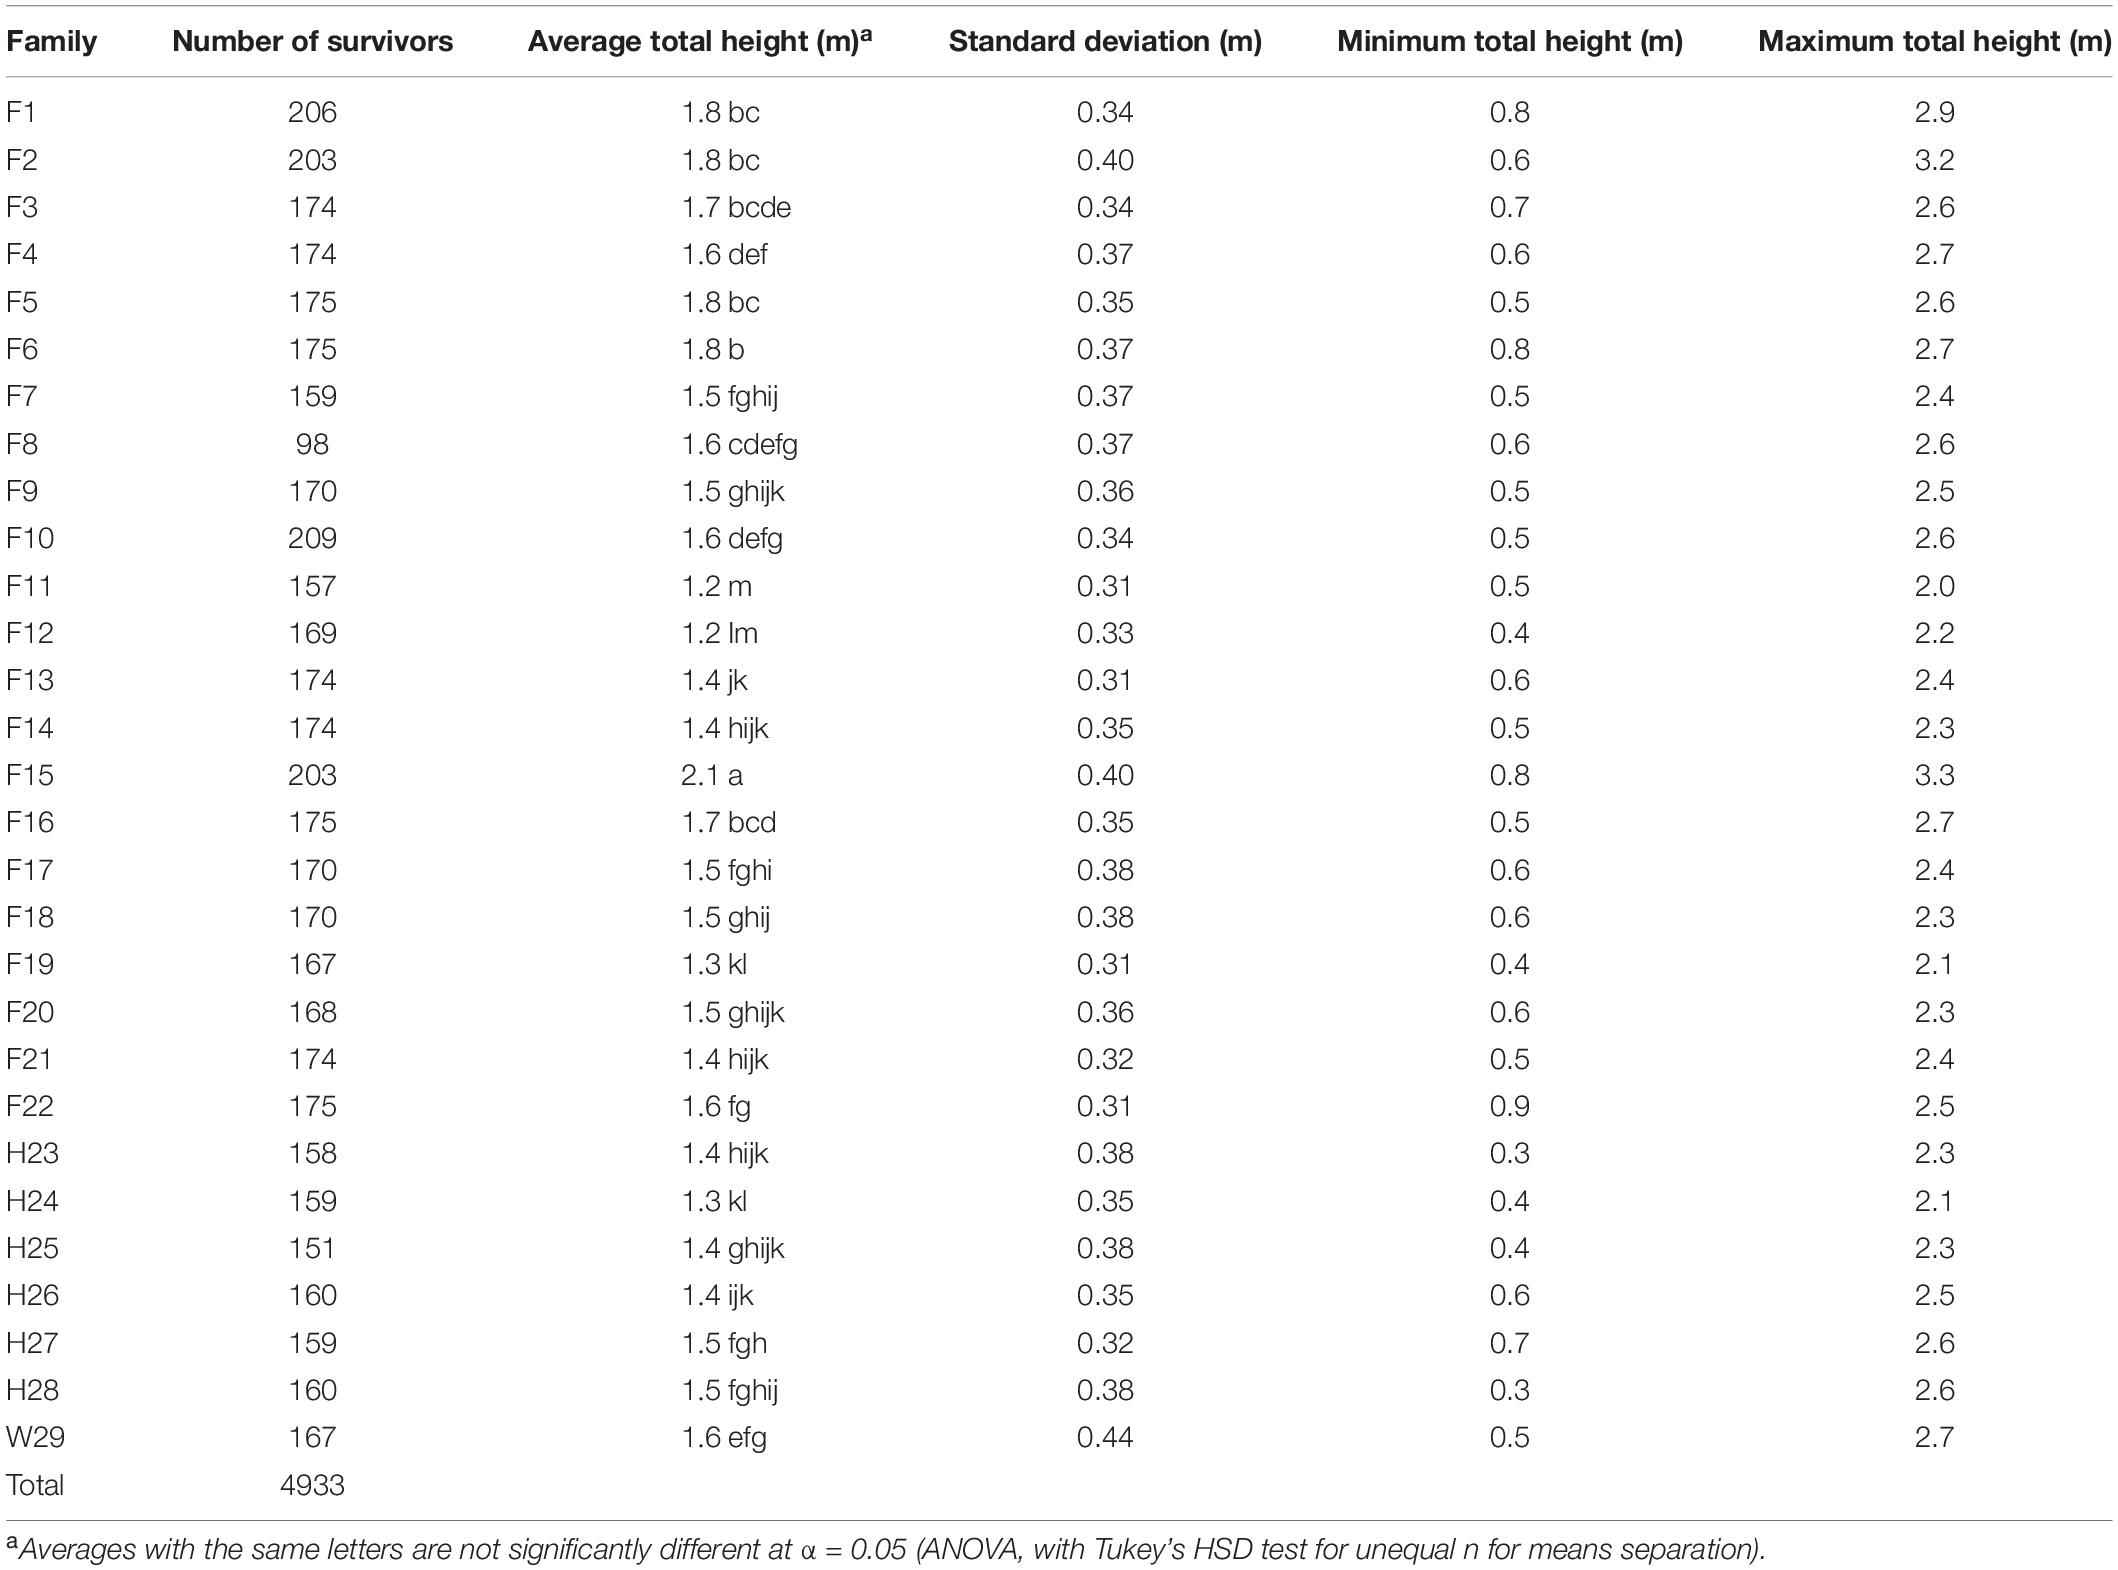
Table 4. Three-year total heights of surviving pines from the 1969 outplanting in Compartment 3 of the Crossett Experimental Forest, measured in 1972 and averaged by family (five replicates, including the five arboretum plots merged with Replicate #5).
A reanalysis of the 1972 plot-level data found that most tested families generally had good to excellent survivorship, fair to good height growth, and low to very low fusiform infection rates at 3 years, with the W29 seedlings performing well in terms of survivorship, total height, and fusiform occurrence. Using a series of ad hoc relative performance thresholds (Table 5), only one family (F6) fell into the excellent category in all three measures of success (survivorship, total height, and fusiform rate). Families F2, F10, F14, F15, F21, and F22 each had the highest rating in two of the three categories, with most families (including W29) scored at least one “excellent” rating. Most families also had two or more “good” ratings, and in 1972, only F8 seemed to be poorly suited for the CEF, having received only one good and two poor ratings.
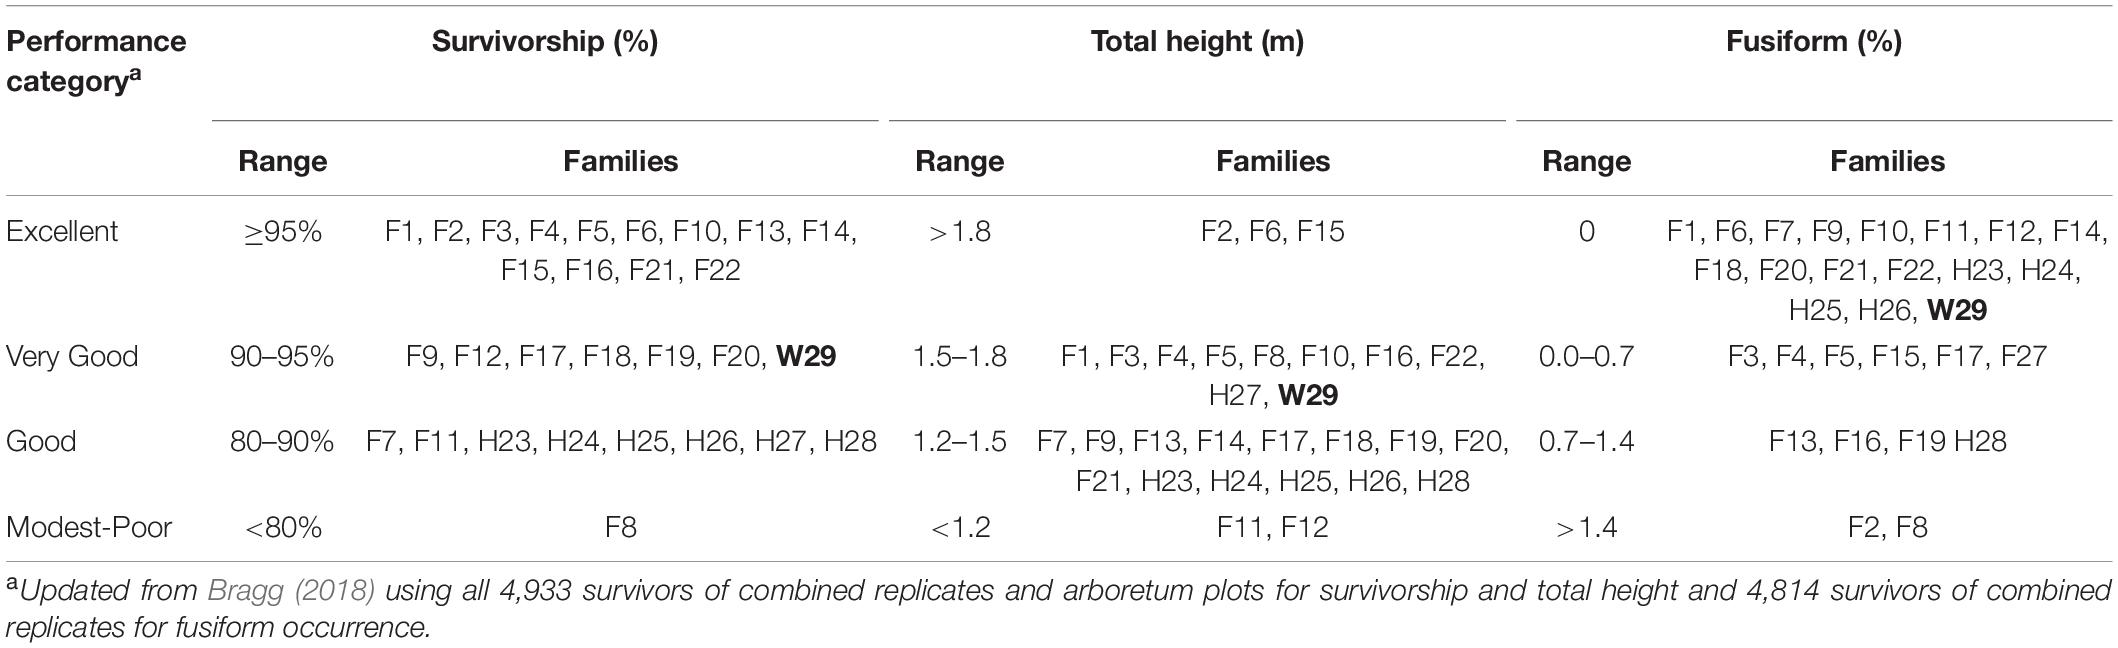
Table 5. Relative ranking of family performance in 1972 using arbitrary categories, with the Crossett woods-run family (W29) highlighted in bold.
1994 Measurement Analysis
After 25 years in the ground, three families reached significantly different heights than the Crossett woods-run family (Figure 2 and Supplementary Table 1). Family F2, which recorded one of the tallest saplings (3.2 m) and had one of the higher average total heights (1.8 m) in 1972, averaged 22.1 m in 1994. This compares to the 21.0 m average height of Family W29, which was intermediate amongst the families tested (Figure 2). Two families (F10 and F12) proved to be significantly shorter on average than W29 at the time of this remeasurement; F10 also had the shortest tree in 1994 at 12.8 m. It is important to note that all families produced at least one specimen that exceeded 22.3 m in height after 25 years in the ground, which is only modestly less than the tallest (24.4 m) at this stage.
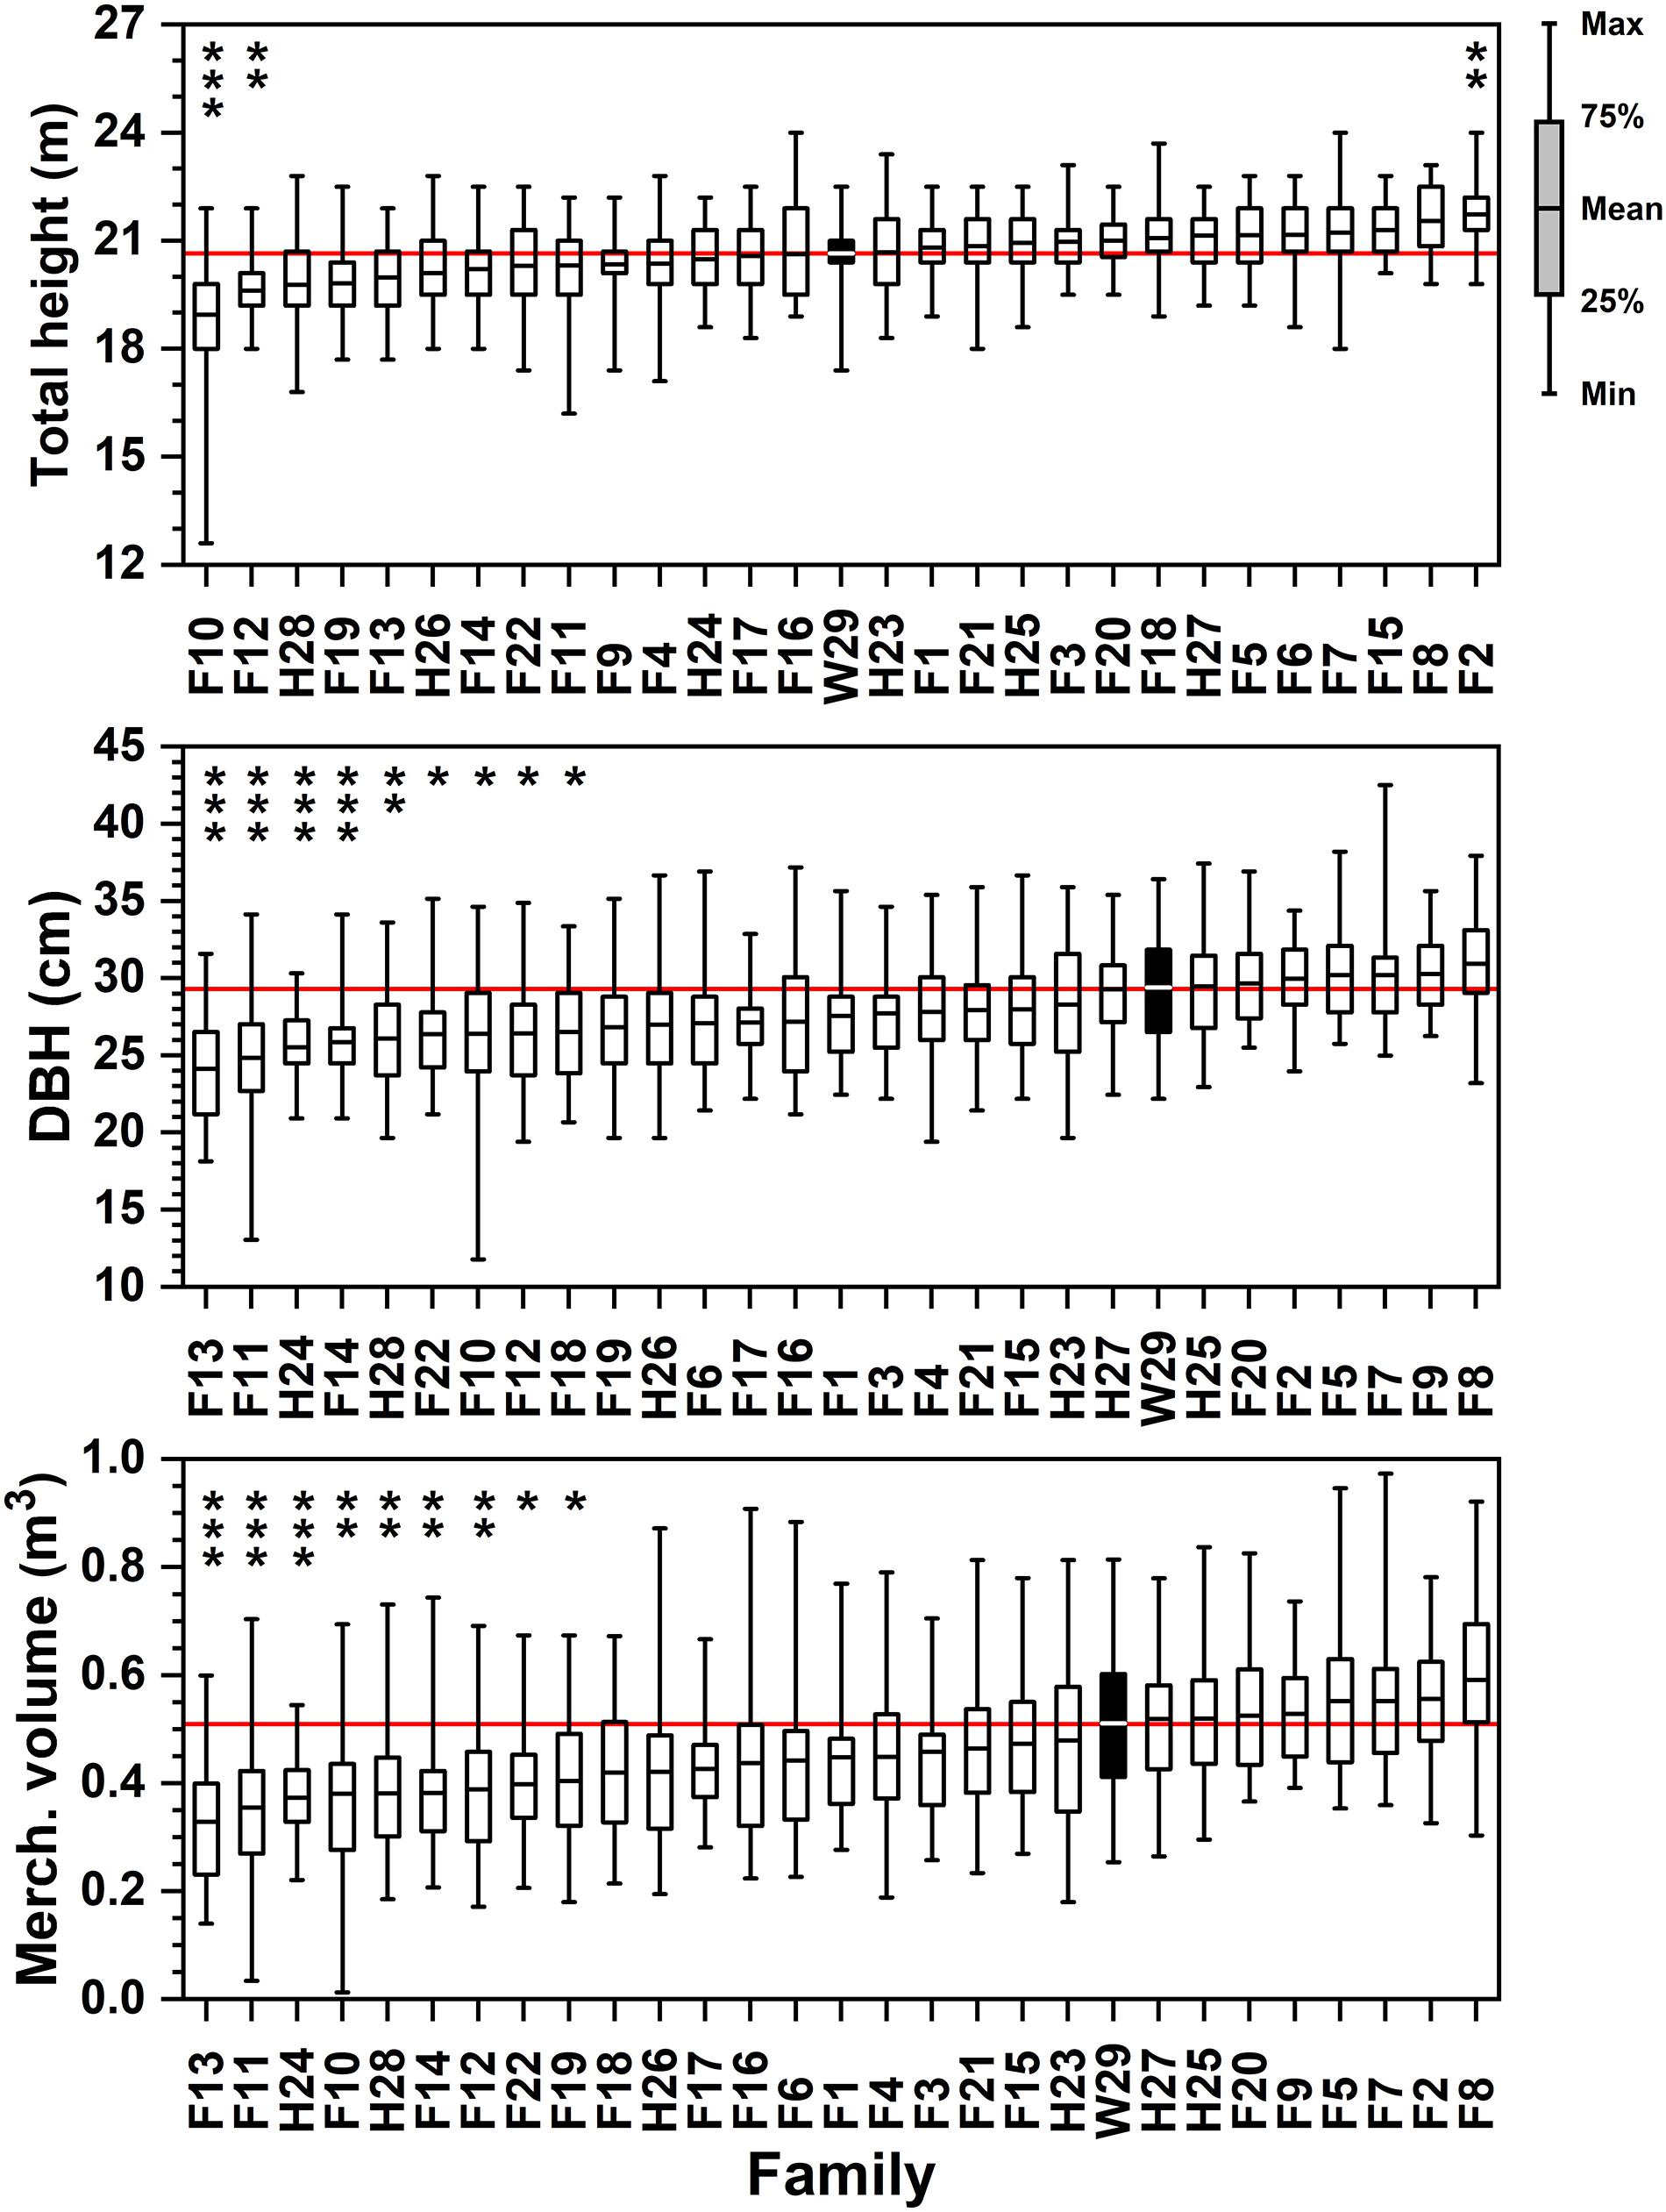
Figure 2. Ordered rankings of progeny test performance measures by attribute (total tree height, DBH, merchantable volume) means from data collected in February–March 1994. The open-pollinated Crossett Experimental Forest family (W29) highlighted by black bar, with solid red line showing W29 mean value. Bars represented range of observed values from minimum to maximum; boxes represent 25th and 75th percentiles of sampled data. Asterisk (stacked vertically) above data reflect families significantly lower or higher than W29 at the following significance levels (* = 0.05 ≤ p < 0.01; ** = 0.01 ≤ p < 0.001; *** = p ≤ 0.001).
Family W29 remained in the upper third of the largest diameter families in 1994, with no other families having average DBHs that were significantly greater than W29’s 29.5 cm mean (Figure 2 and Supplementary Table 2). The family with the greatest DBH in 1994, F8, averaged 31.0 cm (SD = 3.3 cm) but did not produce the individual tree with the largest diameter after 25 years in the ground—that specimen came from F7 and had a DBH of 42.7 cm. Nine families were significantly less in DBH. This was not a surprising result, given that there was considerably greater variability in this attribute amongst families than height (CVs of 7-15% for height compared to 3-8% for DBH; Supplementary Tables 1, 2). Only two families (F13 and F11) averaged less than 25.4 cm DBH after 25 years, and the smallest individual loblolly pine registered only 11.9 cm DBH.
Calculated merchantable tree volume in 1994 yielded several statistically significant differences by family after a quarter-century of growth. Because Equation [1] is most strongly influenced by DBH, those families with the highest average diameters also tended to yield the highest merchantable volumes (Figure 2 and Supplementary Table 3). Families F8 and F2 were both tall and had large DBHs, ensuring that under this formulation they yielded the largest average individual tree volumes in 1994 (0.59 and 0.56 m3, respectively). Note that although these two families averaged the highest tree-level volumes, the largest individual specimens in this progeny test came from other full-sib families (approaching 1 m3 in MVOL; Supplementary Table 3). After 25 years of growth, the Crossett woods-run family W29 was still a strong performer, with an average individual tree merchantable volume 0.51 m3 and some specimens of this family exceeding 0.8 m3 (Figure 2). The worst performers were significantly lower, yielding 0.4 m3 or less per average tree.
2017 Measurements Analysis
In early 2017, crews measured 615 live loblolly pines in the 1969 outplanting of the progeny tests in CEF’s Compartment 3 (Supplementary Table 4). All of the original 29 families had at least 13 trees; the family with the highest number remaining in 2017 (H26) had 28 trees. Because of the thinnings and salvage done over the years, it is not possible to compare survival trends through 2017. Very little evidence of fusiform could be found in the 2017 sample—only 2 of the 615 pines were identified with cankers. This limited fusiform presence can be attributed to the inherently low infection rate of local-origin families, mortality of infected pines early in the study from the disease or other causes, and likely removals of infected trees later during the various harvest removals. Crown damage (evidenced by distorted branches and bole crooks) from a significant ice storm in the late 1990s produced some of the shorter trees, but most of the severely damaged pines were salvaged in the immediate aftermath and hence are not represented in this assessment. While the extent and nature of storm damage can be related to family-based vulnerabilities (e.g., Xiong et al., 2010; Pile et al., 2016), insufficient evidence and control in this progeny test (coupled with post-event salvage) prevented further evaluation of a genetic link. While under some conditions genetics could prove a confounding analytical factor, such a storm two decades in the past is not likely to meaningfully influence the interpretation of these data, especially given that southern pines usually quickly recover lost height after top damage (e.g., Wiley and Zeide, 1991; Dipesh et al., 2015).
Significant family-based differences in tree height were apparent 48 years after planting in this progeny test, although with a considerable amount of variability within families (Figure 3 and Supplementary Table 4). Individual specimens from most (23 of 29) families exceeded 31 m at 48 years; and additional five families exceeded 30.5 m maximum height, and only one family (H28) failed to have a single specimen exceed 30 m (although at 29.7 m, H28 almost reached that threshold). The loblolly pines in all families reached at least 24 m in height, with most exceeding 26 m. On average, just over half (15 of 29) of these tested families exceeded 29 m at 48 years, with 21 of 29 exceeding 28.5 m and the tallest (F6) reached 30.4 m. While the shortest (24.4 m) specimen in H26 had a badly ice-mangled crown, other individuals in this half-sib family were not particularly tall, either. The 2.2 m difference in average height between the tallest family (F6) and the shortest family (H26; 28.2 m) is almost a half-log (Figure 3). Averaging 28.3 m, the Crossett woods-run family proved significantly shorter than the tallest families (Figure 3), even though it had individuals > 31 m tall.
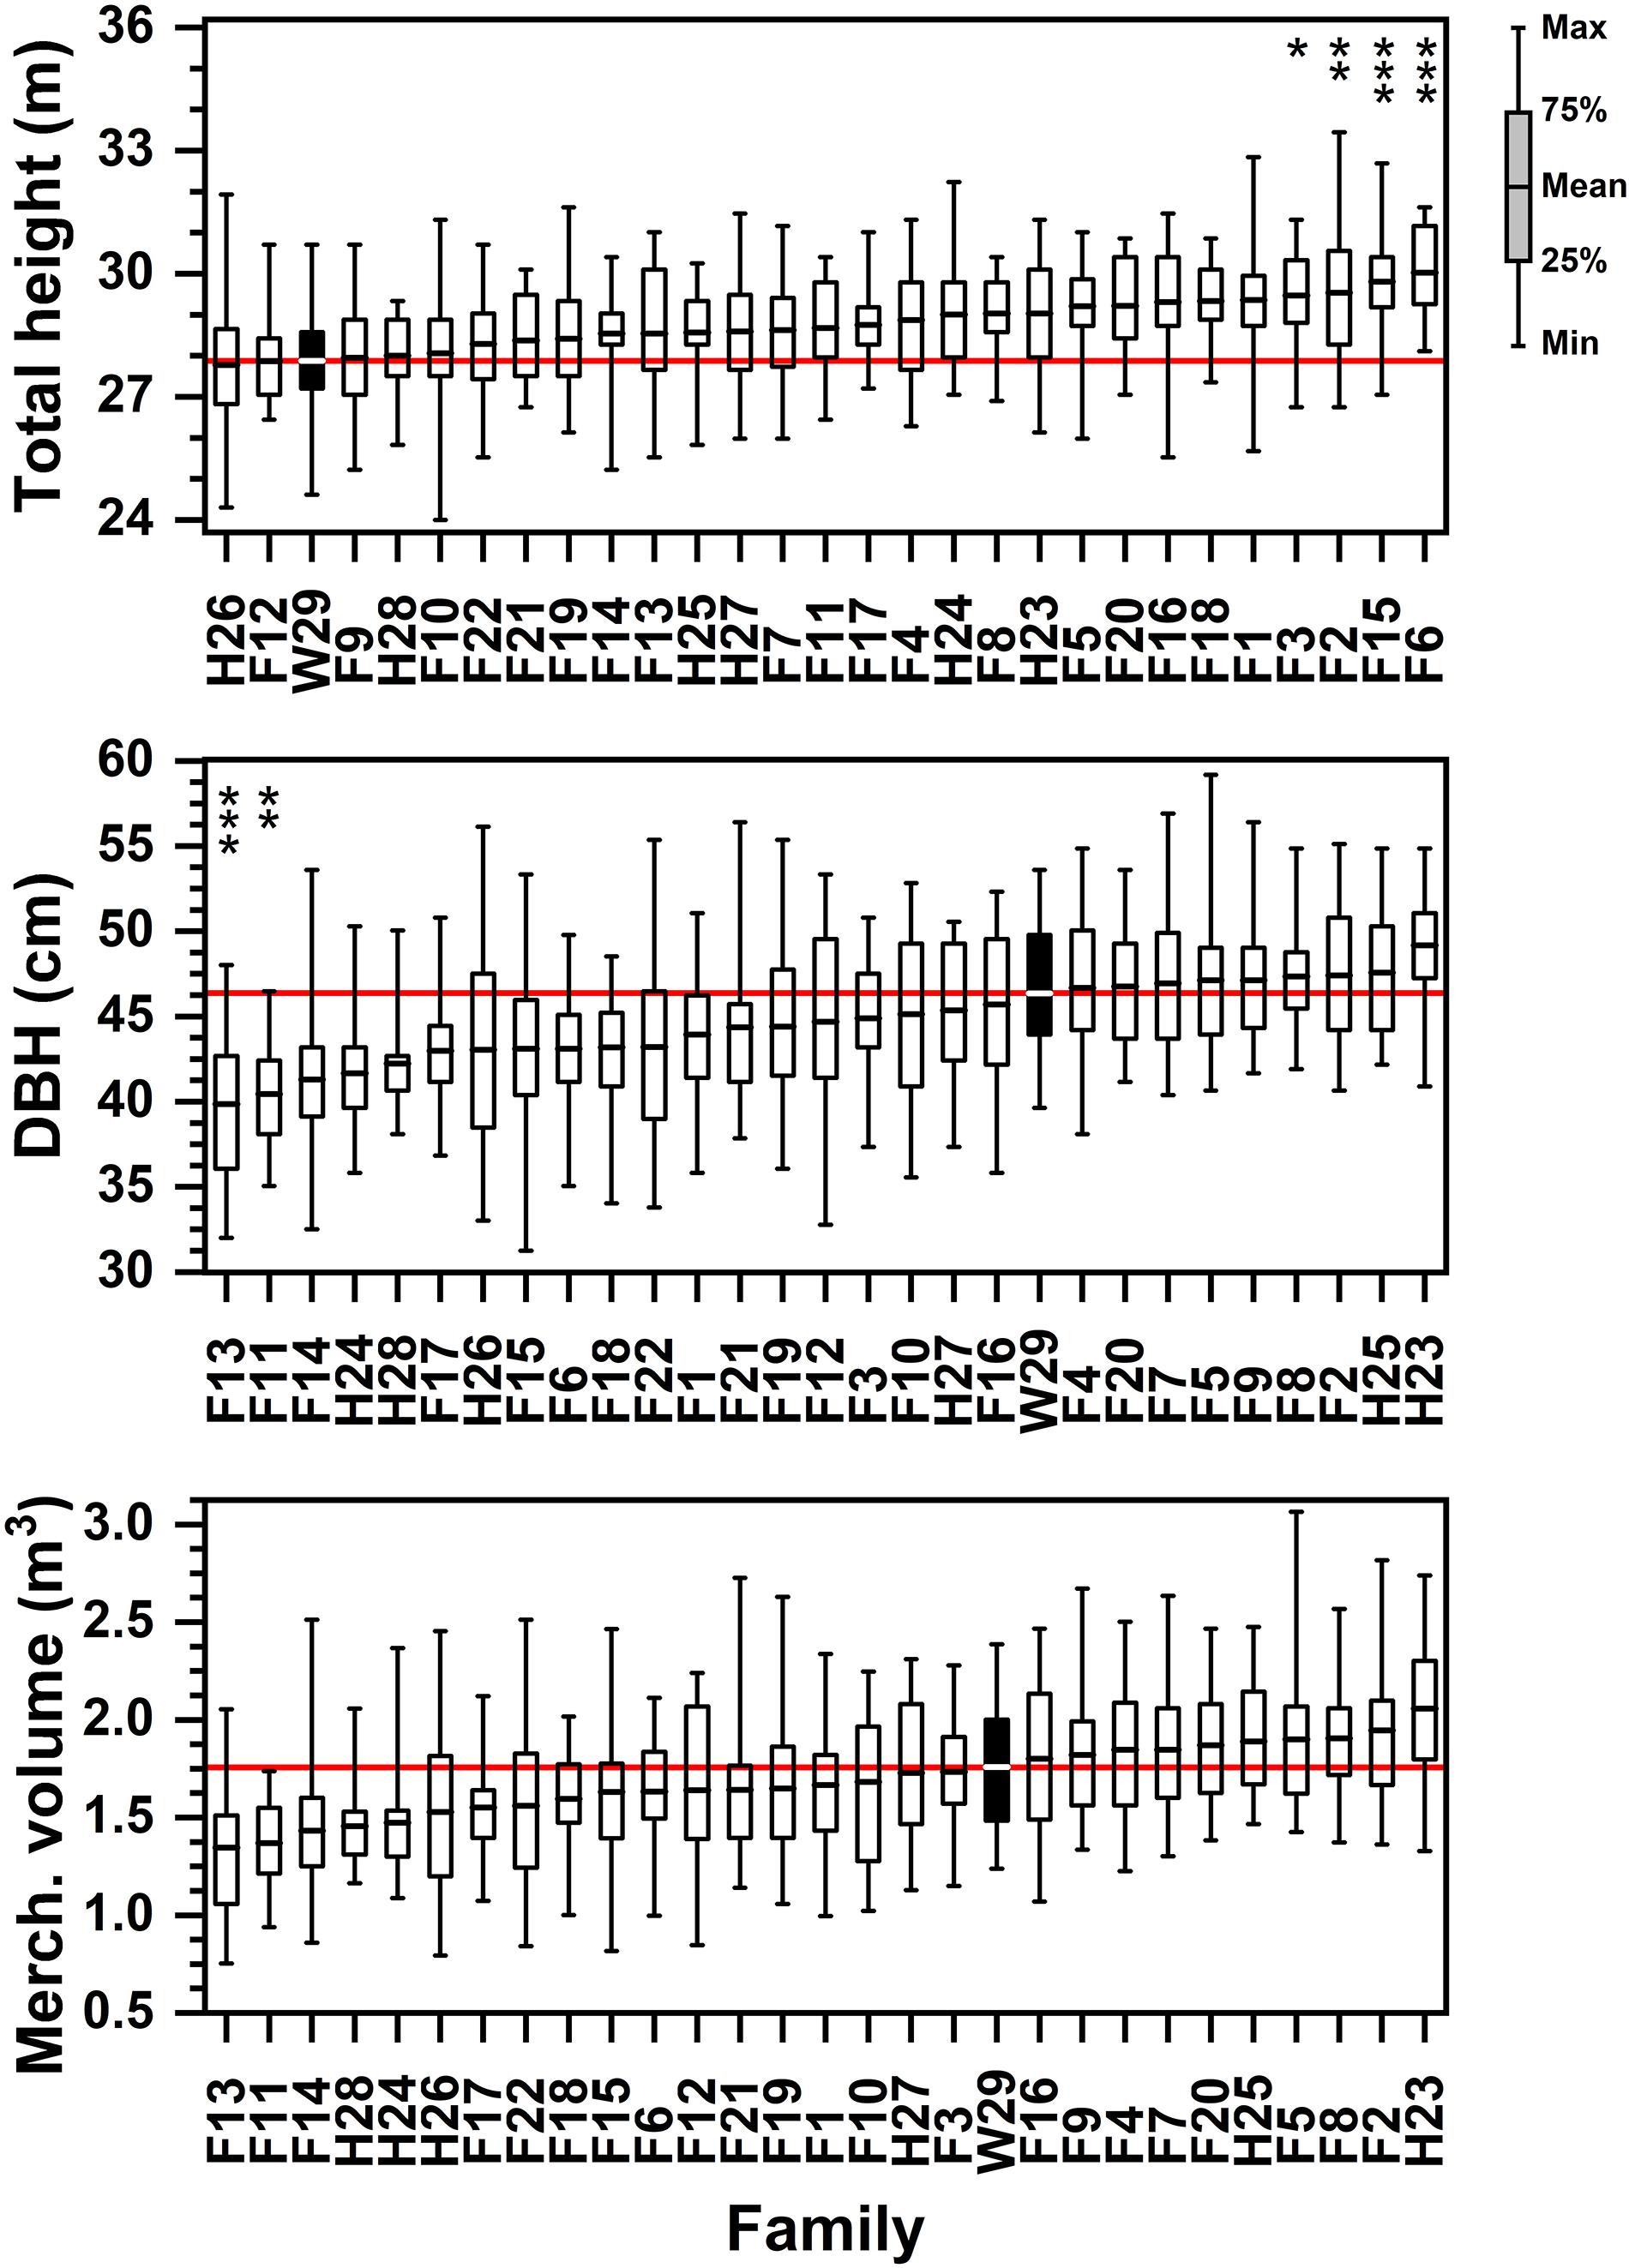
Figure 3. Ordered rankings of progeny test performance measures by attribute (total tree height, DBH, merchantable volume) means from data collected in January 2017. The open-pollinated Crossett Experimental Forest family (W29) highlighted by black bar, with solid red line showing W29 mean value. Bars represented range of observed values from minimum to maximum; boxes represent 25th and 75th percentiles of sampled data. Asterisk (stacked vertically) above data reflect families significantly lower or higher than W29 at the following significance levels (* = 0.05 ≤ p < 0.01; ** = 0.01 ≤ p < 0.001; *** = p ≤ 0.001).
Several families had individual specimens that exceeded 55 cm in DBH at 48 years, including one that exceeded 59 cm, and all families reached at least 31 cm DBH at this age (Supplementary Table 5). By 2017, Family H23 had emerged as the having the largest average tree DBH at 49.2 cm (Figure 3). Although now significantly shorter than the tallest families, W29 remained in the upper half of average tree DBH (average of 46.4 cm), and proved to be significantly greater in DBH than two of the full-sib families (F13 and F11, at about 40 cm DBH).
Again, volume trends at 48 years after planting were most sensitive to DBH. While all but two tested families had individual specimens that reached or exceeded 2.0 m3 of green merchantable volume, only one family (H23) averaged 2.0 m3 (Supplementary Table 6). The smallest individual tree merchantable volumes found in most families tended to range from 0.75 to 1.25 m3, or about half as large as the biggest specimens. Because of the considerable degree of variation in merchantable volume for all families (CV from 15 to 30%; Supplementary Table 6), the Crossett woods-run family was not significantly different in size than any of the other tested families (Figure 3). Although not significant, W29’s average merchantable volume (1.71 m3) was approximately 0.3 m3 per tree less than the most productive family and 0.4 m3 more than the least productive family. However, the largest average volume families (e.g., H23, F2, F8, F7) were significantly bigger than the average volumes of smallest families (F13, F11, F14); these differences were on the order of 0.5 m3 per tree.
Family Performance and Biomass Differences Over Time
The best performing family suggested by evaluating the height growth performance of 3-year-old loblolly pine in this progeny test, F15, did not remain the best performing family over time (Table 6). By 25 years post-planting, F15 had fallen to 11th best performer of the 29 compared and was only 80% as large in terms of merchantable volume as the best performer at age 25 and by age 48, F15 had fallen to 20th (still about 80% of peak). The best-performing family at age 25, F8, had only been the 9th best performer at age 3 years (and had survived the worst at that age); by age 48 years, F8 had slipped slightly to third-best overall, almost 7% less than the best-performing family at that time. According to the results of this particular progeny test on the CEF, at 48 years of age, half-sib family H23 had outperformed the next best performer by over 5% (in terms of merchantable volume; Supplementary Table 6), largely due to its greater girth (Supplementary Table 5). Open-pollinated Family W29 ranged from 12th best (age 3 years) to 9th best (age 25) to 11th best (age 48).
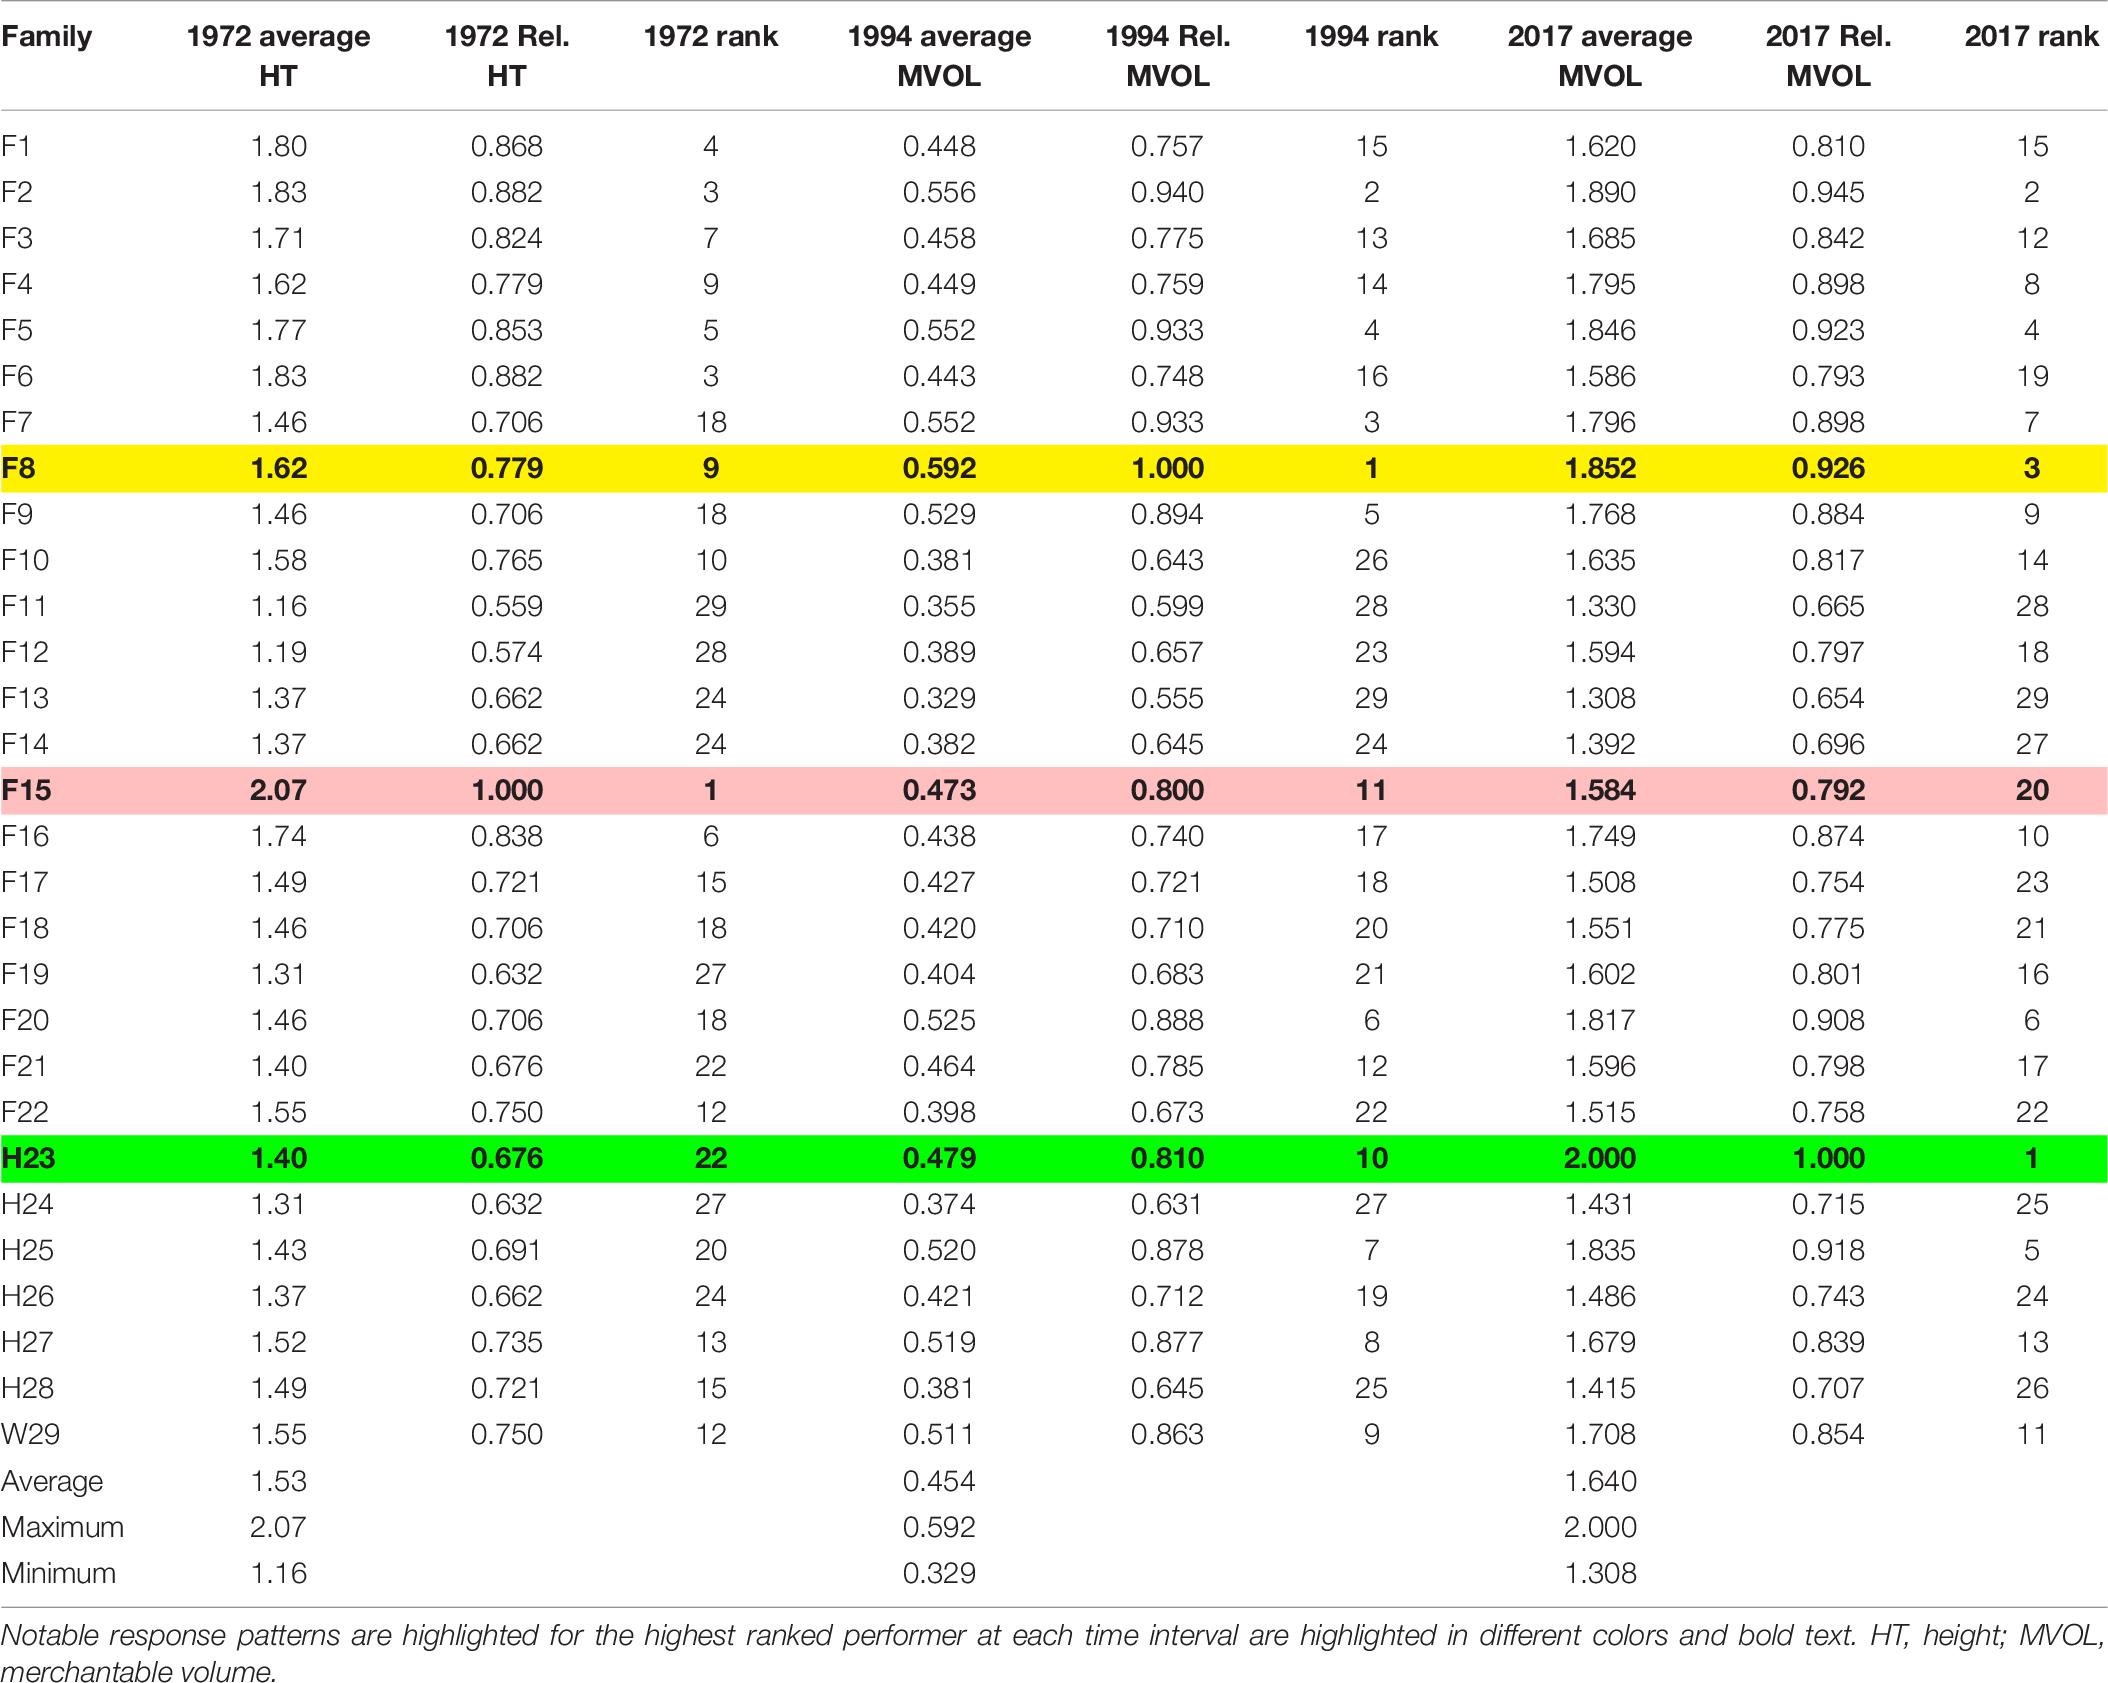
Table 6. Change in measures used to evaluate average and relative (Rel.) growth performance in CEF superior pine progeny tests, with relative based on the best performing family (maximum family-averaged performance).
Table 7 demonstrates that volume alone is an insufficient arbitrator in determining biomass production performance for loblolly pine (so long as number of trees per unit area is held constant). Regardless of family, the advantage of higher individual tree volume yield at a given age can be more than offset by a less voluminous family with noticeably higher wood specific gravity. For instance, W29 was predicted to have greater oven-dry biomass than either F15 or H23 at age 25 years when their specific gravities were all 0.45 because of the greater individual tree volume of W29 at this age (Table 7). Regrettably, this study lacked the family-averaged specific gravities needed to determine if this relationship influence the CEF progeny test biomass production results.
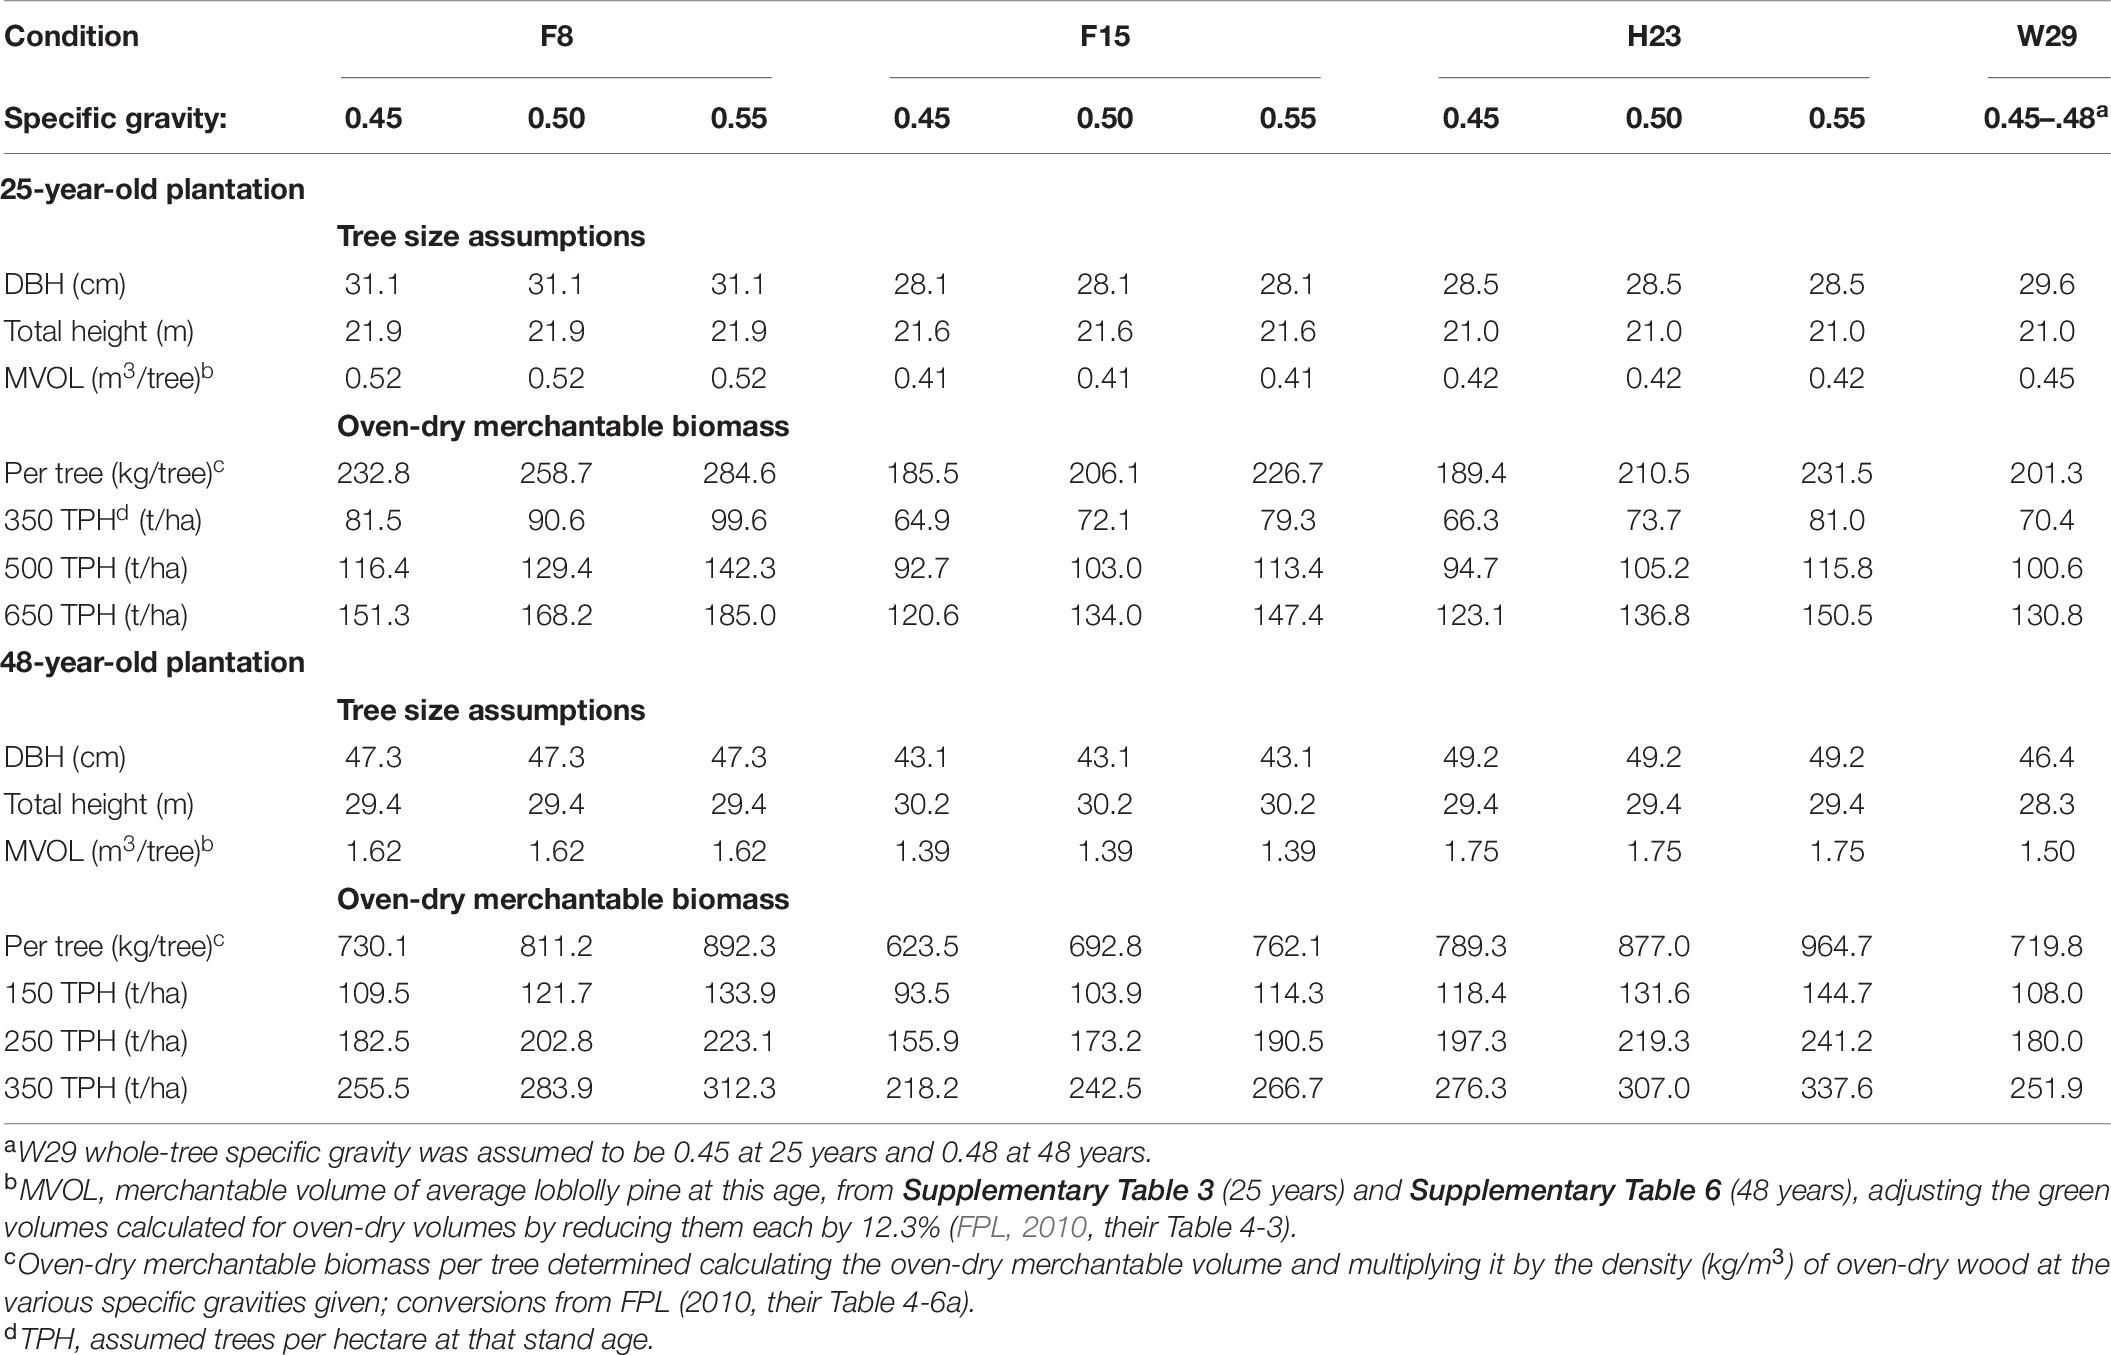
Table 7. Oven-dry merchantable biomass predictions (using different levels of wood specific gravity) of loblolly pine plantations at 25 and 48 years after planting using the top-performing family identified at 3, 25, and 48 years of age (F15, F8, and H23, respectively), compared with the Crossett woods-run family (W29) as the standard.
Discussion
Early Performance Results
Early survival of this progeny test was excellent for most families. While a few Arkansas-based studies have had comparable survivorship (e.g., Grigsby, 1973), especially for local-origin loblolly pine, this high survivorship (Table 2) contrasted sharply with several seed source and progeny tests of loblolly pine in this area. For instance, Schmidtling (1987) noted 3-year post-planting survival rates of a variety of loblolly pine families of 59% at Horatio, Arkansas, 75% at Crossett, Arkansas, and 85% at Stewart, Mississippi. Though reasons behind these variations in planted loblolly pine survival are unclear, it seems likely that this study’s high survivorship can be attributed to excellent planting practices, effective site preparation, and perhaps most importantly, the good fortune of having adequate precipitation immediately prior to and after planting. Weather records from the CEF showed a wet year in 1968 (just over 1930 mm of precipitation; the CEF averages about 1410 mm annually) and slightly drier than average years in 1969 and 1970 (1245 and 1346 mm, respectively), followed by a major drought in 1971 (988 mm) and a return to average (1417 mm) in 1972.
High early survivorship may also be partially attributed to low fusiform rust infection at 3–5 years post-planting. Because of this low rate, Nance (1978) paid little attention to family-based differences; however, his Figure 26 indicated most families had a somewhat more fusiform than W29 at 5 years. This is not a surprising result—loblolly pines in the Upper West Gulf Coastal Plain (especially southeastern Arkansas) often have a relatively low fusiform rust rates (less than 10% infected), although this depends on family (Grigsby, 1973, 1975a,b, 1977; Randolph et al., 2015). For example, when planted in other regions and exposed to a wider range of environmental conditions, woods-run loblolly pine from the vicinity of the CEF generally have good survivorship and low (less than 20%) fusiform infection after their first decade [although see Grigsby (1975b) for some higher rates]. Other studies of fusiform infection rates indicated that the progeny of superior (improved) pines may fare somewhat better than those of conventional woods-run sources (e.g., Grigsby, 1975a; Walker and McKeand, 2018). Given that the families in this CEF progeny test had been pre-screened for fusiform resistance, low levels of this disease are not surprising.
Consistency of Growth Performance Over Time
Although this limited assessment (one outplanting of a progeny test of a small number of loblolly pine families) constrains the applicability of the results, a number of interesting patterns can be seen from a comparison of relative family success at 3, 25, and 48 years post-planting. First, while the Crossett woods-run family W29 performed well, it was not able to consistently match the best performing full-sib families in terms of height over time. However, it was only modestly shorter than the tallest seedlings at the early stage of evaluation in this progeny test (Table 4), which helped prompt Nance (1978) to dismiss the potential of this superior pine trial. Grigsby, in his unpublished correspondence related to his review of Nance’s report, believed this dismissal to be too hasty. The fact that later measurements did find significant differences between families—even if not necessarily with the Crossett woods-run source—could have favored further investigations.
Second, analysis of this progeny test at later dates (Figures 2, 3) indicated that whatever measurement of growth performance is used—height, DBH, or volume—family-level success varied, sometimes dramatically, over time. For example, of the 10 tallest families at 3 years after planting (Table 6), only two remained in the same top 10 (compared in terms of average merchantable volume) at 25 and 48 years. The families that produced the greatest merchantable volumes at 25 and 48 years often had modest performance at the earliest observation stage. Rank orders also change considerably from ages 25–48 years, as found in the tallest family at 3 years (F15), which proved to be only 11th largest in merchantable volume at 25 years and average only 20th largest at 48 years; Family H23 behaved in the opposite fashion, being only 22nd tallest (on average) at 3 years, increasing to 10th largest in average merchantable volume at 25 years, and then largest at 48 years.
These findings are not in agreement with the consensus of the tree improvement community, which has found good evidence of much greater fidelity in performance rank over time than suggested by this CEF data set (e.g., Rehfeldt, 1984; Sluder, 1984; Bridgwater and McKeand, 1997; Raley et al., 2003). Such provisional findings in this limited progeny test study does not imply that the other studies are wrong or their recommendations misplaced—indeed, their documentation of performance gains are impressive at the stand-, landscape-, and regional-levels (e.g., Aspinwall et al., 2012; Restrepo et al., 2019; McKeand et al., 2021). There are several possible reasons for the apparent discrepancies of this study, including a limited sample size and lack of replications on different sites (the original 1969 study was also installed at two other locations, but these were lost after the study was closed in the 1970s), confounding impacts of random environmental effects that overwhelm inherent genetic performance differences between families, a lack of control over the random effects that may have unduly influenced the results, the young age (3 years) at which the first observations were made which might have been too early to properly control for dominance patterns, or differences in response to competition (self-thinning) as trees aged and the canopy closed (Rehfeldt, 1984; Talbert and Strub, 1987). Furthermore, there are definite breeding program advantages and cost effectiveness opportunities if best performing families can be identified in a few years versus decades, which may be a more meaningful to landowners seeking increase timber yields.
Perhaps the most compelling value of this study is the value in considering family performance differences to a much later stage of development, if possible. After all, while Rehfeldt (1984) argued that early selections for specific genetic traits (such as height) was a better basis for comparison than a measure of performance (such as growth, which is an integration of multiple traits), forest management decisions are primarily driven by how a family will perform to meet the desired objective(s). Considerations of desired management outcomes are often based on different attributes than just early volume production (e.g., Maynor et al., 2021) because tree responses to environmental uncertainty and influences accrue over time. For instance, Restrepo et al. (2019) applied a meta-analysis of loblolly pine growth and yield drivers across the southeastern US and found that physiographic region had a differential impact on tree diameter, height, stand basal area, and volume, with lower coastal plain stands performing notably better at early ages, but flattening out quicker compared to upper coastal plain plantations. This performance “switch” based on physiographic region suggests similar changes for other attributes related to genetics may be possible. Hence, those looking to maximize long-term woody biomass production or optimize carbon sequestration, particularly those realized only many years later, should base their family-selection decisions on long-term performance rather than idealized controls implemented for different short-term goals. Unlike research studies, managers cannot simply ignore or control for the environmental factors such as ice damage, long-term droughts, or changes to carbon allocation patterns their plantations will likely experience under ordinary circumstances.
Other Outcomes From This Progeny Test
Regardless of family, tree form and quality (including branch attributes and self-pruning) were also important elements of superior pine determination in Grigsby’s work—sawtimber production had long dominated this region of the US South. Additionally, the development of a southern pine-based plywood industry in the early 1960s had also greatly increased demand for clear, straight logs. The emphasis of tree form over sheer wood fiber production may have also influenced the early evaluations of the success/failure of these superior pine progeny tests. After all, the priorities of a landowner interested in supplying a southern pine plywood mill are not the same as one producing fiber for a pulp mill (Van Buijtenen et al., 1971). After nearly 50 years post-planting, it is very apparent throughout this progeny test that bole quality is almost universally superb, with long, straight stems and only infrequent defect (Figure 4). Although bole grading was not attempted for this (or any previous) analysis, it seems almost certain than average quality of this progeny test is substantially greater than would have been expected even in a well-tended natural-origin stand.
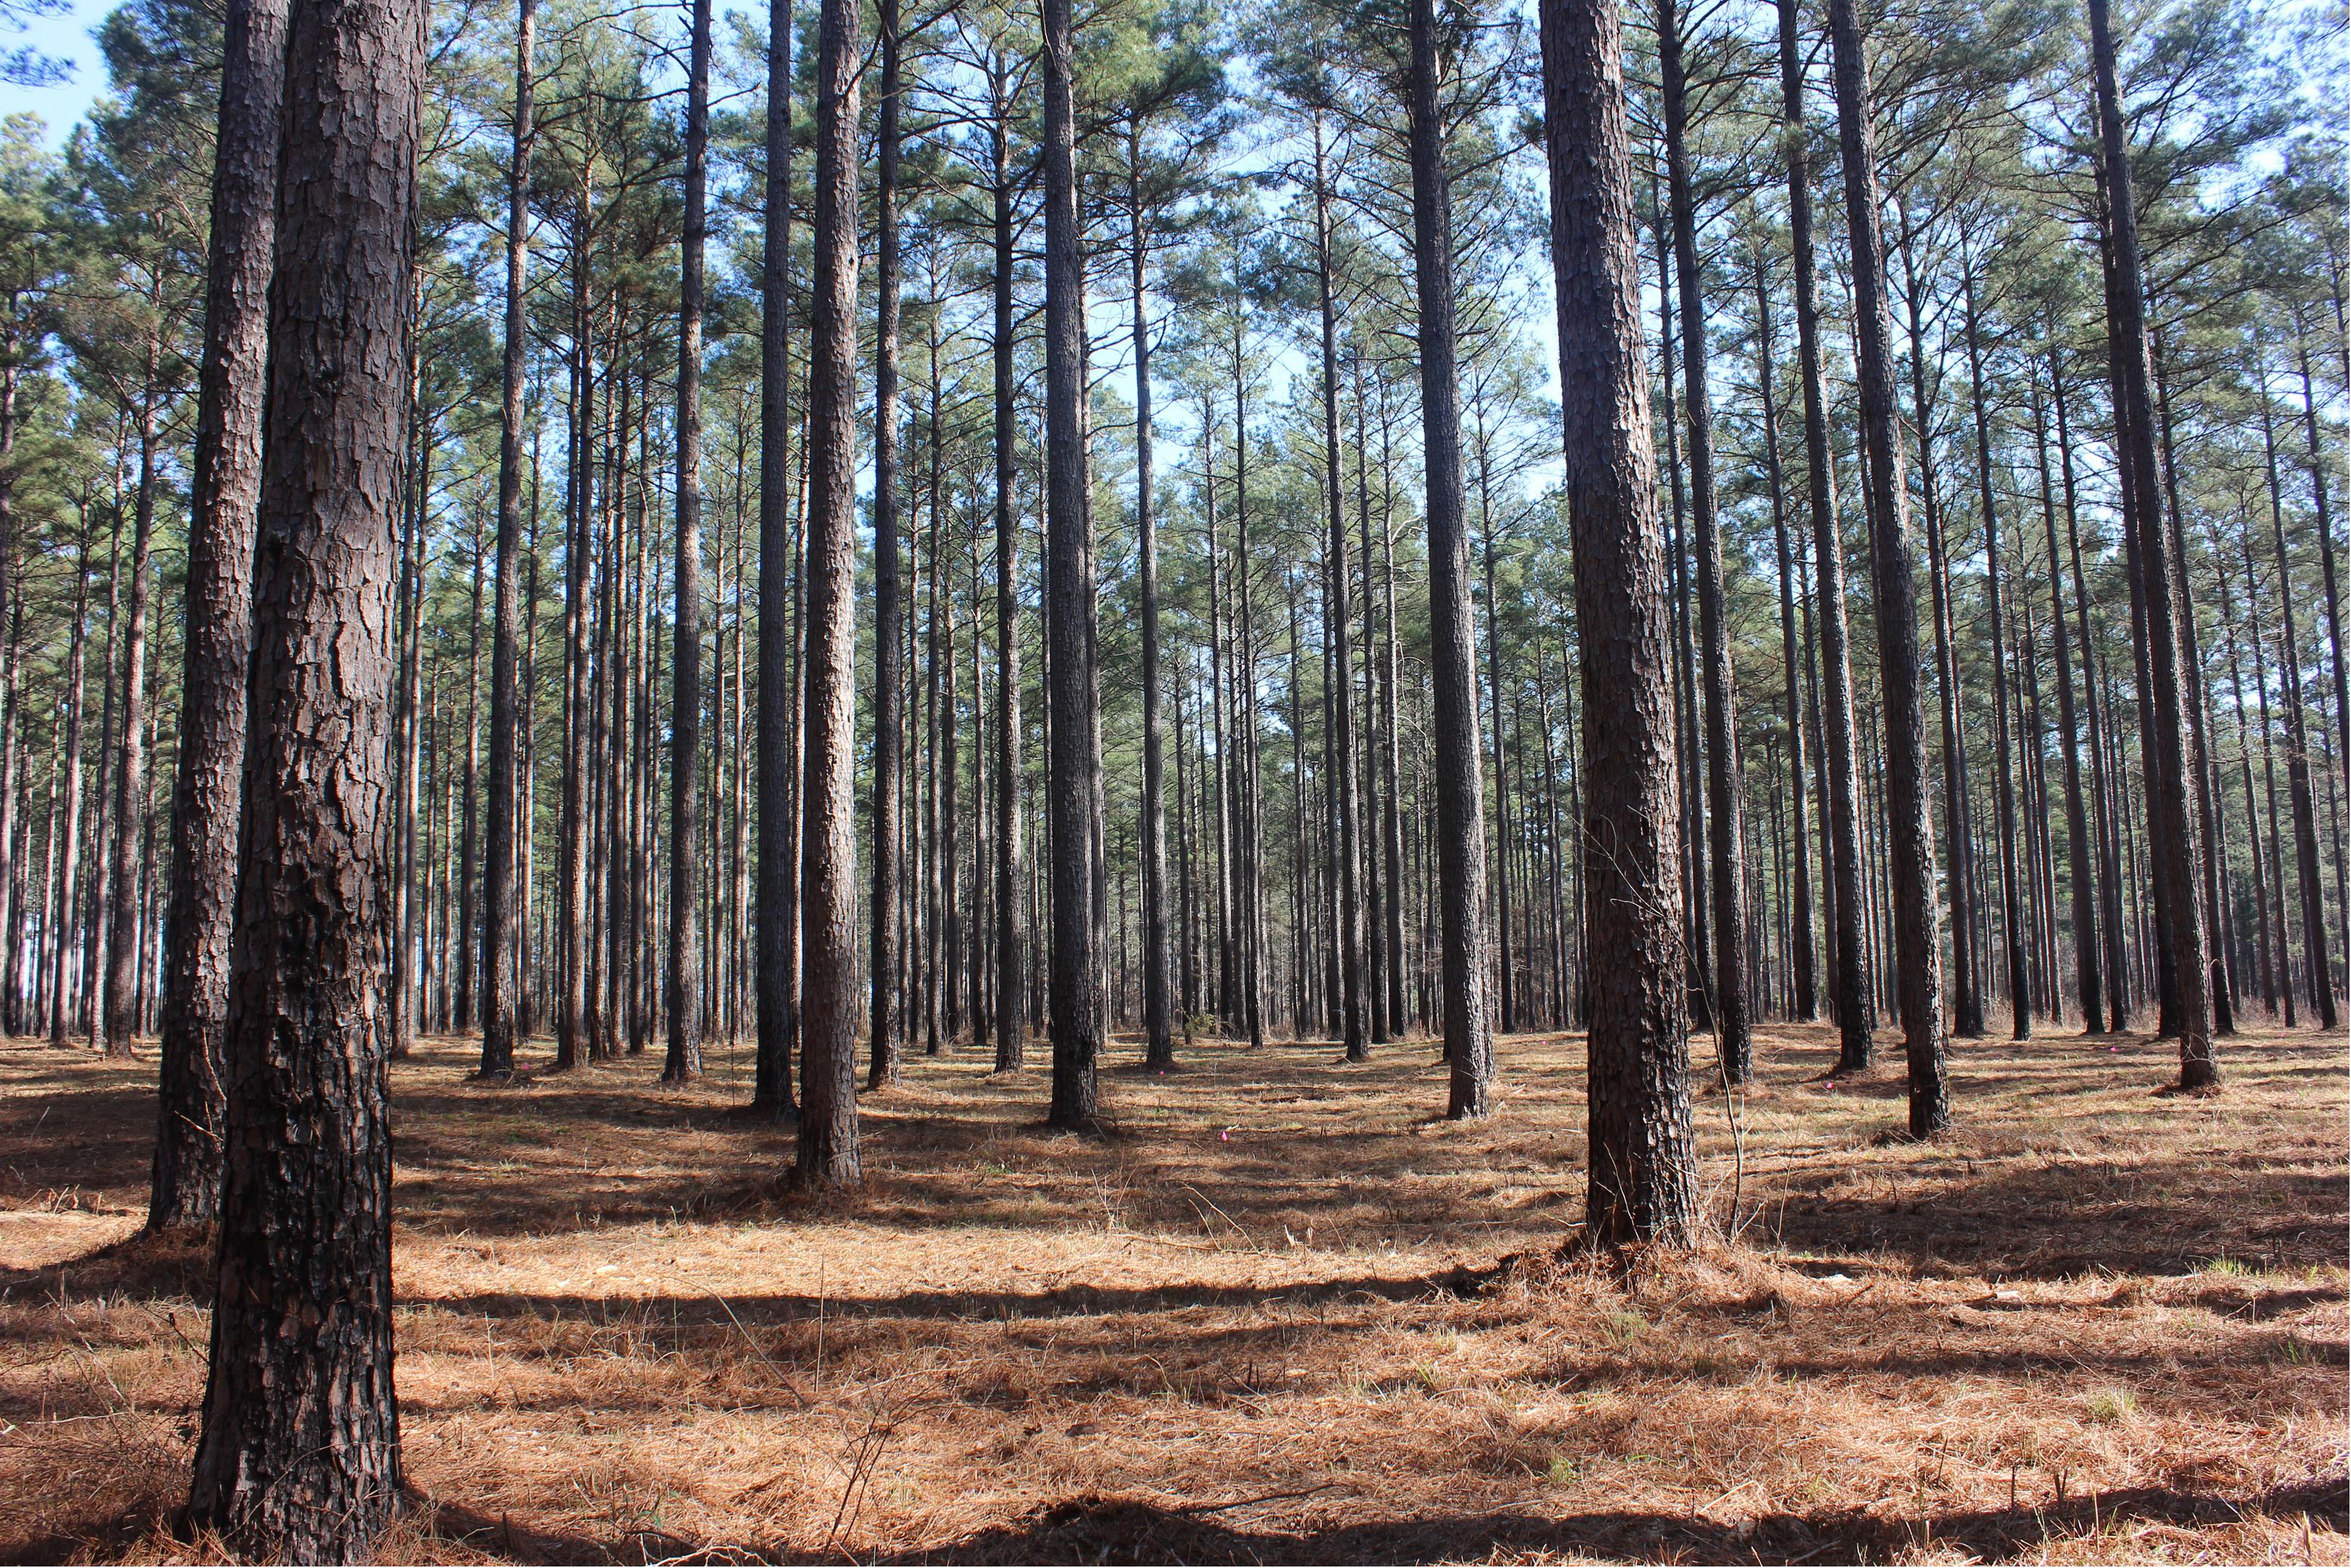
Figure 4. Picture of the 1969 outplanting of the CEF superior pine progeny tests taken in January 2017 showing a typical view of the loblolly as they currently appear.
Perhaps this was a major reason why GP remained interested in this outplanting for years after the temporary closure of the CEF in the 1970s. Although Grigsby’s successor Nance dismissed the early results of these superior pine crosses and had ended the USFS’s role in this set of progeny tests, GP’s tree improvement staff continued to follow these trees into the 1990s. When it became a member of the Western Gulf Forest Tree Improvement Program (WGFTIP) in 1974, GP sent their periodic remeasurements (typically done every 5 years) to the WGFTIP for evaluation. The 1969 CEF progeny test was successful enough during this period to get assigned a test identifier (GP-258), and a number of the GP-sourced superior pine families proved productive enough to be added to the WGFTIP’s catalog of preferred family lines and used to help complete GP’s second generation seed orchard (Texas Forest Service, 1974, 1976, 1977, 1979). Additional work (not presented here) was also done on the general combining ability and specific gravity heritabilities for GP-258 (Texas Forest Service, 1979; Byram and Lowe, 1994).
The results shown in Figures 2, 3 support another conclusion. Local volume equations that do not incorporate differences in tree height (and most do not) are inappropriate for comparing volumes between local families and those chosen from more distant seed sources. Although the families in this CEF progeny test were from nearby locations in southern Arkansas and northern Louisiana, the differences in height in these superior pine offspring are clear when compared to the Crossett woods-run family. Local volume equations based solely on DBH (or height, or some other single variable) may not capture significant differences in allometry and lead to inaccuracies in volumetric predictions that could meaningfully impact predictions (Avery and Burkhart, 1983).
Management Considerations
Implications for Southern Pine Silviculture
While the early performance of either the full- or half-sib families tested against the Crossett woods-run saplings was not initially impressive, a number of families did perform at a statistically higher level over the long run, particularly in terms of height growth. A reevaluation of the potential gains of some of the tested families may be in order, particularly if forest managers desire to retain local loblolly pine genetics rather than importing those of more distant sources or look to avoid simplifying their stands’ genetic composition for the sake of maximizing short-term stand-level yields. After all, using new tools to focus on the “best” selections based on a limited suite of contemporary timber priorities to improve economic gains (e.g., Isik and McKeand, 2019; McKeand et al., 2021) comes with inherent risks of selecting families that may not be well-adapted to future conditions, including a rapidly changing climate, new diseases or insect pests, or even socio-political challenges. Again, the ability of long-term progeny tests to reevaluate family performance under these circumstances over time is a distinct opportunity that should be pursued when possible.
Other research has likewise reported trends that did not appear in loblolly pine progeny tests evaluated early in the rotation. For example, Walker et al. (2020) documented that differences in loblolly pine survivorship and stand density between contrasting provenances (the more productive Atlantic Coastal Plain families and the more drought-tolerant Lost Pines of Texas) did not become apparent until at least 10 and often 20 years after establishment. While Walker et al.’s results did not demonstrate any dramatic changes in performance by individual families, some of these switches may have occurred. Restrepo et al.’s (2019) similar findings for physiographic region further supports reconsideration of some assumptions about the stability of these early predictions. Though the influence of attributes such as bole quality, disease susceptibility, drought tolerance, or even wood specific gravity may support certain planting stock choices, currently early growth performance still dominates decision-making.
Implications for Carbon Management
The results of this long-term progeny test study also have significant implications for carbon-driven management. Forests, particularly those of the southern US, are well-recognized for their ability to sequester atmospheric carbon dioxide (Birdsey and Heath, 1997; Johnsen et al., 2001). The overwhelmingly privately owned southern forests are also appealing for carbon markets because of the general willingness of many of these landowners to actively manage their forests to achieve the additionality required (e.g., Johnsen et al., 2001; Nepal et al., 2012; Clay et al., 2019). However, decisions made to manage loblolly pine for carbon sequestration purposes are not inherently the same as those for more conventional products such as lumber, veneer, or pulpwood, and suggest the role of silvicultural practices or planting stock must be evaluated differently (e.g., Johnsen et al., 2001; Bragg and Guldin, 2010; Aspinwall et al., 2012; Zhao et al., 2016; Clay et al., 2019). For instance, both the additionality and permanence requirements of forest-related carbon offsets can be much longer and more stringent than business-as-usual management (e.g., Ruseva et al., 2017), thus altering motivations and treatment considerations.
As the observations from this extended progeny test suggest, selecting the best family for long-term carbon sequestration purposes may require a different set of considerations. Assuming that any family-based differences in long-term survival or disease resistance are negligible, choosing the fastest growing family (F15) based on early height performance would have resulted in 4–13% less oven-dry biomass per hectare after 48 years when tree specific gravity was 0.5 or less compared to the Crossett woods-run trees (Table 7). Choosing the best performers at ages 25 (F8) and 48 years (H23) greatly narrowed or even reversed that trend. For instance, at the lowest evaluated specific gravity (0.45), H23 produced almost 10% more oven-dry biomass at 48 years than W29, a ratio that increased to over 34% more if H23 had a specific gravity of 0.55 (Table 7). In terms of absolute production differences, H23 could generate from 24 to 86 tons more oven-dry biomass per hectare if the stand had been managed for 350 stems/ha than W29 under this range of specific gravities. Such an increase would not only sequester more carbon over the life of a contract but could generate additional revenue for the landowner without requiring any additional management actions (e.g., fertilization) that could reduce net income or diminish carbon storage benefits.
Further, the measures of success in tree improvement programs optimized for the identification and selection of early growth performance may miss other opportunities to bolster the contributions of loblolly pine plantations established for long-term carbon storage. Certainly, one of the most desirable outcomes of current tree improvement programs—shortening stand rotation lengths—is antithetical to in situ (not product-driven) carbon markets, which seek to add a degree of permanence to the sequestered carbon in living trees (Ruseva et al., 2017). For instance, Johnsen et al. (2001) projected a range of different loblolly pine plantation harvest rotations over a 100-year evaluation period, and predicted contrasting trends based on different considerations—a steady decline in total stemwood carbon gained with increasingly long rotation lengths versus a steady increase in mean standing stemwood carbon over that same range of rotations. This difference arose because Johnsen et al. (2001) included harvested products in their total stemwood carbon gains (although not specified, presumably, Johnson et al. incorporated decay through the application of a “storage factor,” Bates et al., 2017), whereas standing included only the onsite live trees. Other changes to wood composition (particularly in terms of carbon content), specific gravity, e.g., Zobel et al., 1969), and tree allometry over time are also critical to determining the actual quantities of carbon stored and these factors are not inherently featured in current tree improvement programs.
Longer rotations of loblolly pines planted to increase biomass for carbon offsets or credits do come with additional considerations. For instance, Maynor et al. (2021) acknowledged that biomass plantations established for short-term purposes (e.g., pellet production) could utilize higher-risk genotypes to take advantage of higher yields but that sawtimber-size products would favor more conservative genotypes with better stem form. It is logical to extend Maynor et al.’s (2021) reasoning that optimizing biomass production for long-term (50–75 years or longer) periods could be refined to feature families that sequester more carbon (a product of both wood volume and wood density) rather than maximizing early volume production. Short-term observations of key total tree biomass determinants such as bole taper, specific gravity, and non-bole (e.g., branch or foliage) biomass contributions may vary considerably by families and over time (as the tree ages), further distorting the patterns observed in young trees, especially if extrapolated.
Conclusion
This study suggests the value of retaining loblolly pine progeny tests well past that required to select families for early growth performance. The utility of such long-term observations is particularly evident if planted pines are to be retained much longer than conventional silvicultural rotations (currently, between 20 and 30 years in the Upper West Gulf Coastal Plain). While further analysis and a larger data set are required, the change in rank order of the most and least “successful” families after 48 years could mean that certain objectives (such as carbon sequestered under long-term contracts) may be better served by a more measured evaluation of growth performance. After all, the top early performers could prove to be the best option for loblolly pine plantations managed to store carbon 50, 75, or even 100 years into the future. Without further observations of performance in later decades, determining the best options may not be feasible.
There are also other possibilities suggested by this work. The desire to intensify southern pine silviculture to improve volume gain, shorten harvest rotations, improve bole quality, and decrease disease susceptibility has largely driven tree improvement efforts for conventional timber products from loblolly pine, particularly in recent decades (McKeand, 2019; McKeand et al., 2021). This interest, coupled with economic incentives to control competition, manage planting density, and ameliorate site deficiencies to shorten rotation lengths have been the focus of much of this work to date, and have been highly successful in supporting the forest products industry in the southern US (McKeand et al., 2021). More recently, the benefits of loblolly pine tree improvement programs for supporting alternative management priorities, such as bolstering the southern US contribution toward carbon sequestration and increasing forest resilience to climate change, have received growing attention (e.g., Aspinwall et al., 2012; Matallana-Ramirez et al., 2021; Maynor et al., 2021). Long-running progeny tests of loblolly pine offer promise for addressing not only these more conventional concerns, but new questions regarding other ecosystem goods and services or the response of known families to a changing environment.
Data Availability Statement
The raw data supporting the conclusions of this article will be made available by the authors, without undue reservation.
Author Contributions
DB reviewed the historical data, participated in and supervised the field data collection in 2017, reanalyzed parts of these data, and wrote the manuscript.
Funding
Most of this work was funded by the USFS; additional support over the years (especially in the original study establishment and maintenance into the early 1970s) was provided by Georgia-Pacific.
Conflict of Interest
The author declares that the research was conducted in the absence of any commercial or financial relationships that could be construed as a potential conflict of interest.
Publisher’s Note
All claims expressed in this article are solely those of the authors and do not necessarily represent those of their affiliated organizations, or those of the publisher, the editors and the reviewers. Any product that may be evaluated in this article, or claim that may be made by its manufacturer, is not guaranteed or endorsed by the publisher.
Acknowledgments
I would like to thank the following for their contributions to this effort: Hoy Grigsby, Warren Nance, Russ Reynolds, and other CEF staff (now all retired and deceased USFS employees) for their work in establishing, maintaining, and originally measuring the 1969 superior pine outplanting. More recently, Kirby Sneed, Rick Stagg, and Dr. Jim Guldin (all of the USFS); Jess Riddle (now with Georgia ForestWatch); and Dr. John Dennis (now of Nicholls State University) help to relocate and remeasure these trees. Nancy Koerth and Gina Franke (both of the USFS), Dr. Matt Olson (now of Stockton University), and Dr. Joshua Adams (Louisiana Tech) also aided in the development of this manuscript. Conner Fristoe and Weyerhaeuser graciously provided copies of their data on this progeny test. This manuscript was written and prepared by a U.S. Government employee on official time, and therefore it is in the public domain and not subject to copyright. The findings and conclusions in this publication are those of the author(s) and should not be construed to represent an official USDA, Forest Service, or U.S. Government determination or policy. Original (pre-2017) information on CEF progeny tests gathered and analyzed by a number of persons, including Hoy Grigsby and Warren Nance.
Supplementary Material
The Supplementary Material for this article can be found online at: https://www.frontiersin.org/articles/10.3389/ffgc.2021.716443/full#supplementary-material
Footnotes
- ^ Note that this test was replicated on nearby private lands; these tests no longer exist and are not part of this analysis.
- ^ Five-year survivorship was virtually unchanged for all families (Nance, 1978) and, hence, will not be further reported.
References
Allen, H. L., Fox, T. R., and Campbell, R. G. (2005). What is ahead for intensive pine plantation silviculture in the South? Souther. J. Appl. Forest. 29, 62–69. doi: 10.1093/sjaf/29.2.62
Apiolaza, L. A. (2008). Improvement objectives for short rotation forestry. N. Z. J. Forestry 52, 26–28.
Aspinwall, M. J., McKeand, S. E., and King, J. S. (2012). Carbon sequestration from 40 years of planting genetically improved loblolly pine across the southeast United States. For. Sci. 58, 446–456. doi: 10.5849/forsci.11-058
Avery, T. E., and Burkhart, H. E. (1983). Forest measurements, 3rd Edn. New York, NY: McGraw-Hill Book Co, 331.
Bates, L., Jones, B., Marland, E., Marland, G., Ruseva, T., Kowalczyk, T., et al. (2017). Accounting for harvested wood products in a forest offset program: lessons from California. J. For. Econom. 27, 50–59. doi: 10.1016/j.jfe.2017.02.004
Belaber, E. C., Gauchat, M. E., Reis, H. D., Borralho, N. M., and Cappa, E. P. (2018). Genetic parameters for growth, stem straightness, and branch quality for Pinus elliottii var. elliottii x Pinus caribaea var. hondurensis F1 hybrid in Argentina. For. Sci. 64, 595–608.
Birdsey, R. A., and Heath, L. S. (1997). “The forest carbon budget of the United States,” in USDA Forest Service Global Change Research program highlights: 1991–1995. USDA Forest Service General Technical Report NE-237, eds R. Birdsey, R. Mickler, D. Sandberg, R. Tinus, J. Zerbe, and K. O’Brian (Washington, D.C.: USDA), 81–85.
Borders, B. E., and Bailey, R. L. (2001). Loblolly pine—pushing the limits of growth. Southe. J. Appl. For. 25, 69–74. doi: 10.1093/sjaf/25.2.69
Bragg, D. C. (2018). “Superior pines revisited: a plus-tree progeny test on the Crossett Experimental Forest at a half-century,” in Proceedings of the 19th Biennial Southern Silvicultural Research Conference. USDA Forest Service e-General Technical Report SRS-234, ed. J. E. Kirschman (Washington, D.C: USDA), 158–166.
Bragg, D. C., and Guldin, J. M. (2010). “Estimating long-term carbon sequestration patterns in even- and uneven-aged southern pine stands,” in Integrated management of carbon sequestration and biomass utilization opportunities in a changing climate: Proceedings of the 2009 National Silviculture Workshop. USDA Forest Service Proceedings RMRS-P-61, eds T. B. Jain, R. T. Graham, and J. Sandquist (Washington, D.C: USDA), 111–123.
Bragg, D. C., Frelich, L. E., Leverett, R. T., Blozan, W., and Luthringer, D. J. (2011). “The sine method: an alternative height measurement technique,” in USDA Forest Service Research Note SRS-22, (Washington, D.C: USDA), 11.
Bragg, D. C., Riddle, J., Adams, J., and Guldin, J. M. (2016). “The Crossett Experimental Forest’s contributions to southern pine improvement programs,” in Proceedings of the 33rd Southern Forest Tree Improvement Conference. Southern Forest Tree Improvement Committee, ed. J. P. Adams (Oklahoma City: Southern Forest Tree Improvement Committee), 40–50. doi: 10.1093/sjaf/25.1.40
Bridgwater, F. E., and McKeand, S. E. (1997). Early family evaluation for growth of loblolly pine. For. Genet. 4, 51–58.
Buford, M. A. (1989). Mean stem size and total volume development of various loblolly pine seed sources planted at one location. Canad. J. For. Res. 19, 396–400. doi: 10.1139/x89-062
Byram, T. D., and Lowe, W. J. (1994). 42nd Progress Report of the Cooperative Forest Tree Improvement Program. Circular 294. College Station, TX: Forest Genetics Laboratory, 27.
Carey, E. V., Sala, A., Keane, R., and Callaway, R. M. (2001). Are old forests underestimated as global carbon sinks? Glob. Change Biol. 7, 339–344. doi: 10.1046/j.1365-2486.2001.00418.x
Clay, L., Motallebi, M., and Song, B. (2019). An analysis of common forest management practices for carbon sequestration in South Carolina. Forests 10, 1–15.
Dipesh, K. C., Will, R. E., Hennessey, T. C., Lynch, T. B., Heinemann, R. A., Holeman, R. T., et al. (2015). Effects of simulated ice storm damage on midrotation loblolly pine stands. For. Sci. 61, 774–779. doi: 10.5849/forsci.14-060
Dorman, K. W. (1976). The genetics and breeding of southern pines. USDA Forest Service Agricultural Handbook 47. Washington, DC: Government Printing Office, 407.
Farjat, A. E., Chamblee, A. K., Isik, F., Whetten, R. W., and McKeand, S. E. (2017). Variation among loblolly pine seed sources across diverse environments in the Southeastern United States. For. Sci. 63, 39–48. doi: 10.5849/forsci.15-107
Ford, G. A. (2017). Variation and stability of inter- and intra-provenance crosses of eastern and western loblolly pine in a wide-testing regime. Ph.D. thesis. Raleigh, NC: North Carolina State University, 164.
Gill, H. V., Avery, D. C., Larance, F. C., and Fultz, C. L. (1979). Soil survey of Ashley County, Arkansas. Washington, DC: USDA Soil Conservation Service and USDA Forest Service, 92.
Grigsby, H. C. (1969). Establishment and progress report, plus tree selection, breeding, and progeny testing (supplemented and updated in 1968 and 1969). Washington, D.C: USDA.
Grigsby, H. C. (1973). “South Carolina best of 36 loblolly pine seed sources for southern Arkansas,” in USDA Forest Service Research Paper SO-89, (Washington, D.C: USDA), 10. doi: 10.1093/sjaf/15.1.10
Grigsby, H. C. (1975a). “Growth of loblolly pine from variously selected parents,” in USDA Forest Service Research Note SO-187, (Washington, D.C: USDA), 3.
Grigsby, H. C. (1975b). “Six-state test of Arkansas loblolly pine,” in USDA Forest Service Research Note SO-190, (Washington, D.C: USDA), 5.
Grigsby, H. C. (1977). “A 16-year provenance test of loblolly pine in southern Arkansas,” in Proceedings of the 14th Southern Forest Tree Improvement Conference. Special Publication No. 36, (Gainesville, FL: Southern Forest Tree Improvement Committee), 261–268.
Gupta, P. K., and Durzan, D. J. (1987). Biotechnology of somatic polyembryogenesis and plantlet regeneration in loblolly pine. Nat. Biotechnol. 5, 147–151. doi: 10.1038/nbt0287-147
Isik, F. (2014). Genomic selection in forest tree breeding: the concept and an outlook to the future. N. For. 45, 379–401. doi: 10.1007/s11056-014-9422-z
Isik, F., and McKeand, S. E. (2019). Fourth cycle breeding and testing strategy for Pinus taeda in the NC State University Cooperative Tree Improvement Program. Tree Genet. Genomes 15, 1–12.
Johnsen, K. H., Wear, D., Oren, R., Teskey, R. O., Sanchez, F., Will, R., et al. (2001). Meeting global policy commitments: carbon sequestration and southern pine forests. J. For. 99, 14–21.
Koch, P. (1972). “Utilization of the southern pines,” in USDA Forest Service Agricultural Handbook 420, (Washington, D.C: USDA), 734.
Lauer, E., Sims, A., McKeand, S., and Isik, F. (2021). Genetic parameters and genotype-by-environment interactions in regional progeny tests of Pinus taeda L. in the southern USA. For. Sci. 67, 60–71. doi: 10.1093/forsci/fxaa035
Leverett, R. T., Masino, S. A., and Moomaw, W. R. (2021). Older eastern white pine trees and stands accumulate carbon for many decades and maximize cumulative carbon. Front. For. Glob. Change 4:620450. doi: 10.3389/ffgc.2021.620450
Love, H. (1996). G-P Fordyce: First southern pine plywood plant. Monograph 20. Tacoma, WA: Plywood Pioneers Association, 8.
Lowe, W. J., and van Buijtenen, J. P. (1989). The incorporation of early testing procedures into an operational tree improvement program. Silvae Genet. 38, 243–250.
Luyssaert, S., Schulze, E.-D., Börner, A., Knohl, A., Hessenmöller, D., Law, B. E., et al. (2008). Old-growth forests as global carbon sinks. Nature 455, 213–215. doi: 10.1038/nature07276
Martin, T. A., Johnsen, K. H., and White, T. L. (2001). Ideotype development in southern pines: rationale and strategies for overcoming scale-related obstacles. For. Sci. 47, 21–28.
Matallana-Ramirez, L. P., Whetten, R. W., Sanchez, G. M., and Payn, K. G. (2021). Breeding for climate change resilience: a case study of loblolly pine (Pinus taeda L.) in North America. Front. Plant Sci. 12:606908. doi: 10.3389/fpls.2021.606908
Maynor, J. A., Isik, F., Walker, T. D., Whetten, R. W., Heine, A. J., Payn, K. G., et al. (2021). Provenance and family variation in biomass potential of loblolly pine in the Piedmont of North Carolina. For. Sci. 67, 312–320. doi: 10.1093/forsci/fxaa056
McGrath, D. A., Evans, J. P., Smith, C. K., Haskell, D. G., Pelkey, N. W., Gottfried, R. R., et al. (2004). Mapping land-use change and monitoring the impacts of hardwood-to-pine conversion on the southern Cumberland Plateau in Tennessee. Earth Interact. 8:9.
McKeand, S. E. (1988). Optimum age for family selection for growth in genetic tests of loblolly pine. For. Sci. 34, 400–411.
McKeand, S. E. (2019). The evolution of a seedling market for genetically improved loblolly pine in the southern United States. J. For. 117, 293–301. doi: 10.1093/jofore/fvz006
McKeand, S. E., Payn, K. G., Heine, A. J., and Abt, R. C. (2021). Economic significance of continued improvement of loblolly pine genetics and its efficient deployment to landowners in the southern United States. J. For. 119, 62–72. doi: 10.1093/jofore/fvaa044
McKeand, S., Mullen, T., Byram, T., and White, T. (2003). Deployment of genetically improved loblolly and slash pines in the South. J. For. 101, 32–37.
Nance, W. L. (1978). Final report, plus tree selection, breeding and progeny testing. Closing report, FS-SO-1401-11.39. Washington, D.C: USDA, 36.
Nepal, P., Grala, R. K., and Grebner, D. L. (2012). Financial feasibility of increasing carbon sequest-ration in harvested wood products in Mississippi. For. Policy Econom. 14, 99–106. doi: 10.1016/j.forpol.2011.08.005
Pile, L. S., Maier, C. A., Wang, G. G., Yu, D., and Shearman, T. M. (2016). Response of two genetically superior loblolly pine clonal ideotypes to a severe ice storm. For. Ecol. Manage. 360, 213–220. doi: 10.1016/j.foreco.2015.10.044
Raley, E. M., Gwaze, D. P., and Byram, T. D. (2003). “An evaluation of height as an early selection criterion for volume and predictor of site index gain in the Western Gulf,” in Proceedings of the 27th Southern Forest Tree Improvement Conference, ed. C. R. McKinley (Washington, D.C: USDA), 45–55.
Randolph, K. C., Cowling, E. B., and Starkey, D. A. (2015). Long-term changes in fusiform rust incidence in the Southeastern United States. J. For. 113, 381–392. doi: 10.5849/jof.14-138
Rehfeldt, J. (1984). Veracity of short-term testing. Pages 118-148 in Progeny Testing: Proceedings of servicewide genetics workshop, Charleston, SC, December 5-9, 1983. Washington, D.C: USDA.
Resende, M. F. R., Muñoz, P., Resende, M. D. V., Garrick, D. J., Fernando, R. L., Davis, J. M., et al. (2012). Accuracy of genomic selection methods in a standard data set of loblolly pine (Pinus taeda L.). Genetics 190, 1503–1510. doi: 10.1534/genetics.111.137026
Restrepo, H. I., Bullock, B. P., and Montes, C. R. (2019). Growth and yield drivers of loblolly pine in the southeastern U.S.: a meta-analysis. For. Ecol. Manage. 435, 205–218. doi: 10.1016/j.foreco.2018.12.007
Rink, G., and Wells, O. O. (1988). Productivity comparison of 37-year-old loblolly-shortleaf pine seed sources in southern Illinois. Norther. J. Appl. For. 5, 155–158. doi: 10.1093/njaf/5.2.155
Ruseva, T., Marland, E., Szymanski, C., Hoyle, J., Marland, G., and Kowalczyk, T. (2017). Additionality and permanence standards in California’s Forest Offset Protocol: a review of project and program level implications. J. Environ. Manage. 198, 277–288. doi: 10.1016/j.jenvman.2017.04.082
Santos, T. S., Martins, K., Aguiar, A. V., Baptista Filho, M. J., Menucelli, J. R., Faria, R. F. P., et al. (2021). Growth and wood quality traits in a Dipteryx alata Vog. (Fabaceae) progeny and provenance test. For. Sci. [Preprint]. doi: 10.1093/forsci/fxab010
Saucier, J. R., and Taras, M. A. (1969). Regional variation in specific gravity of seven pines in the southern United States. Washington, D.C: USDA, 16.
Schimleck, L., Antony, F., Dahlen, J., and Moore, J. (2018). Wood and fiber quality of plantation-grown conifers: a summary of research with an emphasis on loblolly and radiata pine. Forests 9, 1–16.
Schmidtling, R. C. (1987). “A seed source and progeny test of select East Coast loblolly pines in Arkansas and Mississippi,” in Proceedings of the 19th Southern Forest Tree Improvement Conference, Washington, DC: USDA, 329–336.
Schmidtling, R. C., and Froehlich, R. C. (1993). Thirty-seven year performance of loblolly pine seed sources in eastern Maryland. For. Sci. 39, 706–721.
Shalizi, M. N., Gezan, S. A., McKeand, S. E., Sherrill, J. R., Cumbie, W. P., Whetten, R. W., et al. (2020). Correspondence between breeding values of the same Pinus taeda L. genotypes from clonal trials and half-sib seedling progeny trials. For. Sci. 66, 600–611. doi: 10.1093/forsci/fxaa016
Sillett, S. C., Van Pelt, R., Carroll, A. L., Campbell-Spickler, J., Coonen, E. J., and Iberle, B. (2019). Allometric equations for Sequoia sempervirens in forests of different ages. For. Ecol. Manage. 433, 349–363. doi: 10.1016/j.foreco.2018.11.016
Sluder, E. R. (1984). “A look at short-term progeny tests,” in Progeny Testing: Proceedings of Servicewide Genetics Workshop, Charleston, SC, December 5–9, 1983, Washington, DC: USDA Forest Service, 149–171.
Stephenson, N. L., Das, A. J., Condit, R., Russo, S. E., Baker, P. J., Beckman, N. G., et al. (2014). Rate of tree carbon accumulation increases continuously with tree size. Nature 507, 90–93.
Talbert, C. B., and Strub, M. R. (1987). “Dynamics of stand growth and yield over 29 years in a loblolly pine source trial in Arkansas,” in Proceedings of the 19th Southern Forest Tree Improvement Conference, (Washington, D.C: USDA), 30–38.
Tauer, C. G., and Loo-Dinkins, J. A. (1990). Seed source variation in specific gravity of loblolly pine grown in a common environment in Arkansas. For. Sci. 36, 1133–1145.
Texas Forest Service (1974). 22nd Progress Report of Cooperative Forest Tree Improvement Program. Circular 221. College Station, TX: Forest Genetics Laboratory, 24.
Texas Forest Service (1976). 24th Progress Report of Cooperative Forest Tree Improvement Program. Circular 229. College Station, TX: Forest Genetics Laboratory, 20.
Texas Forest Service. (1977). 25th Progress Report of Cooperative Forest Tree Improvement Program. Circular 231. College Station, TX: Forest Genetics Laboratory, 19.
Texas Forest Service (1979). 27th Progress Report of Cooperative Forest Tree Improvement Program. Circular 247. College Station, TX: Forest Genetics Laboratory, 21.
Van Buijtenen, J. P., Donovan, G. A., Long, E. M., Robinson, J. F., and Woessner, R. A. (1971). Introduction to practical forest tree improvement. Circular 207. College Station, TX: Forest Genetics Laboratory, 17.
Van Deusen, P. C., Sullivan, A. D., and Matney, T. G. (1981). A prediction system for cubic foot volume of loblolly pine applicable through much of its range. Southe. J. Appl. For. 5, 186–189. doi: 10.1093/sjaf/5.4.186
Wahlgren, H. E., and Schumann, D. R. (1975). “Properties of major southern pines: Part I—wood density survey,” in USDA Forest Service Research Paper FPL-176, (Washington, D.C: USDA), 57.
Wakeley, P. C., and Bercaw, T. E. (1965). Loblolly pine provenance test at age 35. J. For. 63, 168–174.
Walker, T. D., and McKeand, S. E. (2018). Fusiform rust hazard mapping for loblolly pine in the southeastern United States using progeny test data. J. For. 116, 117–122.
Walker, T. D., Bullock, B. P., Smith, B. C., and McKeand, S. E. (2020). Modelling self-thinning patterns in loblolly pine with provenance and family effects. For. Sci. 66, 712–725. doi: 10.1093/forsci/fxaa030
Wear, D. N., and Greis, J. G. (eds) (2002). “Southern Forest Resource Assessment,” in USDA Forest Service General Technical Report SRS-53, (Washington, D.C: USDA), 635.
Wear, D. N., and Greis, J. G. (eds) (2013). “The Southern Forest Futures Project: technical report,” in USDA Forest Service General Technical Report SRS-178, (Washington, D.C: USDA), 542.
Wells, O. O. (1983). Southwide Pine Seed Source Study—loblolly pine at 25 years. Souther. J. Appl. For. 7, 63–71. doi: 10.1093/sjaf/7.2.63
Wells, O. O., and Rink, G. (1984). “Planting loblolly pine north and west of its natural ranges,” in Proceedings of the third biennial southern silvicultural research conference. Gen. Tech. Rep. SO-54, ed. E. Shoulders (New Orleans, LA: U.S. Department of Agriculture), 261–265.
Wells, O. O., and Wakeley, P. C. (1966). Geographic variation in survival, growth, and fusiform-rust infection of planted loblolly pine. For. Sci. Monogr. 11:40.
Wheeler, N. C., Steiner, K. C., Schlarbaum, S. E., and Neale, D. B. (2015). The evolution of forest genetics and tree improvement research in the United States. J. For. 113, 500–510. doi: 10.5849/jof.14-120
White, T., Davis, J., Gezan, S., Hulcr, J., Jokela, E., Kirst, M., et al. (2014). Breeding for value in a changing world: past achievements and future prospects. N. For. 45, 301–309. doi: 10.1007/s11056-013-9400-x
Wiley, S., and Zeide, B. (1991). “Investigation of growth 14 years after glaze damage in a loblolly pine plantation,” in Proceedings of the Sixth Biennial Southern Silvicultural Research Conference, Vol. 1, eds S. S. Coleman and D. G. Neary (Washington, D.C: USDA), 272–281.
Xiong, J. S., Isik, F., McKeand, S. E., and Whetten, R. W. (2010). Genetic variation of stem forking in loblolly pine. For. Sci. 56, 429–436.
Zar, J. H. (2010). Biostatistical analysis, 5th Edn. Upper Saddle River, NJ: Pearson Prentice Hall, 944.
Zhao, D., Kane, M., Teskey, R., Fox, T. R., Albaugh, T. J., Allen, H. L., et al. (2016). Maximum response of loblolly pine plantations to silvicultural management in the southern United States. For. Ecol. Manage. 375, 105–111. doi: 10.1016/j.foreco.2016.05.035
Zimin, A., Stevens, K. A., Crepeau, M. W., Holtz-Morris, A., Koriabine, M., Marçais, G., et al. (2014). Sequencing and assembly of the 22-Gb loblolly pine genome. Genetics 196, 875–890. doi: 10.1534/genetics.113.159715
Keywords: Crossett Experimental Forest, tree improvement, plantation, silviculture, biomass, carbon sequestration
Citation: Bragg DC (2021) A Reevaluation of Superior Tree Performance After 48 Years for a Loblolly Pine Progeny Test in Southern Arkansas. Front. For. Glob. Change 4:716443. doi: 10.3389/ffgc.2021.716443
Received: 28 May 2021; Accepted: 19 July 2021;
Published: 26 August 2021.
Edited by:
Thomas J. Dean, Louisiana State University, United StatesReviewed by:
Roque Rodríguez-Soalleiro, University of Santiago de Compostela, SpainQuang Cao, Louisiana State University, United States
At least a portion of this work is authored by Don C. Bragg on behalf of the U.S. Government and, as regards Dr. Bragg and the U.S. Government, is not subject to copyright protection in the United States. Foreign and other copyrights may apply. This is an open-access article distributed under the terms of the Creative Commons Attribution License (CC BY). The use, distribution or reproduction in other forums is permitted, provided the original author(s) and the copyright owner(s) are credited and that the original publication in this journal is cited, in accordance with accepted academic practice. No use, distribution or reproduction is permitted which does not comply with these terms.
*Correspondence: Don C. Bragg, Don.C.Bragg@usda.gov